 Somaye Vaissi1*
 Sahar Rezaei2
- 1Department of Biology, Faculty of Science, Razi University, Kermanshah, Iran
- 2Department of Environmental Science, Faculty of Natural Resources, University of Guilan, Rasht, Iran
The role of ecological niche divergence in lineage speciation has recently stimulated the interest of evolutionary biologists and ecologists. Phylogenetic analysis has revealed that the Hyrcanian wood frog, Rana pseudodalmatina, has diverged into two western and eastern regional clades (WRC and ERC) within the Hyrcanian forest. The goal of this study was to investigate whether the ecological niches of WRC and ERC are conserved or diverged, as well as to figure out what variables promote niche conservatism or divergence. For this purpose, the maximum entropy model was employed to assess environmental niche modeling in geographical (G) space utilizing climatic and macro-environmental data. The niche overlap, equivalency, and similarity tests based on PCAenv analyses were used to assess niche divergence or conservatism in environmental (E) space. The findings strongly support the hypothesis that WRC and ERC have undergone substantial niche divergence and are constrained by a unique set of climatic and macro-environmental conditions. This study by ecological niche comparisons based on phylogenetic data provides new insights into the exploration of species diversification processes in the Hyrcanian forests.
Introduction
In recent decades, ecological factors have received increasing attention as a driver of lineage diversification and speciation (e.g., Wiens et al., 2010; Peterson, 2011; Broennimann et al., 2012; Zink, 2014; Hu et al., 2016; Fei et al., 2017; Wang et al., 2017; Gutiérrez-Ortega et al., 2020; Wei et al., 2020; Benício et al., 2021; Engler et al., 2021; Yin et al., 2021). In this debate, one of the main questions is whether newly developed species or clades exhibit signs of niche conservatism or divergence (Kozak and Wiens, 2006; Peterson, 2011; Wang et al., 2017; Zhu et al., 2020; Grossman, 2021; Meirmans, 2021; Van Dijk et al., 2021). Niche conservatism refers to a species’ or clades’ tendency to keep ancestral ecological niche characteristics over time (Wiens, 2004; Wiens and Graham, 2005; Warren et al., 2008; Wiens et al., 2010). Conversely, the process of niche divergence occurs when a species occupies a niche that is distinct from its original one (Cuervo et al., 2021). Therefore, related species or clades are more divergent within their niche space than by chance (Hua and Wiens, 2010). Nevertheless, despite the fact that recent studies have presented ecological niche metrics clearly and statistically (e.g., Broennimann et al., 2012; Brown and Carnaval, 2019; Warren et al., 2021), the relative significance of niche conservatism vs. niche divergence in driving lineage evolution in many species that pass through diverse environments and putative geographical boundaries remains poorly understood (Wiens and Graham, 2005; Alexander Pyron and Burbrink, 2009; Peterson, 2011; Hu et al., 2015).
The evidence supporting niche divergence or conservatism appears to be conflicting at first glance (Hu et al., 2015). However, there is a considerable structure when the patterns are time-structured. The temporal frames of the study systems and niche tests (i.e. niche similarity vs niche equivalency tests) influence results of niche conservatism or divergence (Peterson, 2011; Broennimann et al., 2012). The equivalency tests are more important to determine whether niche models are transferable across time and space, whereas niche similarity tests are more appropriate to test evolutionary and biogeographic assumptions (Peterson, 2011). Niches generally tend to conserve over time in terms of distribution patterns and speciation, whereas niche divergence considers being the driving force behind species diversity along ecological gradients (Graham et al., 2004; Raxworthy et al., 2007). Short-term and recent events, such as distributional shifts over short periods or species invasions, demonstrate significant tendencies toward conservatism. Longer-term events, such as phylogenetic differentiation, however, demonstrate a tendency for conservatism to break down (Wiens and Graham, 2005; Peterson, 2011). According to evidence for niche divergence, divergent natural selection promotes diversity by allowing individuals to adapt to new environments (Schluter, 2009).
The Hyrcanian wood (or brown) frogs, Rana pseudodalmatina (Anura, Ranidae), have been recorded from southeastern Azerbaijan to the Golestan National Park in northeastern Iran (Najibzadeh et al., 2018; Kidov and Litvinchuk, 2021). This study focuses on Iranian frog populations in the Hyrcanian (or Caspian, temperate) forests at altitudes ranging from −22 to 2850 meters above sea level along the northern slopes of the Alborz Mountains and the southern edge of the Caspian Sea. Based on two partial mitochondrial markers (cytochrome b and 16S rRNA), Najibzadeh et al. (2018) clearly showed the existence of two clades in the west and east of the Hyrcanian forest for this species (Najibzadeh et al., 2018). In another study using similar markers, Amiri et al. (2021) demonstrated that there existed two regional patterns within the species distribution range in the west and east, which diverged in the Pleistocene (1.6 Mya) (Amiri et al., 2021). Using species distribution modeling (SDMs hereafter), this study proposed the hypothesis of “refugia-within-refugia” in this area (Amiri et al., 2021). Based on biogeographic analyses, they suggested that dispersal and vicariance (rise of Caspian Sea water levels) processes may have influenced this species’ genetic structure (Amiri et al., 2021).
The recent study employed environmental niche models (ENMs hereafter), which combine GIS layers with species occurrence data to answer basic questions about niche evolution, speciation, and ecological diversification within clades (e.g., Kozak and Wiens, 2006; McCormack et al., 2010; Peterson, 2011; Broennimann et al., 2012; Zink, 2014; Gutiérrez-Ortega et al., 2020; Rodríguez-Rodríguez et al., 2020; Wei et al., 2020; Ahmadi et al., 2021; Cordobés et al., 2021; Purcell and Stigall, 2021). ENMs based on niche theories allow for the quantification of niches at unprecedented temporal and spatial scales (Pearman et al., 2008). ENMs may also be used to solve a wide range of evolutionary and ecological issues, including identifying niche similarities across species or clades and projecting taxonomic niches in response to changing environmental conditions (Soberón, 2007; Kozak et al., 2008; Guisan et al., 2014).
For this purpose, the goal of this study was to investigate whether the R. pseudodalmatina clades occupied the equivalent or similar niche, and if not, what role niche divergence or conservatism had in their evolution. Specifically, we used a maximum entropy approach (MaxEnt) to create ENMs for each clade based on large-scale environmental factors and occurrence data. Following that, using environmental and occurrence data, we investigated whether these two clades occupy more similar environments than estimated based on background (Hyrcanian regions) environmental differentiation using niche overlap, niche equivalency, and niche similarity tests based on principal component analysis (PCAenv). The results of these studies, when combined with the phylogeographic relationships (Najibzadeh et al., 2018, 2021; Amiri et al., 2021), give a comprehensive and multidimensional perspective of niche variation and differentiation in the Hyrcanian wood frog.
Materials and Methods
Study Area and Occurrence Records
Occurrence records (N = 83) of the Hyrcanian wood frog, R. pseudodalmatina, provided across their distribution range within the Iranian Hyrcanian forests by different sources: (1) Najibzadeh et al. (2018), Amiri et al. (2021), Kidov and Litvinchuk (2021), Najibzadeh et al. (2021); and the Global Biodiversity Information Facility (GBIF1) (Supplementary Table 1). We excluded the Azerbaijan data from our analysis due to a lack of genetic information to assess its occurrence in a particular clade in this distribution region. Therefore, we classified occurrences into two western and eastern regional clades (WRC and ERC hereafter) based on the previous phylogenetic analyses (Figure 1; Najibzadeh et al., 2018, 2021; Amiri et al., 2021). We evaluated all occurrences equally, regardless of population size, and double-checked them using spreadsheets and GIS to search for duplication and possible georeferencing errors. In parallel, we checked occurrences spatially at a spatial resolution of 30 arc-seconds to ensure that only one record per grid cell remained for each clade. The final dataset included 71 georeferenced occurrences, with 33 for WRC and 38 for ERC (Figure 1 and Supplementary Table 1). Supplementary Table 1 lists the geographical coordinates and the sources of the occurrences.
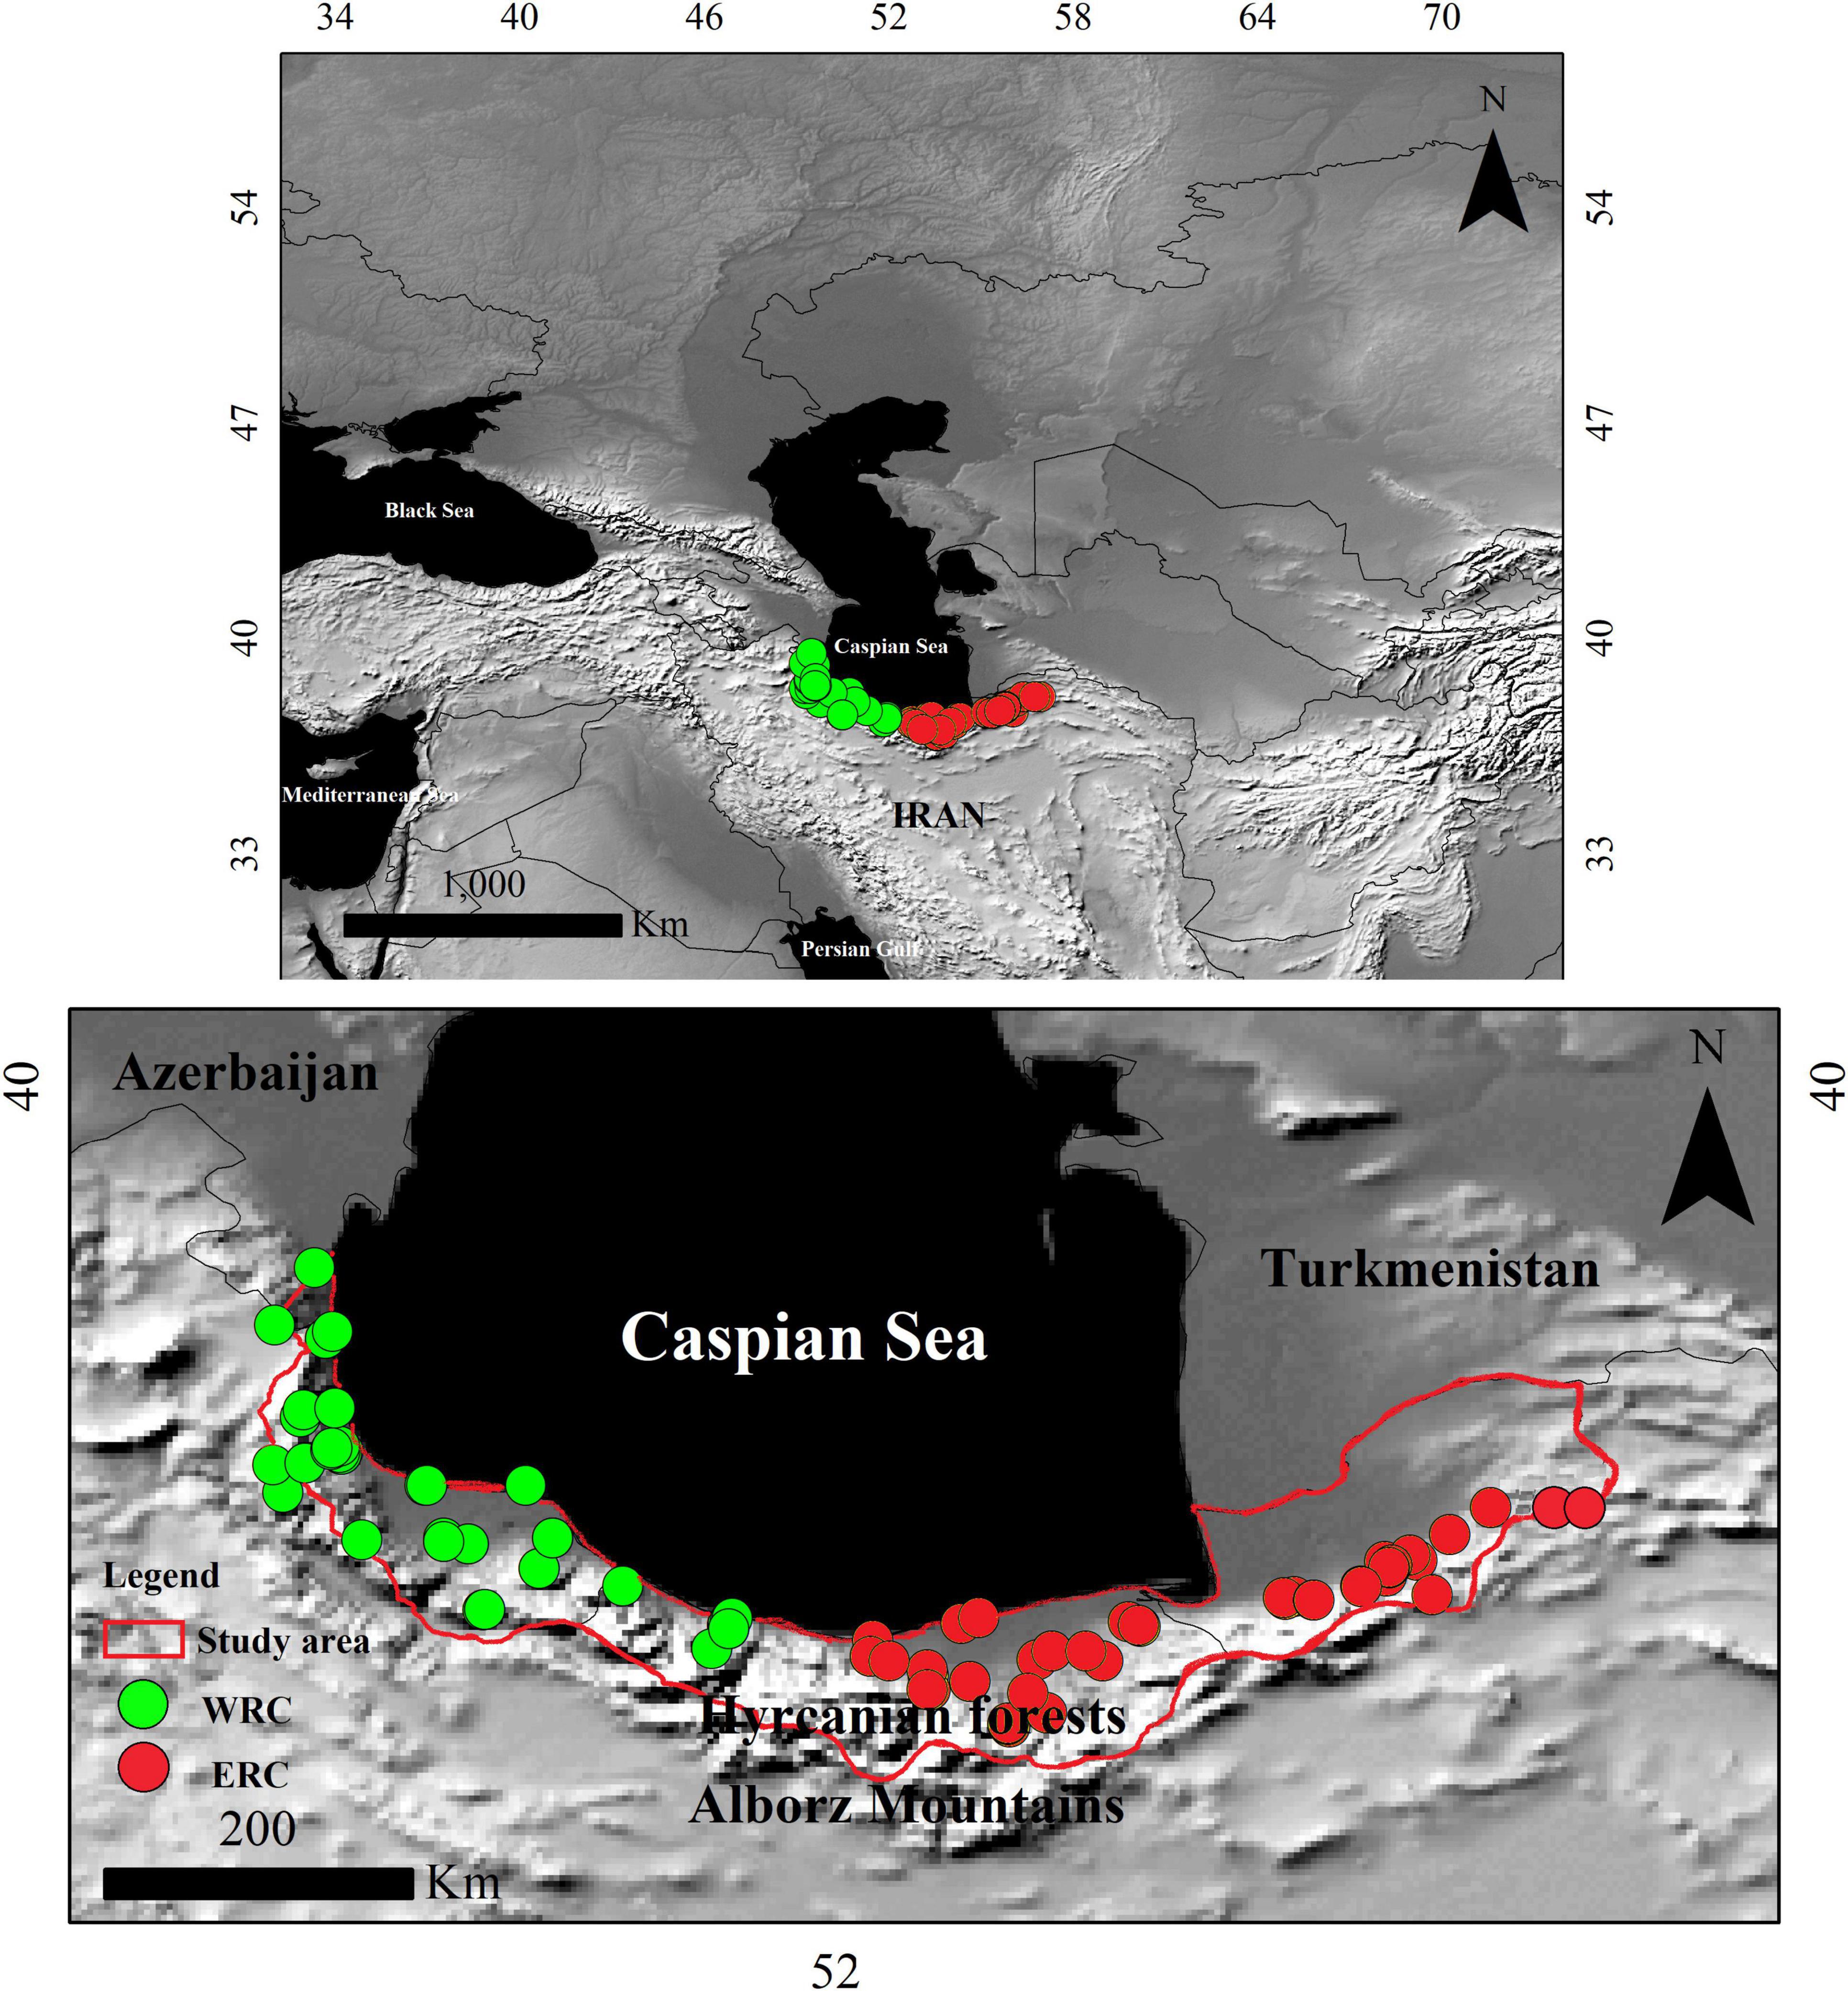
Figure 1. Study area. Hyrcanian forests along the northern slopes of the Alborz mountain range and the southern coastline of the Caspian Sea. The green circles represent the western regional clades (WRC) and the red circles represent the eastern regional clades (ERC) of the Hyrcanian wood frog, Rana pseudodalmatina within its range. A topographic map serves as the background.
Explanatory Variables
We gathered 32 environmental variables to quantify environmental heterogeneity within the distribution range of Hyrcanian wood frogs. These comprised 19 bio-climatic (BCV hereafter) and 13 macro-environmental (MEV hereafter) variables, including climate, soil, hydrology, land cover, topography, sunlight, and human impact, all of which identified as significant factors potentially affecting species distribution limits (Supplementary Table 2; Hu et al., 2016). Because high colinearity between environmental variables may inflate SDMs’ model accuracy, dimension-reduction methods (e.g., clustering algorithms and/or correlation analysis) can be employed to minimize correlations among variables (Hu and Jiang, 2010; Synes and Osborne, 2011). Therefore, we reduced the number of predictor variables by combining the results of Pearson’s correlation tests (certain BCV variables eliminated due to high correlations with other BCV with | r| > 0.75) (Goudarzi et al., 2019; Vaissi, 2021a,b) and a jackknife analysis (retaining MEV with the higher value when used in isolation) (Phillips et al., 2006; Hu et al., 2016).
Finally, we retained 15 variables including annual mean temperature [°C*10] (Bio1 hereafter), mean diurnal range [°C] (Bio2 hereafter), mean temperature of the wettest quarter [°C*10] (Bio8 hereafter), annual precipitation [mm/year] (Bio12 hereafter), precipitation of wettest month [mm/month] (Bio13 hereafter), precipitation of driest Month [mm/month] (Bio14 hereafter), precipitation of driest Quarter [mm/quarter] (Bio17 hereafter) and precipitation of warmest quarter [mm/quarter] (Bio18 hereafter) from climatologies at high resolution for the earth’s land surface areas (CHELSA) for 1979--20132 (Karger et al., 2017a,b); annual actual evapotranspiration (AET hereafter), annual aridity index (AI hereafter), annual potential evapotranspiration (PET hereafter) from the consortium for spatial information3; land-cover (LandCov hereafter) from the Google Earth Engine (GEE)4 (Ghorbanian et al., 2020); altitude (Alt hereafter) from the worldclim database5 and slope and aspect, which produced from the digital elevation model using the surface tools in ArcMap (v 10.8) (Supplementary Table 2). The spatial resolution of all variables was 30 arc-seconds (∼1 km). Variables measured in this study reflected environmental factors that frogs encountered and that affect amphibian physiology and survival (Araújo et al., 2006; Buckley and Jetz, 2007; Wells, 2010; Hof et al., 2011; Hu et al., 2016).
Environmental Niche Modeling
To create ENMs, we used the maximum entropy model (MaxEnt v 3.4.4;6 a presence-background approach that has a high prediction power even with a small sample of presence sites (Phillips et al., 2006) and widely used in spatial ecology (Banerjee et al., 2019; Cardoza-Martínez et al., 2019; Martínez-Freiría et al., 2020; Rodríguez-Rodríguez et al., 2020; Goudarzi et al., 2021). We constructed nine distinct models by MaxEnt using (1) BCV at species-level (SL hereafter) and two WRC and ERC, (2) MEV at SL and two WRC and ERC, and (3) integrated BCV + MEV at SL and two WRC and ERC. According to recent studies, using the default setting is not always the best option, particularly when the sample size is small (Merow et al., 2013; Radosavljevic and Anderson, 2014; Morales et al., 2017). Furthermore, the number of model parameters has an impact on model complexity, which can lead to overfitting (Shcheglovitova and Anderson, 2013). Therefore, we calculated the beta multiplier and reduced the number of included features and variables to reduce model complexity and over-parameterization (see more details in the section of explanatory variables) (Moreno-Amat et al., 2015). We evaluated the most parsimonious WRC, ERC, and SL models using different regularization beta-multiplier values (0.5, 1, and 2) and Akaike’s Information Criterion compensated for a small sample size (AICc). As a result, the final models used to have a beta multiplier of 0.5. Furthermore, we used the bootstrap method to generate 30 replicates, with 75% of the occurrences for model training and 25% for testing (Goudarzi et al., 2021). We used the percentage of contribution and jackknife analyses to determine the importance of each variable. We calculated the average value of replicates using the AUC metric (Area under the ROC curve), which is a threshold-independent measure of discriminating capacity (Swets, 1988). We chose the logistic output format for displaying the anticipated environmental suitability because of its simplicity of comprehension, with values ranging from 0 (lowest) to 1 (highest) (Phillips and Dudík, 2008).
Ecological Niche Metrics
We compared and visualized the niches between the WRC and ERC ranges using the niche overlap test, principal component analysis (PCAenv hereafter), niche equivalency (or identity) test, and niche similarity (or background) test from the eight BCV and seven MEV. Niche overlap is the intersection of two niches in a niche space. We used Schoener’s D-metric (Schoener, 1970; Warren et al., 2008), which ranges from 0 (no overlap) to 1 (complete overlap), to calculate the niche overlap between WRC and ERC. We utilized the PCAenv method to assess equivalency and similarity between the realized niches of WRC and ERC. This method estimates the available environmental space defined by the first two axes of the PCA by comparing the environmental circumstances available for a species within a specific study extent (background) with its observed occurrences. A smooth kernel density function is used to adjust for sampling bias in this method (Broennimann et al., 2012).
The niche equivalency and niche similarity tests frequently use the niche conservatism or divergence hypothesis (Glennon et al., 2014). We utilized the niche equivalency based on Brown and Carnaval’s (2019) ordination technique in environmental-space (E-space hereafter), which is the outcome of extending the methods of Broennimann et al. (2012), Petitpierre et al. (2012), and Qiao et al. (2017). We also used Brown and Carnaval’s (2019) method of expanding Beale et al. (2008), Warren et al. (2010), and Nunes and Pearson (2017) techniques to measure niche similarity tests. The niche equivalency test is conservative since it only considers whether the two entities’ niches (here ERC and ERC) are equal in their niche spaces, considering only the occurrences and leaving the backdrop out (Warren et al., 2008; Aguirre-Gutiérrez et al., 2015). The niche similarity test determines whether one range’s environmental niche is more similar to the other range’s niche than predicted by chance (Broennimann et al., 2012). The null hypothesis is that specific niches are equivalent when comparing a non-significant niche equivalency test with a significant niche similarity test. The null hypothesis of niche equivalency is rejected when a niche equivalency test is statistically significant, regardless of the significance (or non-significance) of the niche similarity test (Brown and Carnaval, 2019).
We used the ecospat package in R 4.1.17 to perform niche overlap test analyses (Di Cola et al., 2017). The Humboldt package was to perform PCAenv, niche equivalency test, and niche similarity test analyses (Brown and Carnaval, 2019).
Results
Environmental Niche Modeling
The ENMs displayed high predictive accuracy as measured by the AUC metric for the WRC (0.97 ± 0.008 based on BCV; 0.95 ± 0.02 based on MEV; 0.95 ± 0.03 based on BCV + MEV), ERC (0.97 ± 0.008 based on BCV; 0.97 ± 0.006 based on MEV; 0.98 ± 0.005 based on BCV + MEV), as well as at SL (0.94 ± 0.008 based on BCV; 0.96 ± 0.007 based on MEV; 0.97 ± 0.005 based on BCV + MEV) (Supplementary Figures 1–3). Potentially suitable habitats based on BCV, MEV, and integrated BCV + MEV for WRC and ERC, as well as at SL, are illustrated in Figures 2–4I–K. The WRC and ERC clearly illustrate distinct environmental suitability regions. Based on BCV, MEV, and BCV + MEV maps, it appears that for the western population, the west of the distribution range has high suitability compared to the east (Figures 2–4I). Similar results also appear for dispersed populations in the east (Figures 2–4J).
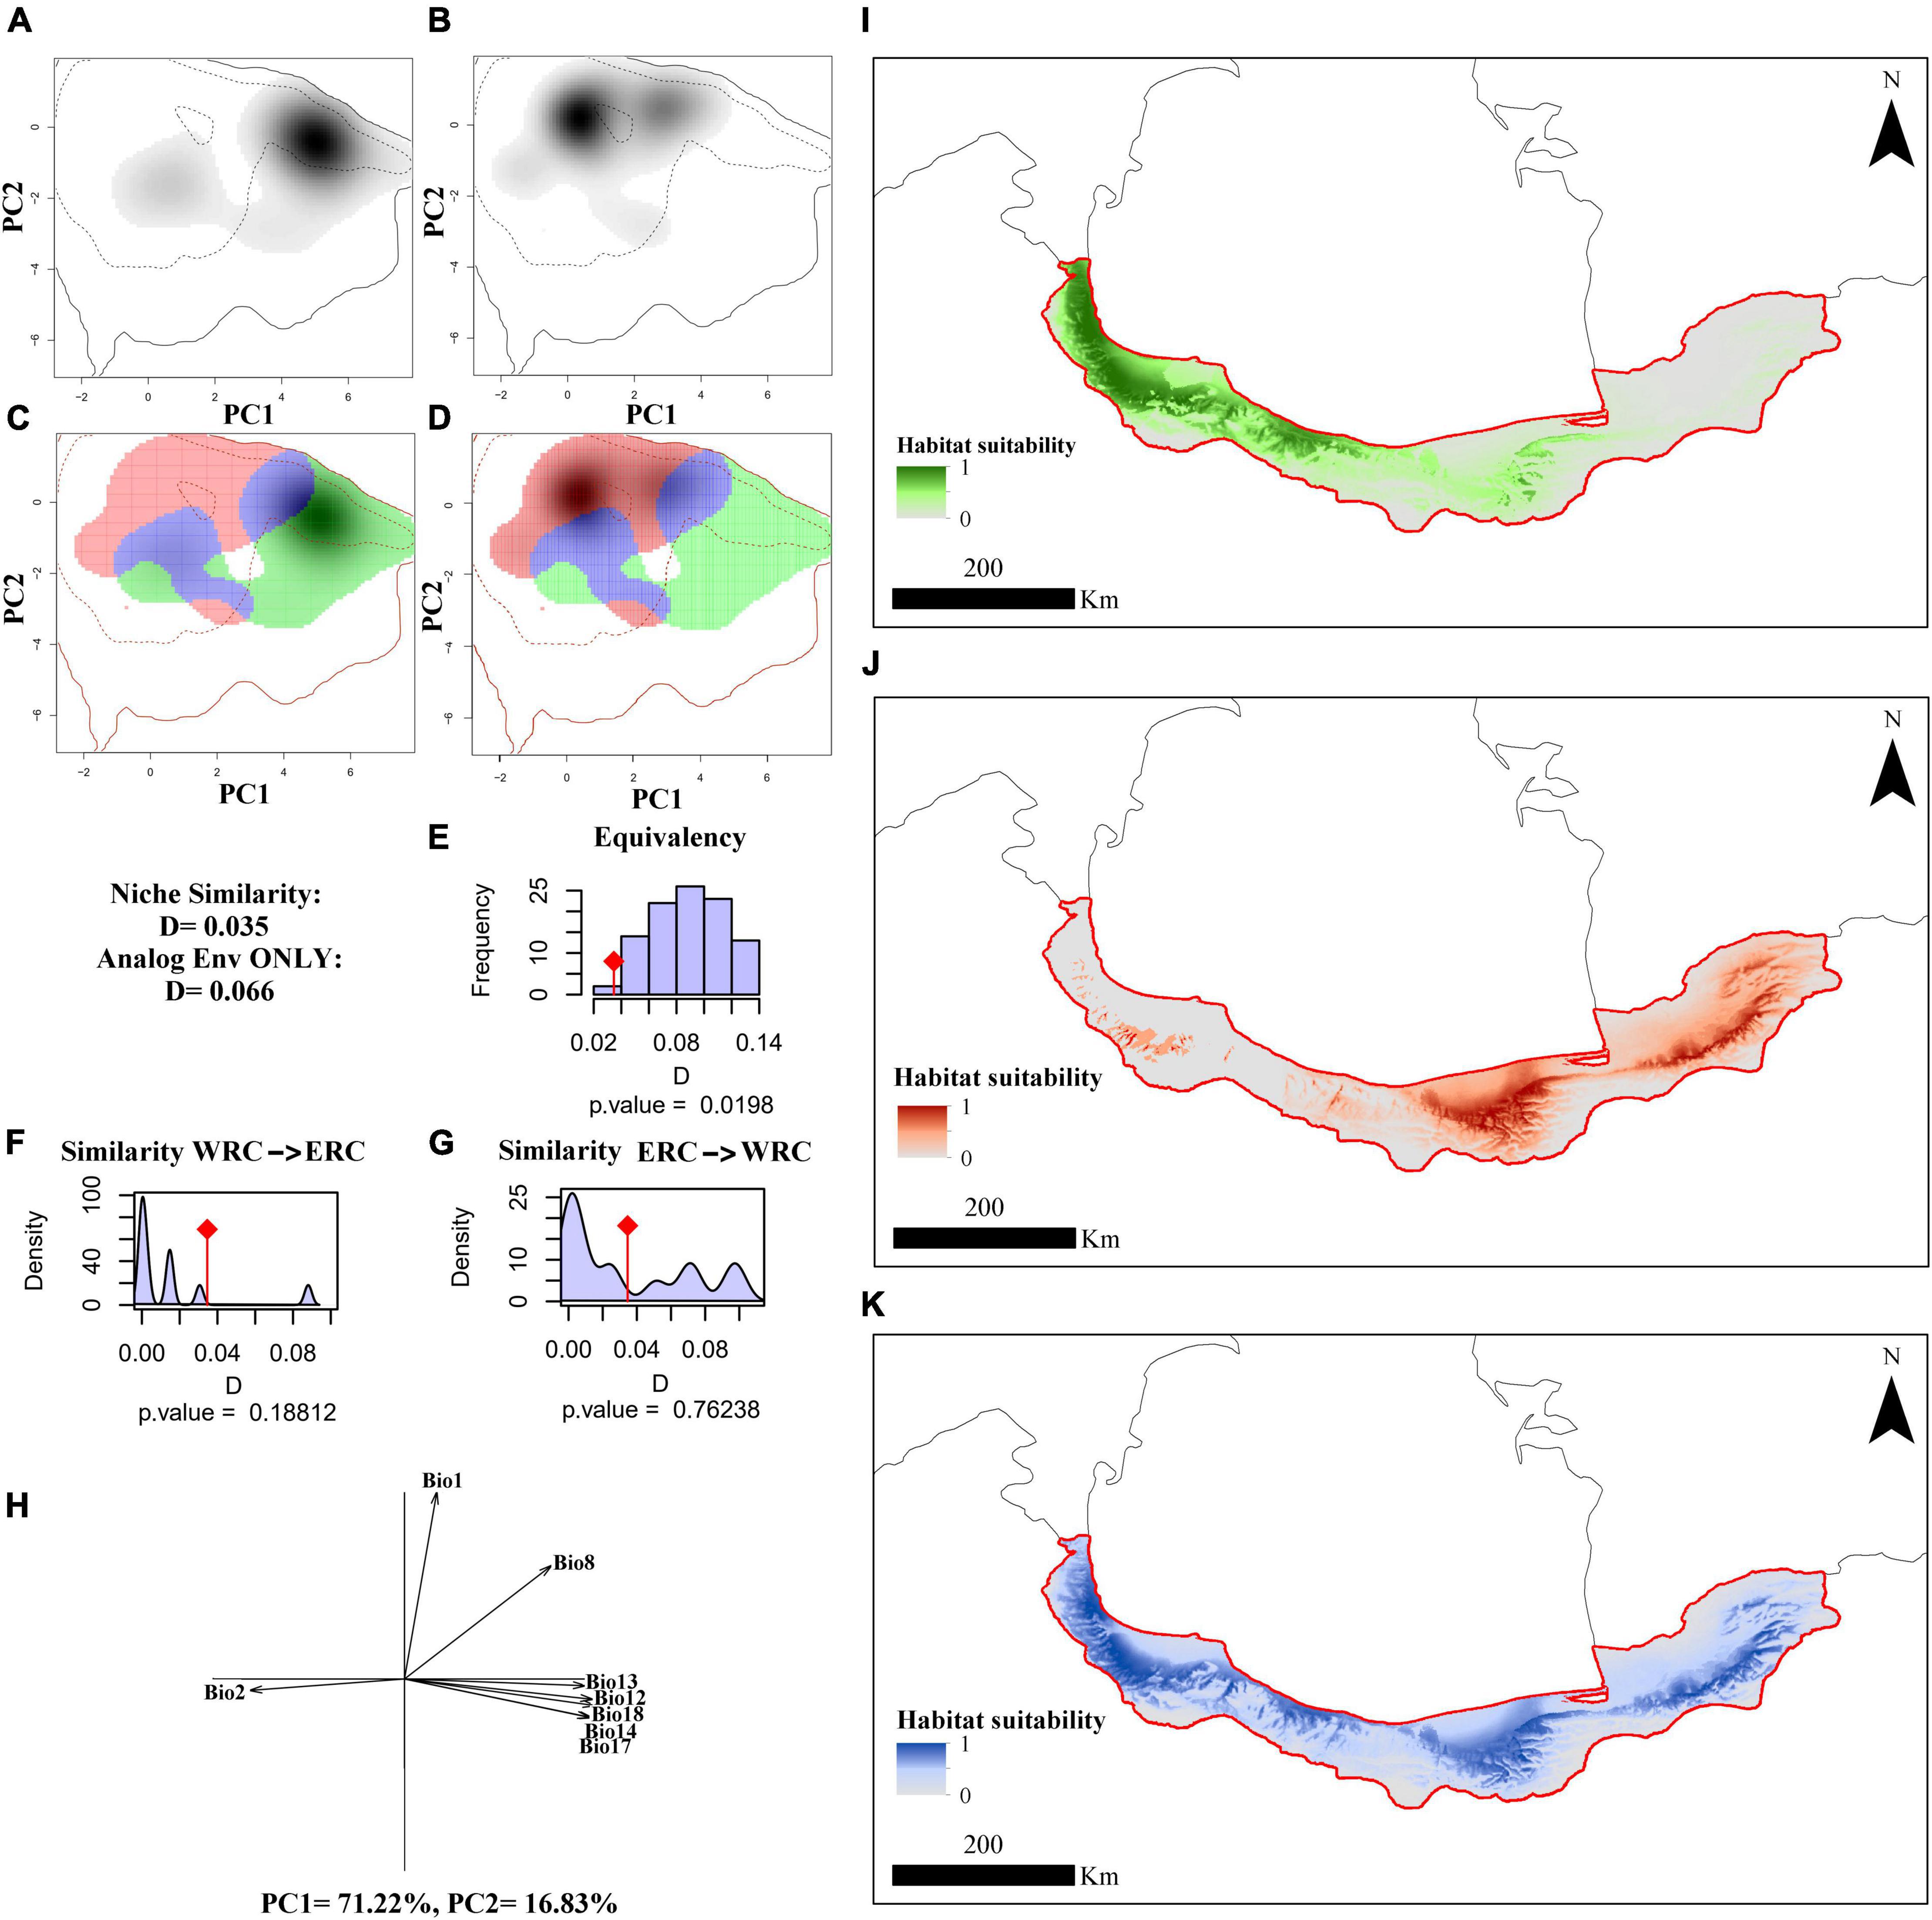
Figure 2. The climatic niche of the Hyrcanian wood frog, Rana pseudodalmatina across Hyrcanian forests, Iran. Panels (A,B) illustrate the species’ niche in the western and eastern distribution ranges, respectively, along the two first axes of the PCA. The density of the species’ occurrences in the cell is shown in the gray shade. The solid and dashed contour lines represent 100 and 50% of the available (background) environment, respectively. Panels (C,D) represent the niche overlap values for western (WRC) and eastern regional clades (ERC), respectively. Histograms (E–G) show the observed niche overlap D between the two ranges (bars with a diamond) and simulated niche overlaps (gray bars) on which tests of niche equivalency (E), niche similarity of WRC to ERC (F), and niche similarity of ERC to WRC (A). (H) The contribution of the climatic variables on the two axes of the PCAenv and the percentage of inertia explained by the two axes. Potentially suitable areas are based on bio-climatic variables according to WRC (I), ERC (J), and species-level (K).
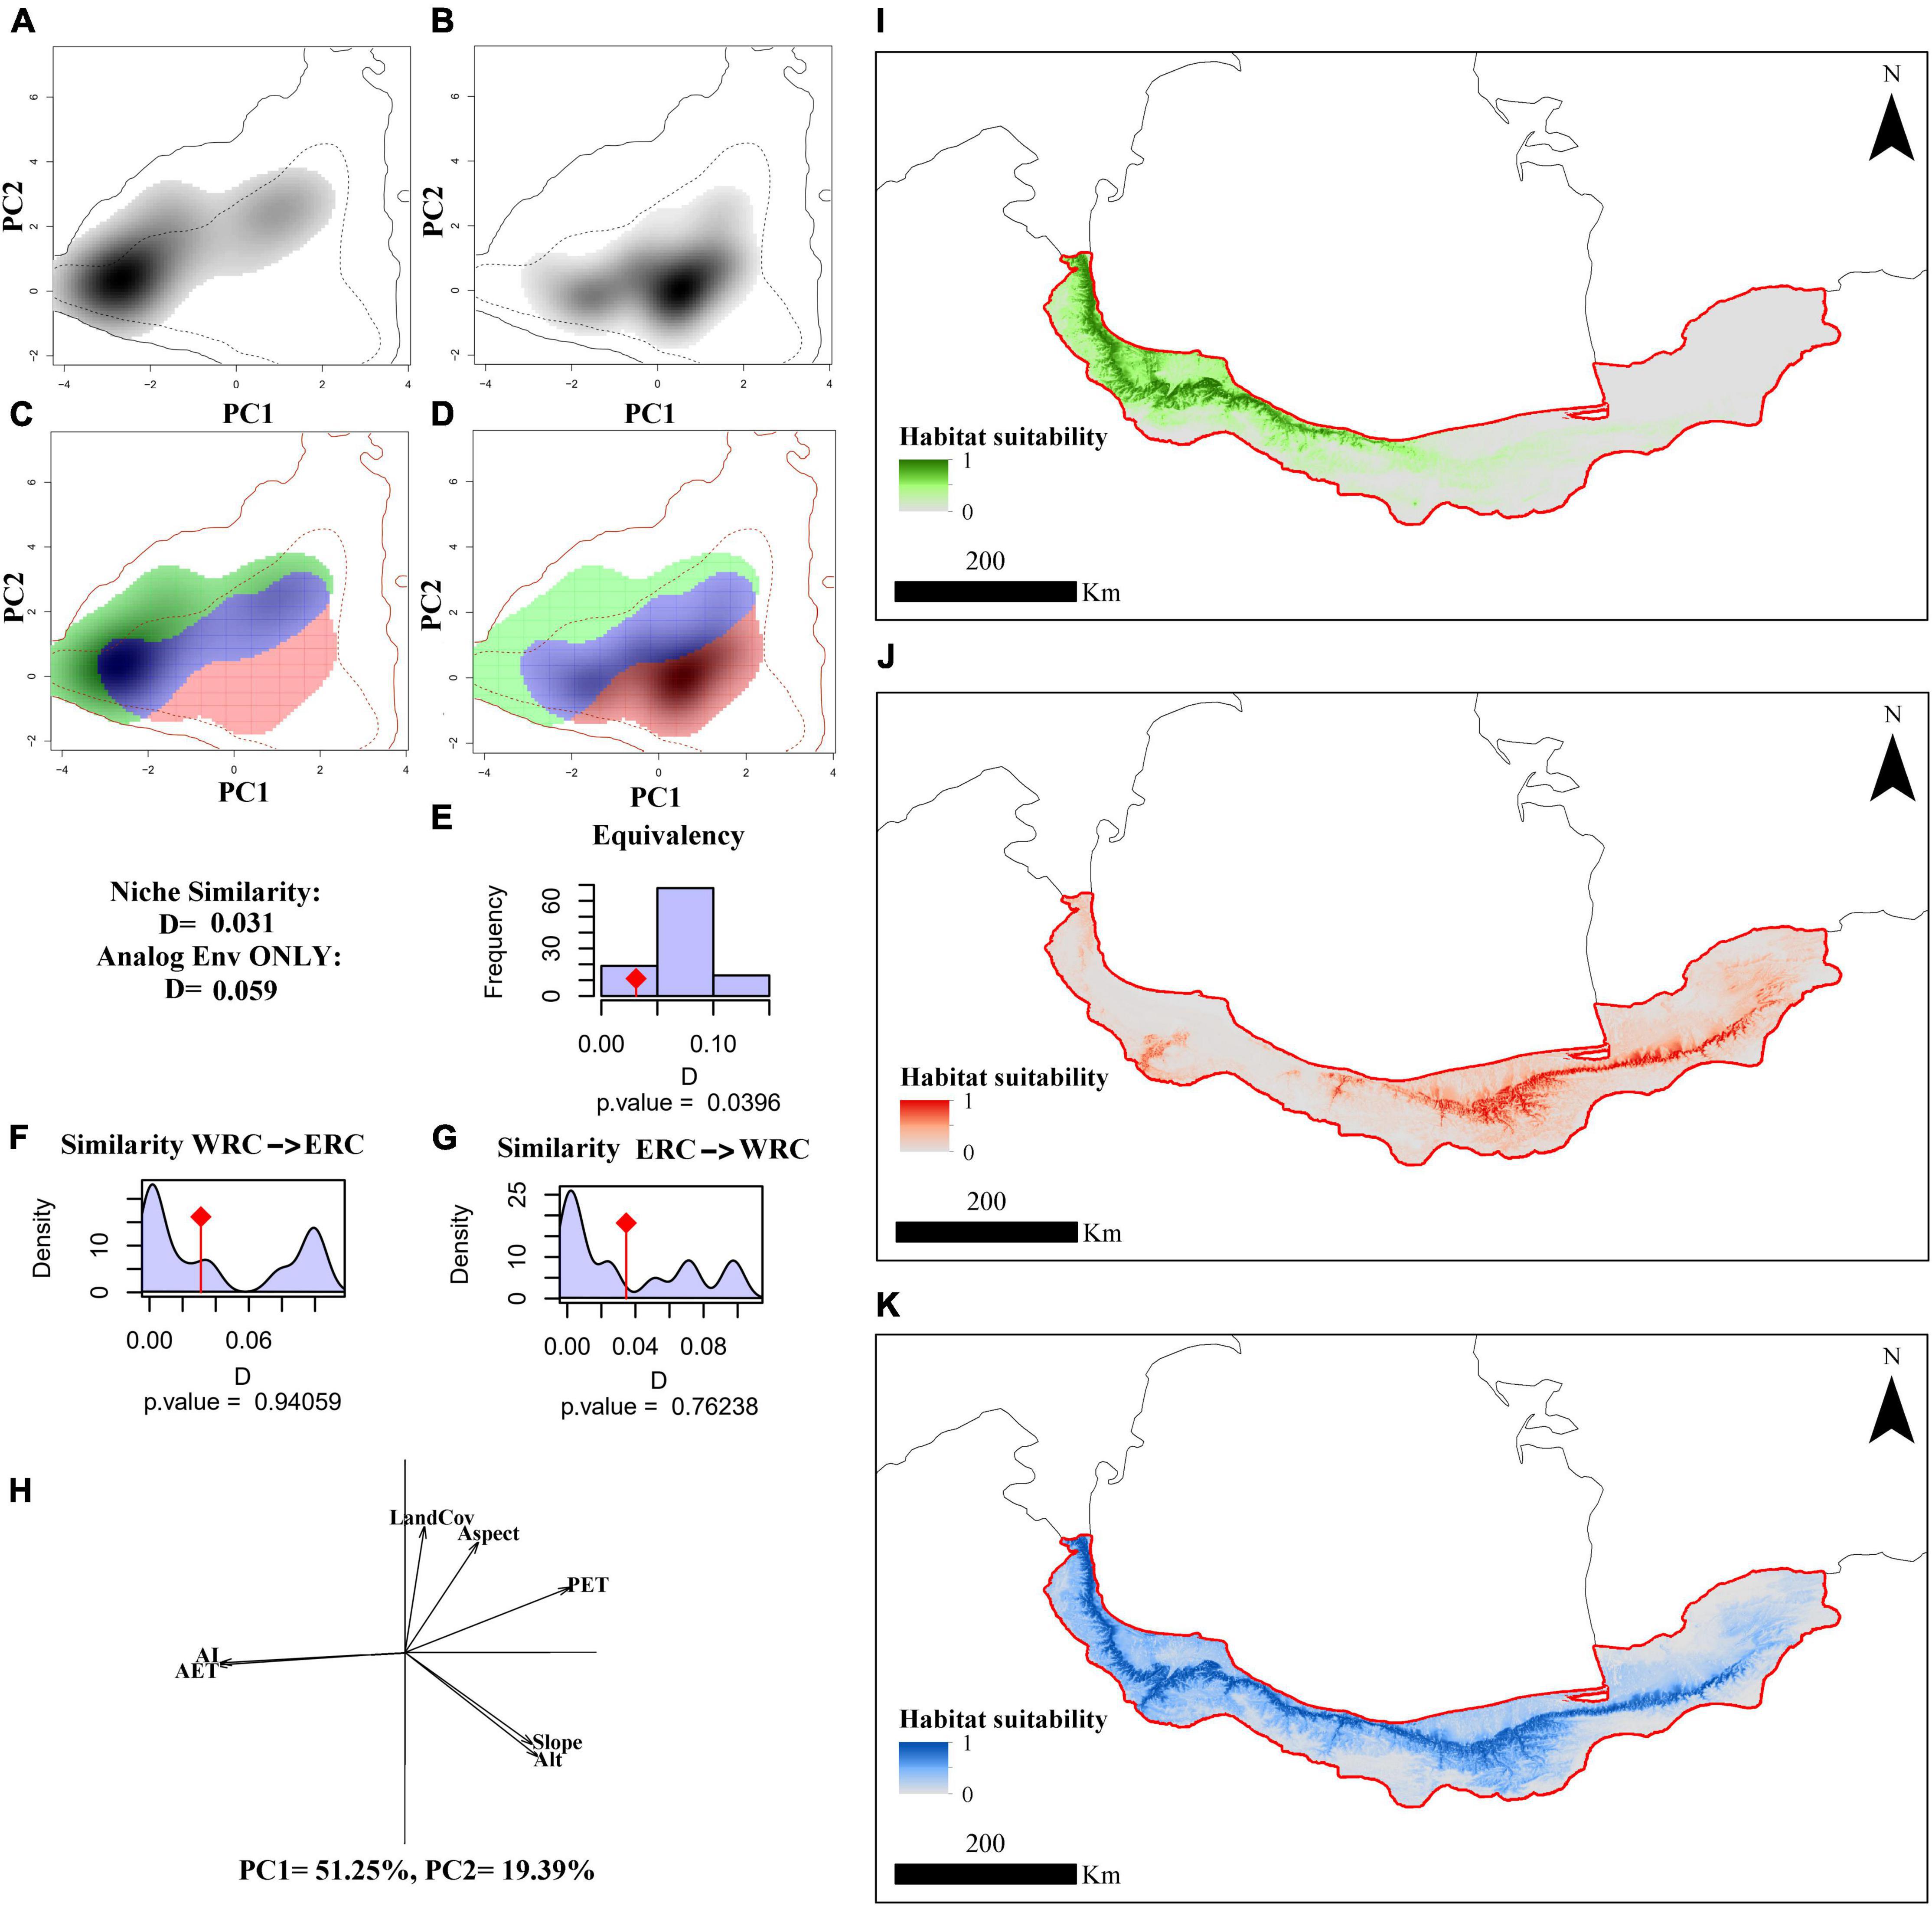
Figure 3. The macro-environmental niche of the Hyrcanian wood frog, Rana pseudodalmatina across Hyrcanian forests, Iran. Panels (A,B) illustrate the species’ niche in the western and eastern distribution ranges, respectively, along the two first axes of the PCA. The density of the species’ occurrences in the cell is shown in the gray shade. The solid and dashed contour lines represent 100 and 50% of the available (background) environment, respectively. Panels (C,D) represent the niche overlap values for western (WRC) and eastern regional clades (ERC), respectively. Histograms (E–G) show the observed niche overlap D between the two ranges (bars with a diamond) and simulated niche overlaps (gray bars) on which tests of niche equivalency (E), niche similarity of WRC to ERC (F), and niche similarity of ERC to WRC (A). (H) The contribution of the macro-environmental variables on the two axes of the PCAenv and the percentage of inertia explained by the two axes. Potentially suitable areas are based on macro-environmental variables according to WRC (I), ERC (J), and species-level (K).
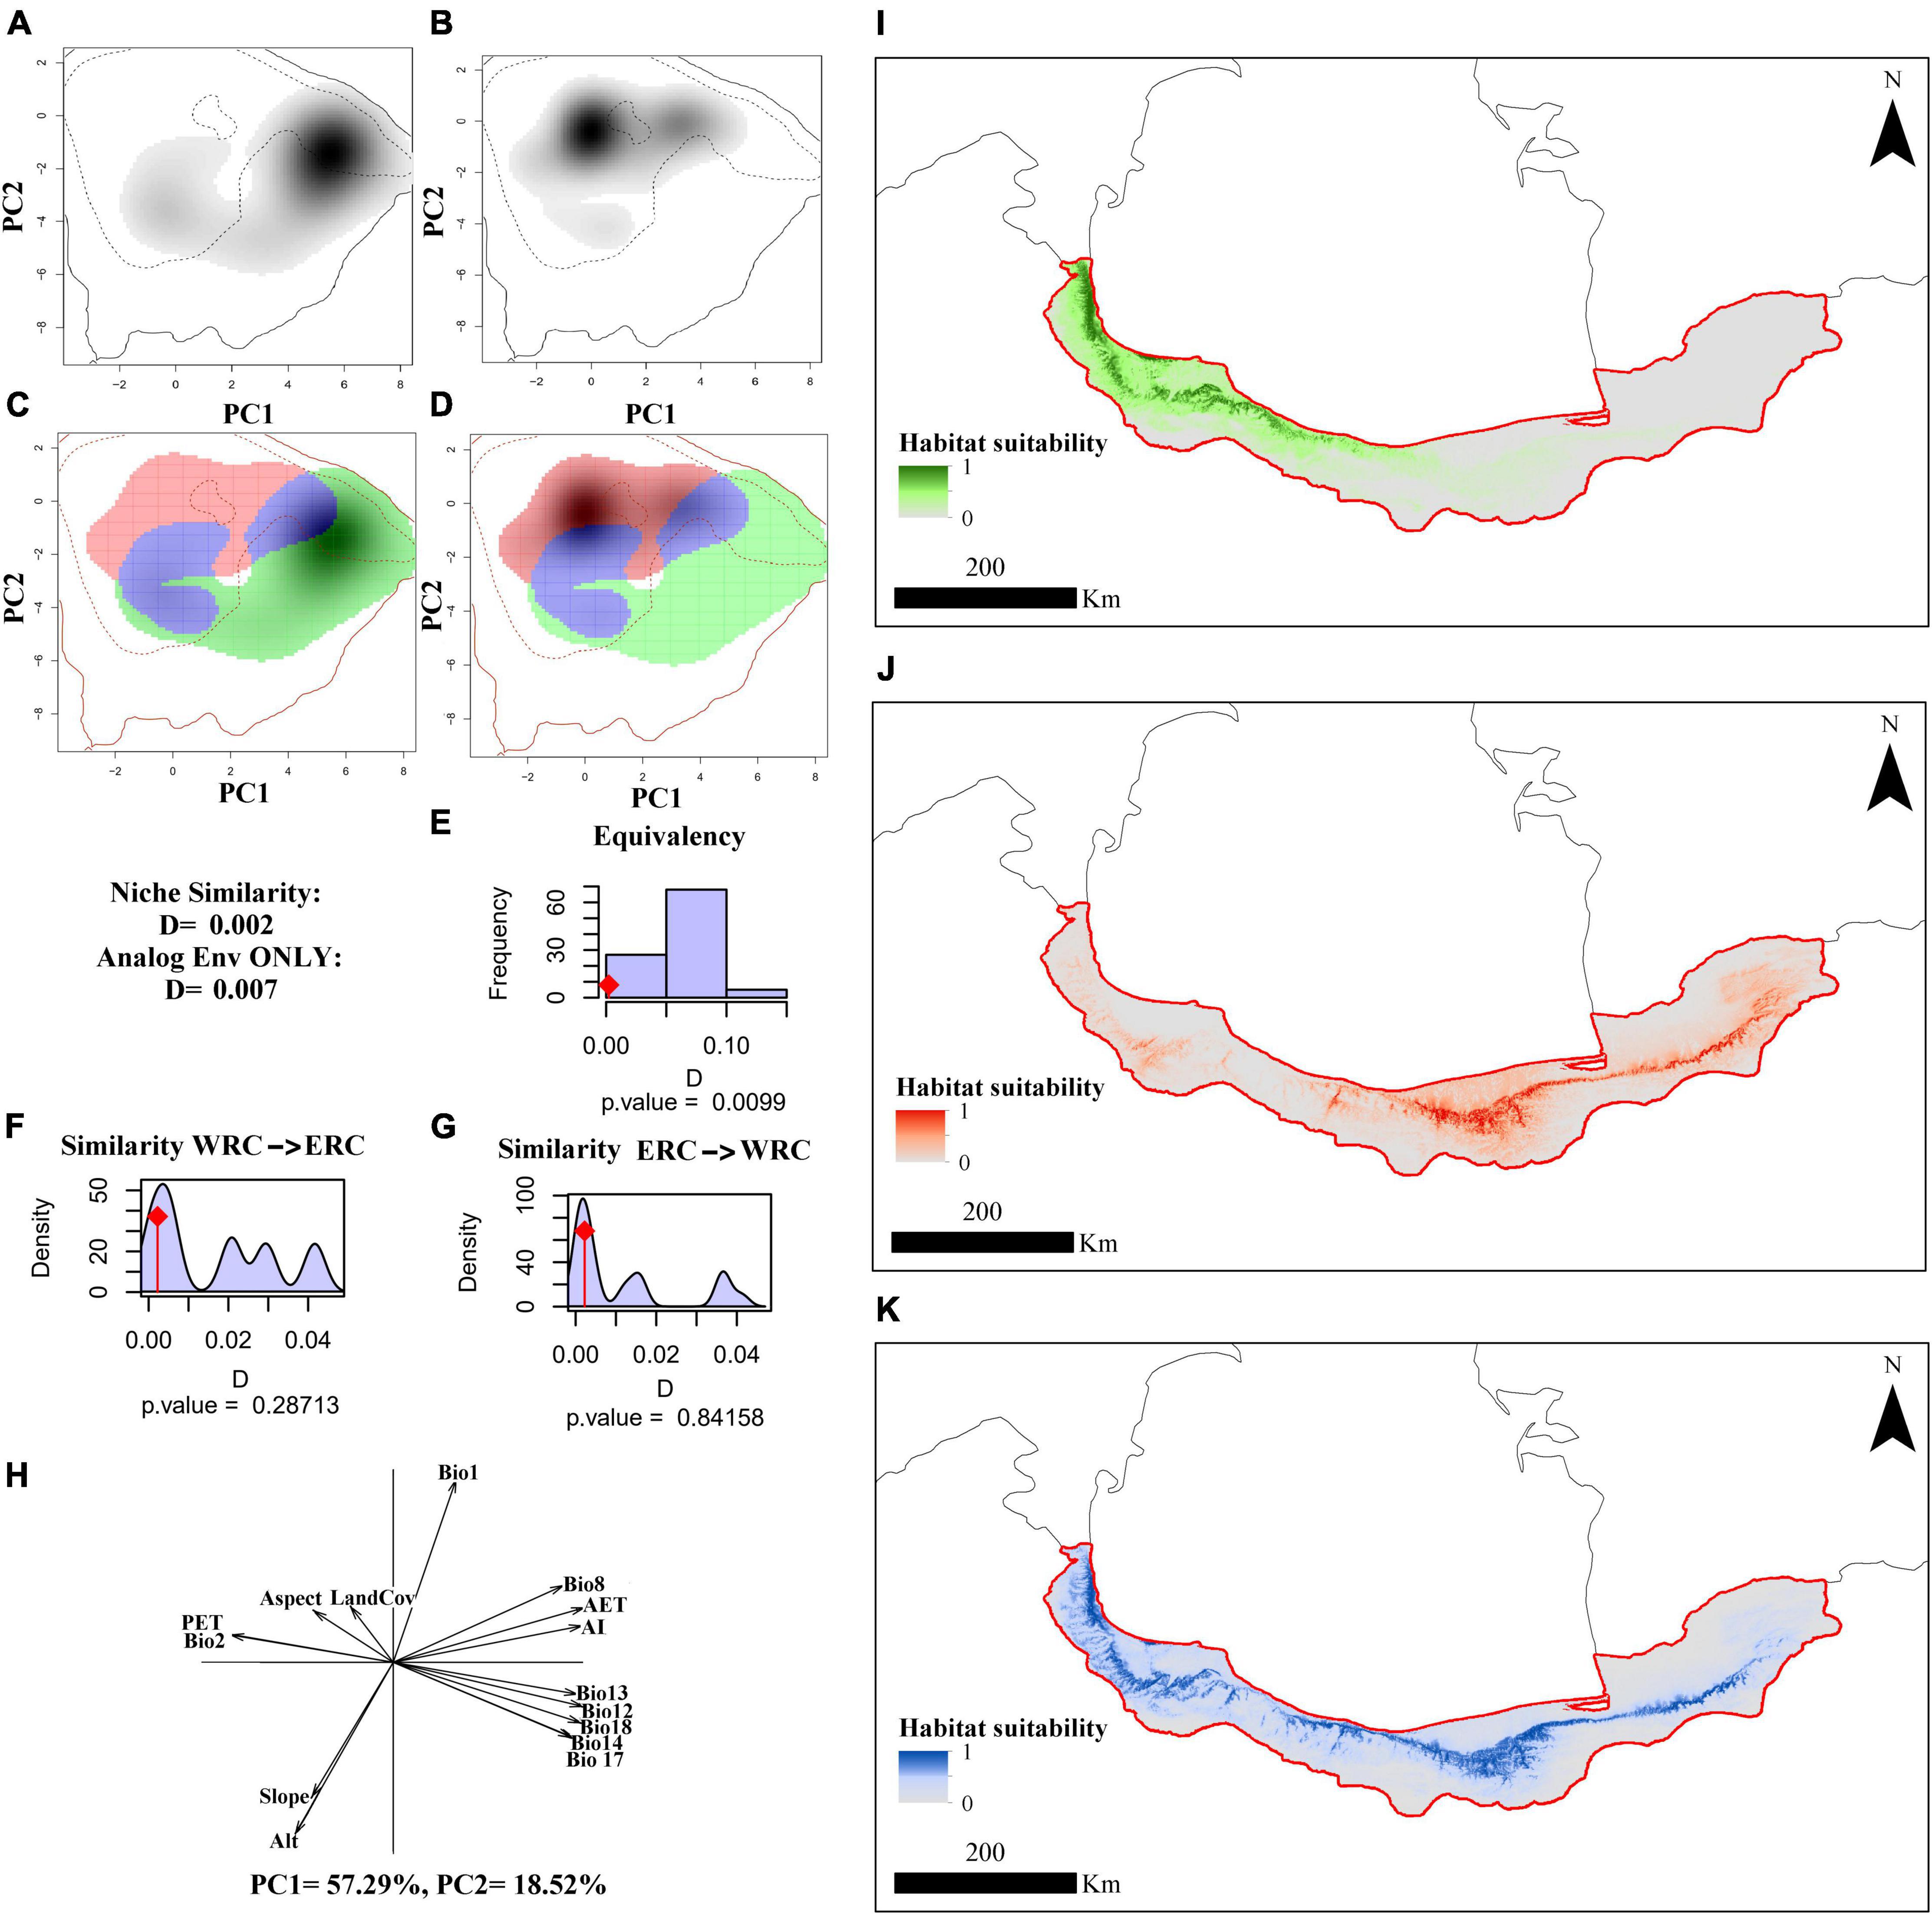
Figure 4. The integrated climatic and macro-environmental niche of the Hyrcanian wood frog, Rana pseudodalmatina across Hyrcanian forests, Iran. Panels (A,B) illustrate the species’ niche in the western and eastern distribution ranges, respectively, along the two first axes of the PCA. The density of the species’ occurrences in the cell is shown in the gray shade. The solid and dashed contour lines represent 100 and 50% of the available (background) environment, respectively. Panels (C,D) represent the niche overlap values for western (WRC) and eastern regional clades (ERC), respectively. Histograms (E–G) show the observed niche overlap D between the two ranges (bars with a diamond) and simulated niche overlaps (gray bars) on which tests of niche equivalency (E), niche similarity of WRC to ERC (F), and niche similarity of ERC to WRC (A). (H) The contribution of the bio-climatic and macro-environmental variables on the two axes of the PCAenv and the percentage of inertia explained by the two axes. Potentially suitable areas are based on integrated bio-climatic and macro-environmental variables according to WRC (I), ERC (J), and species-level (K).
The percent contribution and permutation importance of BCV, MEV, and BCV + MEV for the WRC, ERC, and SL are given in Table 1. In the BCV Jackknife evaluation, the major climatic factors influencing WRC, ERC, and SL distribution were found to be Bio18, Bio18, and Bio17, respectively. According to the MEV jackknife test for WRC and ERC and at SL, the major macro-environmental factors affecting the distribution of Hyrcanian wood frogs were LandCov, Alt, and LanCov, respectively. Based on the integrated BCV + MEV jackknife test for WRC and ERC and at SL, the environmental variables with the highest gain when utilized in isolation were Bio17, Bio18, and Bio17, respectively (Supplementary Figures 4–6).
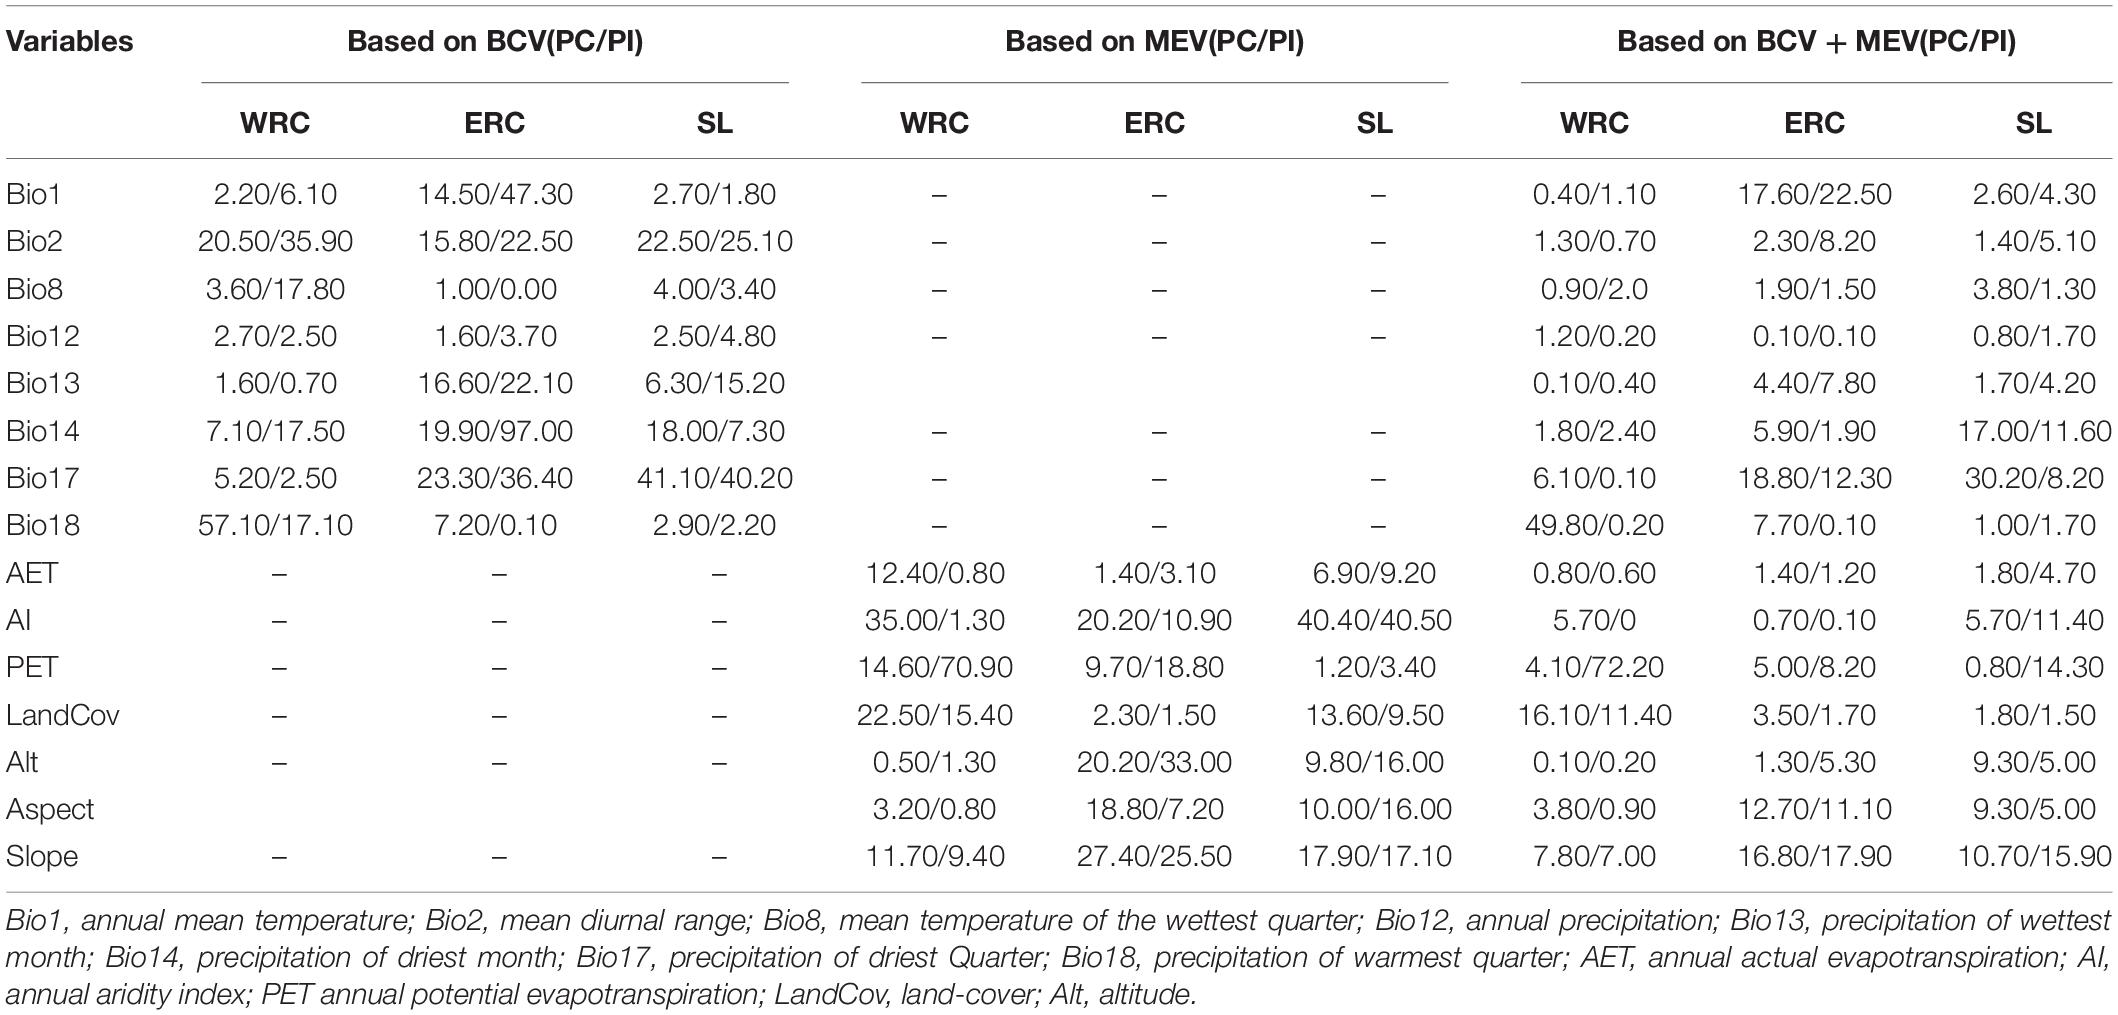
Table 1. Percent contribution (PC) and permutation importance (PI) of eight bio-climatic (BCV) and seven macro-environmental (MEV) variables for the two western and eastern regional clades (WRC and ERC) and at species-level (SL).
According to Bios 12, 13, 14, 17, and 18, the greatest probability of the presence of Hyrcanian wood frogs in the west is in the precipitation of about 1100 (mm/year), 170 (mm/month), 50 (mm/quarter), 150 (mm/quarter), and 180 (mm/quarter), respectively. While in the east of the distribution, due to the same variables, the most likely presence of the species is in the lower precipitation of about 600 (mm/year), 80 (mm/month), 30 (mm/quarter), 70 (mm/quarter), and 110 (mm/quarter), respectively. Although there was no significant difference in the highest probability of species presence between WRC and ERC due to temperature (Bios 1, 2, and 8), the curves show that western populations are more likely to be present at lower temperatures than eastern populations (Supplementary Figures 7, 10).
Based on MEV, the probability of species presence increases with increasing AET, AI, and slope for populations in the West. While for the population distributed in the east, although the probability of the species’ presence first increases with increasing AET, AI, and slope, but then decreases. In the west, increasing PET decreases the possibility of a species’ presence, but in the east, it first increases and then decreases. According to Alt curves, western populations are more likely to be found at higher elevations than eastern populations (Supplementary Figures 8, 11).
Ecological Niche Metrics
The species niche of Hyrcanian wood frogs in the western and eastern distribution ranges along the two first axes of the PCAenv based on BCV, MEV, and BCV + MEV are illustrated in Figures 2–4A,B. Figures 2–4C,D indicate the niche overlaps between WRC and ERC based on BCV, MEV, and BCV + MEV, which have little overlap. The first two components of PCAenv based on BCV explained 88.05% of the total variation along climatic gradients (PC1 = 71.22%, PC2 = 16.83%) (Figure 2H). Based on MEV, the first two components of PCAenv explained 70.64% of the total variation along micro-environmental gradients (PC1 = 51.25%, PC2 = 19.39%) (Figure 3H). According to both climatic and macro-environmental scales, PCAenv indicated that 75.81% of the environmental variation was explained by the first two PCs (PC1 = 57.29%, PC2 = 18.52%) (Figure 4H).
The occupied niches by the two WRC and ERC were significantly non-equivalent based on BCV (p = 0.01), MEV (p = 0.03), and BCV + MEV (p = 0.009) (Figures 2–4E). According to BCV, the realized niches of WRC and ERC had a similarity test value of D = 0.03 and were not significant when comparing WRC to ERC (p = 0.18) (Figure 2F) and ERC to WRC (p = 0.76) (Figure 2G). Based on MEV, the realized niches of WRC and ERC had a similarity test value of D = 0.03 and were not significant when WRC was compared to ERC (p = 0.94) (Figure 3F), or when ERC was compared to WRC (p = 0.76) (Figure 3G). Based on BCV + MEV, the realized niches of WRC and ERC had a similarity test value of D = 0.002 and were not significant when WRC was compared to ERC (p = 0.28) (Figure 4F) or ERC was compared to WRC (p = 0.84) (Figure 4G).
Discussion
Several studies have focused on the genetic structure, phylogeny, and habitat suitability of the Hyrcanian wood frog, R. pseudodalmatina (Najibzadeh et al., 2017, 2018, 2021; Amiri et al., 2021; Kidov and Litvinchuk, 2021). However, the present study, using ENMs and multivariate niche analyses, for the first time, investigated environmental differentiation between the WRC and ERC of the Hyrcanian wood frog in the Hyrcanian forests. The hypothesis focused on whether R. pseudodalmatina lineages preserved similar niches after divergent, which might reveal new details about Hyrcanian wood frog diversification. For this purpose, niche divergence or conservatism and its relationship to lineage diversification were explored based on recent phylogeographic understanding (Najibzadeh et al., 2018, 2021; Amiri et al., 2021). The results of this study found evidence of niche divergences between WRC and ERC that may have accelerated the evolution of clades of R. pseudodalmatina. On the other hand, this research by ecological niche comparisons may provide new insights into the exploration of species diversification processes in the Hyrcanian forests. Furthermore, understanding the major ecological constraints to species distribution is critical for current conservation efforts as well as future research into the effects of climate change on biodiversity (Aguirre-Gutiérrez et al., 2015).
The factors that impact species distributions must be addressed and recognized when evaluating differences in species’ environmental niches (Guisan and Thuiller, 2005; Colwell and Rangel, 2009). Therefore, this study focused on the gradients of abiotic factors such as climate, soil, hydrology, land cover, topography, sunlight, and human impact (Supplementary Table 2) that can constrain species ranges (Gaston, 2003). In the Hyrcanian regions, the annual precipitation decreases from west to east as well as from lowlands to highlands (Tohidifar et al., 2016). The mean annual temperature also decreases from the lowlands to the mountain ranges. According to the CHELSA database,8 annual precipitation in the Hyrcanian area is around 1430 mm in the west (Gilan province) and around 280 mm in the east (north of Khorasan province) (Karger et al., 2017a,b). The mean annual temperature in the lowland belt is around 19.2°C (at an altitude of about −20 m a.s.l. in Gilan and Mazandaran provinces), whereas it is about 5.2°C in the upper-montane belt (at an altitude of around 2,500 m a.s.l. in Mazandaran province). According to climate station databases in lowland cities, an increase in the mean annual temperature and a decrease in annual precipitation have been recorded from west to east (Gholizadeh et al., 2020). Furthermore, according to a new bioclimatic classification, the climate in the eastern part of these forests differs from that in the western part and is classified as Mediterranean pluviseasonal oceanic and temperate oceanic, respectively (Djamali et al., 2011). The vegetation in these forests is diverse, as are the geological substrates, which include acidic rock (granite) in the west, dolomite in the center, and sandstone in the east (Siadati et al., 2010; Gholizadeh et al., 2020). Brown soil covers almost 90% of these forests, which can be followed by alluvial, colluvial, rendzina, and ranker soils (Sagheb-Talebi et al., 2014).
According to the findings, climatic and macro-environmental factors have a substantial impact on the distribution of the Hyrcanian wood frog. In more detail, based on percent contribution and Jackknife analysis (Table 1 and Supplementary Figures 4–6), climatic variables, especially precipitation, have a greater impact on the distribution range of western and eastern populations than macro-environmental variables when both BCV and MEV are taken into account. As a result, Bio17 and then Bio18 and Bio14 are the most significant variables influencing the distribution of western populations, whereas Bio18 and then Bio12 and Alt are the most important variables affecting the eastern populations’ range (Supplementary Figure 6). Based on contribution percentages, these factors were Bio18 and then LandCov and slope for western populations, and Bio17 and then Bio1 and slope for eastern populations (Table 1, the section of BCV + MEV). However, it should be noted that biotic interactions such as predators, competitors, and parasites all have an important role in restricting species distribution, which needs attention (Gaston, 2003; Gotelli et al., 2010; Sunday et al., 2011).
Differences in distribution and environmental suitability between the two lineages might be explained by niche differences and divergent reactions to the environment (Peñalver-Alcázar et al., 2021). Evaluating whether ecological features of one lineage can effectively forecast the geographic distribution of another lineage (or itself), as well as vice versa, is a reliable way to investigate this prediction (Peterson et al., 1999; Peterson and Holt, 2003). In this study, ENMs were carried out separately for WRC and ERC as well as at the SL. The habitat suitability predictions for each population were significantly different between the WRC and the ERC. The results clearly reveal that the east of the distribution region is unsuitable for the western populations in terms of BCV, MEV, and BCV + MEV. Eastern populations exhibit similar results, with the exception that in the west, restricted distribution areas for these populations have been found, although they are not highly suitable (Figures 2–4). The results of the probability of species presence show that western populations have evolved in wetter and low-temperature environments that have high precipitation, AET, AI, Alt, and slope, as well as low PET, whereas eastern populations have adapted to drier and warmer conditions with less precipitation, AET, AI, Alt, and slope, as well as high PET (Supplementary Figures 7–15). As a result, these data indicate the potential for intraspecific niche differences in R. pseudodalmatina in geographic (G) space. Therefore, these two regional clades may respond differently to future climate change.
The ecological niche metrics analysis, similar to ENMs results, indicates that WRC and ERC have undergone considerable niche divergence in both climatic and macro-environmental niches (Figures 2–4). As a consequence, the niche overlap observed revealed that the WRC and ERC have little overlap (Schoener’s D-metric), and the rejection of the niche equivalence hypothesis confirmed that the two regional clades exist in distinct environmental niche spaces. The results of the similarity test also support these predictions (Figures 2–4). Furthermore, the PCAenv results in E-space appear to be credible for the Hyrcanian wood frog, as the two regional clades occupy regions with substantial climate and environmental changes in the Hyrcanian forests (Figures 2–4). These findings indicate that niche divergence may accelerate the evolution of western and eastern R. pseudodalmatina populations within Hyrcanian forests. These results follow Brown and Carnaval (2019) conclusions that niches diverged considerably when niche overlap was low, the equivalent test was significant, and the similarity test was significant or not. However, it should be highlighted that without comprehensive physiological investigation, it may be impossible to determine whether two species’ or clades’ fundamental niches differ due to divergence, or whether their fundamental habitats are the same but their prospective niches differ due to biotic variables (Brown and Carnaval, 2019). Therefore, further research is needed on these subjects.
The niche overlap results indicated that the WRC and the ERC share a limited hybrid (or sympatric) region. This finding may confirm the results of the previous study (Amiri et al., 2021), which showed that using Circuitscape analysis, the highest connectivity between the two populations is in the central part of the distribution range (i.e., the westernmost margin of the eastern distribution range and the easternmost margin of the western distribution). According to Amiri et al. (2021), this connectivity might be due to a secondary post-glacial connection. However, one possible reason is that the WRC and ERC have similar environmental requirements in areas where admixture between the regional clades is possible (Hu and Jiang, 2012). This approach could be beneficial for identifying and designating sample zones in other species where allopatric lineages meet and exchange genes, especially in those with a deep phylogenic structure (Peñalver-Alcázar et al., 2021). Furthermore, it emphasizes that connecting multiple sources of knowledge (e.g., ecological and historical biogeography, phylogeographic and phylogenetic techniques) aids in improving the species’ evolutionary and ecological understanding (Wiens and Donoghue, 2004).
Data Availability Statement
The raw data supporting the conclusions of this article will be made available by the authors, without undue reservation.
Ethics Statement
Ethical review and approval was not required for the animal study because this study is modeling and does not require sampling.
Author Contributions
SV conceived and designed the study, prepared the data, interpreted the data, made the figures, and wrote, finalized, and revised the manuscript. SV and SR analyzed the data. All authors contributed to the article and approved the submitted version.
Conflict of Interest
The authors declare that the research was conducted in the absence of any commercial or financial relationships that could be construed as a potential conflict of interest.
Publisher’s Note
All claims expressed in this article are solely those of the authors and do not necessarily represent those of their affiliated organizations, or those of the publisher, the editors and the reviewers. Any product that may be evaluated in this article, or claim that may be made by its manufacturer, is not guaranteed or endorsed by the publisher.
Supplementary Material
The Supplementary Material for this article can be found online at: https://www.frontiersin.org/articles/10.3389/fevo.2022.774481/full#supplementary-material
Footnotes
- ^ https://www.gbif.org/pt/
- ^ https://chelsa-climate.org/bioclim/
- ^ http://www.cgiar-csi.org
- ^ https://earthengine.google.com
- ^ https://www.worldclim.org/
- ^ https://biodiversityinformatics.amnh.org/
- ^ https://cran.r-project.org/
- ^ http://chelsa-climate.org
References
Aguirre-Gutiérrez, J., Serna-Chavez, H. M., Villalobos-Arambula, A. R., Perez de la Rosa, J. A., and Raes, N. (2015). Similar but not equivalent: ecological niche comparison across closely–related Mexican white pines. Divers. Distrib. 21, 245–257. doi: 10.1111/ddi.12268
Ahmadi, M., Hemami, M. R., Kaboli, M., Nazarizadeh, M., Malekian, M., Behrooz, R., et al. (2021). The legacy of Eastern Mediterranean mountain uplifts: rapid disparity of phylogenetic niche conservatism and divergence in mountain vipers. BMC Ecol. Evol. 21:130. doi: 10.1186/s12862-021-01863-0
Alexander Pyron, R., and Burbrink, F. T. (2009). Lineage diversification in a widespread species: roles for niche divergence and conservatism in the common kingsnake, Lampropeltis getula. Mol. Ecol. 18, 3443–3457. doi: 10.1111/j.1365-294X.2009.04292.x
Amiri, N., Vaissi, S., Aghamir, F., Saberi-Pirooz, R., Rödder, D., Ebrahimi, E., et al. (2021). Tracking climate change (past-recent-future) in the spatial distribution pattern and the phylogeographic structure of Hyrcanian wood frog, Rana pseudodalmatina (Anura: Ranidae). J. Zool. Syst. Evol. Res. 59, 1604–1619.
Araújo, M. B., Thuiller, W., and Pearson, R. G. (2006). Climate warming and the decline of amphibians and reptiles in Europe. J. Biogeogr. 33, 1712–1728.
Banerjee, A. K., Mukherjee, A., Guo, W., Ng, W. L., and Huang, Y. (2019). Combining ecological niche modeling with genetic lineage information to predict potential distribution of Mikania micrantha Kunth in South and Southeast Asia under predicted climate change. Glob. Ecol. Conserv. 20:e00800. doi: 10.1016/j.gecco.2019.e00800
Beale, C. M., Lennon, J. J., and Gimona, A. (2008). Opening the climate envelope reveals no macroscale associations with climate in European birds. Proc. Natl. Acad. Sci. U.S.A. 105, 14908–14912. doi: 10.1073/pnas.0803506105
Benício, R. A., Provete, D. B., Lyra, M. L., Heino, J., Haddad, C. F. B., de Rossa-Feres, D. C., et al. (2021). Differential speciation rates, colonization time and niche conservatism affect community assembly across adjacent biogeographical regions. J. Biogeogr. 48, 2211–2225. doi: 10.1111/jbi.14145
Broennimann, O., Fitzpatrick, M. C., Pearman, P. B., Petitpierre, B., Pellissier, L., Yoccoz, N. G., et al. (2012). Measuring ecological niche overlap from occurrence and spatial environmental data. Glob. Ecol. Biogeogr. 21, 481–497. doi: 10.1111/j.1466-8238.2011.00698.x
Brown, J. L., and Carnaval, A. C. (2019). A tale of two niches: methods, concepts, and evolution. Front. Biogeogr. 11:e44158.
Buckley, L. B., and Jetz, W. (2007). Environmental and historical constraints on global patterns of amphibian richness. Proc. R. Soc. B Biol. Sci. 274, 1167–1173. doi: 10.1098/rspb.2006.0436
Cardoza-Martínez, G. F., Becerra-López, J. L., Esparza-Estrada, C. E., Estrada-Rodríguez, J. L., Czaja, A., Ehsan, M., et al. (2019). Shifts in climatic niche occupation in Astrophytum coahuilense (H. Möller) Kayser and its potential distribution in Mexico. Sustainability 11:1138. doi: 10.3390/su11041138
Colwell, R. K., and Rangel, T. F. (2009). Hutchinson’s duality: the once and future niche. Proc. Natl. Acad. Sci. U.S.A. 106, 19651–19658. doi: 10.1073/pnas.0901650106
Cordobés, F. M., Robbiati, F. O., Anton, A. M., and Scrivanti, L. R. (2021). Phylogeny, evolution and ecological speciation analyses of Imperata (Poaceae: Andropogoneae) in the Neotropics. Syst. Biodivers. 19, 526–543. doi: 10.1080/14772000.2021.1887959
Cuervo, P. F., Flores, F. S., Venzal, J. M., and Nava, S. (2021). Niche divergence among closely related taxa provides insight on evolutionary patterns of ticks. J. Biogeogr. 00, 1–12.
Di Cola, V., Broennimann, O., Petitpierre, B., Breiner, F. T., d’Amen, M., Randin, C., et al. (2017). ecospat: an R package to support spatial analyses and modeling of species niches and distributions. Ecography (Cop.) 40, 774–787. doi: 10.1111/ecog.02671
Djamali, M., Akhani, H., Khoshravesh, R., Andrieu-Ponel, V., Ponel, P., and Brewer, S. (2011). Application of the global bioclimatic classification to Iran: implications for understanding the modern vegetation and biogeography. Ecol. Mediterr. 37, 91–114. doi: 10.3406/ecmed.2011.1350
Engler, J. O., Lawrie, Y., Cabral, J. S., Lens, L., and Martínez-Meyer, E. (2021). Niche evolution reveals disparate signatures of speciation in the ‘great speciator’ (white-eyes, Aves: Zosterops). J. Biogeogr. 48, 1981–1993. doi: 10.1111/jbi.14128
Fei, S., Desprez, J. M., Potter, K. M., Jo, I., Knott, J. A., and Oswalt, C. M. (2017). Divergence of species responses to climate change. Sci. Adv. 3:e1603055. doi: 10.1126/sciadv.1603055
Gaston, K. J. (2003). The Structure And Dynamics Of Geographic Ranges. Oxford: Oxford University Press.
Gholizadeh, H., Naqinezhad, A., and Chytrı, M. (2020). Classification of the Hyrcanian forest vegetation, Northern Iran. Appl. Veg. Sci. 23, 107–126. doi: 10.1007/s10661-017-5778-9
Ghorbanian, A., Kakooei, M., Amani, M., Mahdavi, S., Mohammadzadeh, A., and Hasanlou, M. (2020). Improved land cover map of Iran using Sentinel imagery within Google Earth Engine and a novel automatic workflow for land cover classification using migrated training samples. ISPRS J. Photogramm. Remote Sens. 167, 276–288. doi: 10.1016/j.isprsjprs.2020.07.013
Glennon, K. L., Ritchie, M. E., and Segraves, K. A. (2014). Evidence for shared broad-scale climatic niches of diploid and polyploid plants. Ecol. Lett. 17, 574–582. doi: 10.1111/ele.12259
Gotelli, N. J., Graves, G. R., and Rahbek, C. (2010). Macroecological signals of species interactions in the Danish avifauna. Proc. Natl. Acad. Sci. U.S.A. 107, 5030–5035. doi: 10.1073/pnas.0914089107
Goudarzi, F., Hemami, M.-R., Malekian, M., Fakheran, S., and Martínez-Freiría, F. (2021). Species versus within-species niches: a multi-modelling approach to assess range size of a spring-dwelling amphibian. Sci. Rep. 11:597. doi: 10.1038/s41598-020-79783-0
Goudarzi, F., Hemami, M.-R., Rancilhac, L., Malekian, M., Fakheran, S., Elmer, K. R., et al. (2019). Geographic separation and genetic differentiation of populations are not coupled with niche differentiation in threatened Kaiser’s spotted newt (Neurergus kaiseri). Sci. Rep. 9, 1–12.
Graham, C., Ron, S., Santos, J., Schneider, C., and Moritz, C. (2004). Integrating phylogenetics and environmental niche models to explore speciation mechanisms in dendrobatid frogs. Evolution 58, 1781–1793. doi: 10.1111/j.0014-3820.2004.tb00461.x
Grossman, J. J. (2021). Evidence of constrained divergence and conservatism in climatic niches of the temperate maples (Acer L.). Forests 12:535. doi: 10.3390/f12050535
Guisan, A., and Thuiller, W. (2005). Predicting species distribution: offering more than simple habitat models. Ecol. Lett. 8, 993–1009. doi: 10.1111/j.1461-0248.2005.00792.x
Guisan, A., Petitpierre, B., Broennimann, O., Daehler, C., and Kueffer, C. (2014). Unifying niche shift studies: insights from biological invasions. Trends Ecol. Evol. 29, 260–269. doi: 10.1016/j.tree.2014.02.009
Gutiérrez-Ortega, J. S., Salinas-Rodríguez, M. M., Ito, T., Pérez-Farrera, M. A., Vovides, A. P., Martínez, J. F., et al. (2020). Niche conservatism promotes speciation in cycads: the case of Dioon merolae (Zamiaceae) in Mexico. New Phytol. 227, 1872–1884. doi: 10.1111/nph.16647
Hof, C., Araújo, M. B., Jetz, W., and Rahbek, C. (2011). Additive threats from pathogens, climate and land-use change for global amphibian diversity. Nature 480, 516–519. doi: 10.1038/nature10650
Hu, J., and Jiang, Z. (2010). Predicting the potential distribution of the endangered Przewalski’s gazelle. J. Zool. 282, 54–63. doi: 10.1111/j.1469-7998.2010.00715.x
Hu, J., and Jiang, Z. (2012). Detecting the potential sympatric range and niche divergence between Asian endemic ungulates of Procapra. Naturwissenschaften 99, 553–565. doi: 10.1007/s00114-012-0933-1
Hu, J., Broennimann, O., Guisan, A., Wang, B., Huang, Y., and Jiang, J. (2016). Niche conservatism in Gynandropaa frogs on the southeastern Qinghai-Tibetan Plateau. Sci. Rep. 6:32624. doi: 10.1038/srep32624
Hu, J., Jiang, Z., Chen, J., and Qiao, H. (2015). Niche divergence accelerates evolution in Asian endemic Procapra gazelles. Sci. Rep. 5, 1–10. doi: 10.1038/srep10069
Hua, X., and Wiens, J. J. (2010). Latitudinal variation in speciation mechanisms in frogs. Evol. Int. J. Org. Evol. 64, 429–443. doi: 10.1111/j.1558-5646.2009.00836.x
Karger, D. N., Conrad, O., Böhner, J., Kawohl, T., Kreft, H., Soria-Auza, R. W., et al. (2017a). Climatologies at high resolution for the earth’s land surface areas. Sci. Data 4, 1–20. doi: 10.1080/17538947.2021.1966526
Karger, D. N., Conrad, O., Böhner, J., Kawohl, T., Kreft, H., Soria-Auza, R. W., et al. (2017b). Data from: climatologies at high resolution for the earth’s land surface areas. Dryad Digit. Repository 21, 1–25. doi: 10.3354/cr021001
Kidov, A. A., and Litvinchuk, S. N. (2021). Distribution and conservation status of the Hyrcanian wood frog (Rana pseudodalmatina) in Azerbaijan. Russ. J. Herpetol. 28, 87–107.
Kozak, K. H., and Wiens, J. (2006). Does niche conservatism promote speciation? A case study in North American salamanders. Evolution (N. Y). 60, 2604–2621. doi: 10.1554/06-334.1
Kozak, K. H., Graham, C. H., and Wiens, J. J. (2008). Integrating GIS-based environmental data into evolutionary biology. Trends Ecol. Evol. 23, 141–148. doi: 10.1016/j.tree.2008.02.001
Martínez-Freiría, F., Freitas, I., Zuffi, M. A. L., Golay, P., Ursenbacher, S., and Velo-Antón, G. (2020). Climatic refugia boosted allopatric diversification in western Mediterranean vipers. J. Biogeogr. 47, 1698–1713. doi: 10.1111/jbi.13861
McCormack, J. E., Zellmer, A. J., and Knowles, L. L. (2010). Does niche divergence accompany allopatric divergence in Aphelocoma jays as predicted under ecological speciation?: insights from tests with niche models. Evol. Int. J. Org. Evol. 64, 1231–1244. doi: 10.1111/j.1558-5646.2009.00900.x
Meirmans, P. G. (2021). Niche divergence contributes to geographical parthenogenesis in two dandelion taxa. J. Evol. Biol. 34, 1071–1086. doi: 10.1111/jeb.13794
Merow, C., Smith, M. J., and Silander, J. A. Jr. (2013). A practical guide to MaxEnt for modeling species’ distributions: what it does, and why inputs and settings matter. Ecography (Cop.) 36, 1058–1069. doi: 10.1111/j.1600-0587.2013.07872.x
Morales, N. S., Fernández, I. C., and Baca-González, V. (2017). MaxEnt’s parameter configuration and small samples: are we paying attention to recommendations? A systematic review. PeerJ 5:e3093. doi: 10.7717/peerj.3093
Moreno-Amat, E., Mateo, R. G., Nieto-Lugilde, D., Morueta-Holme, N., Svenning, J.-C., and García-Amorena, I. (2015). Impact of model complexity on cross-temporal transferability in Maxent species distribution models: an assessment using paleobotanical data. Ecol. Modell. 312, 308–317. doi: 10.1016/j.ecolmodel.2015.05.035
Najibzadeh, M., Ehl, S., Feldmeier, S., Pesarakloo, A., and Veith, M. (2021). Unequal sisters – past and potential future range development of Anatolian and Hyrcanian brown frogs. Zoology 144:125873. doi: 10.1016/j.zool.2020.125873
Najibzadeh, M., Gharzi, A., Rastegar-Pouyani, N., Rastegar-Pouyani, E., and Pesarakloo, A. (2017). Habitat suitability and patterns of sex-biased migration of the Iranian long-legged wood frog, Rana pseudodalmatina (Anura: Ranidae). Biologia (Bratisl) 72, 686–693. doi: 10.1515/biolog-2017-0074
Najibzadeh, M., Gharzi, A., Rastegar-Pouyani, N., Rastegar-Pouyani, E., and Pesarakloo, A. (2018). Genetic structure of the hyrcanian wood frog, Rana pseudodalmatina (Amphibia: Ranidae) using mtDNA gene sequences. Russ. J. Genet. 54, 1221–1228. doi: 10.1134/s1022795418100095
Nunes, L. A., and Pearson, R. G. (2017). A null biogeographical test for assessing ecological niche evolution. J. Biogeogr. 44, 1331–1343. doi: 10.1111/jbi.12910
Pearman, P. B., Guisan, A., Broennimann, O., and Randin, C. F. (2008). Niche dynamics in space and time. Trends Ecol. Evol. 23, 149–158. doi: 10.1016/j.tree.2007.11.005
Peñalver-Alcázar, M., Jiménez-Valverde, A., and Aragón, P. (2021). Niche differentiation between deeply divergent phylogenetic lineages of an endemic newt: implications for Species Distribution Models. Zoology 144:125852. doi: 10.1016/j.zool.2020.125852
Peterson, A. T. (2011). Ecological niche conservatism: a time-structured review of evidence. J. Biogeogr. 38, 817–827. doi: 10.1111/j.1365-2699.2010.02456.x
Peterson, A. T., and Holt, R. D. (2003). Niche differentiation in Mexican birds: using point occurrences to detect ecological innovation. Ecol. Lett. 6, 774–782. doi: 10.1046/j.1461-0248.2003.00502.x
Peterson, A. T., Soberón, J., and Sánchez-Cordero, V. (1999). Conservatism of ecological niches in evolutionary time. Science 285, 1265–1267. doi: 10.1126/science.285.5431.1265
Petitpierre, B., Kueffer, C., Broennimann, O., Randin, C., Daehler, C., and Guisan, A. (2012). Climatic niche shifts are rare among terrestrial plant invaders. Science 335, 1344–1348. doi: 10.1126/science.1215933
Phillips, S. J., and Dudík, M. (2008). Modeling of species distributions with Maxent: new extensions and a comprehensive evaluation. Ecography (Cop.) 31, 161–175. doi: 10.1111/j.0906-7590.2008.5203.x
Phillips, S. J., Anderson, R. P., and Schapire, R. E. (2006). Maximum entropy modeling of species geographic distributions. Ecol. Modell. 190, 231–259. doi: 10.1016/j.ecolmodel.2005.03.026
Purcell, C. K. Q., and Stigall, A. L. (2021). Ecological niche evolution, speciation, and feedback loops: Investigating factors promoting niche evolution in Ordovician brachiopods of eastern Laurentia. Palaeogeogr. Palaeoclimatol. Palaeoecol. 578:110555. doi: 10.1016/j.palaeo.2021.110555
Qiao, H., Escobar, L. E., and Peterson, A. T. (2017). Accessible areas in ecological niche comparisons of invasive species: recognized but still overlooked. Sci. Rep. 7, 1–9. doi: 10.1038/s41598-017-01313-2
Radosavljevic, A., and Anderson, R. P. (2014). Making better Maxent models of species distributions: complexity, overfitting and evaluation. J. Biogeogr. 41, 629–643. doi: 10.1111/jbi.12227
Raxworthy, C. J., Ingram, C. M., Rabibisoa, N., and Pearson, R. G. (2007). Applications of ecological niche modeling for species delimitation: a review and empirical evaluation using day geckos (Phelsuma) from Madagascar. Syst. Biol. 56, 907–923. doi: 10.1080/10635150701775111
Rodríguez-Rodríguez, E. J., Beltrán, J. F., Tejedo, M., Nicieza, A. G., Llusia, D., Márquez, R., et al. (2020). Niche models at inter-and intraspecific levels reveal hierarchical niche differentiation in midwife toads. Sci. Rep. 10, 1–11. doi: 10.1038/s41598-020-67992-6
Sagheb-Talebi, K., Pourhashemi, M., and Sajedi, T. (2014). Forests of Iran: A Treasure From The Past, A Hope For The Future. Berlin: Springer.
Schluter, D. (2009). Evidence for ecological speciation and its alternative. Science 323, 737–741. doi: 10.1126/science.1160006
Schoener, T. W. (1970). Nonsynchronous spatial overlap of lizards in patchy habitats. Ecology 51, 408–418.
Shcheglovitova, M., and Anderson, R. P. (2013). Estimating optimal complexity for ecological niche models: a jackknife approach for species with small sample sizes. Ecol. Modell. 269, 9–17. doi: 10.1016/j.ecolmodel.2013.08.011
Siadati, S., Moradi, H., Attar, F., Etemad, V., and Naqinezhad, A. (2010). Botanical diversity of Hyrcanian forests; a case study of a transect in the Kheyrud protected lowland mountain forests in northern Iran. Phytotaxa 7, 1–18.
Soberón, J. (2007). Grinnellian and Eltonian niches and geographic distributions of species. Ecol. Lett. 10, 1115–1123. doi: 10.1111/j.1461-0248.2007.01107.x
Sunday, J. M., Bates, A. E., and Dulvy, N. K. (2011). Global analysis of thermal tolerance and latitude in ectotherms. Proc. R. Soc. B Biol. Sci. 278, 1823–1830. doi: 10.1098/rspb.2010.1295
Swets, J. A. (1988). Measuring the accuracy of diagnostic systems. Science 240, 1285–1293. doi: 10.1126/science.3287615
Synes, N. W., and Osborne, P. E. (2011). Choice of predictor variables as a source of uncertainty in continental-scale species distribution modelling under climate change. Glob. Ecol. Biogeogr. 20, 904–914. doi: 10.1111/j.1466-8238.2010.00635.x
Tohidifar, M., Moser, M., Zehzad, B., and Ghadirian, T. (2016). Biodiversity of the Hyrcanian Forests: A Synthesis Report. Teheran: UNDP/GEF/FRWO Caspian Hyrcanian Forest Project, 41. doi: 10.13140/RG.2.2.31436.00649
Vaissi, S. (2021a). Design of protected area by tracking and excluding the effects of climate and landscape change: a case study using Neurergus derjugini. Sustainability 13:5645.
Vaissi, S. (2021b). Historic range dynamics in Kaisers’s mountain newt (Neurergus kaiseri): insights from phylogeographic analyses and species distribution modelling. Ecol. Evol. 11, 7622–7633. doi: 10.1002/ece3.7595
Van Dijk, A., Nakamura, G., Rodrigues, A. V., Maestri, R., and Duarte, L. (2021). Imprints of tropical niche conservatism and historical dispersal in the radiation of Tyrannidae (Aves: Passeriformes). Biol. J. Linn. Soc. 134, 57–67.
Wang, P., Liu, Y., Liu, Y., Chang, Y., Wang, N., and Zhang, Z. (2017). The role of niche divergence and geographic arrangement in the speciation of Eared pheasants (Crossoptilon, Hodgson 1938). Mol. Phylogenet. Evol. 113, 1–8. doi: 10.1016/j.ympev.2017.05.003
Warren, D. L., Glor, R. E., and Turelli, M. (2008). Environmental niche equivalency versus conservatism: quantitative approaches to niche evolution. Evol. Int. J. Org. Evol. 62, 2868–2883. doi: 10.1111/j.1558-5646.2008.00482.x
Warren, D. L., Glor, R. E., and Turelli, M. (2010). ENMTools: a toolbox for comparative studies of environmental niche models. Ecography (Cop.) 33, 607–611.
Warren, D. L., Matzke, N. J., Cardillo, M., Baumgartner, J. B., Beaumont, L. J., Turelli, M., et al. (2021). ENMTools 1.0: an R package for comparative ecological biogeography. Ecography (Cop.) 44, 504–511. doi: 10.1111/ecog.05485
Wei, S., Li, Z., Momigliano, P., Fu, C., Wu, H., and Merilä, J. (2020). The roles of climate, geography and natural selection as drivers of genetic and phenotypic differentiation in a widespread amphibian Hyla annectans (Anura: Hylidae). Mol. Ecol. 29, 3667–3683. doi: 10.1111/mec.15584
Wells, K. D. (2010). The ecology And Behavior Of Amphibians. Chicago, IL: University of Chicago Press.
Wiens, J. J. (2004). Speciation and ecology revisited: phylogenetic niche conservatism and the origin of species. Evolution (N. Y) 58, 193–197. doi: 10.1111/j.0014-3820.2004.tb01586.x
Wiens, J. J., Ackerly, D. D., Allen, A. P., Anacker, B. L., Buckley, L. B., Cornell, H. V., et al. (2010). Niche conservatism as an emerging principle in ecology and conservation biology. Ecol. Lett. 13, 1310–1324. doi: 10.1111/j.1461-0248.2010.01515.x
Wiens, J. J., and Donoghue, M. J. (2004). Historical biogeography, ecology and species richness. Trends Ecol. Evol. 19, 639–644. doi: 10.1016/j.tree.2004.09.011
Wiens, J. J., and Graham, C. H. (2005). Niche conservatism: integrating evolution, ecology, and conservation biology. Annu. Rev. Ecol. Evol. Syst. 36, 519–539. doi: 10.1146/annurev.ecolsys.36.102803.095431
Yin, X., Jarvie, S., Guo, W., Deng, T., Mao, L., Zhang, M., et al. (2021). Niche overlap and divergence times support niche conservatism in eastern Asia–Eastern North America disjunct plants. Glob. Ecol. Biogeogr. 30, 1990–2003. doi: 10.1111/geb.13360
Zhu, G., Yuan, X., and Fan, J. (2020). Insight into intraspecific niche divergence and conservatism in American horseshoe crabs (Limulus polyphemus). Glob. Ecol. Conserv. 22, e00896.
Keywords: amphibians, conservation, niche comparison, lineage speciation, hyrcanian forests
Citation: Vaissi S and Rezaei S (2022) Niche Divergence at Intraspecific Level in the Hyrcanian Wood Frog, Rana pseudodalmatina: A Phylogenetic, Climatic, and Environmental Survey. Front. Ecol. Evol. 10:774481. doi: 10.3389/fevo.2022.774481
Received: 29 September 2021; Accepted: 06 January 2022;
Published: 21 January 2022.
Edited by:
Mathew Samuel Crowther, The University of Sydney, AustraliaReviewed by:
Dan Cogalniceanu, Ovidius University, RomaniaGuinevere O. U. Wogan, Oklahoma State University, United States
Copyright © 2022 Vaissi and Rezaei. This is an open-access article distributed under the terms of the Creative Commons Attribution License (CC BY). The use, distribution or reproduction in other forums is permitted, provided the original author(s) and the copyright owner(s) are credited and that the original publication in this journal is cited, in accordance with accepted academic practice. No use, distribution or reproduction is permitted which does not comply with these terms.
*Correspondence: Somaye Vaissi, cy52YWlzc2lAcmF6aS5hYy5pcg==, orcid.org/0000-0003-3389-1877