 Chloe Chen-Kraus1*
 Njaratiana A. Raharinoro2
 Miravo A. Randrianirinarisoa2David J. Anderson3Richard R. Lawler4David P. Watts1
 Alison F. Richard1
- 1Department of Anthropology, Yale University, New Haven, CT, United States
- 2Mention Zoologie et Biodiversité Animale, Université d’Antananarivo, Antananarivo, Madagascar
- 3Department of Biology, Bowdoin College, Brunswick, ME, United States
- 4Department of Sociology and Anthropology, James Madison University, Harrisonburg, VA, United States
Human impacts on the natural world are increasing and are generally considered a threat to wildlife conservation and the persistence of species. However, not all human activities are antithetical to conservation and not all taxa are impacted in the same ways. Understanding how wildlife respond to human activities at the population and individual level will help inform management of landscapes where humans and wildlife can coexist. We examined the effects of anthropogenic activities on a critically endangered primate, Verreaux’s sifakas (Propithecus verreauxi), at a multiple-use reserve in southwest Madagascar. Specifically, we sought to determine which activities the sifakas perceived as disturbances, using the framework of the risk disturbance hypothesis (RDH). The RDH holds that animals will respond to perceived disturbances as they do to predation threats. We therefore predicted that sifakas would be more vigilant, spend more time in high forest strata, reduce their daily feeding time, and occur at lower densities in response to high levels of perceived disturbance. Using data on sifaka behavior and spatial distribution, and the frequencies of anthropogenic activities, we found that sifakas increased vigilance and their height above the ground in response to certain human-related activities, notably those of domestic dogs. Contrary to our predictions, however, we did not find a negative effect of anthropogenic activities on daily activity budgets or population density. The relationship between the occurrence of sifakas and the intensity of tree cutting was actually positive. Our results indicate that sifakas perceive certain anthropogenic activities as threats and respond with immediate behavioral shifts, but that these activities do not have a discernible negative impact on the reserve’s population at this time. These results suggest that lemur conservation can be successful even in areas that are subject to moderate human use.
Introduction
As human impacts on the natural world increase in scope and intensity, understanding the nuances of how human activities affect wildlife populations, especially those of high conservation concern, becomes increasingly important. Detailed information on how wildlife populations are affected by different types and intensities of human activities will inform landscape management plans that can better support both human use and wildlife conservation. The risk disturbance hypothesis (RDH) proposes that animals respond to some anthropogenic activities as they do to predation threats (Frid and Dill, 2002): they are analogous to predation risk because, in both situations, animals must navigate the trade-off between fitness-enhancing activities, such as foraging efficiently, and avoiding perceived risks. Animals facing anthropogenic disturbance should follow the strategy used by prey confronted with predators and respond when the disturbance stimulus crosses some threshold, after which response strength should increase in positive association with perceived risk. Testable predictions derived from the RDH help structure studies of disturbance ecology: animals facing higher perceived disturbance rates are predicted to: (1) spend more time being vigilant and less time foraging or engaging in other activities, (2) have poorer body condition, (3) exhibit lower reproductive success, and (4) occur at lower densities than animals facing less disturbance (Frid and Dill, 2002).
Testing whether animals respond in the predicted way to a potential disturbance stimulus sheds light on how they actually perceive stimuli. For example, certain roads have been found to disturb pronghorn antelopes (Antilocapra americana), which were more vigilant and fed less when close to them (Gavin and Komers, 2006). Similarly, prairie dogs (Cynomys ludovicianus) were disturbed by road traffic noise and responded with decreased above ground activity and foraging time and increased vigilance (Shannon et al., 2014). Iberian frogs (Rana iberica) occurred at lower densities close to human recreation areas and took longer to reoccupy places that humans approached multiple times rather than once (Rodríguez-Prieto and Fernández-Juricic, 2005).
The RDH has received little attention in the primatology literature, even though many non-human primate species live in landscapes shared with humans and are at risk of extinction due to anthropogenic pressures (Fuentes, 2012; Estrada et al., 2017). Various studies have examined differences in the occurrence or population density of primates in relation to habitat features assumed to be linked to anthropogenic disturbance intensities. These include comparisons of primate densities among areas of national parks with different logging histories (e.g., Kibale National Park: Mammides et al., 2009; Ranomafana National Park: Herrera et al., 2011) and between protected and unprotected forests (e.g., Rovero et al., 2015; McLester et al., 2019). Several studies have quantified disturbances and assessed the relationship with primate density (e.g., Cavada et al., 2019; Farris et al., 2019), but have not explicitly addressed the RDH.
Many studies have examined relationships between human disturbance and individual- or group-level measures such as diet (e.g., Cebus capucinus: McKinney, 2011; Ateles geoffroyi: Chaves et al., 2012), activity budgets (e.g., Ateles geoffroyi: Chaves et al., 2011; Chlorocebus djamdjamensis: Mekonnen et al., 2017), glucocorticoid levels (e.g., Lophocebus albigena: Jaimez et al., 2012; Alouatta pigra: Rangel-Negrín et al., 2014; Chlorocebus aethiops: Fourie et al., 2015), and parasite load (e.g., Indri indri: Junge et al., 2011; Avahi laniger, Eulemur rubiventer, Hapalemur aureus, Microcebus rufus, Propithecus edwardsi, and Prolemur simus: Bublitz et al., 2015). These studies typically involve comparisons of animals in broadly defined “disturbed” vs. “undisturbed” habitats (e.g., fragmented vs. continuous forests, protected vs. unprotected areas, forests close to vs. far from human settlement). Few studies measure frequencies of specific anthropogenic activities like trail usage or livestock grazing to determine which activities are perceived as disturbances. Recent work by Cañadas Santiago et al. (2019) examining the effects of anthropogenic noise on Mexican mantled howler monkeys (Alouatta palliata mexicana) is a notable exception. They found that human presence and noise had a measurable impact on vigilance levels, locomotion, and vocal behavior.
Analyses of the effects of anthropogenic activities at multiple scales, spanning individual, group, and population, are rare, yet examining only population-level trends is problematic because more factors are likely in play than at the level of groups or individuals (Tablado and Jenni, 2017). Conversely, individual effects such as changes in behavior need to be interpreted cautiously. Changes in an animal’s behavior do not necessarily correspond to negative impacts on its welfare or conservation of the species to which it belongs (Beale, 2007). Testing predictions of the RDH related to multiple aspects of species ecology and at differing scales – and using data on actual disturbance frequencies, rather than making assumptions about disturbance – will help develop a more holistic understanding of the impacts of human disturbance on species.
We used the RDH to examine how anthropogenic activities affect Verreaux’s sifakas (Propithecus verreauxi), critically endangered lemurs found in southwest Madagascar, in a multiple-use protected area. Verreaux’s sifakas (hereafter, “sifakas”; Chen-Kraus et al., 2021) have been studied at Bezà Mahafaly Special Reserve (BMSR) for over three decades (Sussman et al., 2012), and the resulting long-term data and zoning of BMSR to allow various types and intensities of human use in different areas made the reserve an ideal place to conduct this research (Chen-Kraus, 2020).
Many reports indicate that the sifakas may indeed respond to humans and domestic animals as they do to natural predators. They growl or give their eponymous “tchi-fak” calls in response to terrestrial predators such as fossa (Cryptoprocta ferox) and roar at raptors (Fichtel and Kappeler, 2002), and all three vocalizations have been heard directed at domestic dogs and humans (personal observation). To assess more rigorously which anthropogenic activities sifakas at BMSR perceived as disturbances, we quantified frequencies of anthropogenic activities and tested predictions based on the RDH concerning sifaka vigilance, activity budget, forest strata use, and population density (Table 1). We generated contrasting predictions for areas/groups subjected to low or high disturbance (Table 1). Specifically, we predicted that sifakas would devote more time to vigilance and less to feeding (if they are hiding or fleeing from disturbances) with more frequent disruptive anthropogenic activities, and population density would be lower in those areas. Because sifakas are arboreal primates and human disturbance typically comes from the ground, we also predicted that animals facing frequent disruptive anthropogenic activities would spend more time in higher forest strata. We were committed to collecting only non-invasive data in this study, so were unable to measure body condition. Although non-invasive techniques for assessing body condition exist, such as measuring urinary C-peptide (Girard-Buttoz et al., 2011), we did not use them in this study, in part because of the very small volume of urine produced by these dry forest lemurs. Nor did we investigate the relationship between disturbance and reproductive success, given the long generation time of sifakas.
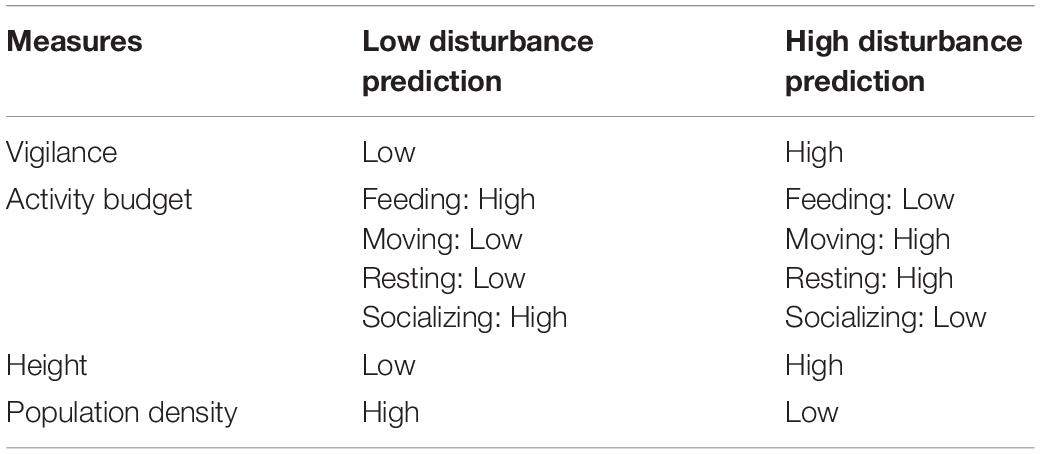
Table 1. Predictions about sifaka behavior and distribution following the risk disturbance hypothesis.
Materials and Methods
Study Site and Subjects
Bezà Mahafaly Special Reserve is located in southwest Madagascar, with its center at approximately 44.595°E and 23.681°S. Figure 1 shows the location of BMSR, zonation of the reserve, and locations of transects and study groups. BMSR has long been informally protected by local custom, with no hunting of lemurs and minimal harvesting of wood. The formal protected area was established in partnership with the surrounding communities 1986, comprising two separate parcels: Parcel 1, consisting of gallery and dry deciduous forest, and Parcel 2, made up of dry deciduous and spiny forest (Axel and Maurer, 2011; Richard and Ratsirarson, 2013). Both areas are designated as strictly protected zones, but Parcel 1 is the primary site of long-term research and receives better protection enforcement than Parcel 2. In 2015, BMSR was expanded to include new core areas where extractive practices were prohibited, sustainable-use zones where moderate extraction of forest resources was permitted, and buffer zones. We focused our research in the continuous dry deciduous forest portion of BMSR, as defined by Axel (2011), where the canopy is lower than in gallery forest abutting the Sakamena River to the east and dominant tree species include Acacia bellula (Fabaceae), Salvadora angustifolia (Salvadoraceae), Euphorbia tirucalli (Euphorbiaceae), and Grewia species (Malvaceae) (Axel, 2011). The dry forest area includes parts of the original Parcels 1 and 2 (P1 and P2), the northern new core (NC), and northwest sustainable use zone (SUZ; Figure 1). Limiting our study to a single forest type reduced the effects of variation in forest structure and productivity on sifaka behavior and distribution.
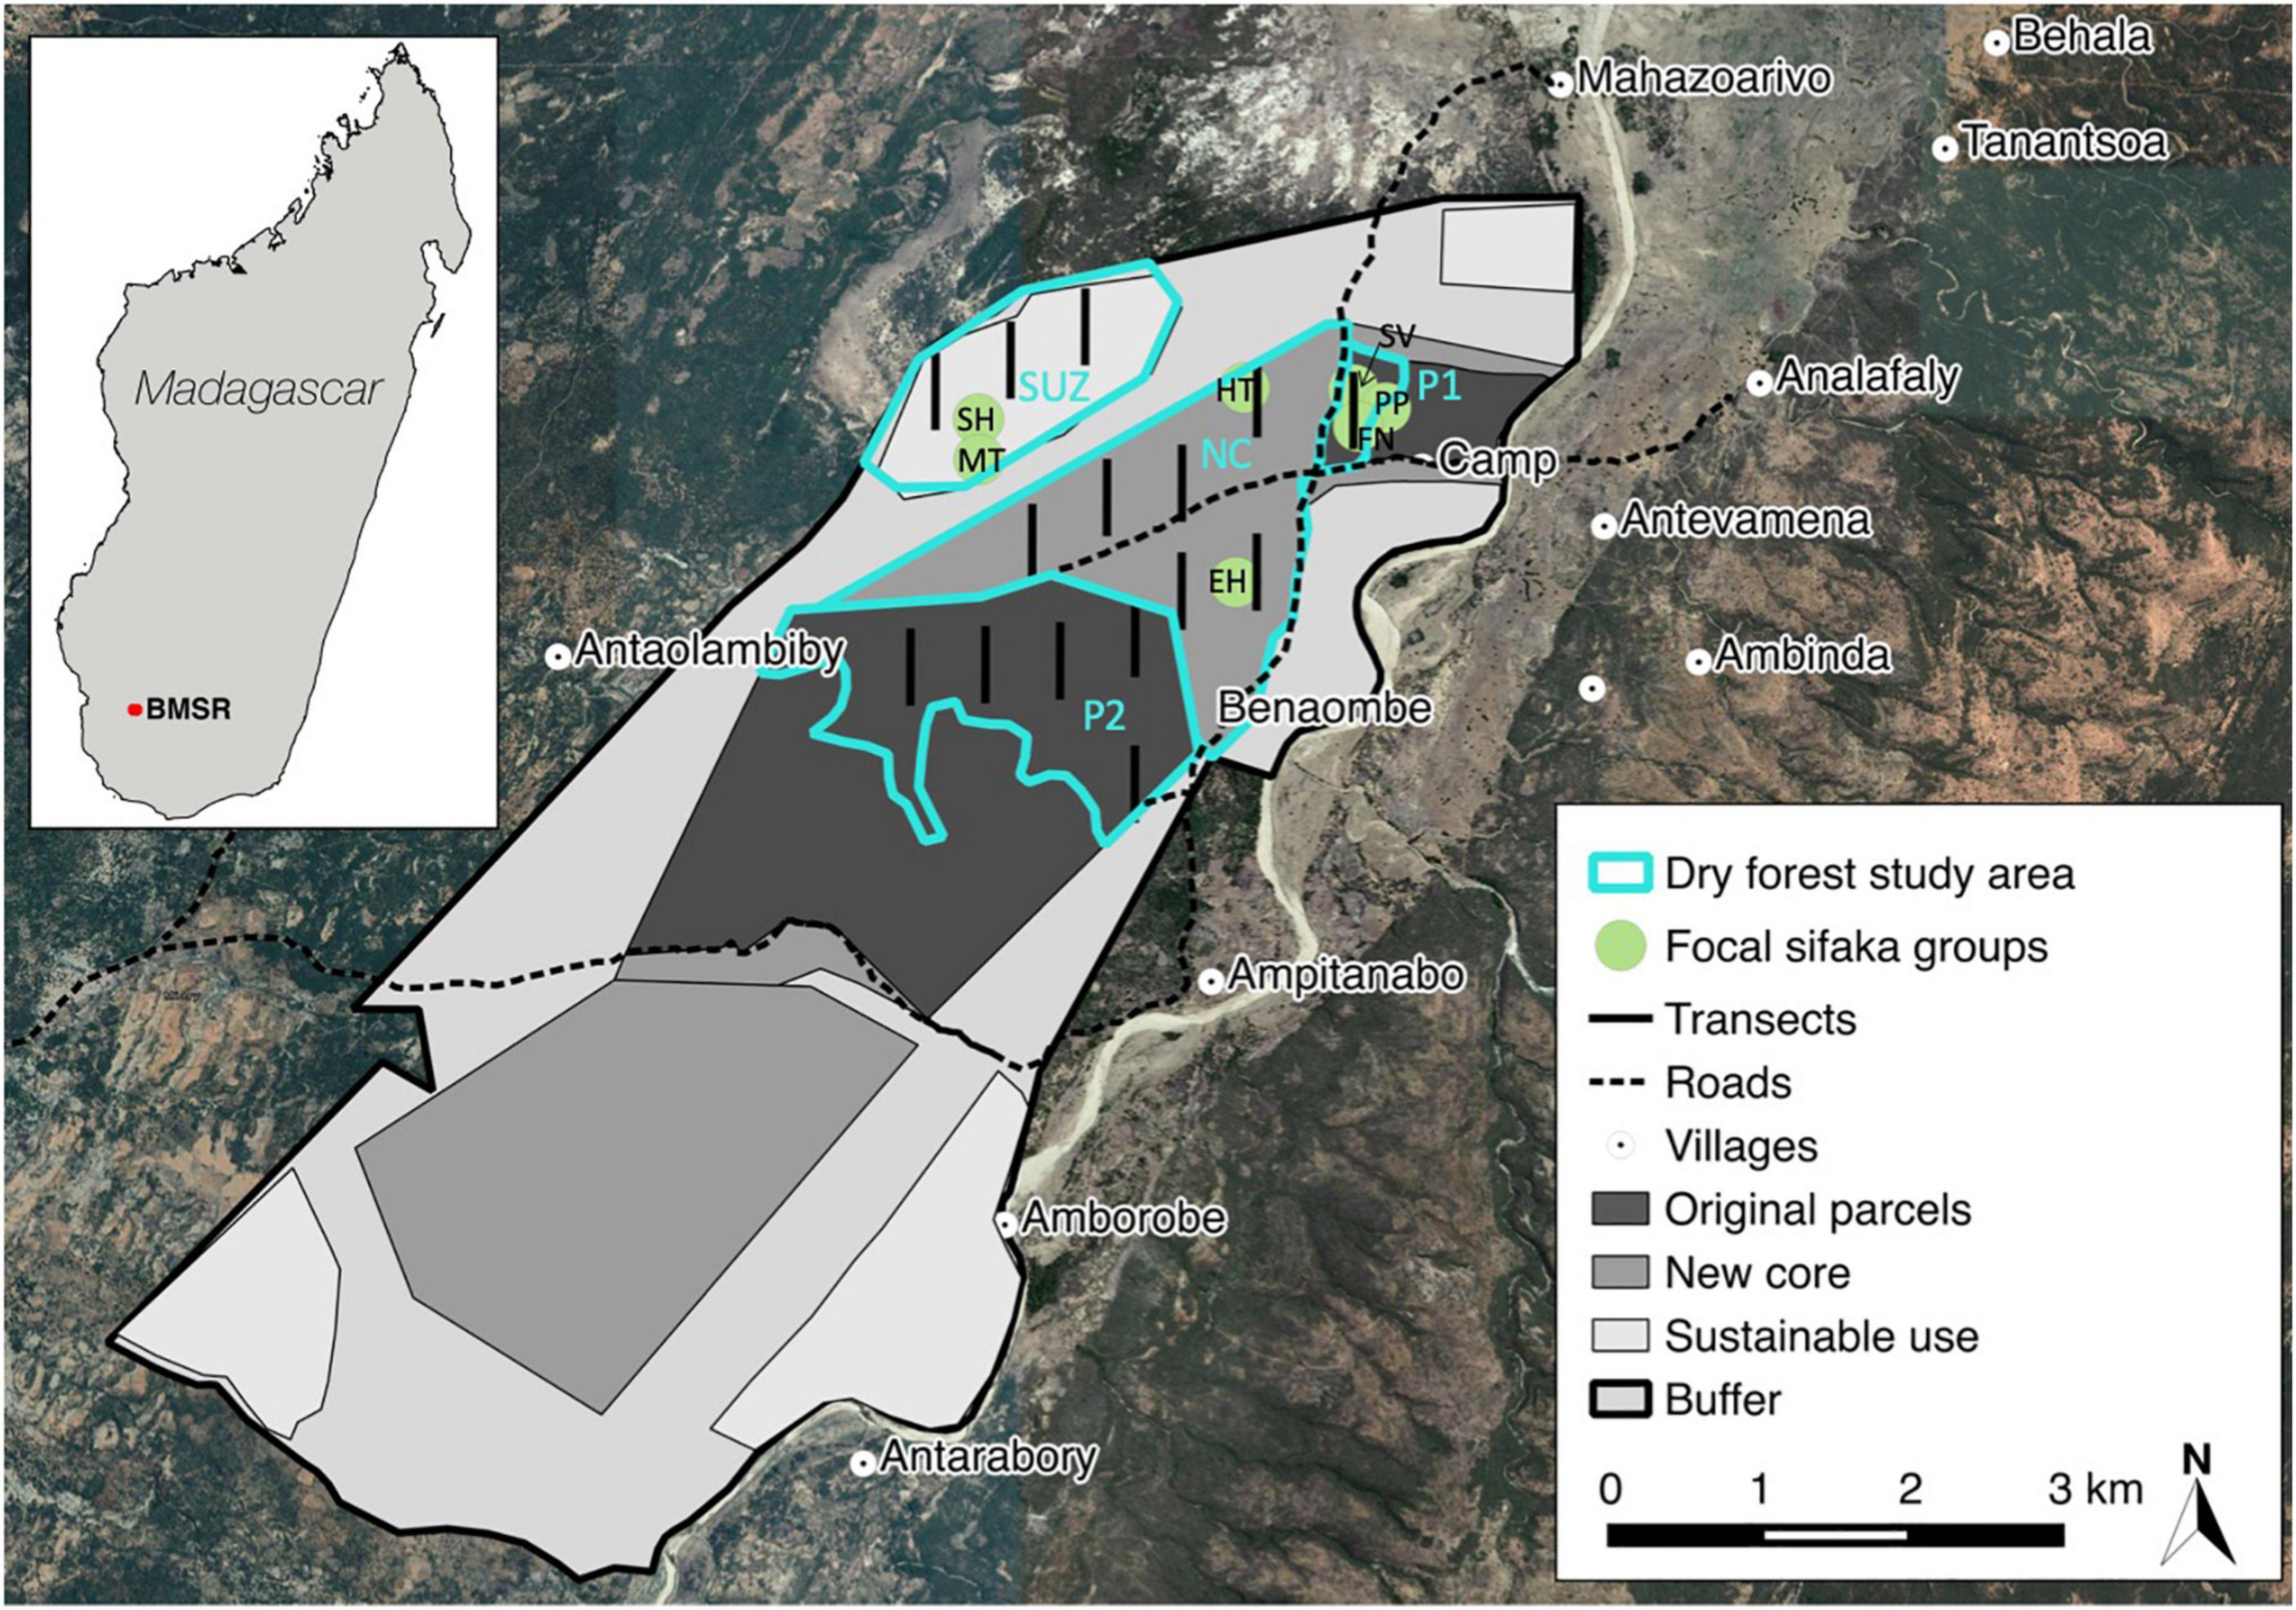
Figure 1. Map of Bezà Mahafaly Special Reserve (with Google satellite hybrid base map; 2019) showing management zonation, the dry forest study area (Axel and Maurer, 2011), home ranges of focal sifaka groups, placement of line transects, and roads and villages. Sifaka groups are noted on the map using the following abbreviations: PP, Papozy; SV, Sarvad; FN, Fanondrovery; HT, Hanitra; EH, Elahavelo; SH, Sotro Hazo; and MT, Mitady. Blue annotations mark the four study areas: P1, P2, NC, and SUZ.
Predators of sifakas at BMSR include Madagascar harrier hawks (Polyboroides radiatus), Madagascar buzzards (Buteo brachypterus), domestic dogs (Canis lupus familiaris), wildcats (Felis sp.), Dumeril’s ground boa (Acrantophis dumerili), and, occasionally, fossa (Cryptoprocta ferox) (Brockman et al., 2008; Richard et al., 2016; Sauther et al., 2020); however, previous research has not assessed variation in predation pressure across the reserve. People living in the villages surrounding BMSR use the forest in several key ways. They mostly travel by way of footpaths through the forest, although there are two main dirt roads that bisect the reserve (Figure 1). Zebu carts and bicycles are common on the roads, while cars are rare. Pastoralism is one of the main subsistence livelihoods in the region and people value the forest as a place to graze their goats, sheep, and zebu, and keep them safe from cattle rustlers. People also enter the forest to collect dry wood for fuel as well as fruits and medicinal plants (Richard and Ratsirarson, 2013).
Data Collection
Sifaka Behavior
We selected six focal sifaka groups (two in P1, two in NC, and two in SUZ) that were average or above-average size for the population as a whole (initially five to eight individuals; Richard et al., 1993), to maximize the number of study subjects. Groups Sarvad and Papozy, located in P1, were already habituated and included five and six individuals, respectively, at the study’s outset in July 2016. Because no groups outside P1 were habituated at that time, we located two new focal groups in SUZ (Sotro Hazo, n = 5, and Mitady, n = 8) and two in NC (Elahavelo, n = 5, and Hanitra, n = 7). After 1 week of full-day follows of each group, the sifakas responded to our presence in ways that resembled those of the habituated groups in P1: they ceased head-tossing and alarm calling at us, and generally seemed disinterested in our presence even when we were within 2–3 m. Between the initial habituation period and the start of data collection in June 2017, a BMSR guide spent 1 day each month following each group to note changes in composition and ensure animals remained accustomed to being followed. In June 2017 and June 2018, all data collectors (CCK, NAR, MAR, DJA) spent 1–3 full days with each newly habituated group before beginning data collection. This period also allowed us to practice collecting behavioral data and ensure that we were coding behaviors in the same way.
Eight weeks into data collection in 2017 we dropped group Sarvad from the study because it had lost three of its five members (two transferred to other groups and one died), and added an already habituated neighboring group, Fanondrovery, with seven individuals. For behavioral analyses, we combined the data from the first 8 weeks of data collection on Sarvad with data collected on Fanondrovery following the switch; we henceforth refer to this “group” as “SV-FN.” The two groups inhabited the same area of P1, had partially overlapping home ranges and were both close to the road, a major source of anthropogenic activity. We assumed that they faced similar anthropogenic activity types and frequencies and had access to similar food types. We could not test these assumptions, however, because we did not collect data on the two groups at the same time.
We recorded continuous behavioral data on all individuals over 1 year of age in each group during 198 days between June and November of 2017 and 2018. We watched each group an average of 261 h (range = 255.0–267.3 h) and recorded data on 51 individuals for a mean of 30.7 h of observation per individual (SD = 20.8). In 2017, CCK and NAR collected data with the assistance of a BMSR guide. In 2018, we worked in two teams, with the help of two additional field assistants (MAR and DJA) and an additional guide, recording data on two separate sifaka groups each day. At the start of each field season and weekly thereafter, we recorded data on the same individuals at the same time in order to confirm high inter-observer reliability.
Two observers in a team alternated data collection throughout the day using 20-min continuous focal samples, rotating sampling among group members so that both observers watched each animal at least twice per day. We recorded data on the focal animal’s behavioral state (feeding, moving, resting, and socializing) and on behavioral events like vigilance and alarm calling (Table 2), using the Animal Observer application (Caillaud, 2012) on iPads. For feeding and resting, the two behavioral states comprising most of the activity budget, we estimated the animal’s height above the ground in 2.5 m intervals (terrestrial, > 0–2.5 m, > 2.5–5 m, > 5–7.5 m, etc.). When the focal animal stopped its activity suddenly, became alert—with eyes wide and body stiff—and fixed its gaze in a particular direction for > 3 s, we recorded this as vigilance. Vigilance events were rare and always brief (almost always less than 10 s), which is why they were recorded as behavioral events, not states. Sometimes vigilance was accompanied by an alarm call (Fichtel and Kappeler, 2011). We did not record aerial-directed vigilance, since our focus was on vigilance events in response to anthropogenic activities on the ground.

Table 2. Definitions of behaviors included in the analyses.
Recording the duration of behavioral states is complicated during continuous behavioral sampling because it can be unclear when states like “resting” or “moving” begin and end, especially since animals often pause or move briefly before resuming an activity. We used “inactive” as a place-holder category when the focal animal paused. We later re-coded “inactive” states using the following procedures: (1) We re-coded “inactive” periods lasting less than 10 s between moving states as “moving,” and those less than 10 s between feeding on the same plant as “feeding.” (2) We re-coded all other inactive states as “resting.” (3) Because the animals often moved briefly during long bouts of feeding or resting, we re-coded moving states shorter than 10 s that fell between either feeding on the same plant or between resting bouts as “feeding” or “resting,” respectively. We included behavioral events that only lasted several seconds in the behavioral state preceding the event for our analysis of activity budget.
Sifaka Spatial Distribution and Density
We stratified the dry forest study area by management zone and created a 500m fishnet grid over each zone, using ArcGIS (version 10.2.2). We then established 15 random points (P1: n = 1, NC: n = 6, P2: n = 5, SUZ: n = 3) along the north-south grid lines as start points for line transects, with a minimum distance of 500m between neighboring transects, approximating the upper limit of sifaka home range diameter at BMSR (Ratoniherison, 2015). While this does not entirely eliminate the possibility of detecting the same group on more than one transect during a survey, we minimized this possibility by surveying neighboring transects within several hours of each other.
Two team members conducted surveys along the 15 transects every other month between August 2016 and June 2018. Surveyors walked the transects in the morning (between 06:30 and 12:00 h, a time of high sifaka activity), at a pace of ∼1.5 km/hr (following Ross and Reeve, 2011). Although the forest at BMSR is relatively low, with less foliage and higher lemur densities than at other sites, sifakas can be very quiet and inconspicuous. To increase the distance from the transect at which we could detect animals, we imitated sifaka “lost calls,” to which they respond with either their own lost call or a “tchi-fak call” (Fichtel and Van Schaik, 2006). The lead surveyor (a BMSR guide with over 25 years of experience censusing sifakas) imitated a lost call every 50 m along the transect and, when the survey team saw or heard a group, they noted their current location on the transect and went to find it. Surveyors marked the GPS location of the approximate center of the group and recorded the number of individuals, the sex and age-class of each, and the cue to detection (call or sight). They spent no more than 10 min collecting these data before returning to the marked location on the transect and continuing to walk (following Müller et al., 2000).
Anthropogenic Activities
We recorded all instances of the four major categories of potential disturbance due to anthropogenic activity that we saw or heard during sifaka focal observations: (1) presence and activities of humans other than the observers, (2) presence and movements of livestock, (3) presence of domestic dogs, which often accompany people and livestock herds, and (4) sound of vehicles (including cars and zebu carts). We recorded these in conjunction with behavioral changes using Animal Observer. Recording auditory signs of human-related activities allowed us to record more events that were likely perceived by, and potentially disruptive to, the sifakas than what we could detect visually (see also Chen-Kraus, 2020). Some had extended durations (e.g., presence of a livestock herd). When this occurred during a 20-min sampling period, we counted it as a single record even if it lasted for the entire sample duration. Similarly, if we heard the livestock first, and then detected them visually within the same sampling period, we recorded the disturbance only once. If the activity was still ongoing during the next sample period, we counted it as a new record. If two or more such episodes occurred in the same sample period (e.g., the sifakas encountered a livestock herd, moved away, and then encountered another herd), we counted these as separate records. We were unable to capture the same level of detail for human activities along transects. Instead, during each survey between April 2017 and June 2018 we recorded the number of tree stems cut within 5 m of the transect line during the previous 2 months as a proxy for the intensity of human use.
Data Analysis
Sifaka Behavior
We performed all data analyses using R version 3.6.0 (R Core Team, 2019). To examine the impact of anthropogenic activities on vigilance, we coded vigilance as a binary variable for each 20-min focal period (n = 4700), which was necessary to reduce issues with data being skewed toward no or few vigilance events per sampling period. We ran a binomial generalized linear mixed effects model (GLMM) using the “nlme” package with the frequency of the four activity types (human, vehicle, livestock, and dog) and sifaka group ID as fixed effects and individual ID as a random effect.
Because we recorded the height of the focal animal in 2.5 m intervals only during feeding and resting states, we coded the heights of all other behaviors as the last recorded height class of the animal during the focal period. We calculated mean height for each 20-min focal using the mid-point values for each height class record (e.g., 3.75 m for the 2.5–5 m height class), accounting for the duration of time the animal was in each height class (Chen-Kraus, 2020). Average height was relatively normally distributed. We ran a maximum likelihood linear mixed effects model (LMM) for average height per focal (n = 4698) using the “nlme” package in R with the frequency of the four anthropogenic activity types and group ID as fixed effects and individual ID as a random effect.
Group members commonly appeared to synchronize their behavior, and so we aggregated the time focal individuals spent in each of the four behavioral states during each focal day and calculated the proportion of time the group as a whole spent feeding, moving, resting, and socializing. Here we only analyze the proportion of time spent feeding, because the proportions of time devoted to the four states were statistically inter-dependent. The proportion of time spent feeding was relatively normally distributed. We ran a maximum likelihood LMM for the daily proportion of time feeding (n = 198) with the frequency of the four anthropogenic activity types as fixed effects and group ID as a random effect. We examined residual vs. fitted plots for all three models to make sure the error structure did not strongly deviate from normal.
Sifaka Spatial Distribution and Density
We used the measure tool in QGIS version 2.12.1 to measure the perpendicular distance between the GPS point of each sifaka group and the transect line. We right-truncated these data, using a 5% truncation distance to remove observations of groups farthest from the transect lines (Thomas et al., 2010). The truncation distance, w, is the half-width of the transect area in which we estimated the density of sifaka groups. We modeled detection with the “distance” package in R, using uniform key, half-normal key, and hazard-rate functions with cosine, simple polynomial, and Hermite polynomial adjustments (Thomas et al., 2010; Buckland et al., 2015). Because reliance on auditory cues allowed us to count groups farther from the transect than if we had relied on sight alone, we included cue type (call or sight) as a covariate in the models.
We used Akaike Information Criterion (AIC) values to identify the best (△AIC ≤ 2) model and Cramér-von Mises test statistics (Buckland et al., 2015) to test model fit. We used the “distance” package to calculate , the probability that a group within distance w of the transect was detected, for each model. For line transects is a value between 0 and 1 that is estimated by dividing the area under the curve of the detection function by the half-width of the transect survey area (w).
We then estimated density ( for each model using the following equation:
where, n is the number of animals detected, w is the truncation distance (the half-width of the transect area), L is the length of the transect, and is the probability of detection (Buckland et al., 2015).
We compared the estimated sifaka density for each zone with the total number of cut trees/km recorded in the zone during the study period to examine whether sifaka density co-varied with cutting intensity. Due to the small sample of zones (n = 4), we did not conduct statistical tests and simply present the raw counts of cut trees and estimates of sifaka density. Cutting intensities within zones varied considerably (Chen-Kraus, 2020), so we also assessed the relationship between the number of sifaka groups per transect and the frequency of cut trees per transect. Not all transects were surveyed an equal number of times, and we adjusted for effort by dividing the total number of encounters with sifaka groups on each transect by the number of times the transect was surveyed. We similarly calculated the average number of cut trees per transect per survey month. The sifaka group and cut tree data were not normally distributed, so we ran a Spearman rank correlation between the average number of cut trees and the adjusted numbers of sifaka groups.
Results
Sifaka Behavior
Vigilance
The frequency of dog, livestock, and human activities were all significant predictors of vigilance (Table 3). Sifakas were approximately three times more likely to be vigilant when they encountered dogs than when they were not experiencing any disturbance, twice as likely when livestock were present, and 1.6 times more likely when humans other than observers were present. Group identity also had a significant effect. Group Mitady was more likely than all others to exhibit vigilance. The among-individual standard deviation, a measure of the variance of the random effect, was 0.24.
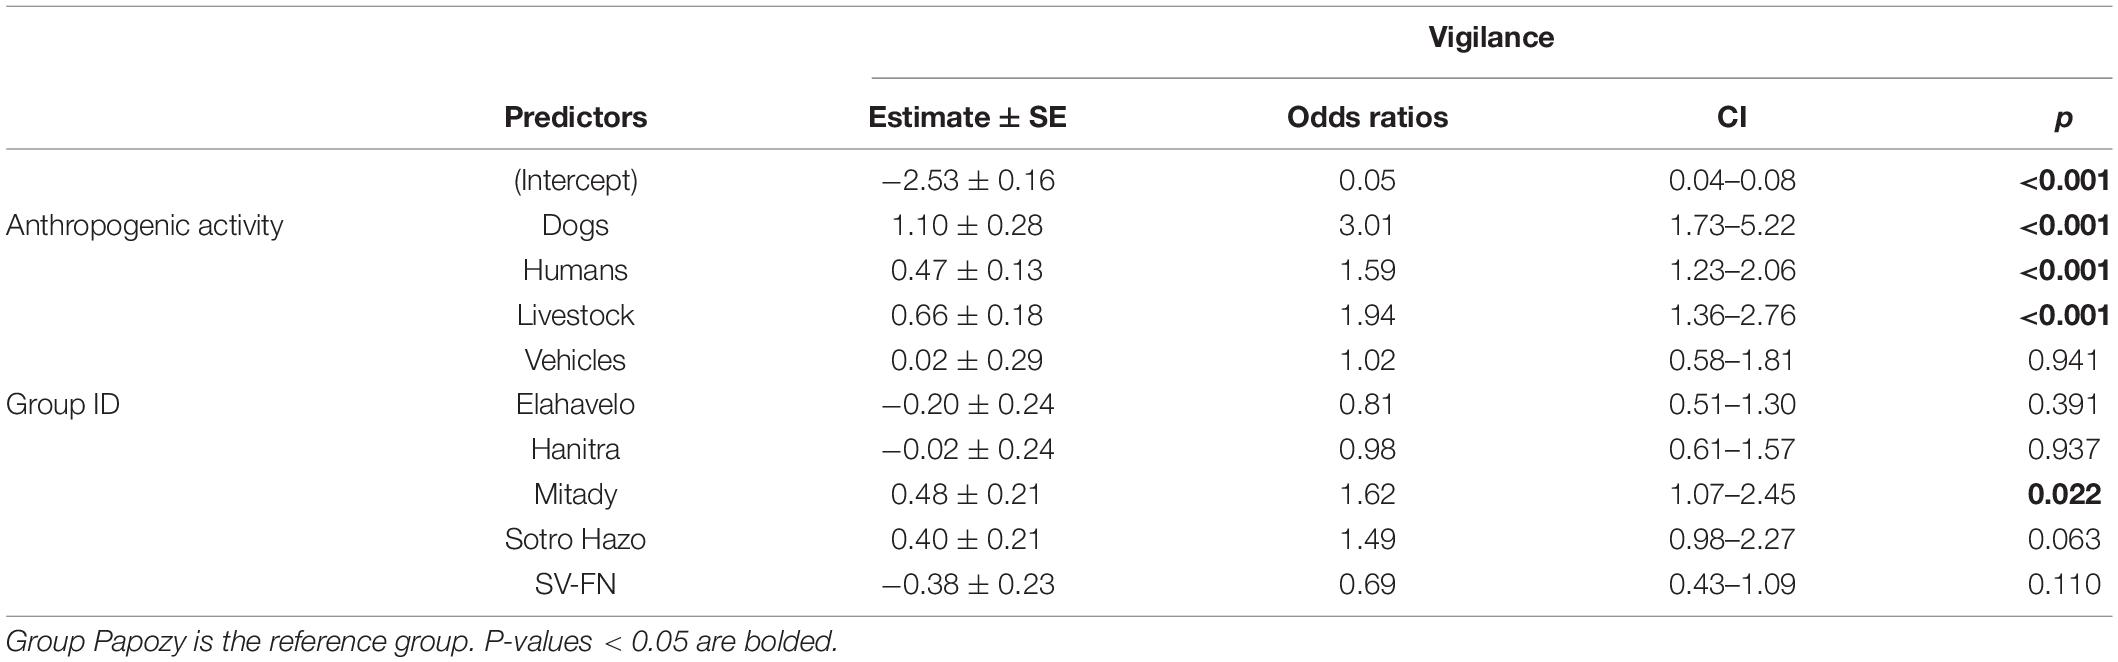
Table 3. Vigilance GLMM parameter estimates, including both raw and exponentiated (odds ratio) estimates.
Height Above Ground
The sifakas spent significantly more time high in trees than close to the ground when dogs were present. Other anthropogenic activity types were not significantly associated with variation in use of height strata (Table 4). The group effect was again significant. Group SV-FN spent more time at lower heights than all other groups while groups Elahavelo and Sotro Hazo spent more time at higher strata. The among-individual standard deviation in height was 0.29.
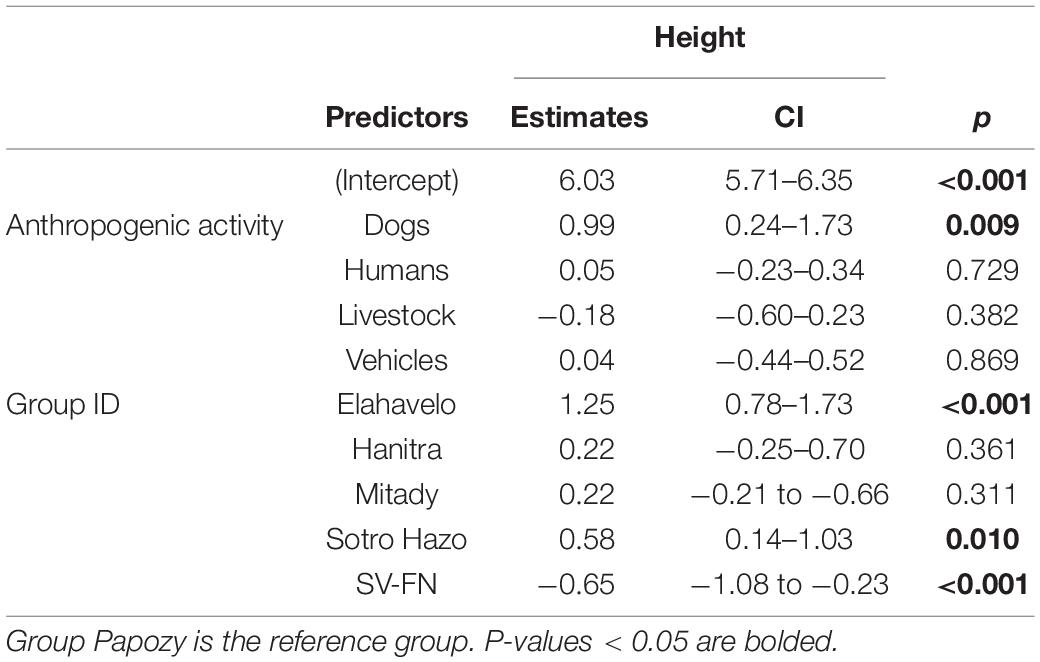
Table 4. Height LMM parameter estimates with 95% confidence intervals.
Activity Budget
The only significant fixed effect in the activity budget model was the frequency of vehicles. Contrary to our prediction the animals spent 1.7 times more time feeding during samples when we heard vehicles (Table 5). The among-group standard deviation in proportion time spent feeding was 3.29.

Table 5. Activity budget LMM parameter estimates.
Sifaka Spatial Distribution and Density
We covered 82.5 km during the transect surveys and encountered groups on 65 occasions, with peak detection within 5 m of the transects (Figure 2). We retained 61 group encounters in our sample, detected at a distance less than the truncation distance, w (98 m; Supplementary Table 1). The mean number of individuals detected per group was 4, with a range of 1–10. The number of groups detected along each transect was variable within zones (Supplementary Table 2).
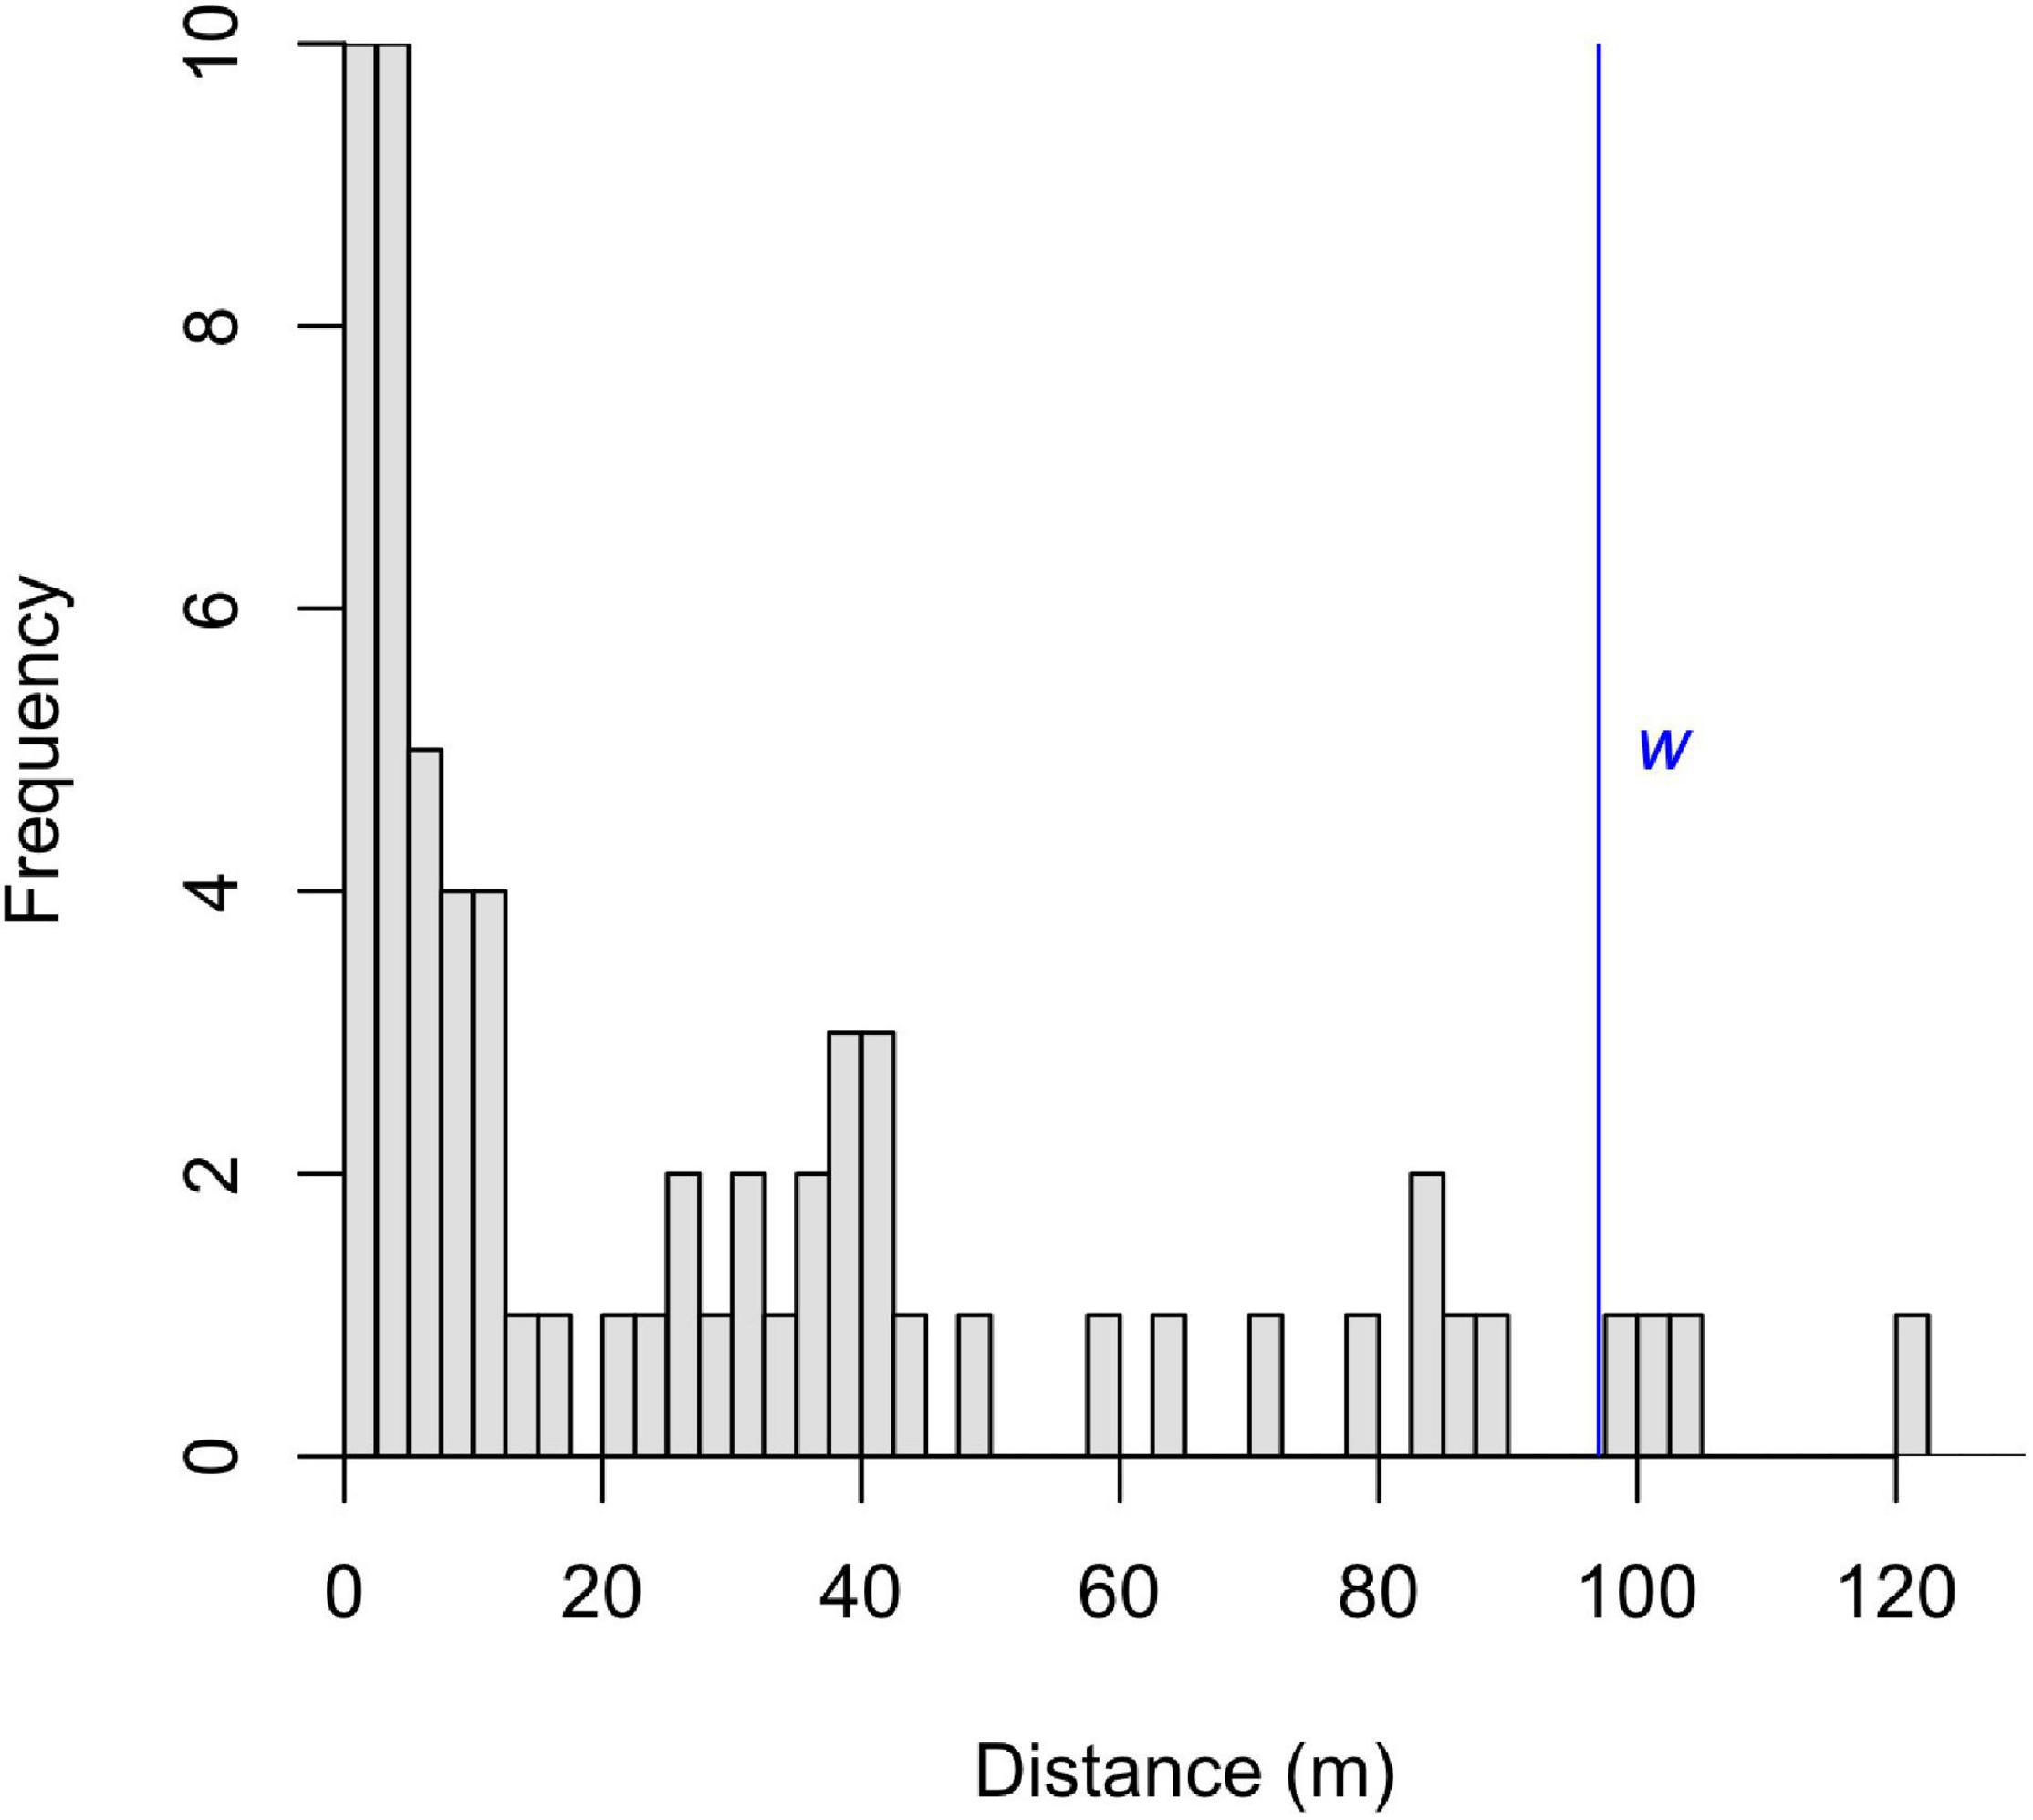
Figure 2. Detection frequency of all sifaka groups encountered during transect surveys based on the distance of each group from the transect line. Truncation distance, w, used to create detection functions is noted in blue.
The top detection model used a hazard-rate function with polynomial adjustment and included detection cue (call or sight) as a covariate (Supplementary Table 3 and Figure 3). The top model fit the data well (Cramér-von Mises goodness of fit test; ω2 = 0.075, p = 0.720). No other model received substantial support (Supplementary Table 3).
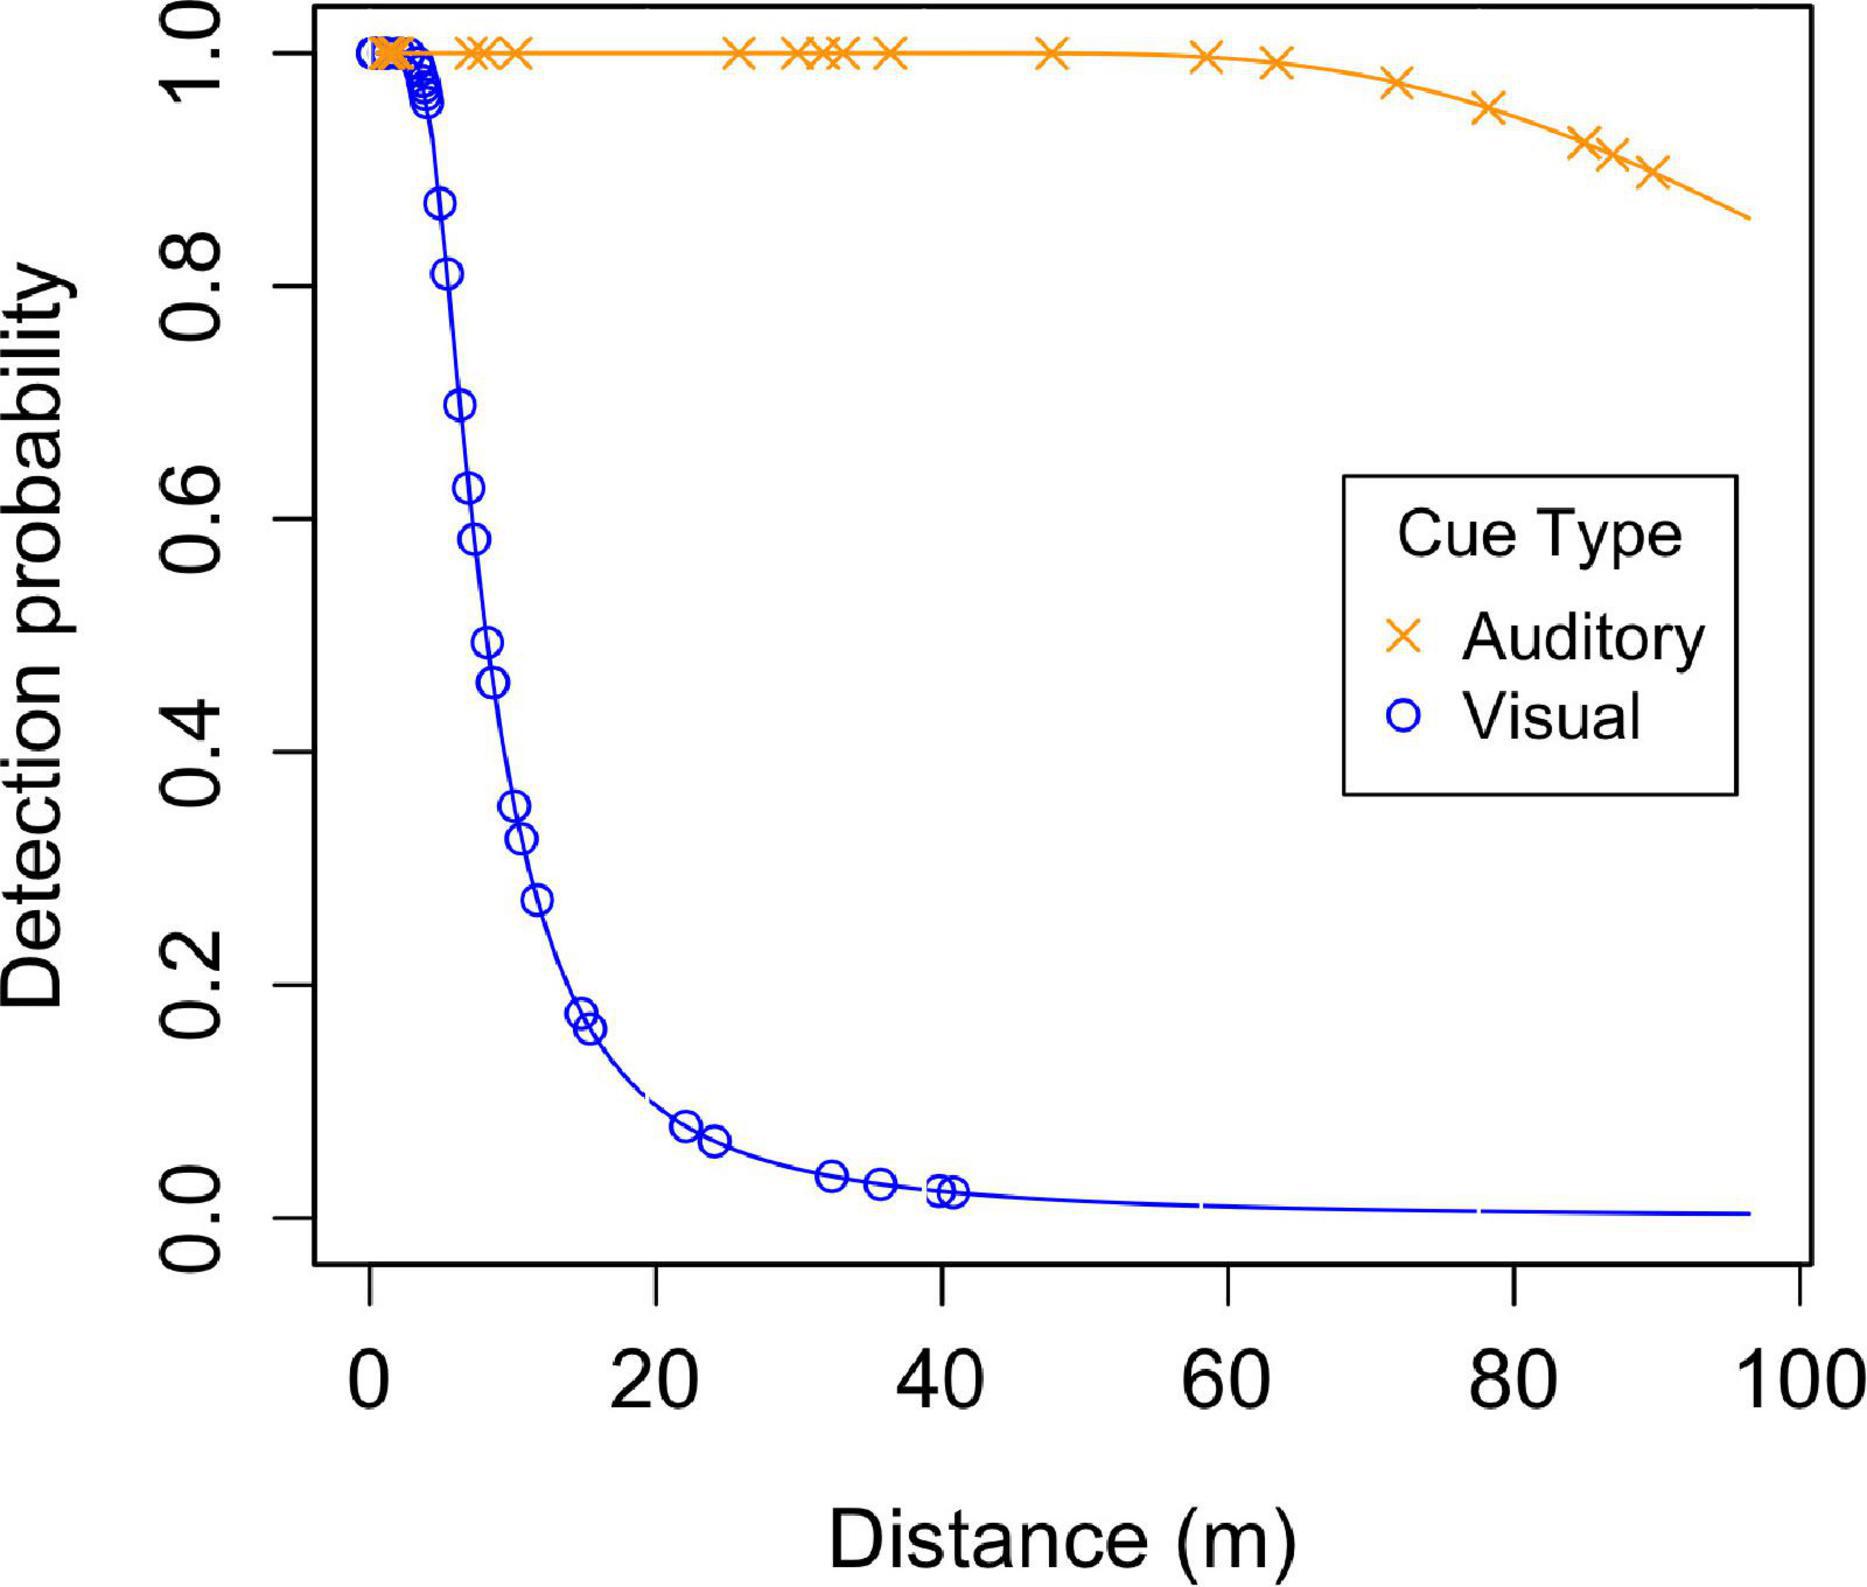
Figure 3. Detection probability functions based for the top detection model. The blue line with open circle data points indicates detection probability based on visual cues and the orange line with x data points represents detection based on auditory cues.
Based on the top model, sifaka density was highest in P1, followed by NC, and lowest in SUZ (Table 6). These results did not align with the inverse relationship predicted between sifaka density and tree cutting by zone. Estimated density was highest in P1 where cutting intensity was lowest, but was also high in NC, which had the highest cutting intensity.
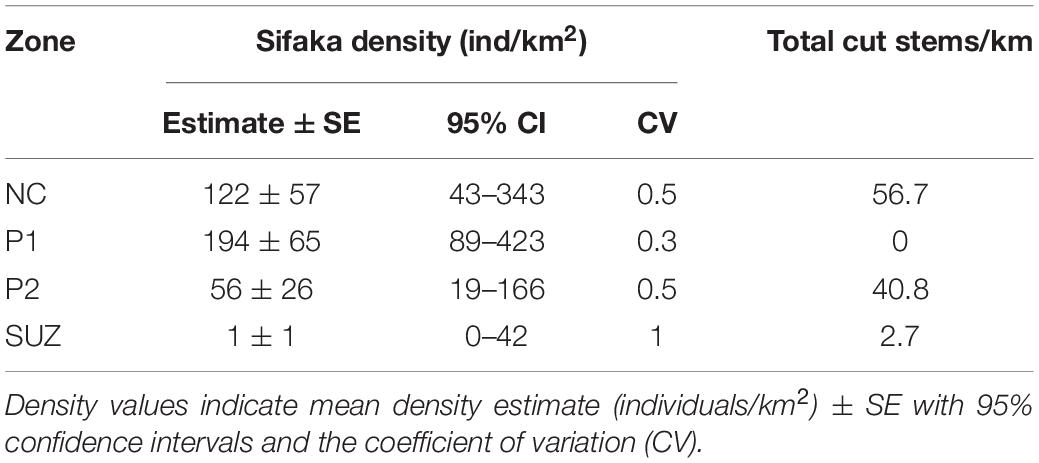
Table 6. Parameter estimates of the top ranked detection model (Hazard-rate model with polynomial adjustment and cue as a covariate) for estimating sifaka density compared to cut tree measures for each zone.
The average number of cut trees recorded per transect survey ranged from 0 to 9.75, while the number of groups per transect adjusted for the number of surveys ranged from 0 to 1.71. The correlation between the adjusted number of sifaka groups detected per survey and the number of cut trees per transect was statistically significant (R = 0.52, p = 0.048), but the direction of the relationship was positive, the opposite of what we expected (Figure 4). With the highest group density and no cut trees, P1 was an outlier.
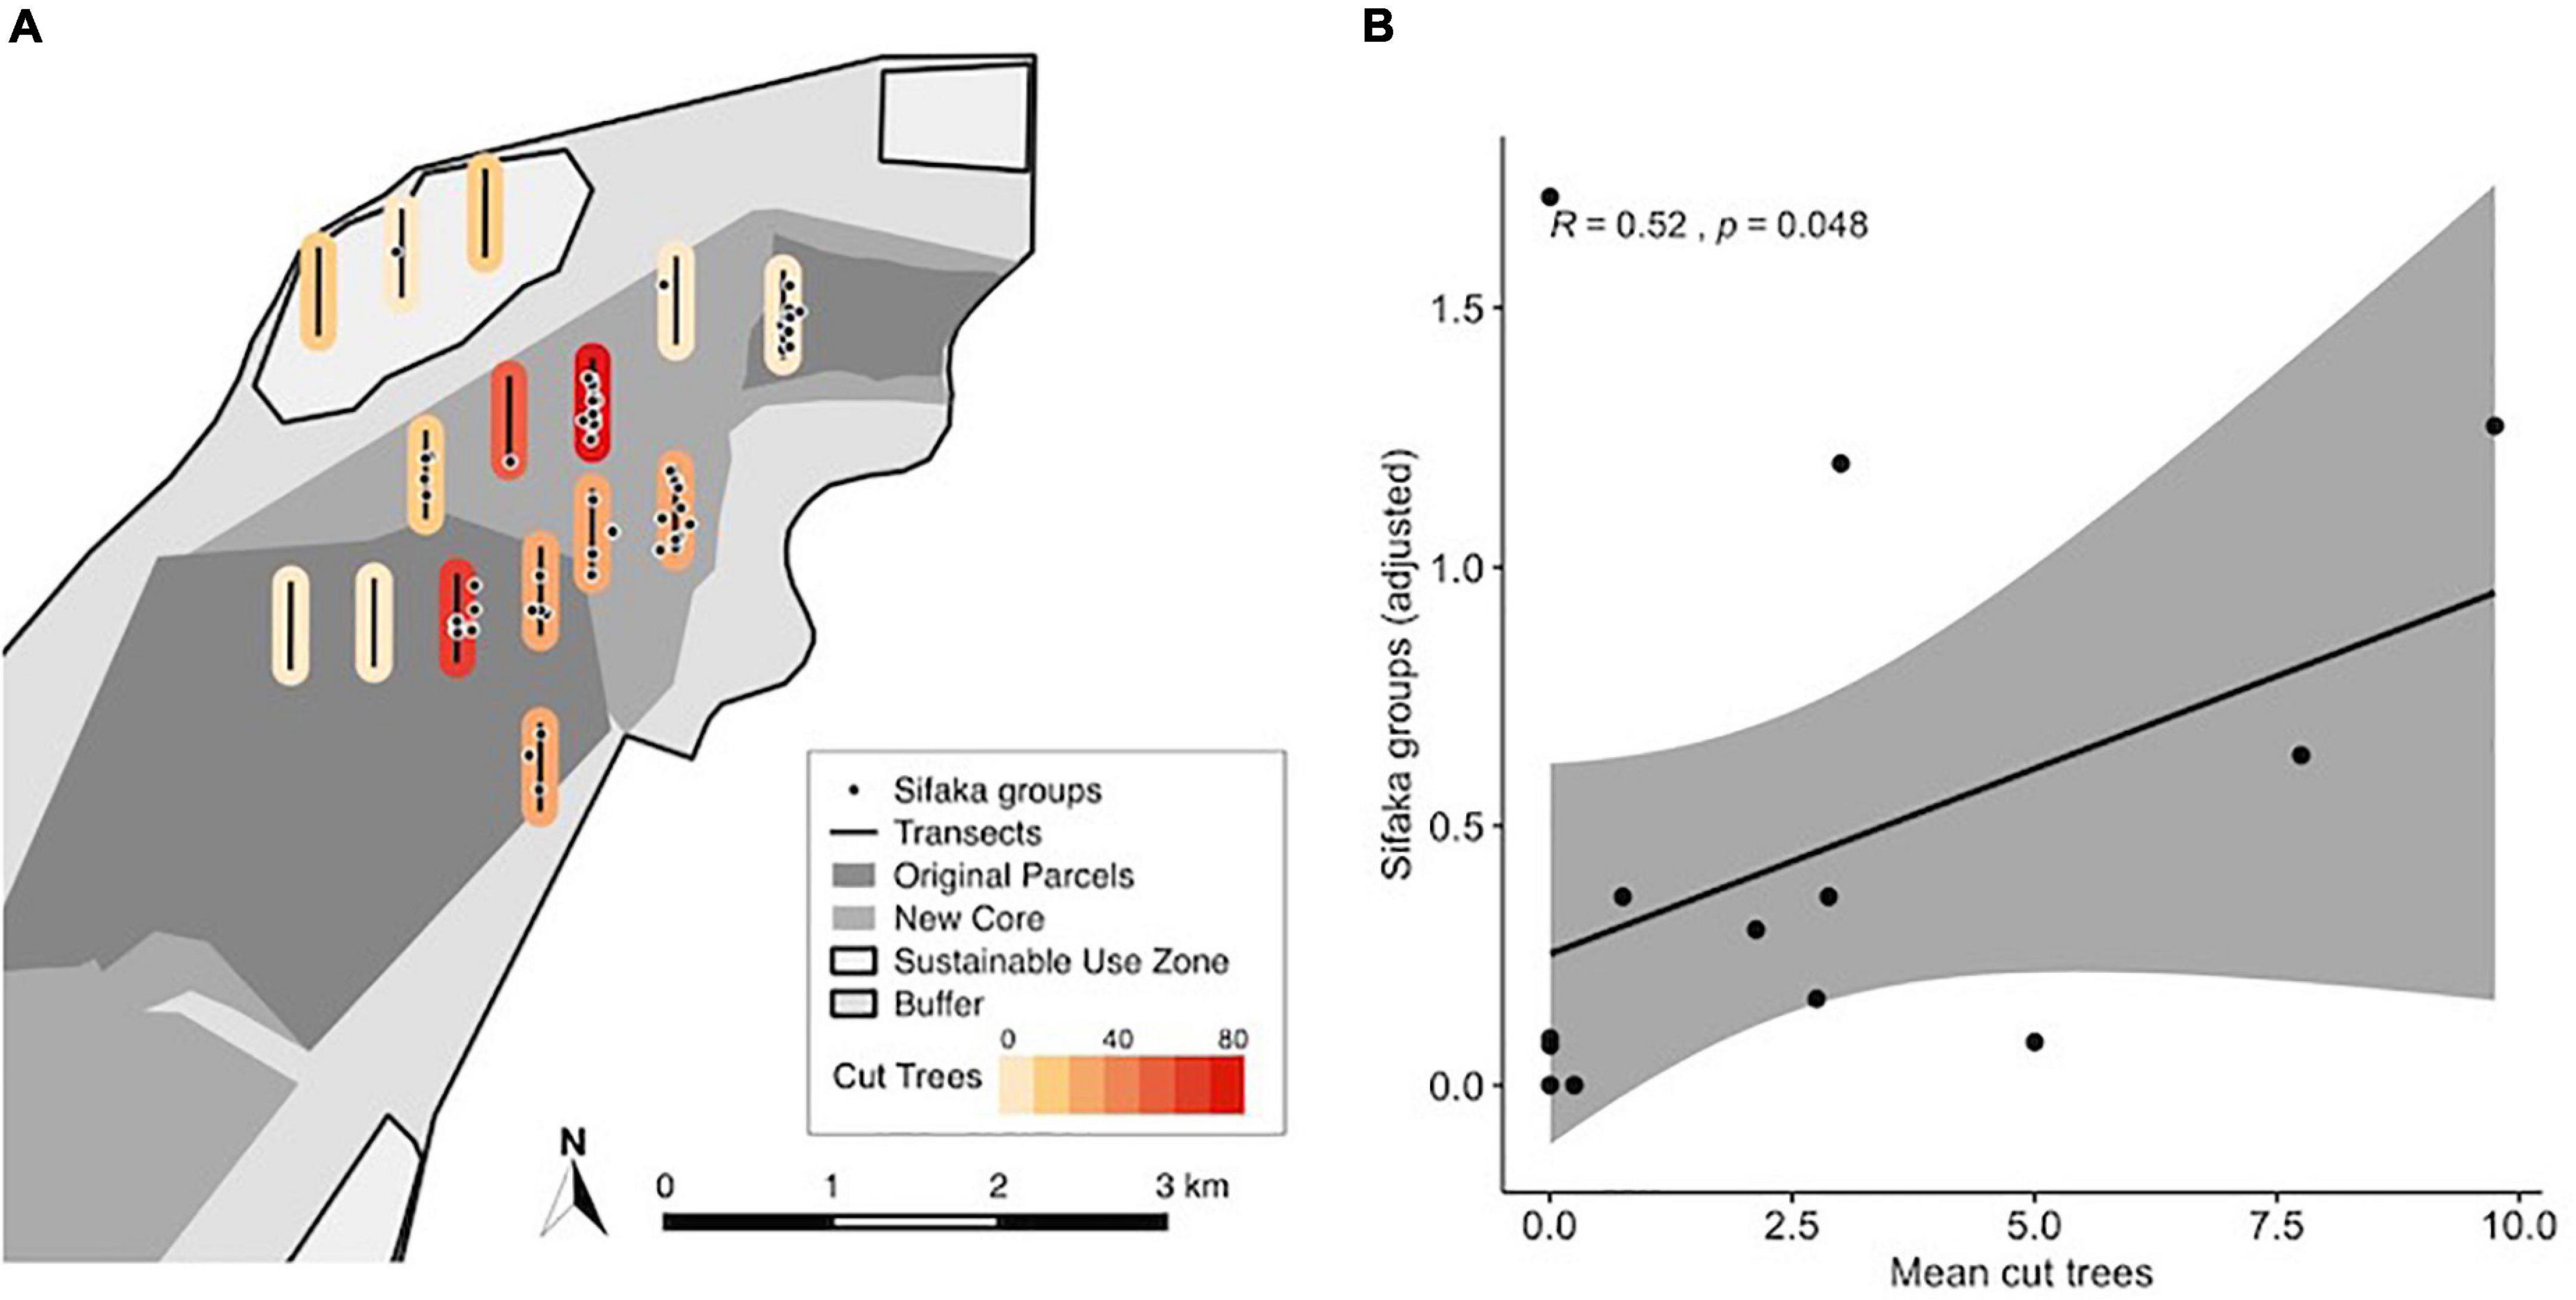
Figure 4. (A) Sifaka groups encountered during transect surveys with color indicating the intensity of cutting, as measured by the total number of cut trees detected, along each transect. (B) Spearman correlation between mean cut trees per survey and the mean number of sifaka groups detected along transects. Gray shaded area represents the 95% confidence interval.
Discussion
The RDH provided a useful framework for this study, although support for predictions derived from the hypothesis was mixed (Table 7). This suggests that sifakas at BMSR perceive some anthropogenic activities as disturbances, but are not threatened by others. They responded to the presence of dogs, livestock, and humans by becoming more vigilant (Table 7). The variation in effect sizes we found imply that sifakas perceived dogs as the highest threat, followed by livestock and then humans. The fact that only dogs affected their height in the trees (Table 7) also indicates that dogs were perceived as the most threatening disturbance. Researchers at Ranomafana National Park in eastern Madagascar identified a significant negative effect of dog presence on lemur occurrence, which they suggest may be due to harassment, predation and/or disease transmission (Farris et al., 2019). Even if sifakas are responding to dogs as true predation threats, we also view dogs as an anthropogenic disturbance since they would not be present in the area were it not for humans, and they tend to be in the forest because they are accompanying humans and livestock herds.

Table 7. Summary of predictions and results.
Although sifakas changed their behavior in response to some anthropogenic activities, we found no support for predictions regarding their overall activity budgets (Table 7). In particular, we did not find the expected decrease in feeding time in response to any anthropogenic activity type. Previous work addressing the impact of disturbance on feeding has produced inconsistent results. Chaves et al. (2011) found that spider monkeys (Ateles geoffroyi) spent more time feeding when they were in disturbed areas, but Mekonnen et al. (2017) reported the opposite for Bale monkeys (Chlorocebus djamdjamensis). In both these studies, the authors assumed forest fragments were “disturbed” and continuous forest “undisturbed.” Surprisingly, the frequency of vehicle noise had a significant positive relationship with the amount of time the sifakas spent feeding. This was almost certainly not a causal relationship, and probably resulted from some aspect of unmeasured ecological variation combined with proximity to roads. Groups Papozy, SV-FN, and Elahavelo spent more time feeding than other groups. They also were closest to roads, and heard vehicles more frequently than other groups did as a result. In contrast, feeding time was lowest for group Sotro Hazo, which was farthest from a road. Variation in feeding time likely resulted from variation in food abundance and quality: distance to the Sakamena River, on the eastern edge of BMSR, affects soil moisture and type (Ratsirarson and Sussman, 2006; Rifkin, 2018) and, probably, the quantity and quality of sifaka foods. Further research is needed to quantify fine-scale ecological variation across the sifaka home ranges, over and above human activities, to give a more complete picture of sifaka responses to human activities.
Habituation might have influenced our results if it made it less likely that the sifakas would respond to anthropogenic activities in general. Indeed, the goal of habituating animals in the first place is to reduce behavioral responses to researcher (human) presence (Williamson and Feistner, 2003). Because the groups in P1 had been habituated for decades longer than the groups in NC and SUZ, and habituation is an ongoing process, their tolerance thresholds to disturbance might have been higher (Bejder et al., 2009; Blumstein, 2016). Animals located outside the long-term study area and farther from roads might have been more fearful and changed their activities (e.g., fed less) on days we were with them because of less extensive histories of encounters. As a possible example of such an effect, Jack et al. (2008) found that wild white-faced capuchin monkeys (Cebus capucinus) in the less habituated of their study groups showed more agitation than those in better habituated groups, even after being followed for 4 weeks, though they did not assess differences in activity budgets. A different study of the same species that employed radiotelemetry, however, found that the presence of researchers did not affect activity budgets (Crofoot et al., 2010). It seems unlikely that differences in habituation had a significant impact on the sifakas’ behavior, since animals in all groups regularly fed and rested within 2–3 m of observers. Their responses surely differ from those of unhabituated animals outside the reserve, especially in areas where they are hunted, and unhabituated animals likely perceive a broader range of anthropogenic activities as threats. Group composition, particularly the presence of infants, also might influence responses to disturbance. Almost all groups had infants at the same time however, making a robust test of whether this occurs difficult without additional research.
Finally, groups might respond differently to anthropogenic activities for idiosyncratic reasons unrelated to habituation history. Groups Mitady and Sotro Hazo appeared more skittish than the others and were more likely to be vigilant, even when we could not detect any anthropogenic activity in the area. This difference could be related to the history of disturbance in SUZ prior to our study and the expansion of the reserve. Alternatively, group members might have been perceiving and responding to disturbances that we could not detect. Furthermore, sifakas in areas more extensively modified by humans may perceive a higher predation risk if the modifications result in higher visibility.
Our estimates of sifaka density for P1 are similar to the numbers of individuals counted during monthly censuses (Richard et al., 2016), but density estimates for other zones are low compared to point survey estimates (Axel and Maurer, 2011). We expected to under-estimate densities, due to missing some groups near the transect lines and under-counting the number of individuals in some detected groups. However, density might really have declined following several years of poor rainfall since the point surveys Axel and Maurer conducted in 2006-2007 (Axel and Maurer, 2011). Regardless of how our estimates compare to previous ones, we are confident that our detection of sifakas during transect surveys was consistent between the different areas and that estimates are comparable among zones.
Contrary to our predictions, density was not inversely related to the frequency of tree cutting (Table 7). The two zones with the highest densities (P1 and NC) had the lowest and highest frequencies of tree cutting, respectively. Unexpectedly, the relationship between the average number of sifaka groups and cut trees by transect was positive. This conflicts with findings for other primate species. For example, Cavada et al. (2019) found lower densities of Colobus angolensis palliates, Procolobus gordonorum, and Cercopithecus mitis monoides in areas with high human activity compared to less disturbed areas in the Udzungwa Mountains of Tanzania. Comparing lemur densities between two areas with different disturbance histories in Ranomafana National Park, however, Herrera et al. (2011) found no statistical difference in encounter rates with Propithecus edwardsi between a “disturbed” (formerly logged) site and an unlogged site.
There are several potential, non-mutually exclusive, explanations for the positive relationship between sifaka density and tree cutting. First, forest areas that are good sifaka habitat may also be relatively rich in important resources for people and livestock. In fact, many of the trees cut along the transects were species that sifakas use as food resources. If human resource extraction rates are low, sifaka food abundance could still be high, implying that people and sifakas can share the habitat sustainably. Second, sifakas may prefer areas where people selectively cut trees because low levels of cutting open light gaps, resulting in increased leaf protein and fruit production (Ganzhorn, 1995). Folivores select leaves with higher protein, especially in areas where the average protein content of the forest is low (Ganzhorn et al., 2017). Moreover, sifakas prefer young leaves over mature ones (Norscia et al., 2006), and may be attracted to small light gaps with abundant new growth. Also, while sifakas are considered folivores, fruit constitutes a substantial portion of their diet (Simmen et al., 2003; Norscia et al., 2006). Alternatively, the time scale of this study might not have allowed us to detect sifaka movements away from areas where we recorded tree cutting because of time lags between disturbances and range shifts. However, restrictions on human use within the surveyed zones have increased over the last decade and the intensity of disturbance is likely lower now than before the expansion of the reserve. Therefore, it seems reasonable to conclude that sifakas are not deterred by current levels of tree cutting at BMSR. Lastly, it must be noted that tree cutting represents only one type of human use. Future research would benefit from including data on other human-related activities, like signs of recent livestock grazing, in the areas of the line transects.
In summary, anthropogenic activities did not have the expected negative impact on sifaka activity budgets or population density and had only limited, short-term behavioral effects. These findings suggest that BMSR’s multiple use management plan may help protect sifakas while also allowing limited human use of the forest. Guided by the predictions of the RDH, our results paint a more detailed picture of how sifakas are impacted by human activities than if we had just measured one aspect of sifaka ecology. Future research is needed to assess long-term fitness consequences of human-associated activities, however. As Gill et al. (2001) bluntly argue, “human disturbance of wildlife is important only if it affects survival or fecundity and hence causes a population to decline.” The priority for future research must therefore be determining whether sifaka survival and reproduction vary among areas experiencing different disturbance intensities. Due to the slow life histories of sifakas (Richard et al., 2002) accumulating data to address this question will take time, but will be possible with continued monitoring of the focal groups and transects established in this study.
Data Availability Statement
The original contributions presented in the study are included in the article/Supplementary Material, further inquiries can be directed to the corresponding author/s.
Ethics Statement
Ethical review and approval was not required for the animal study because it did not involve animal handling and was purely observational.
Author Contributions
CC-K conceived the study, conducted the field work, analyzed the data, and wrote the manuscript. NR helped to refine the field methods and conducted field work. MR and DA conducted field work. RL, DW, and AR provided feedback throughout the development, execution, data analysis, and manuscript drafting stages of the study. NR, MR, DA, RL, DW, and AR provided feedback on the final manuscript. All authors contributed to the article and approved the submitted version.
Funding
This project received generous financial support from the National Science Foundation (NSF-BSC-1745371), Yale University MacMillan Center for International Studies, National Geographic Society (EC-420R-18), Explorers Club, Yale Institute for Biospheric Studies, Yale University Department of Anthropology, International Primatological Society, and Primate Conservation Inc.
Conflict of Interest
The authors declare that the research was conducted in the absence of any commercial or financial relationships that could be construed as a potential conflict of interest.
The handling editor JH declared a shared affiliation with the authors NR and MR at the time of review.
Publisher’s Note
All claims expressed in this article are solely those of the authors and do not necessarily represent those of their affiliated organizations, or those of the publisher, the editors and the reviewers. Any product that may be evaluated in this article, or claim that may be made by its manufacturer, is not guaranteed or endorsed by the publisher.
Acknowledgments
We are incredibly grateful to the entire Bezà team, especially Efitiria, Enafa Jaonarisoa, and Elahavelo Efitroarane for assisting with data collection, Sibien Mahereza for his help with research coordination, and Lala for cooking and caring for our field team. We thank Hanitra Ihariliva for her assistance establishing the transects and habituating the new sifaka groups in 2016 and the ESSA team, especially Joelisoa Ratsirarson and Jeannin Ranaivonasy, for their mentorship and for letting our team conduct research at BMSR, as well as Mia Razafimahefa and Rija Andriamialy for their logistical help during field work. We are grateful to Henry Glick, Yanhong Deng, Fangyong Li, and Jonathan Reuning-Scherer at Yale University for lending their statistical expertise and to three reviewers whose feedback greatly improved this manuscript. Finally, we thank the Madagascar Ministry of the Environment and Madagascar National Parks for permitting this research (#141/16/MEEF/SG/DGF/DSAP/SCB.Re, #110/17/MEEF/SG/DGF/DSAP/SCB/Re, and #139/18/MEEF/SG/DGF/DS AP/SCB/Re).
Supplementary Material
The Supplementary Material for this article can be found online at: https://www.frontiersin.org/articles/10.3389/fevo.2022.779861/full#supplementary-material
References
Axel, A. C. (2011). Lemur-Environment Relationships in Altered and Unaltered Tropical Dry Forests in Southern Madagascar Ph.D. Thesis. Ann Arbor (MI): University of Michigan.
Axel, A. C., and Maurer, B. A. (2011). Lemurs in a complex landscape: mapping species density in subtropical dry forests of southwestern madagascar using data at multiple levels. Am. J. Primatol. 73, 38–52. doi: 10.1002/ajp.20872
Beale, C. M. (2007). The behavioral ecology of disturbance responses. Int. J. Comput. Psychol. 20, 111–120.
Bejder, L., Samuels, A., Whitehead, H., Finn, H., and Allen, S. (2009). Impact assessment research: use and misuse of habituation, sensitisation and tolerance in describing wildlife responses to anthropogenic stimuli. Mar. Ecol. Prog. Ser. 395, 177–185. doi: 10.3354/meps07979
Blumstein, D. T. (2016). Habituation and sensitization: new thoughts about old ideas. Anim. Behav. 120, 255–262. doi: 10.1016/j.anbehav.2016.05.012
Brockman, D. K., Godfrey, L. R., Dollar, L. J., and Ratsirarson, J. (2008). Evidence of invasive Felis silvestris predation on Propithecus verreauxi at Beza Mahafaly Special Reserve, Madagascar. Int. J. Primatol. 29, 135–152. doi: 10.1007/s10764-007-9145-5
Bublitz, D. C., Wright, P. C., Rasambainarivo, F. T., Arrigo-Nelson, S. J., Bodager, J. R., and Gillespie, T. R. (2015). Pathogenic enterobacteria in lemurs associated with anthropogenic disturbance. Am. J. Primatol. 77, 330–337. doi: 10.1002/ajp.22348
Buckland, S. T., Rexstad, E. A., Marques, T. A., and Oedekoven, C. S. (2015). Distance Sampling: Methods and Applications. Heidelberg: Springer International Publishing, doi: 10.1007/978-3-319-19219-2
Caillaud, D. (2012). Animal Observer V1.0. Available online at: https://fosseyfund.github.io/AOToolBox/ (accessed March 12, 2020).
Cañadas Santiago, S., Dias, P. A. D., Garau, S., Fuentes, A. C., Chavira Ramírez, D. R., Canales Espinosa, D., et al. (2019). Behavioral and physiological stress responses to local spatial disturbance and human activities by howler monkeys at Los Tuxlas, Mexico. Anim. Conserv 23, 297–306. doi: 10.1111/acv.12541
Cavada, N., Tenan, S., Barelli, C., and Rovero, F. (2019). Effects of anthropogenic disturbance on primate density at the landscape scale. Conserv. Biol. 33, 873–882. doi: 10.1111/cobi.13269
Chaves, M., Stoner, K. E., and Arroyo-Rodríguez, V. (2012). Differences in diet between spider monkey groups living in forest fragments and continuous forest in Mexico. Biotropica 44, 105–113. doi: 10.1371/journal.pone.0149671
Chaves, ÓM., Stoner, K. E., and Arroyo-Rodríguez, V. (2011). Seasonal differences in activity patterns of Geoffroy’s spider monkeys (Ateles geoffroyi) living in continuous and fragmented forests in southern Mexico. Int. J. Primatol. 32, 960–973. doi: 10.1007/s10764-011-9515-x
Chen-Kraus, C. (2020). Assessing Anthropogenic Impacts on Endangered Verreaux’s Sifaka (Propithecus verreauxi) And Prospects for Human-Lemur Coexistence Ph.D. Thesis. New Haven (CT): Yale University.
Chen-Kraus, C., Farmer, C., Guevara, E. E., Meier, K., Watts, D. P., and Widness, J. (2021). Whom do primate names honor? Rethinking primate eponyms. Int. J. Primatol. 42, 980–986. doi: 10.1007/s10764-021-00252-0
Crofoot, M. C., Lambert, T. D., Kays, R., and Wikelski, M. C. (2010). Does watching a monkey change its behaviour? Quantifying observer effects in habituated wild primates using automated radiotelemetry. Anim. Behav. 80, 475–480. doi: 10.1016/j.anbehav.2010.06.006
Estrada, A., Garber, P. A., Rylands, A. B., Roos, C., Fernandez-Duque, E., Di Fiore, A., et al. (2017). Impending extinction crisis of the world’s primates: why primates matter. Sci. Adv. 3, 1–16. doi: 10.1126/sciadv.1600946
Farris, Z. J., Chan, S., Rafaliarison, R., and Valenta, K. (2019). Occupancy modeling reveals interspecific variation in habitat use and negative effects of dogs on lemur populations. Int. J. Primatol. 40, 706–720. doi: 10.1007/s10764-019-00120-y
Fichtel, C., and Kappeler, P. M. (2002). Anti-predator behavior of group-living Malagasy primates: mixed evidence for a referential alarm call system. Behav. Ecol. Sociobiol. 51, 262–275. doi: 10.1007/s00265-001-0436-0
Fichtel, C., and Kappeler, P. M. (2011). Variation in the meaning of alarm calls in Verreaux’s and Coquerel’s sifakas (Propithecus verreauxi, P. coquereli). Int. J. Primatol. 32, 346–361. doi: 10.1007/s10764-010-9472-9
Fichtel, C., and Van Schaik, C. P. (2006). Semantic differences in sifaka (Propithecus verreauxi) alarm calls: a reflection of genetic or cultural variants? Ethology 112, 839–849. doi: 10.1111/j.1439-0310.2006.01239.x
Fourie, N. H., Turner, T. R., Brown, J. L., Pampush, J. D., Lorenz, J. G., and Bernstein, R. M. (2015). Variation in vervet (Chlorocebus aethiops) hair cortisol concentrations reflects ecological disturbance by humans. Primates 56, 365–373. doi: 10.1007/s10329-015-0486-y
Frid, A., and Dill, L. (2002). Human-caused disturbance stimuli as a form of predation risk. Conserv. Ecol. 6:11. doi: 10.5751/ES-00404-060111
Fuentes, A. (2012). Ethnoprimatology and the anthropology of the human-primate interface*. Annu. Rev. Anthropol. 41, 101–117. doi: 10.1146/annurev-anthro-092611-145808
Ganzhorn, J. U. (1995). Low-level forest disturbance effects on primary production, leaf chemistry, and lemur populations. Ecology 76, 2084–2096.
Ganzhorn, J. U., Arrigo- Nelson, S. J., Carrai, V., Chalise, M. K., Donati, G., Droescher, I., et al. (2017). The importance of protein in leaf selection of folivorous primates. Am. J. Primatol. 79, 1–13. doi: 10.1002/ajp.22550
Gavin, S. D., and Komers, P. E. (2006). Do pronghorn (Antilocapra americana) perceive roads as a predation risk? Can. J. Zool. 84, 1775–1780. doi: 10.1139/Z06-175
Gill, J. A., Norris, K., and Sutherland, W. J. (2001). Why behavioural responses may not reflect the population consequences of human disturbance. Biol. Conserv. 97, 265–268. doi: 10.1016/S0006-3207(00)00002-1
Girard-Buttoz, C., Higham, J. P., Heistermann, M., Wedegärtner, S., Maestripieri, D., and Engelhardt, A. (2011). Urinary C-peptide measurement as a marker of nutritional status in macaques. PLoS One 6:e18042. doi: 10.1371/journal.pone.0018042
Herrera, J. P., Wright, P. C., Lauterbur, E., Ratovonjanahary, L., and Taylor, L. L. (2011). The effects of habitat disturbance on lemurs at Ranomafana National Park, Madagascar. Int. J. Primatol. 32, 1091–1108. doi: 10.1007/s10764-011-9525-8
Jack, K. M., Lenz, B. B., Healan, E., Rudman, S., Schoof, V. A. M., and Fedigan, L. (2008). The effects of observer presence on the behavior of Cebus capucinus in Costa Rica. Am. J. Primatol. 70, 490–494. doi: 10.1002/ajp.20512
Jaimez, N. A., Bribiescas, R. G., Aronsen, G. P., Anestis, S. A., and Watts, D. P. (2012). Urinary cortisol levels of gray-cheeked mangabeys are higher in disturbed compared to undisturbed forest areas in Kibale National Park, Uganda. Anim. Conserv. 15, 242–247. doi: 10.1111/j.1469-1795.2011.00508.x
Junge, R. E., Barrett, M. A., and Yoder, A. D. (2011). Effects of anthropogenic disturbance on indri (Indri indri) health in Madagascar. Am. J. Primatol. 73, 632–642. doi: 10.1002/ajp.20938
Mammides, C., Cords, M., and Peters, M. K. (2009). Effects of habitat disturbance and food supply on population densities of three primate species in the Kakamega Forest, Kenya. Afr. J. Ecol. 47, 87–96. doi: 10.1111/j.1365-2028.2007.00921.x
McKinney, T. (2011). The effects of provisioning and crop-raiding on the diet and foraging activities of human-commensal white-faced capuchins (Cebus capucinus). Am. J. Primatol. 73, 439–448. doi: 10.1002/ajp.20919
McLester, E., Pintea, L., Stewart, F. A., and Piel, A. K. (2019). Cercopithecine and colobine abundance across protected and unprotected land in the Greater Mahale Ecosystem, western Tanzania. Int. J. Primatol. 40, 687–705. doi: 10.1007/s10764-019-00118-6
Mekonnen, A., Fashing, P. J., Bekele, A., Hernandez-Aguilar, R. A., Rueness, E. K., Nguyen, N., et al. (2017). Impacts of habitat loss and fragmentation on the activity budget, ranging ecology and habitat use of bale monkeys (Chlorocebus djamdjamensis) in the southern Ethiopian Highlands. Am. J. Primatol. 79:e22644. doi: 10.1002/ajp.22644
Müller, P., Velo, A., Raheliarisoa, E.-O., Zaramody, A., and Curtis, D. J. (2000). Surveys of sympatric lemurs at Anjamena, north-west Madagascar. Afr. J. Ecol. 38, 248–257.
Norscia, I., Carrai, V., and Borgognini-Tarli, S. M. (2006). Influence of dry season and food quality and quantity on behavior and feeding strategy of Propithecus verreauxi in Kirindy, Madagascar. Int. J. Primatol. 27, 1001–1022. doi: 10.1007/s10764-006-9056-x
R Core Team (2019). R: A Language and Environment For Statistical Computing. Vienna, Austria: R Foundation for Statistical Computing.
Rangel-Negrín, A., Coyohua-Fuentes, A., Chavira, R., Canales-Espinosa, D., and Dias, P. A. D. (2014). Primates living outside protected habitats are more stressed: the case of black howler monkeys in the Yucatán Peninsula. PLoS One 9:e112329. doi: 10.1371/journal.pone.0112329
Ratoniherison, F. T. (2015). Analyse Du Domaine Vital De Propithecus Verreauxi: Cas De La Reserve Speciale De Beza Mahafaly. Master’s Thesis. Antananarivo (Madagascar): University of Antananarivo.
Ratsirarson, J., and Sussman, R. W. (2006). “Beza Mahafaly Special Reserve: a research site in southwestern Madagascar,” in Ringtailed Lemur Biology, eds A. Jolly, R. Sussman, N. Koyama, and H. Rasamimanana (New York: Springer), 43–51. doi: 10.1007/978-0-387-34126-2_4
Richard, A. F., and Ratsirarson, J. (2013). Partnership in practice: making conservation work at Bezà Mahafaly, southwest Madagascar. Madag. Conserv. Dev. 8, 12–20.
Richard, A. F., Dewar, R. E., Schwartz, M., and Ratsirarson, J. (2002). Life in the slow lane? Demography and life histories of male and female sifaka (Propithecus verreauxi verreauxi). J. Zool. 256, 421–436. doi: 10.1017/S0952836902000468
Richard, A. F., Rakotomanga, P., and Schwartz, M. (1993). Dispersal by Propithecus verreauxi at Beza Mahafaly, Madagascar: 1984-1991. Am. J. Primatol. 30, 1–20. doi: 10.1002/ajp.1350300102
Richard, A., Ratsirarson, J., Jaonarisoa, E., Mahereza, S., Jacky, I. A. Y., Sauther, M., et al. (2016). Diurnal lemurs at Bezà Mahafaly: resilience and risk. Malagasy Nat. 10, 37–49.
Rifkin, B. (2018). The Influence of Community-Managed Protected Areas on the Structure, Composition, and Diversity of Tropical Dry Forest in Southwest Madagascar Master’s Thesis. New Haven (CT): Yale University.
Rodríguez-Prieto, I., and Fernández-Juricic, E. (2005). Effects of direct human disturbance on the endemic Iberian frog Rana iberica at individual and population levels. Biol. Conserv. 123, 1–9. doi: 10.1016/j.biocon.2004.10.003
Ross, C., and Reeve, N. (2011). “Survey and census methods: population distribution and density,” in Field and Laboratory Methods in Primatology: A Practical Guide, eds J. M. Setchell and D. J. Curtis (Cambridge University Press), 111–131. doi: 10.1017/CBO9780511921643.008
Rovero, F., Mtui, A., Kitegile, A., Jacob, P., Araldi, A., and Tenan, S. (2015). Primates decline rapidly in unprotected forests: evidence from a monitoring program with data constraints. PLoS One 10:1–13. doi: 10.1371/journal.pone.0118330
Sauther, M. L., Bertolini, F., Dollar, L. J., Pomerantz, J., Alves, P. C., Gandolfi, B., et al. (2020). Taxonomic identification of Madagascar’s free-ranging “forest cats”. Conserv. Genet. 21, 443–451. doi: 10.1007/s10592-020-01261-x
Shannon, G., Angeloni, L. M., Wittemyer, G., Fristrup, K. M., and Crooks, K. R. (2014). Road traffic noise modifies behaviour of a keystone species. Anim. Behav. 94, 135–141. doi: 10.1016/j.anbehav.2014.06.004
Simmen, B., Hladik, A., and Ramasiarisoa, P. (2003). Food intake and dietary overlap in native Lemur catta and Propithecus verreauxi and introduced Eulemur fulvus at Berenty, southern Madagascar. Int. J. Primatol. 24, 949–968. doi: 10.1023/A:1026366309980
Sussman, R. W., Richard, A. F., Ratsirarson, J., Sauther, M. L., Brockman, D. K., Gould, L., et al. (2012). “Beza Mahafaly Special Reserve: long-term research on lemurs in southwestern Madagascar,” in Long-Term Field Studies of Primates, eds P. M. Kappeler and D. P. Watts (Berlin: Springer), 45–66. doi: 10.1007/978-3-642-22514-7_3
Tablado, Z., and Jenni, L. (2017). Determinants of uncertainty in wildlife responses to human disturbance. Biol. Rev. 92, 216–233. doi: 10.1111/brv.12224
Thomas, L., Buckland, S. T., Rexstad, E. A., Laake, J. L., Strindberg, S., Hedley, S. L., et al. (2010). Distance software: design and analysis of distance sampling surveys for estimating population size. J. Appl. Ecol. 47, 5–14. doi: 10.1111/j.1365-2664.2009.01737.x
Keywords: risk disturbance hypothesis, sifaka, Propithecus verreauxi, disturbance ecology, behavior, distribution, Madagascar
Citation: Chen-Kraus C, Raharinoro NA, Randrianirinarisoa MA, Anderson DJ, Lawler RR, Watts DP and Richard AF (2022) Human-Lemur Coexistence in a Multiple-Use Landscape. Front. Ecol. Evol. 10:779861. doi: 10.3389/fevo.2022.779861
Received: 20 September 2021; Accepted: 27 January 2022;
Published: 03 March 2022.
Edited by:
Jonah Henri Ratsimbazafy, Madagascar Primate Study and Research Group (GERP), MadagascarReviewed by:
Ilaria Agostini, Instituto de Biología Subtropical (IBS), ArgentinaRenata Ferreira, Federal University of Rio Grande do Norte, Brazil
Patrícia F. Monticelli, University of São Paulo, Brazil
Copyright © 2022 Chen-Kraus, Raharinoro, Randrianirinarisoa, Anderson, Lawler, Watts and Richard. This is an open-access article distributed under the terms of the Creative Commons Attribution License (CC BY). The use, distribution or reproduction in other forums is permitted, provided the original author(s) and the copyright owner(s) are credited and that the original publication in this journal is cited, in accordance with accepted academic practice. No use, distribution or reproduction is permitted which does not comply with these terms.
*Correspondence: Chloe Chen-Kraus, Y2hsb2UuY2hlbmtyYXVzQGdtYWlsLmNvbQ==