 Chelsea L. Butcher
 Berish Y. Rubin3
 Sylvia L. Anderson
 J. D. Lewis
- 1Louis Calder Center – Biological Field Station, Fordham University, Armonk, NY, United States
- 2Center for Urban Ecology, Fordham University, Bronx, NY, United States
- 3Department of Biological Sciences, Fordham University, Bronx, NY, United States
- 4Department of Mathematics and Natural Sciences, Northwood University, Midland, MI, United States
Long-distance pollen dispersal is critical for gene flow in plant populations, yet pollen dispersal patterns in urban habitats such as green roofs have not been extensively studied. Pollen dispersal patterns typically are assessed either by fitting non-linear models to the relationship between the degree of pollen dispersal and distance to the pollen source (i.e., curve fitting), or by fitting probability density functions (PDFs) to pollen dispersal probability histograms (i.e., PDF fitting). Studies using curve fitting typically report exponential decay patterns in pollen dispersal. However, PDF fitting typically produces more fat-tailed distributions, suggesting the exponential decay may not be the best fitting model. Because the two approaches may yield conflicting results, we used both approaches to examine pollen dispersal patterns in the wind-pollinated Amaranthus tuberculatus and the insect-pollinated Solanum lycopersicum at two green roof and two ground-level sites in the New York (NY, United States) metropolitan area. For the curve fitting analyses, the exponential decay and inverse power curves provided good fits to pollen dispersal patterns across both green roof and ground-level sites for both species. Similar patterns were observed with the PDF fitting analyses, where the exponential or inverse Gaussian were the top PDF at most sites for both species. While the curve fitting results are consistent with other studies, the results differ from most studies using PDF fitting, where long-distance pollen dispersal is more common than we observed. These results highlight the need for further research to compare curve and PDF fitting for predicting pollen dispersal patterns. And, critically, while long-distance pollen dispersal may be an important component of overall pollen dispersal for A. tuberculatus and S. lycopersicum in both urban green roof and ground-level sites, our results suggest it potentially may occur to a lesser extent compared with plants in less-urban areas.
Introduction
Pollen dispersal is a fundamental component of sexual reproduction in seed plants, and typically is the main component of gene flow in these plants (Levin and Kerster, 1974; Ennos, 1994). The most vital spatial element of pollen dispersal is the distance that a pollen grain travels to a pollen receptor from the source, referred to as the pollen dispersal distance (Nathan, 2006; Nathan et al., 2012). Accordingly, the distance pollen disperses should be critical in gene flow, and associated patterns of adaptation. Short-distance dispersal mainly structures the local genotypes and can keep beneficial alleles within a population, which may promote local adaptation (Becker et al., 2006). Conversely, long-distance dispersal can introduce new alleles to a population that may provide critical capacity for adaption to changing environments. Long-distance dispersal may be particularly important to isolated populations, such as urban green roofs, where population sizes are small and genetic diversity limited (Kremer et al., 2012). However, despite the potential importance of long-distance pollen dispersal to long-term population survival in these habitats, only a few studies have examined pollen dispersal patterns on green roofs or other urban habitats. These studies suggest that the majority of pollen disperses short distances, although some long-distance pollen dispersal may also occur (e.g., Van Rossum, 2009; Diniz et al., 2019; Ksiazek-Mikenas et al., 2019).
Long-distance pollen dispersal in urban areas may be limited compared with less-urban areas due to the urban matrix (Fernandez-Juricic and Jokimäki, 2001; Ramalho and Hobbs, 2012). Even in studies of less-urban areas, pollen dispersal generally declines with increasing distance from the pollen source (e.g., Price and Waser, 1979; Bittencourt and Sebbenn, 2007; Saro et al., 2014), though many factors, such as species and type of dispersal vector affect the frequency of both short and long-distance dispersal events. The majority of pollen disperses short distances because of the effects of gravity in wind-pollinated species (Di-Giovanni and Kevan, 1991; Zhang et al., 2016) and nearest-neighbor foraging in animal-pollinated species (Turchetto et al., 2015; Baldoni et al., 2017). Nonetheless, long-distance dispersal occurs, at a low but vital frequency, reflecting the dynamic interplay between wind and gravity for wind-pollinated plants (e.g., Saro et al., 2014; Wang et al., 2014) or the effect of long-distance foraging by pollinators for animal-pollinated plants (e.g., Zurbuchen et al., 2010; Noreen et al., 2016).
The simplest method for empirically assessing pollen dispersal patterns is fitting non-linear models to the relationship between the relative frequency or number of pollen dispersal events and distance from the pollen source is (i.e., curve fitting; Beckie and Hall, 2008). The phenomena driving dispersal create a leptokurtic relationship between pollen dispersal and distance from the pollen donor, such that exponential decay and inverse power curves often are utilized to fit these data because they fit the steep initial decrease in pollen dispersed with increasing distance, while also providing an adequate fit for low-frequency long-distance dispersal events (Beckie and Hall, 2008; Buehler et al., 2012). Further, they are simple because only two parameters are estimated in the models and the curves are easily analyzed by log-transforming the data (Okubo and Levin, 1989; Simpson et al., 2006). The exponential decay curve has been used more often than the inverse power curve to model pollen dispersal (Streiff et al., 1999; Ma et al., 2004; Van Rossum et al., 2011; Dong et al., 2016), though some studies suggest that the inverse power curve is the best fit for the effect of distance on pollen dispersal (Barbour et al., 2005; Buehler et al., 2012).
Despite the ease of curve fitting, an alternative type of modeling is used more commonly to analyze empirical pollen dispersal patterns (e.g., Devaux et al., 2005; Piotti et al., 2012; Ramos et al., 2016). This technique involves using the distribution of pollen dispersal distances to create a pollen dispersal probability histogram, then fitting one or more probability density functions (PDFs) to these histograms (i.e., PDF fitting; Hardy et al., 2004; Jongejans et al., 2008; Nathan et al., 2012). Although curve fitting can be confused with PDF fitting, the two differ in that the former involves modeling the response of a dependent, response variable (i.e., degree of pollen dispersal) to an independent, predictor variable (i.e., pollen dispersal distance), while the latter involves modeling pollen dispersal by fitting a PDF to the probability histogram of a single variable (i.e., pollen dispersal probability histogram; Beckie and Hall, 2008; Nathan et al., 2012). The key aspect of PDF fitting involves the shape of the tail of the best-fitting PDF, which reveals information about the relative degrees of short- and long-distance pollen dispersal (Austerlitz et al., 2004). Fat-tailed and thin-tailed PDFs best fit probability histograms with comparatively high and low degrees of long-distance dispersal, respectively, and the exponential-tailed PDF serves as the delineation between thin and fat-tailed PDFs (Clark et al., 1998; Hardy, 2009).
In most pollen dispersal studies, the tail shape is determined by comparing the fits of PDFs with different tail shapes (Fenart et al., 2007; Guidugli et al., 2016) or by utilizing PDFs with a flexible tail shape, such that the shape parameter indicates the tail shape (Darmency et al., 2009; Krauss et al., 2009). A common approach is to compare the thin-tailed Gaussian PDF with exponential and fat-tailed PDFs (e.g., Lavigne et al., 1998; Goto et al., 2006), but the Gaussian PDF suggests a lower degree of long-distance pollen dispersal than exhibited by most species (Bateman, 1950; Dick et al., 2003). In general, studies show that pollen dispersal is fatter-tailed than the exponential PDF (Morris et al., 1995; Devaux et al., 2005; Jha and Dick, 2010), while the Gaussian PDF provides the worst fit (Austerlitz et al., 2004). Accordingly, fat-tailed PDFs often are a better fit to probability histograms compared with other PDFs (Austerlitz et al., 2004; Klein et al., 2006a). However, these studies have been conducted in natural areas, and PDF fitting has not been used in studies investigating pollen dispersal in urban landscapes, where long distance dispersal may be limited as the result of the surrounding urban matrix (Fernandez-Juricic and Jokimäki, 2001; Ramalho and Hobbs, 2012).
In this study, we assessed pollen dispersal patterns on two green roof and two ground-level sites in the New York (New York, United States) metropolitan area. Because studies using curve fitting generally predict less long-distance dispersal compared with studies using PDF fitting, we used both models to assess pollen dispersal patterns in an insect-pollinated species (tomato; Solanum lycopersicum L.), and a wind-pollinated species [waterhemp; Amaranthus tuberculatus (Moq.) J. D. Sauer]. We used seed and fruit production as proxies for the effective number of flowers pollinated (i.e., degree of pollen dispersal) in A. tuberculatus and S. lycopersicum, respectively. Then, we fit non-linear models to the relationship between degree of pollen dispersal and distance to the pollen donor (i.e., curve fitting) using exponential decay, inverse power, Weibull, logistic, and Gaussian curves. We also fit PDFs with various tail shapes to pollen dispersal probability histograms (i.e., PDF fitting). We hypothesized that: (1) the exponential decay curve would account for the most variation in the relationship between effective pollen dispersal and distance to the pollen donor group for both species, consistent with most curve fitting studies, and (2) fat-tailed PDFs would provide the best fit of pollen dispersal probability histograms for both species, as this is the pattern found in the majority of studies using PDF fitting.
Materials and Methods
Study Sites
Pollen dispersal data used to fit curves and PDFs were drawn from the same data in Butcher et al. (2020a), which examined the relative degree of pollen dispersal among two green roof and two ground-level sites in the New York (NY, United States) metropolitan area. Accordingly, study sites, study species, and greenhouse and field methods are as in Butcher et al. (2020a). In summary, pollen recipient and donor plants were placed in arrays at four sites: (1) Rose Hill Campus (Rose Hill) in Bronx, NY, United States, (2) the Javits Convention Center (Javits) in New York, NY, United States, (3) the Louis Calder Center (Calder) in Armonk, NY, United States, and (4) the Queens Zoo (Queens Zoo) in Corona, NY, United States. Rose Hill and Javits were primarily green roof sites, while Calder and Queens Zoo were ground-level sites.
More specifically, at Rose Hill, most of the plants were located on two separate portions of the roof of a campus building, as well as the roof of Rose Hill’s parking garage, and a small number of plants were located at a ground-level site at the New York Botanical Garden (Table 1 and Figure 1). At Javits, plants were located on two separate portions of the Javits Center’s Sedum-dominated green roof (Table 1). At Calder, the majority of the plants were located at two suburban lawns, which were regularly mowed, and a small number of plants were located at an unmowed meadow (Table 1). And, at the Queens Zoo, most of the plants were located at two urban lawns, which were regularly mowed, and a small number of plants were located at an unmowed meadow (Table 1).

Table 1. Site details for four sites used in 2015 to assess pollen dispersal patterns, including site type, main sector type, study species, number of non-contiguous sectors (including types), number of pollen receptor (PR) plants, and the maximum distance between pollen receptor (PR) plants and pollen donor (PD) group.
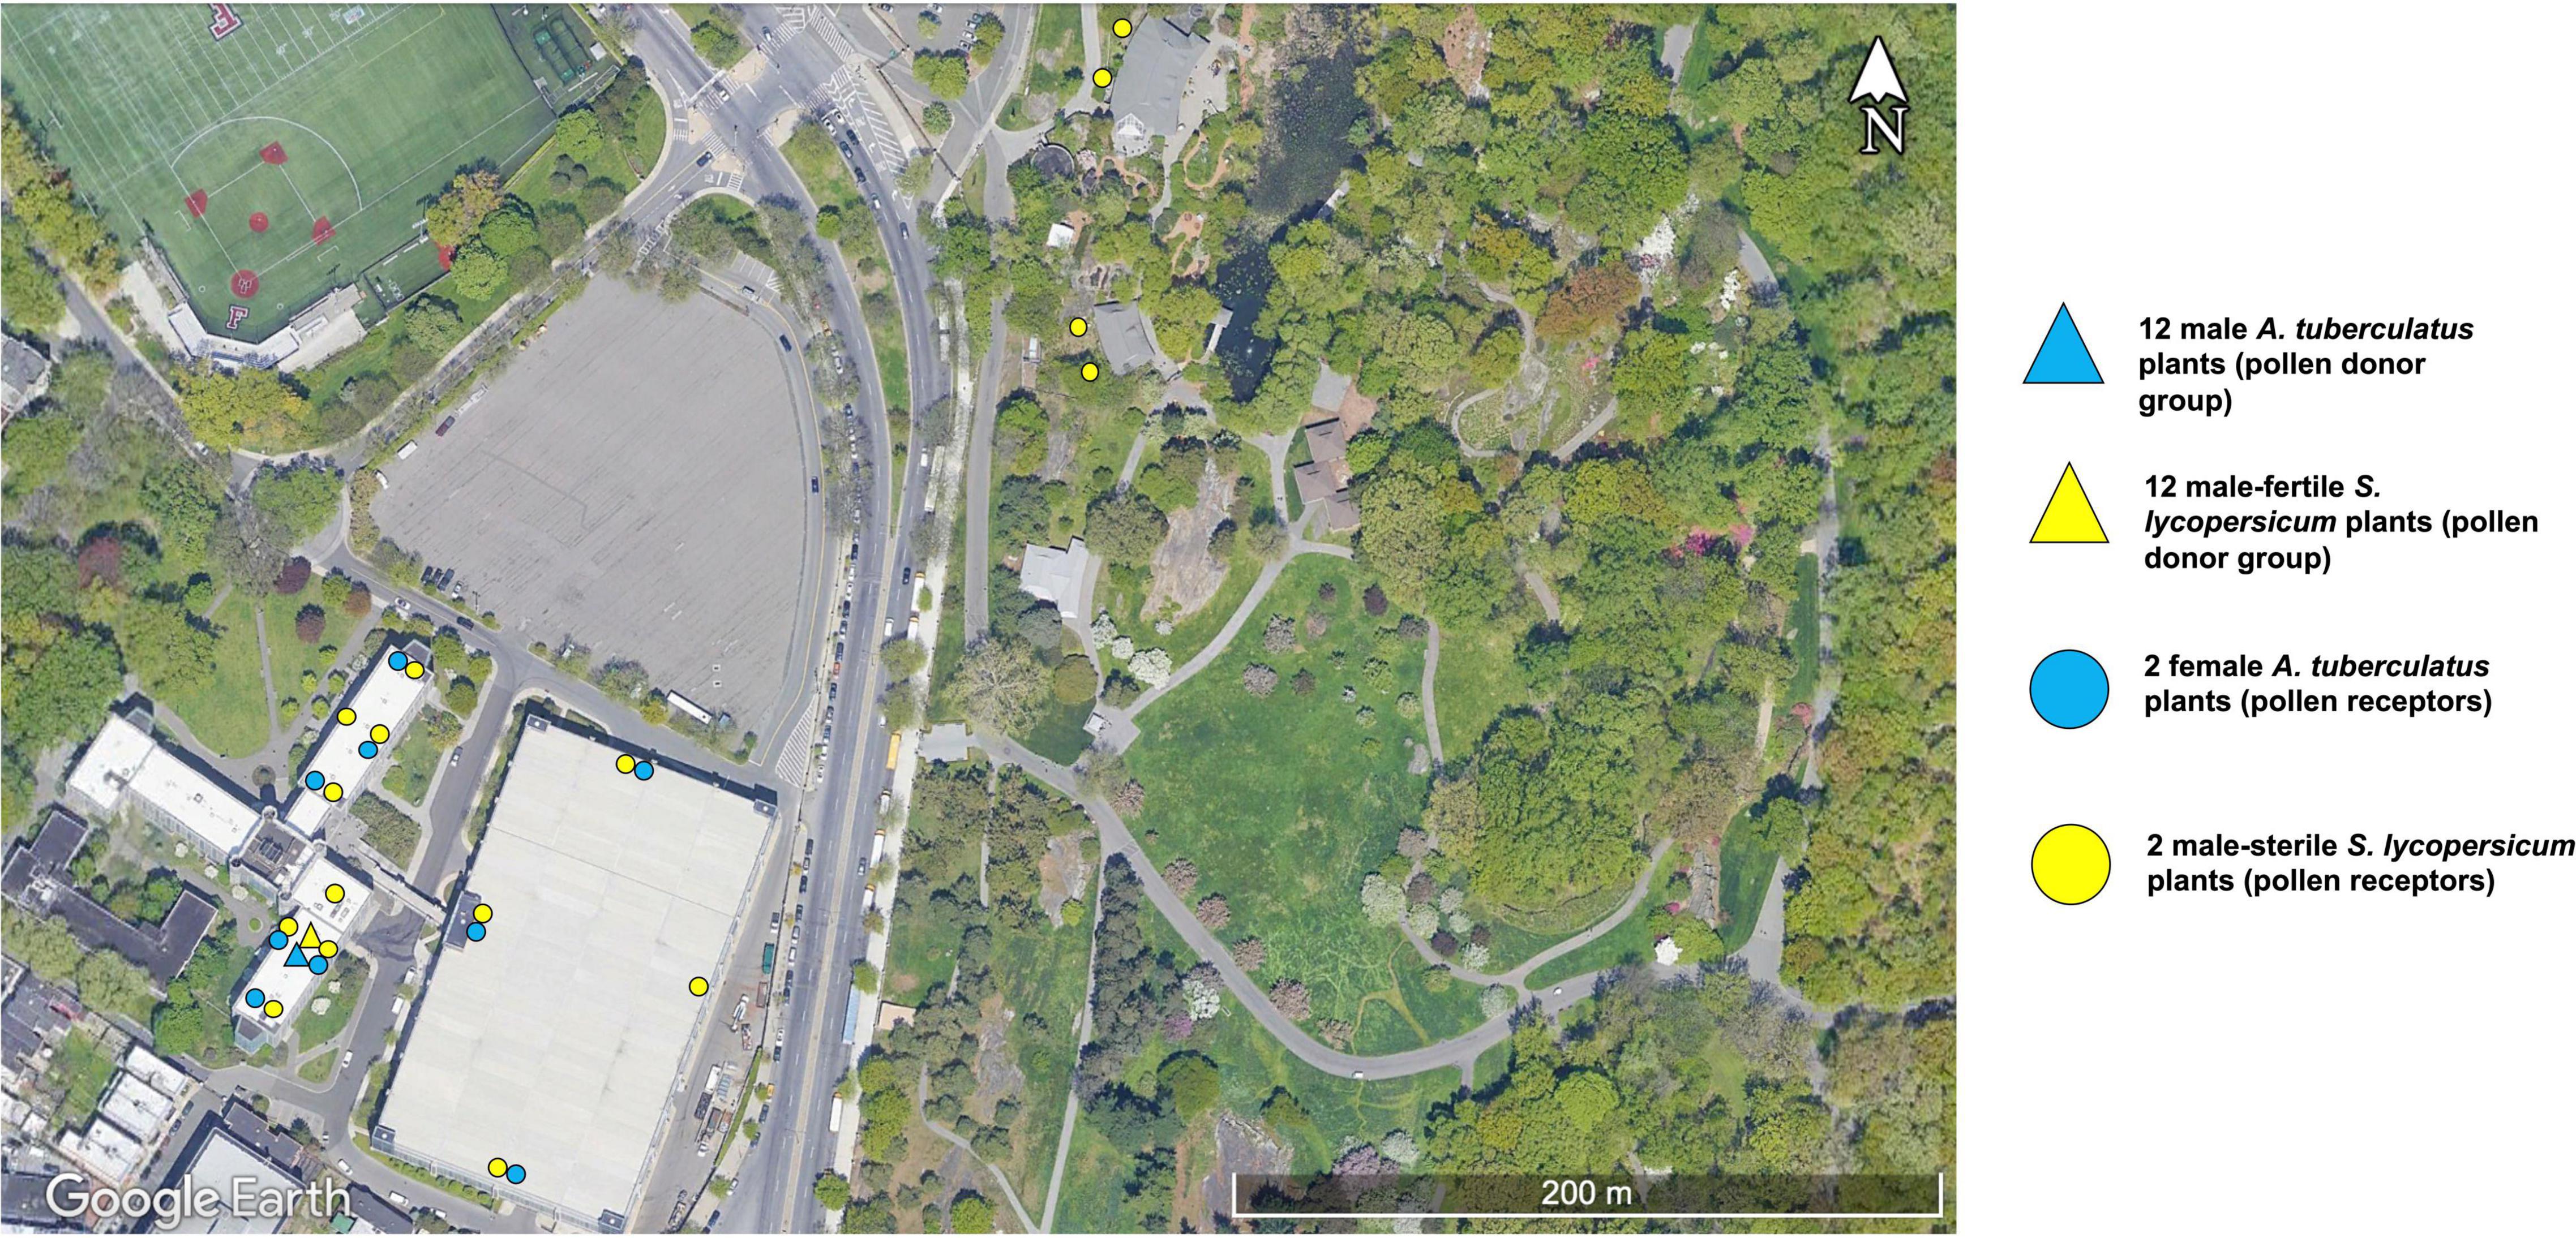
Figure 1. Satellite image of the Rose Hill site depicting the experimental layout. The teal markers indicate A. tuberculatus plants, with the blue triangle representing the A. tuberculatus pollen donor group and the blue circles representing a group of two A. tuberculatus pollen receptors. The yellow markers indicate S. lycopersicum plants, with the yellow triangles denoting the S. lycopersicum pollen donor group and the yellow circles denoting a group of two S. lycopersicum pollen receptors (Modified from Butcher et al., 2020a).
Study Species
The wind-dispersed Amaranthus tuberculatus and the insect-dispersed Solanum lycopersicum were selected because species of both genera grow well in urban environments (Del Tredici, 2010; Aloisio et al., 2016). Further, A. tuberculatus is dioecious, which allowed us to assess pollen dispersal (i.e., degree of dispersal and dispersal distance) to female plants (pollen receptors) from male plants (pollen donors; Hager et al., 1997). Solanum lycopersicum is most often pollinated by bees in the genera Anthophora and Bombus, although some pollination may also occur via bees in the genera Lasioglossum, Apis, and Halictus (Greenleaf and Kremen, 2006). And, although S. lycopersicum is typically self-compatible and most often self-fertilizes because of its flower morphology, the NC4 breeding line (Panthee and Gardner, 2013), which was used in our study, is heterozygous for the ms-10 male-sterility gene, such that it produces both male-sterile and male-fertile offspring. Accordingly, we used the NC4 line to measure pollen dispersal to male-sterile plants (pollen receptors) from male-fertile plants (pollen donors).
Greenhouse and Field Methods
Greenhouse and field methods were as described in Butcher et al. (2020a). In summary, seeds from an Iowa population of A. tuberculatus (Hinz and Owen, 1997) and the NC4 line of S. lycopersicum (Panthee and Gardner, 2013) were germinated and grown in a polycarbonate greenhouse. Once mature and separated by sex or sterility, these plants served as the parent plants in pollen recipient and donor arrays at the four sites. For both species, and at each site, the pollen receptor plants were placed at increasing distances, starting at 1 m, from a group of twelve pollen donors, with the maximum distance varying among sites (Table 1). The experimental array layout for both species at the Rose Hill site are shown in Figure 1 to depict the layout of the experimental array at one site. All sites were organized similarly, taking into account site size and shape.
As with the majority of pollen dispersal studies, we calculated the straight-line Euclidean distance between pollen receptors and the donor group and this distance was used as the effective pollen dispersal distance (Byrne et al., 2007; Ismail et al., 2012; Browne et al., 2018). The number of A. tuberculatus seeds and S. lycopersicum fruits were used as proxies for the number of flowers pollinated (i.e., degree of pollen dispersal).
Curves and PDFs were fit to pollen dispersal data collected for A. tuberculatus at two sites in 2014 and for both A. tuberculatus and S. lycopersicum at four sites in 2015. As methods and results were comparable between the 2 years, and the 2015 study was more inclusive, only results for 2015 are detailed here. A summary of the 2014 results are shown in Supplementary Figures 1, 2.
Paternity Assignment
Paternity was assigned using the rare allele approach, as described in Butcher et al. (2020b). In brief, all A. tuberculatus pollen receptor and donor plants, and a subset of seeds, were genotyped at markers for the external transcribed spacer region (ETS) and putative DEAD box ATP-dependent RNA helicase gene (PutDead). All S. lycopersicum pollen receptor and donor plants, and seeds from a subset of fruits, were genotyped at markers for spotted wilt virus disease resistance (Sw-5) and Fusarium wilt race 3 virus resistance (I-3) genes. We then used simple exclusion methods, similar to the paternity assignment methods presented in Ellstrand (1984), to confirm that pollen dispersed from an experimental donor and not a local pollen donor. We found that two S. lycopersicum fruits were pollinated by a local donor, one from the Queens Zoo site and one from the Rose Hill site. Also, we observed other non-experimental S. lycopersicum near both the Rose Hill and Queens Zoo sites. However, our experimental design (i.e., rare alleles and simple exclusion) does not allow us to definitively locate the donor for these fruits. Therefore, we were not able to determine a pollen dispersal distance, and, thus, these two fruits were removed from the analyses.
Curve Fitting
Curve fitting was performed using the Curve Fitting Tool in the MATLAB Release 2016b Curve Fitting Toolbox 3.5.4 (The MathWorks, Inc, Natick, MA, United States). We used a non-linear, least-squares approach with a trust-region algorithm to fit exponential decay, inverse power, Weibull, logistic, and Gaussian curves to the relationship between number of seeds (A. tuberculatus) or fruits (S. lycopersicum) produced and distance from the pollen donor group.
The exponential decay curve was included because it has been used extensively in studies that assessed pollen dispersal patterns using curve fitting (e.g., Beckie and Hall, 2008), including studies on A. tuberculatus (Liu et al., 2012; Sarangi et al., 2017). The inverse power curve also has been used to model pollen dispersal in a range of crop and other species (Beckie and Hall, 2008; Buehler et al., 2012; Chang et al., 2018). The Weibull and logistic curves are not widely used in curve fitting studies, but were included to enable comparisons to the results of the PDF analyses, which included both functions. Similarly, although pollen dispersal is expected to decrease more rapidly with increasing distance from the pollen source (i.e., leptokurtic curves) than expected by the Gaussian curve, this curve was included because the Gaussian PDF is often included in PDF fitting studies (Lavigne et al., 1998; Goto et al., 2006), as we did in this study.
For all curves, parameters were not selected a priori, but instead were estimated by the MATLAB Curve Fitting Toolbox when fitting the curves to the data. Curves with any parameters that were not significantly different than zero, based on the 95% confidence interval around the parameter estimate, which was calculated using the t-distribution, or curves that did not converge after 400 fitting iterations were excluded. The remaining were considered candidate curves and we used adjusted R2 (Buehler et al., 2012) and root mean squared error (RMSE) to assess fit (Loureiro et al., 2016).
Probability Density Function Fitting
Probability density function fitting was conducted using the Distribution Fitting Tool in the MATLAB Release 2016b Statistics and Machine Learning Toolbox 11.0 (The MathWorks, Inc). For each site, we calculated the mean number of seeds (A. tuberculatus) or fruits (S. lycopersicum) produced by the two pollen receptors at each distance from the pollen donor group. Each seed or fruit was counted as a dispersal event, and a probability histogram was generated by binning these events by distance (i.e., distribution of dispersal distances). We then fit exponential, inverse Gaussian, Gaussian, logistic, and Weibull PDFs to these probability histograms using maximum likelihood.
We chose a wide range of PDFs because PDF fitting has not been used to investigate pollen dispersal dynamics in A. tuberculatus or S. lycopersicum. We included the exponential, logistic, Gaussian, and Weibull PDFs as they have been used in pollen dispersal studies on other species (Lavigne et al., 1998; Austerlitz et al., 2004; Goto et al., 2006; Klein et al., 2006b). We included the inverse Gaussian because this function has been used to model wind-dispersed propagule dispersal patterns (e.g., Quinn et al., 2011; Bullock et al., 2017). We also chose this range of PDFs because the tail-thickness is a distinguishing characteristic of PDF shape, and these PDFs represent a range of tail-shapes, including thin-tailed (Gaussian), exponential-tailed (exponential and inverse Gaussian), and fat-tailed (logistic), as well as one flexible-tailed PDF that can be thin-tailed, exponential, or fat-tailed depending on the shape parameter estimate (Weibull). Specifically, if the Weibull function is a candidate, the PDF is thin-tailed if the shape parameter (b) = 2, exponential if b = 1, or fat-tailed if b < 1.
As with curve fitting, parameters for all PDFs were not selected a priori, but instead were estimated by the MATLAB Curve Fitting Toolbox when fitting the PDFs to the probability histograms. We excluded PDFs with any parameters that were not significantly different from zero, based on the 95% confidence interval around the parameter estimate, which was calculated using the t-distribution. We then used the log-likelihood values estimated during maximum likelihood PDF fitting to calculate Akaike information criterion values (Fenart et al., 2007), corrected for small sample size (AICc), and used these values to choose candidate PDFs. Specifically, the PDF with the lowest AICc value was considered the top PDF, and PDFs with ΔAICc < 4 from the top PDF were considered candidate PDFs.
Results
Curve Fitting
For the curve fitting analyses, the exponential decay and inverse power curves generally provided the best, or only, fits to pollen dispersal patterns across both green roof and ground-level sites for both A. tuberculatus and S. lycopersicum. After considering parameter significance, the exponential decay and inverse power curves were the only candidate curves for the A. tuberculatus data at the Rose Hill site (exponential – R2 = 0.69, RMSE = 883.1; inverse power – R2 = 0.51, RMSE = 1009.0) and the Calder site (exponential – R2 = 0.74, RMSE = 494.3; inverse power – R2 = 0.75, RMSE = 489.7; Figure 2). The exponential decay and inverse power curves were also candidate curves at the Javits site, as well as the Gaussian curve (exponential – R2 = 0.78, RMSE = 372.0; inverse power – R2 = 0.44, RMSE = 590.3; Gaussian – R2 = 0.84, RMSE = 319.3; Figure 2). There were no candidate curves for A. tuberculatus at the Queens Zoo, as data yielded either parameter estimates that were not significantly different from zero or did not converge, or the model itself did not converge.
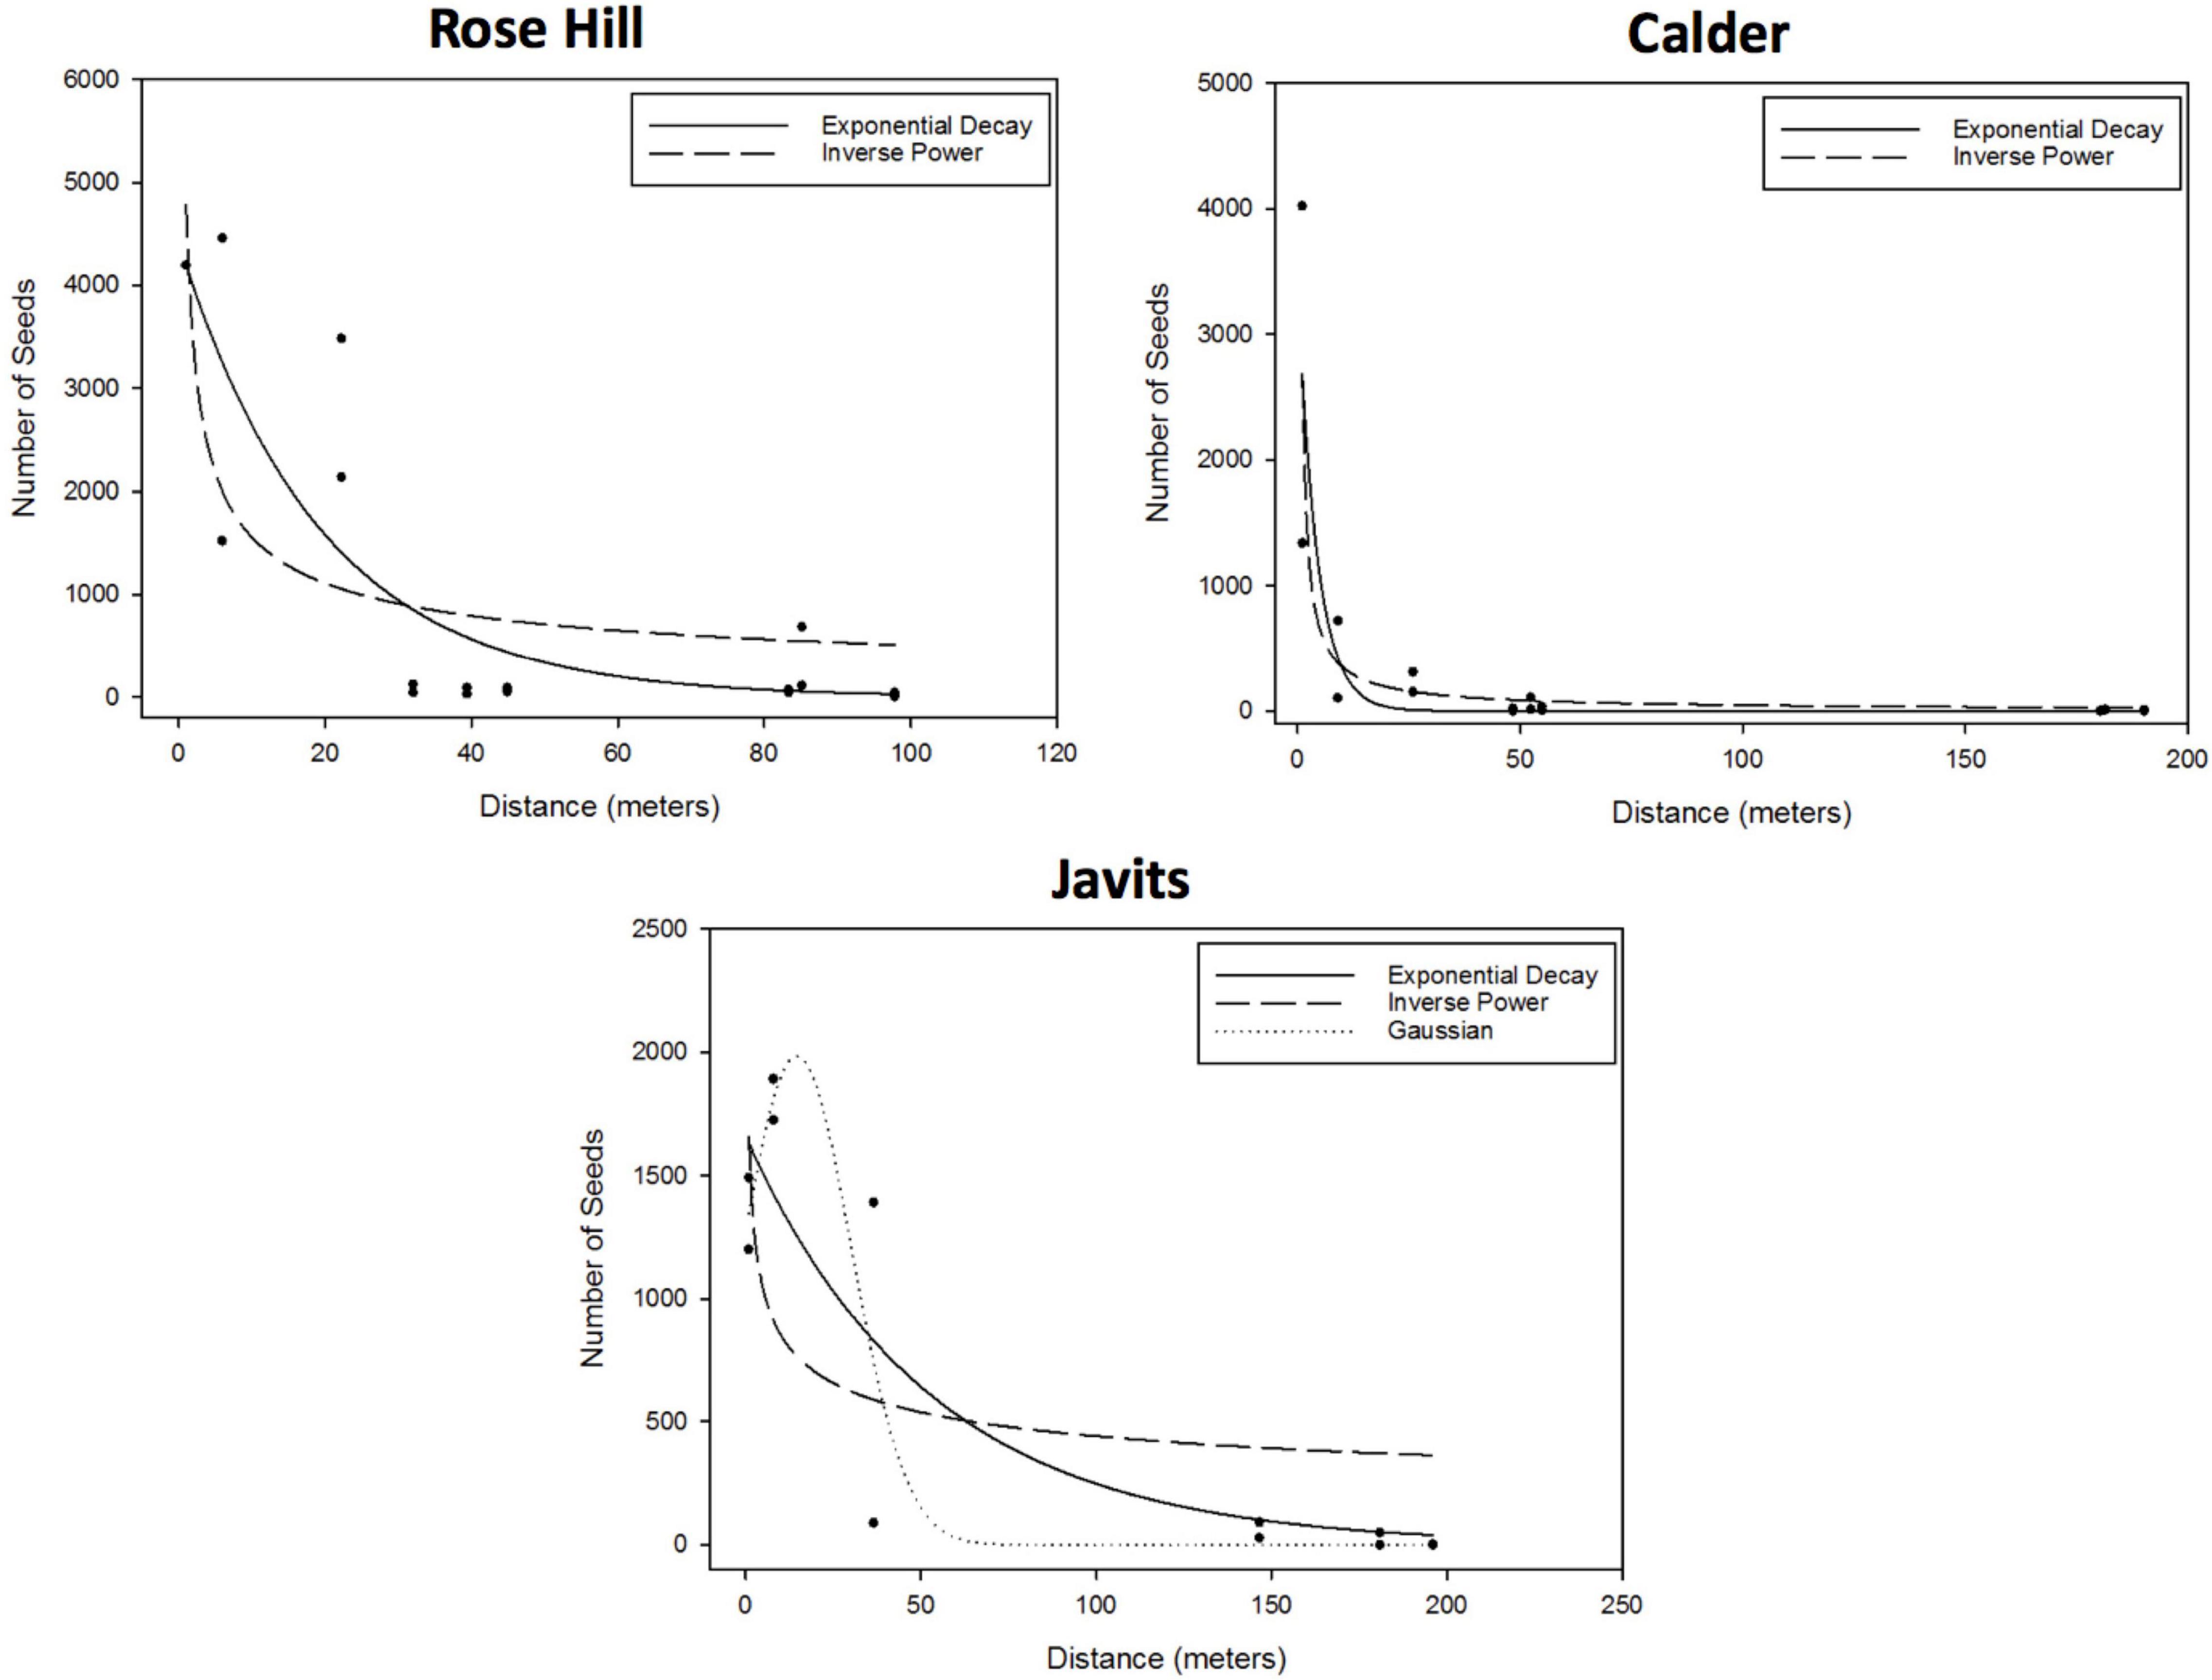
Figure 2. Results of the A. tuberculatus curve fitting to the effect of distance to the pollen donor group (m) on the number of seeds, proxy of the number of flowers pollinated (i.e., degree of pollen dispersal). After considering parameter significance, the exponential and inverse power curves were the only candidate curves at the Rose Hill site (exponential – R2 = 0.69, RMSE = 883.1; inverse power – R2 = 0.51, RMSE = 1009.0) and the Calder site (exponential – R2 = 0.74, RMSE = 494.3; inverse power – R2 = 0.75, RMSE = 489.7). The exponential and inverse power curves were also candidate curves, as well as the Gaussian curve, at the Javits site (exponential – R2 = 0.78, RMSE = 372.0; inverse power – R2 = 0.44, RMSE = 590.3; Gaussian – R2 = 0.84, RMSE = 319.3). There were no candidate curves for A. tuberculatus at the Queens Zoo, as data yielded either parameter estimates that were not significantly different from zero or did not converge.
For S. lycopersicum, the exponential decay and inverse power curves were the only candidate curves at all four sites: Rose Hill (exponential – R2 = 0.88, RMSE = 0.86; inverse power – R2 = 0.88, RMSE = 0.85), Calder (exponential – R2 = 0.92, RMSE = 5.49; inverse power – R2 = 0.68, RMSE = 10.75), Javits (exponential – R2 = 0.85, RMSE = 0.58; inverse power – R2 = 0.81, RMSE = 0.65), and Queens Zoo (exponential – R2 = 0.90, RMSE = 0.89; inverse power – R2 = 0.84, RMSE = 1.10; Figure 3).
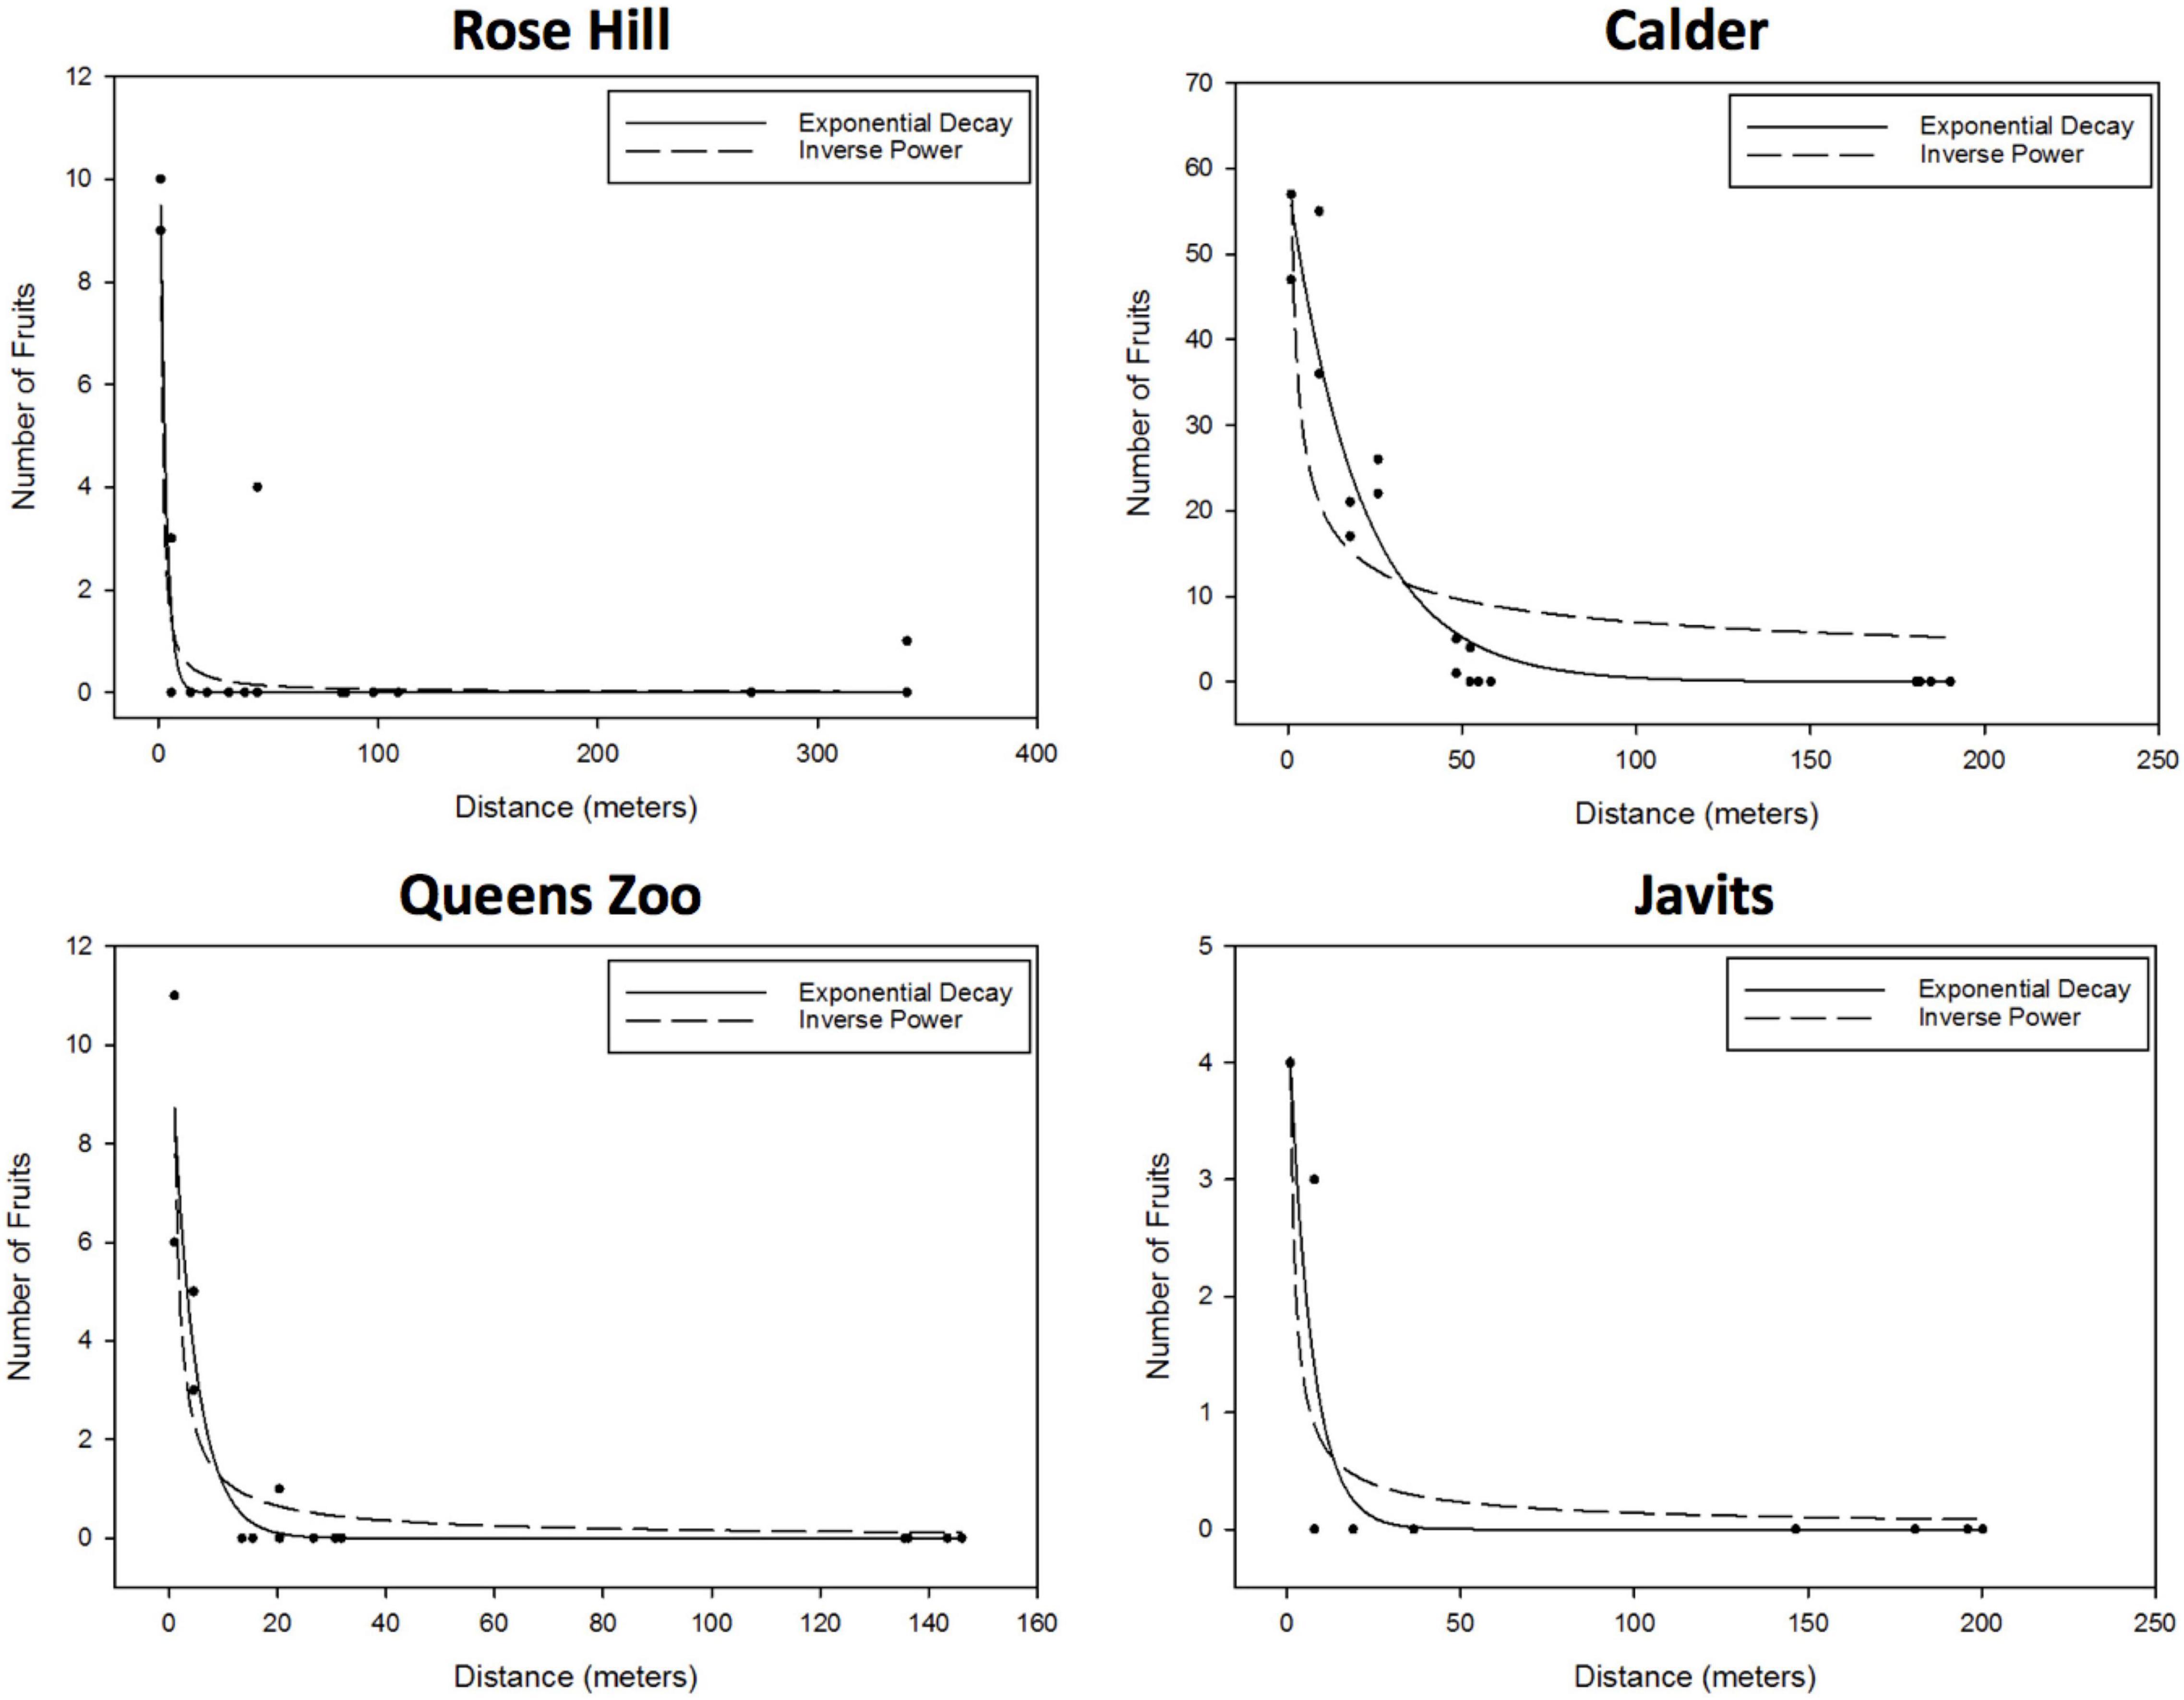
Figure 3. Results of the S. lycopersicum curve fitting to the effect of distance to the pollen donor group on the number of fruits, proxy of the number of flowers pollinated (i.e., degree of pollen dispersal). After considering parameter significance, exponential and inverse power curves were the only candidate curves at all four sites: Rose Hill (exponential – R2 = 0.88, RMSE = 0.86; inverse power – R2 = 0.88, RMSE = 0.85), Calder (exponential – R2 = 0.92, RMSE = 5.49; inverse power – R2 = 0.68, RMSE = 10.75), Javits (exponential – R2 = 0.85, RMSE = 0.58; inverse power – R2 = 0.81, RMSE = 0.65), and Queens Zoo (exponential – R2 = 0.90, RMSE = 0.89; inverse power – R2 = 0.84, RMSE = 1.10).
Probability Density Function Fitting
For the PDF fitting analyses, the exponential decay and inverse Guassian curves generally provided the best, or only, fits to pollen dispersal patterns across both green roof and ground-level sites for both A. tuberculatus and S. lycopersicum. Inverse Gaussian was the only candidate PDF for A. tuberculatus at all four sites: Rose Hill (AICc = 70753.80, ΔAICc = 0.00; mean dispersal distance = 12.5 m), Calder (AICc = 14573.35, ΔAICc = 0.00; mean dispersal distance = 6.0 m), Javits (AICc = 27469.61, ΔAICc = 0.00; mean dispersal distance = 14.2 m), and Queens Zoo (AICc = 5772.29, ΔAICc = 0.00; mean dispersal distance = 7.1 m; Figure 4).
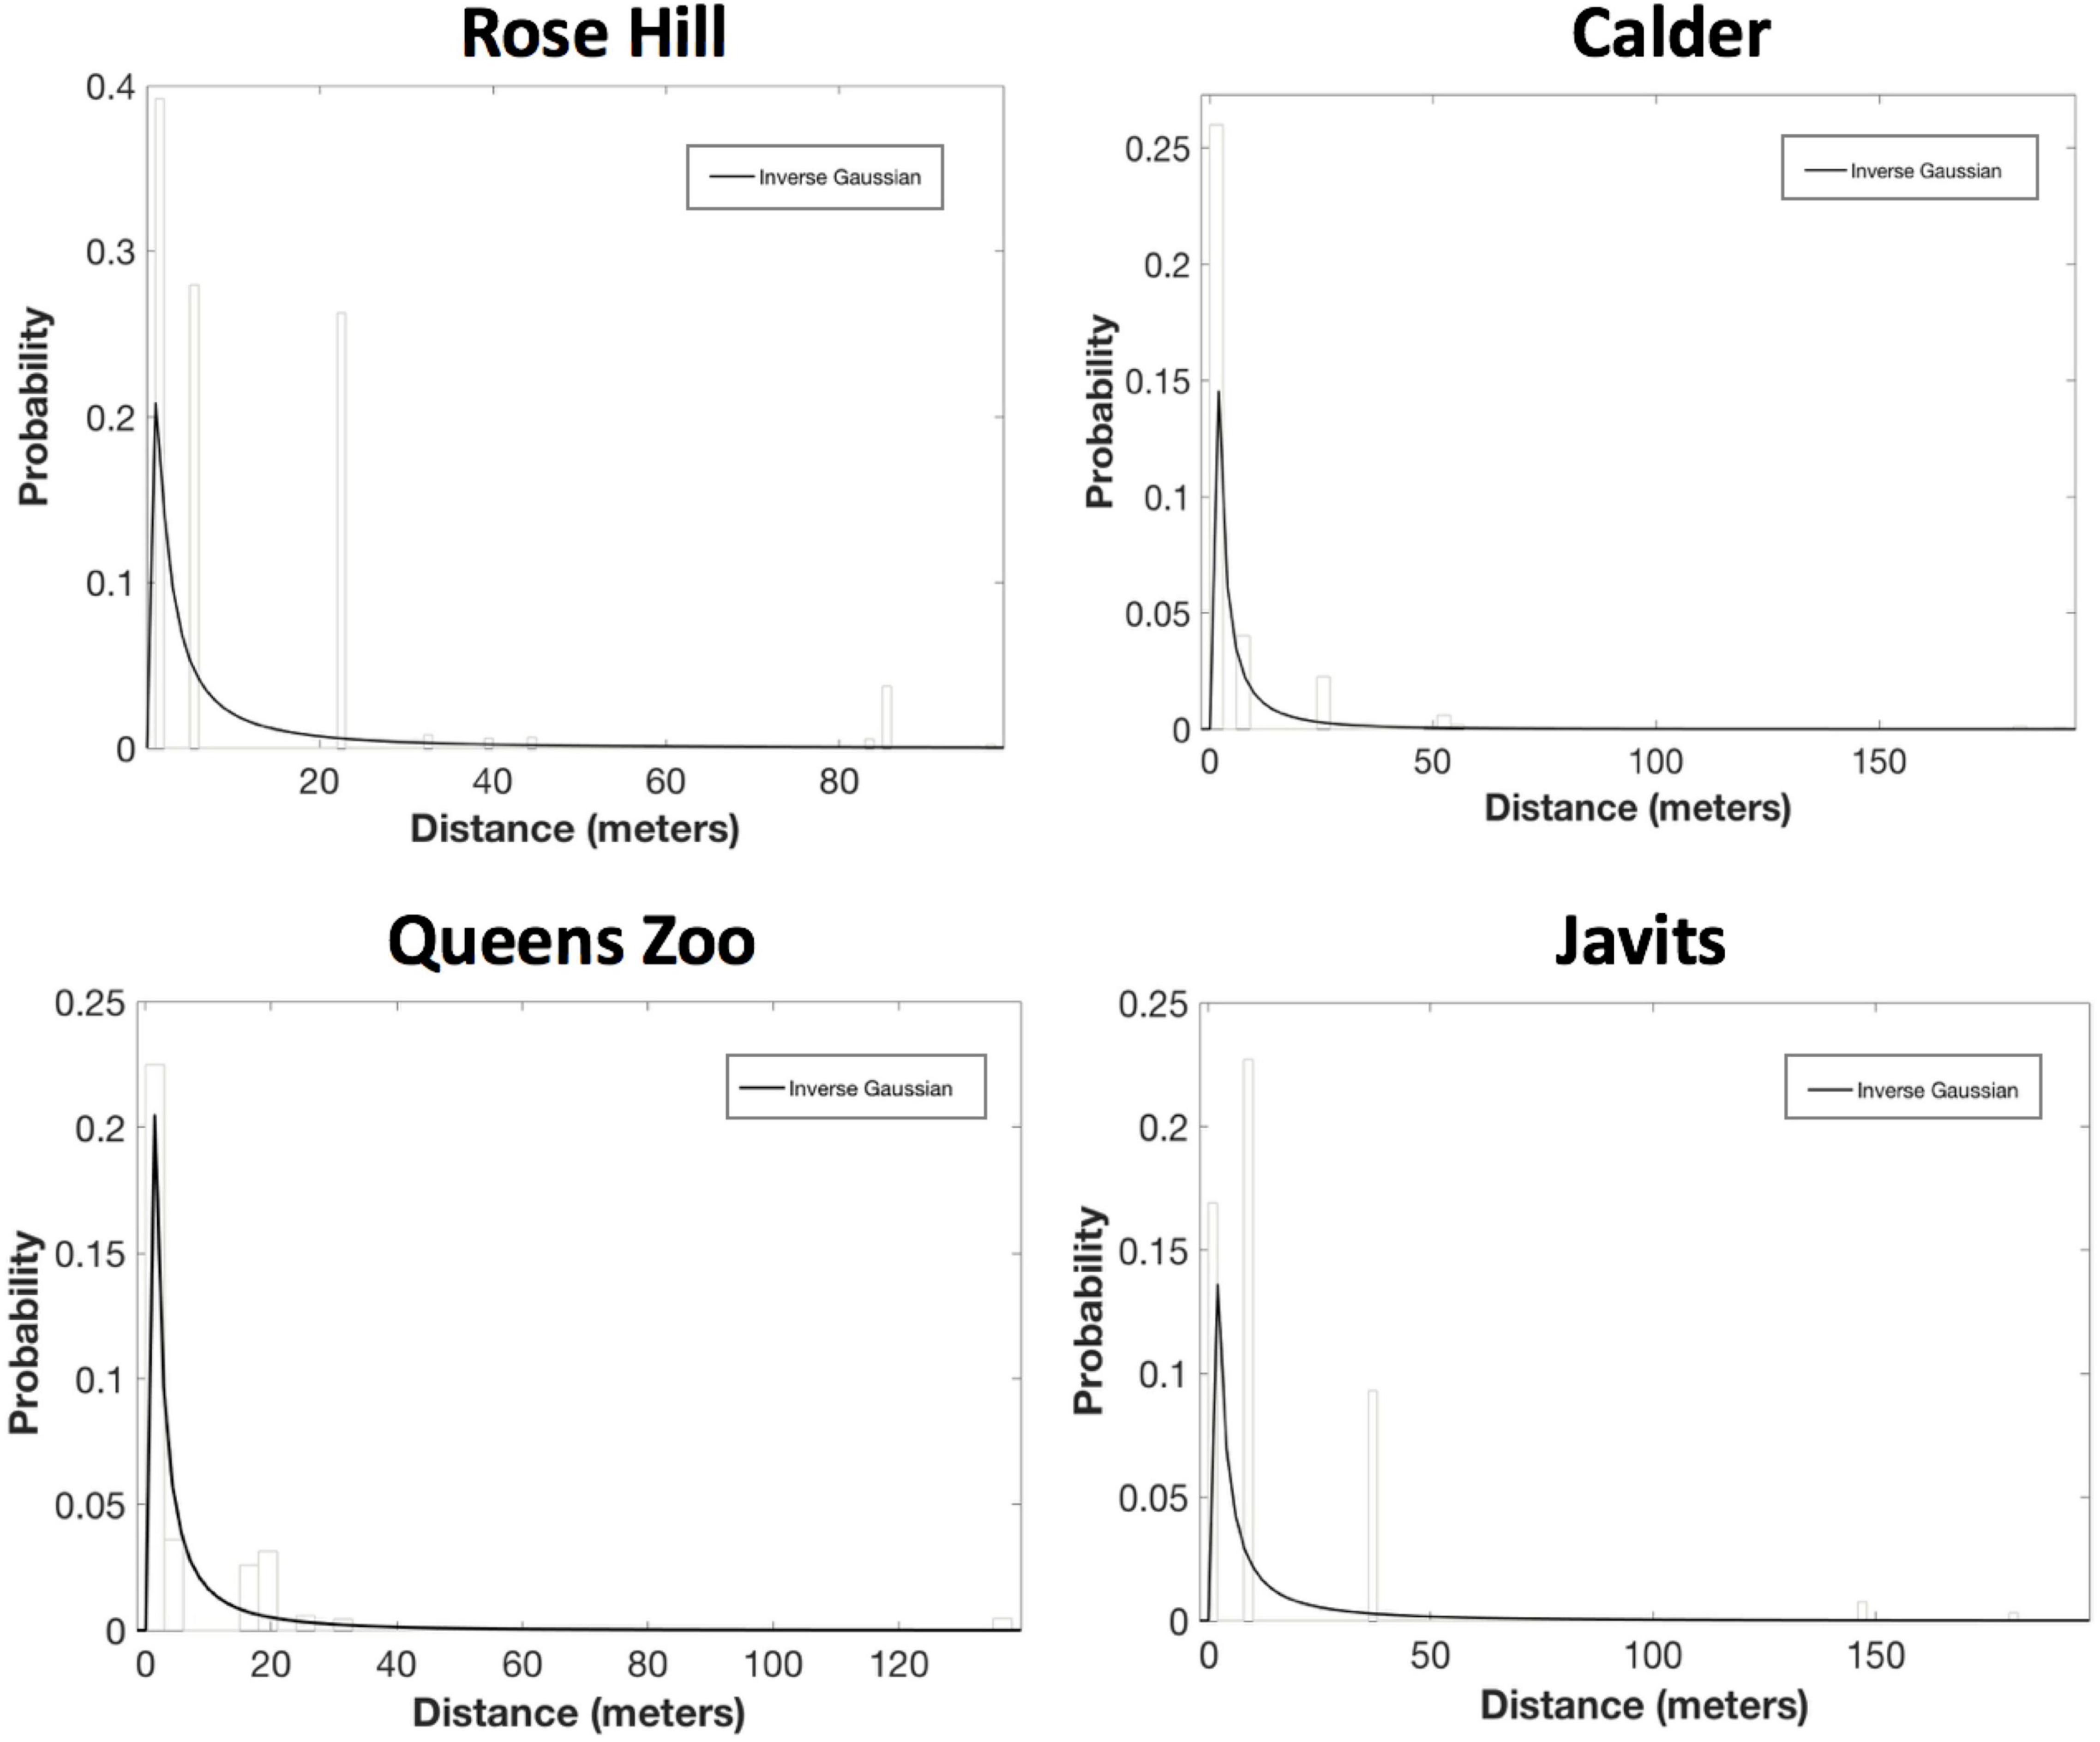
Figure 4. Results of the probability density function fitting to the A. tuberculatus pollen dispersal probability histograms. After considering parameter significance, inverse Gaussian was the only candidate PDF for A. tuberculatus at all four sites: Rose Hill (AICc = 70753.80, ΔAICc = 0.00; mean dispersal distance = 12.5 m), Calder (AICc = 14573.35, ΔAICc = 0.00; mean dispersal distance = 6.0 m), Javits (AICc = 27469.61, ΔAICc = 0.00; mean dispersal distance = 14.2 m), and Queens Zoo (AICc = 5772.29, ΔAICc = 0.00; mean dispersal distance = 7.1 m).
For S. lycopersicum, exponential was the only candidate PDF at the Rose Hill site (AICc = 137.22, ΔAICc = 0.00; mean dispersal distance = 30.2 m) and the Javits site (AICc = 34.45, ΔAICc = 0.00; mean dispersal distance = 3.3; Figure 5). And, exponential was a candidate PDF for S. lycopersicum at the Calder site (AICc = 1008.68, ΔAICc = 0.69; mean dispersal distance = 11.5 m), though Weibull was the top PDF at this site (AICc = 1007.99, ΔAICc = 0.00, b = 0.90; mean dispersal distance = 11.5 m; Figure 4). Finally, inverse Gaussian was the only candidate PDF for S. lycopersicum at the Queens Zoo site (AICc = 63.03, ΔAICc = 0.00; mean dispersal distance = 3.4; Figure 5).
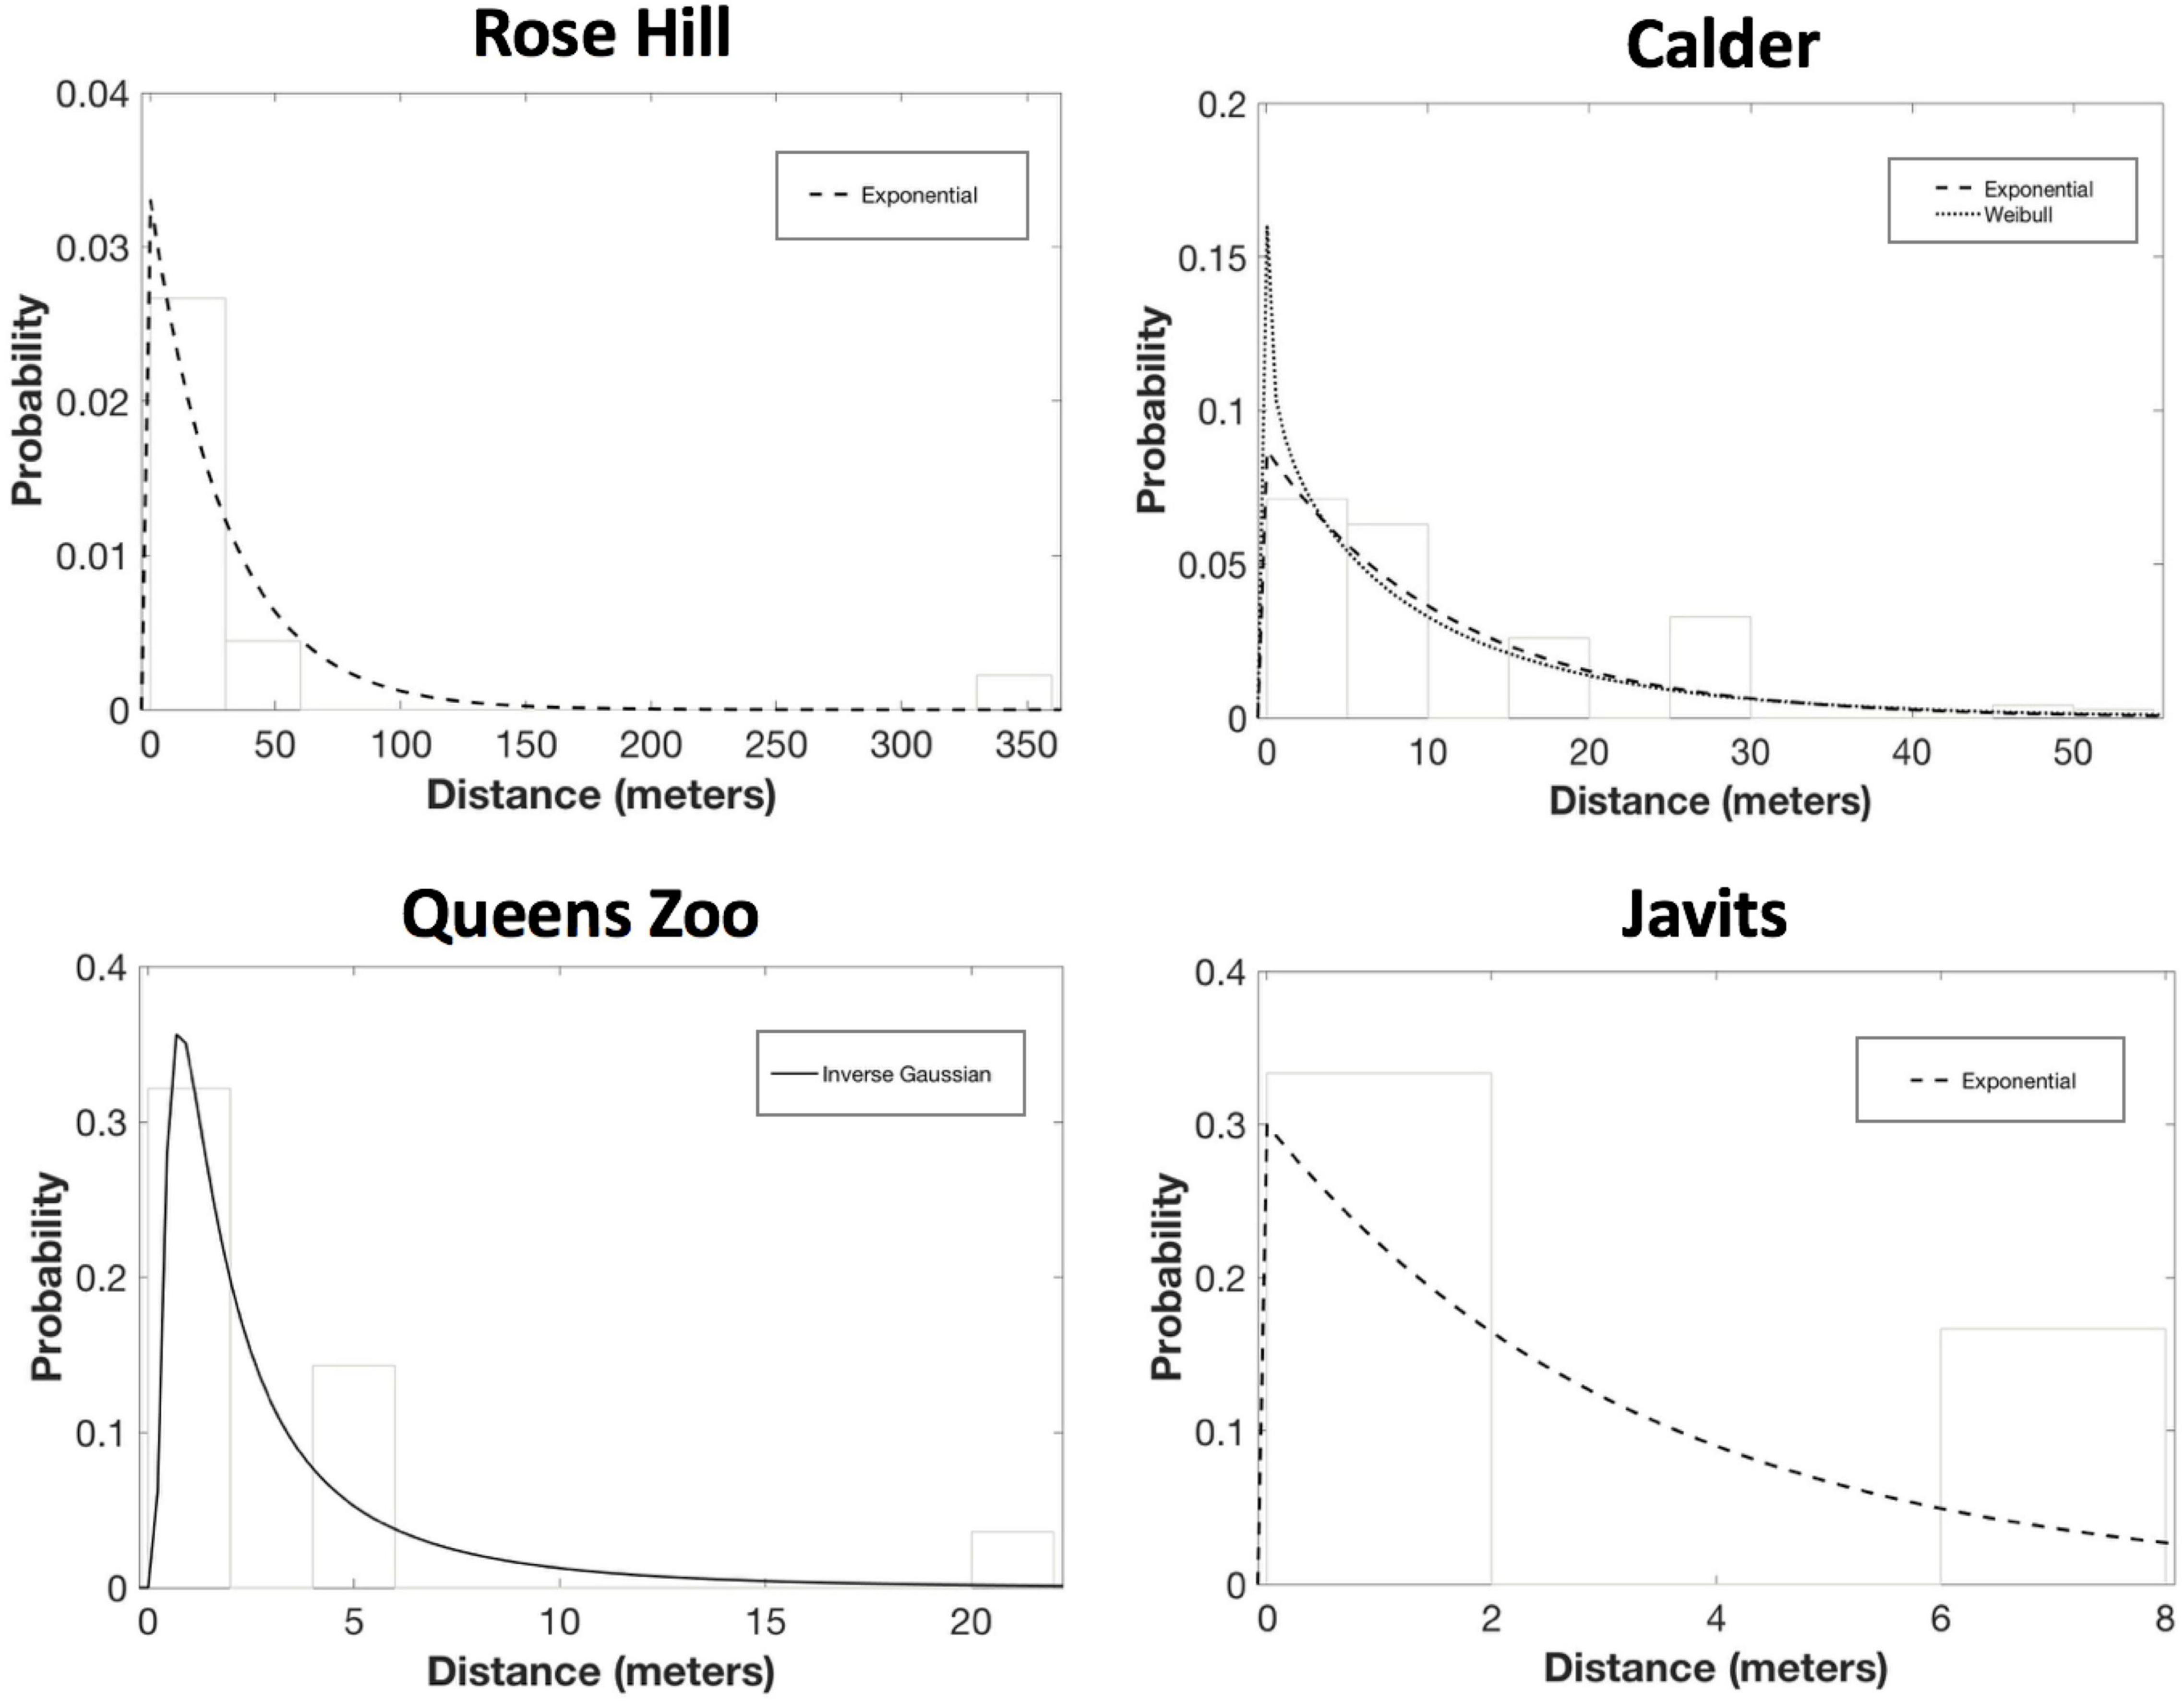
Figure 5. Results of the probability density function fitting to the S. lycopersicum pollen dispersal probability histograms. After considering parameter significance, exponential was the only candidate PDF at Rose Hill (AICc = 137.22, ΔAICc = 0.00; mean dispersal distance = 30.2 m). Exponential also was the only candidate PDF for S. lycopersicum at Javits (AICc = 34.45, ΔAICc = 0.00; mean dispersal distance = 3.3). And, exponential was a candidate PDF for S. lycopersicum at Calder (AICc = 1008.68, ΔAICc = 0.69; mean dispersal distance = 11.5 m), though Weibull was the top PDF at this site (AICc = 1007.99, ΔAICc = 0.00, b = 0.90; mean dispersal distance = 11.5 m). Finally, inverse Gaussian was the only candidate PDF for S. lycopersicum at the Queens Zoo (AICc = 63.03, ΔAICc = 0.00; mean dispersal distance = 3.4).
Discussion
Long-distance pollen dispersal plays a key role in gene flow among populations (Levin and Kerster, 1974; Ennos, 1994), yet models of pollen dispersal differ substantially in their assumptions of relative long-distance dispersal. In this study, both curve fitting and PDF fitting analyses suggested pollen dispersal patterns at two urban green roof and two ground-level sites usually were exponential-shaped in both wind-pollinated A. tuberculatus and insect-pollinated S. lycopersicum. The curve fitting results are not surprising given that these curves fit the quick initial decrease in pollen dispersal with increasing distance, while also providing a good fit for comparatively rare long-distance dispersal events (Beckie and Hall, 2008; Buehler et al., 2012). However, in contrast to our results, most PDF studies suggest pollen dispersal is fat-tailed (e.g., Dick et al., 2003; Austerlitz et al., 2004; Colabella et al., 2014). Accordingly, our results suggest that A. tuberculatus and S. lycopersicum in the New York metropolitan area potentially exhibit comparatively less long-distance pollen dispersal than plants in less-urban habitats. If so, then less gene flow may occur among populations in urbanized landscapes, suggesting future studies directly comparing urban vs. rural pollen dispersal patterns are warranted.
Our results also are noteworthy for the similar patterns observed between curve and PDF fitting. Although consistency of results between curve and PDF fitting may seem intuitive, general patterns observed in these studies suggest contrasting results. More specifically, as noted above, curve fitting studies generally observe patterns that follow the exponential decay and inverse power curves, while most PDF studies have found that fat-tailed PDFs provide the best fit. Our study is the first to our knowledge to address this apparent dichotomy using the same empirical data, and suggest that curve and PDF fitting may yield similar results when used on the same data set. If so, then the contrasting general patterns observed across curve and PDF fitting studies may reflect differences in the systems studied, or other factors (e.g., dispersal mechanism, microclimate).
Curve Fitting
As we hypothesized, the exponential decay curve provided a good fit to the relationship between pollen dispersal and distance to the pollen donor group at both the two green roof and the two ground-level sites. More specifically, an exponential decay function accounted for 69% or more of the decrease in the number of A. tuberculatus seeds with distance at three sites, and 85% or more of the decrease in the number of S. lycopersicum fruits at all four sites. The inverse power curve generally also provided a good fit to the relationship, accounting for 41% or more of the variation in A. tuberculatus seed numbers at three sites, and 68% or more of the variation in S. lycopersicum fruit numbers at all sites. The superior fit of the exponential decay curve to the A. tuberculatus data are consistent with previous studies that modeled A. tuberculatus pollen dispersal (Liu et al., 2012; Sarangi et al., 2017). However, both studies chose the exponential decay curve a priori, and did not compare fits of different curves. As a result, our study is the first to suggest that the inverse power curve may also be suitable for modeling A. tuberculatus pollen dispersal patterns. Additionally, although the relationship between pollen dispersal and distance has not been investigated in S. lycopersicum, our results are also consistent with other studies on insect-pollinated species, where the exponential decay (e.g., Van Rossum and Triest, 2010; Van Rossum et al., 2011) and inverse power curves (e.g., Barbour et al., 2005; Buehler et al., 2012) have both been used to model pollen dispersal.
Despite the relatively common use of both exponential decay and inverse power functions to assess pollen dispersal using curve fitting, only two studies have compared them directly. Though Chang et al. (2018) concluded that the exponential decay curve was the best fit for Panicum virgatum pollen dispersal patterns at both of two sites, the inverse power curve showed a comparatively high R2 at one of the sites. And, Barbour et al. (2005) concluded that the inverse power curve was the best fit for Eucalyptus nitens pollen dispersal, but the exponential decay curve showed a similarly high R2. The results of these studies suggest that both curves may be appropriate for modeling this relationship. Further, the suitability of both curves is consistent with patterns seen in seed dispersal studies, where the exponential decay curve may better fit the relationship between seed dispersal and distance at short distances, while the inverse power curve may better fit this relationship at longer distances (Bullock and Clarke, 2000). Although seed dispersal is often more localized then pollen dispersal, similar fits of these curves to seed dispersal data may also provide support for pollen dispersal studies, as seed and pollen dispersal exhibit analogous patterns (Sant’Anna et al., 2013; Van Tussenbroek et al., 2016).
While both exponential decay and inverse power functions may adequately model pollen dispersal patterns, the choice of these functions a priori may result in over- or under-estimation of long-distance pollen dispersal. We addressed this issue by also using Weibull, logistic and Gaussian curve fitting to analyze our data. In contrast to the exponential decay and inverse power curves, the Weibull and logistic curves did not fit any of the data, and the Gaussian curve only fit the data for one species at one location (A. tuberculatus at Javits). The Gaussian curve likely was a good fit for these data because of the anomalous observation that seed numbers peaked 8 m from the pollen donors, which follows the classic bell-shape of the Gaussian curve (Austin, 1976). Aside from this result, our analyses suggest the Gaussian, Weibull and logistic curves were less appropriate than the exponential decay and inverse power curves for modeling pollen dispersal curves for the conditions in this study.
Probability Density Function Fitting
As we hypothesized, a slightly fat-tailed Weibull PDF (b = 0.90) was the top candidate PDF for the S. lycopersicum pollen dispersal probability histogram at the Calder site. However, the exponential PDF was also a candidate PDF at this site. Further, an exponential-tailed PDF (i.e., inverse Gaussian or exponential) was the only candidate PDF for S. lycopersicum at the other three sites, as well as for A. tuberculatus at all sites. Although other studies have observed that exponential-tailed PDFs fit pollen dispersal probability histograms better than the thin-tailed Gaussian (Austerlitz et al., 2004; Skarpaas and Shea, 2007; de-Lucas et al., 2008; Marchelli et al., 2012), many studies have found that fat-tailed PDFs provide the best fit (e.g., Albaladejo et al., 2012; Colabella et al., 2014), while few studies have observed that exponential-tailed PDFs specifically provide the best fit (e.g., Millerón et al., 2012). This suggests long-distance pollen dispersal is more common than explained by an exponential-tailed PDF, in contrast to our results.
The uniformity of our PDF analyses across sites and species suggests long-distance pollen dispersal was less frequent in the urban sites in our study compared with many studies (Klein et al., 2006a). Urbanization is typified by the impervious matrix (Fernandez-Juricic and Jokimäki, 2001; Ramalho and Hobbs, 2012), which may inhibit pollen dispersal. For example, buildings may interfere with wind patterns that transport pollen (Emberlin and Norris-Hill, 1991). Also, urban cores typically host fewer native plant species than surrounding areas (McKinney, 2008), which may reduce the abundance (Franceschinelli et al., 2017) and species richness of bees (Matteson et al., 2008), the primary pollinators of S. lycopersicum. If so, pollinator richness and abundance, and long-distance dispersal, may be higher at Calder, which may account for why Calder was the only site that exhibited slightly fat-tailed pollen dispersal in S. lycopersicum. Although dispersal was primarily exponential-tailed for both A. tuberculatus and S. lycopersicum in our study, the PDF analyses did not exhibit a truncated tail, and an exponential tail shape implies more long-distance dispersal than a thin-tailed PDF, indicating pollen dispersal at both our green roof and ground-level sites was intermediate between studies showing extensive long-distance dispersal and patterns suggested by thin-tailed PDFs (Klein et al., 2006a).
Conclusion
In this study, we used both curve fitting and PDF fitting to assess the pollen dispersal dynamics of A. tuberculatus and S. lycopersicum at two green roof and two ground-level sites in the New York metropolitan area. The consistency of our results across sites and modeling methods suggest that, for both species, pollen dispersal in the New York metropolitan area generally may be exponential-shaped. Although comparable results between analysis types may also be true for other species, our study is the first, to our knowledge, to compare curve and PDF fitting analyses, indicating more research is needed to assess whether curve fitting and PDF fitting lead to comparable results in other species and systems. This issue is highlighted by differences between our results and previous studies; while our results are consistent with other pollen dispersal studies using curve fitting (e.g., Ma et al., 2004; Liu et al., 2012; Dong et al., 2016), they do not agree with the majority of studies using PDF fitting in less-urban environments (e.g., Austerlitz et al., 2004; Jha and Dick, 2010; Colabella et al., 2014) and may indicate A. tuberculatus and S. lycopersicum pollen dispersal in the New York metropolitan area may be limited compared with plants in less-urban areas. While the few studies on pollen dispersal in urban environments have found that long-distance dispersal does occur and may maintain genetic diversity within the population, most pollen disperses short distances (e.g., Van Rossum, 2009; Diniz et al., 2019; Ksiazek-Mikenas et al., 2019). Finally, the collective results of this study not only add to the knowledge of A. tuberculatus and S. lycopersicum pollen dispersal patterns and pollen dispersal in urban areas, but also studies on pollen dispersal across species, dispersal mechanisms, and environments.
Future Directions
Pollen and seed dispersal both contribute to gene flow in plants, but pollen is often considered the more important element driving long-distance gene flow (Levin and Kerster, 1974; Ennos, 1994). Consequently, understanding patterns of pollen movement is also key to understanding gene flow in plants. Our study addressed several questions about plant gene flow via pollen in urban environments, but also raises additional questions that warrant future studies to expand on the limited number of studies conducted on this topic.
First, future studies using these modeling techniques should be conducted, including estimating overall dispersal predictions. Our results from the curve-fitting analyses suggest the Gaussian, Weibull and logistic curves were less appropriate than the exponential decay and inverse power curves for modeling pollen dispersal, but because of the widespread use of the Gaussian, Weibull, and logistic curves for PDF fitting, further research is still needed to address whether these curves may provide better fits to pollen dispersal curves in other systems. In this study, we were able to calculate mean dispersal distance and the maximum distance that pollen dispersed to our experimental pollen receptors, which were at known distances from the experimental pollen donor group. However, because long-distance pollen dispersal is critical for gene flow in plant populations, it is also important to estimate how far pollen could potentially disperse. Therefore, theoretical overall long-distance dispersal predictions should be incorporated in future studies.
Second, additional research is needed in larger and diverse habitats, including further studies on urban pollen dispersal. This study was conducted in sites with shorter pollen dispersal distances (i.e., <350 m) compared with some other studies (e.g., >1 km). Thus, future studies on pollen dispersal in both urban areas should examine pollen dispersal at larger spatial scales compared with our study. Further, studies directly comparing pollen dispersal patterns in urban vs. rural areas are needed to confirm whether, and to what extent, long-distance pollen dispersal may be comparatively less in urban areas, as suggested by our results.
Finally, added studies on pollen dispersal in species that are self-compatible and species whose pollen is dispersed by other vectors (i.e., other animal vectors), as well as studies that incorporate climatic variables are needed to further investigate pollen dispersal patterns. In this study, A. tuberculatus and the NC4 Grape line of S. lycopersicum were self-incompatible; however, pollen dispersal patterns of species that are reproductively self-compatible should also be investigated in urban environments. Additionally, although we investigated a wind-dispersed species, as well as an animal-dispersed species, future studies should investigate additional wind and animal-dispersed species, including species that are dispersed by animals other than bees to determine if the pollen dispersal patterns are the result of a difference in dispersal vector. Microclimatic variations between sites may also affect pollen dispersal patterns, so future studies should also measure and account for these variables.
Data Availability Statement
The datasets presented in this study can be found in online repositories. The names of the repository/repositories and accession number(s) can be found below: https://doi.org/10.7910/DVN/CMUUVL.
Author Contributions
CB conceived of, designed, and executed this work under the advisement of BR, SA, and JL. All authors participated in writing and editing this manuscript, gave final approval for this version to be submitted for publication, and agreed to be accountable for the work.
Funding
This study was funded by a Clare Boothe Luce Program Fellowship (from the Henry Luce Foundation) to CB and Fordham University’s Louis Calder Center, Department of Biological Sciences, Graduate School of Arts and Sciences, and Graduate Student Association.
Conflict of Interest
The authors declare that the research was conducted in the absence of any commercial or financial relationships that could be construed as a potential conflict of interest.
Publisher’s Note
All claims expressed in this article are solely those of the authors and do not necessarily represent those of their affiliated organizations, or those of the publisher, the editors and the reviewers. Any product that may be evaluated in this article, or claim that may be made by its manufacturer, is not guaranteed or endorsed by the publisher.
Acknowledgments
We thank S. Hutton for providing primer sequences and laboratory support; M. Owen and R. Gardner for providing the seeds used as parent plants; the New York Botanical Garden, Fordham University’s Louis Calder Center and Rose Hill Campus, Queens Zoo, and Javits Center for site access. We would also like to thank L. Costaldi, B. Marshack, J. McCarthy and A. Montes for laboratory and field assistance, and X. Zhang for assistance with statistical analyses. Finally, we thank the two reviewers of this manuscript, as well as the Editor and the entire Frontiers in Ecology and Evolution Editorial Office whose comments and suggestions helped to improve this manuscript.
Supplementary Material
The Supplementary Material for this article can be found online at: https://www.frontiersin.org/articles/10.3389/fevo.2022.790464/full#supplementary-material
References
Albaladejo, R. G., Guzmán, B., González-Martínez, S. C., and Aparicio, A. (2012). Extensive pollen flow but few pollen donors and high reproductive variance in an extremely fragmented landscape. PLoS One 7:e49012. doi: 10.1371/journal.pone.0049012
Aloisio, J., Tuininga, A., and Lewis, J. (2016). Crop species selection effects on stormwater runoff and edible biomass in an agricultural green roof microcosm. Ecol. Eng. 88, 20–27. doi: 10.1016/j.ecoleng.2015.12.022
Austerlitz, F., Dick, C. W., Dutech, C., Klein, E. K., Oddou-Muratorio, S., Smouse, P. E., et al. (2004). Using genetic markers to estimate the pollen dispersal curve. Mol. Ecol. 13, 937–954. doi: 10.1111/j.1365-294x.2004.02100.x
Austin, M. (1976). On non-linear species response models in ordination. Plant Ecol. 33, 33–41. doi: 10.7717/peerj.95
Baldoni, A., Wadt, L., Campos, T., Silva, V., Azevedo, V., Mata, L., et al. (2017). Contemporary pollen and seed dispersal in natural populations of Bertholletia excelsa (Bonpl.). Genet. Mol. Res. 16:gmr16039756. doi: 10.4238/gmr16039756
Barbour, R. C., Potts, B. M., and Vaillancourt, R. E. (2005). Pollen dispersal from exotic eucalypt plantations. Conserv. Genet. 6, 253–257. doi: 10.1007/s10592-004-7849-z
Becker, U., Colling, G., Dostal, P., Jakobsson, A., and Matthies, D. (2006). Local adaptation in the monocarpic perennial Carlina vulgaris at different spatial scales across Europe. Oecologia 150, 506–518. doi: 10.1007/s00442-006-0534-9
Beckie, H. J., and Hall, L. M. (2008). Simple to complex: modelling crop pollen-mediated gene flow. Plant Sci. 175, 615–628. doi: 10.1016/j.plantsci.2008.05.021
Bittencourt, J., and Sebbenn, A. (2007). Patterns of pollen and seed dispersal in a small, fragmented population of the wind-pollinated tree Araucaria angustifolia in southern Brazil. Heredity 99, 580–591. doi: 10.1038/sj.hdy.6801019
Browne, L., Ottewell, K., Sork, V. L., and Karubian, J. (2018). The relative contributions of seed and pollen dispersal to gene flow and genetic diversity in seedlings of a tropical palm. Mol. Ecol. 27, 3159–3173. doi: 10.1111/mec.14768
Buehler, D., Graf, R., Holderegger, R., and Gugerli, F. (2012). Contemporary gene flow and mating system of Arabis alpina in a Central European alpine landscape. Ann. Bot. 109, 1359–1367. doi: 10.1093/aob/mcs066
Bullock, J. M., and Clarke, R. T. (2000). Long distance seed dispersal by wind: measuring and modelling the tail of the curve. Oecologia 124, 506–521. doi: 10.1007/PL00008876
Bullock, J. M., Mallada González, L., Tamme, R., Götzenberger, L., White, S. M., Pärtel, M., et al. (2017). A synthesis of empirical plant dispersal kernels. J. Ecol. 105, 6–19. doi: 10.1111/1365-2745.12666
Butcher, C. L., Rubin, B. Y., Anderson, S. L., and Lewis, J. D. (2020a). Pollen dispersal patterns differ among sites for a wind-pollinated species and an insect-pollinated species. Am. J. Bot. 107, 1504–1517. doi: 10.1002/ajb2.1554
Butcher, C. L., Rubin, B. Y., Anderson, S. L., Nandula, V. K., Owen, M. D. K., Gardner, R. G., et al. (2020b). Combining rare alleles and grouped pollen donors to assign paternity in pollen dispersal studies. Appl. Plant Sci. 8:e11330. doi: 10.1002/aps3.11330
Byrne, M., Elliott, C., Yates, C., and Coates, D. (2007). Extensive pollen dispersal in a bird-pollinated shrub, Calothamnus quadrifidus, in a fragmented landscape. Mol. Ecol. 16, 1303–1314. doi: 10.1111/j.1365-294X.2006.03204.x
Chang, H., Snow, A. A., Mutegi, E., Lewis, E. M., Heaton, E. A., and Miriti, M. N. (2018). Extent of pollen-mediated gene flow and seed longevity in switchgrass (Panicum virgatum L.): implications for biosafety procedures. Biomass Bioenerg. 109, 114–124. doi: 10.1016/j.biombioe.2017.12.016
Clark, J. S., Fastie, C., Hurtt, G., Jackson, S. T., Johnson, C., King, G. A., et al. (1998). Reid’s paradox of rapid plant migration: dispersal theory and interpretation of paleoecological records. BioScience 48, 13–24. doi: 10.2307/1313224
Colabella, F., Gallo, L., Moreno, A., and Marchelli, P. (2014). Extensive pollen flow in a natural fragmented population of Patagonian cypress Austrocedrus chilensis. Tree Genet. Genomes 10, 1519–1529. doi: 10.1007/s11295-014-0775-4
Darmency, H., Klein, E. K., De Garanbé, T. G., Gouyon, P.-H., Richard-Molard, M., and Muchembled, C. (2009). Pollen dispersal in sugar beet production fields. Theor. Appl. Genet. 118, 1083–1092. doi: 10.1007/s00122-009-0964-y
de-Lucas, A., Robledo-Arnuncio, J., Hidalgo, E., and González-Martínez, S. (2008). Mating system and pollen gene flow in Mediterranean maritime pine. Heredity 100, 390–399. doi: 10.1038/sj.hdy.6801090
Devaux, C., Lavigne, C., Falentin-Guyomarc’h, H., Vautrin, S., Lecomte, J., and Klein, E. (2005). High diversity of oilseed rape pollen clouds over an agro-ecosystem indicates long-distance dispersal. Mol. Ecol. 14, 2269–2280. doi: 10.1111/j.1365-294X.2005.02554.x
Dick, C. W., Etchelecu, G., and Austerlitz, F. (2003). Pollen dispersal of tropical trees (Dinizia excelsa: fabaceae) by native insects and African honeybees in pristine and fragmented Amazonian rainforest. Mol. Ecol. 12, 753–764. doi: 10.1046/j.1365-294x.2003.01760.x
Di-Giovanni, F., and Kevan, P. (1991). Factors affecting pollen dynamics and its importance to pollen contamination: a review. Can. J. For. Res. 21, 1155–1170. doi: 10.1139/x91-163
Diniz, U., Lima, S. A., and Machado, I. C. (2019). Short-distance pollen dispersal by bats in an urban setting: monitoring the movement of a vertebrate pollinator through fluorescent dyes. Urban Ecosyst. 22, 281–291.
Dong, S., Liu, Y., Yu, C., Zhang, Z., Chen, M., and Wang, C. (2016). Investigating pollen and gene flow of WYMV-resistant transgenic wheat N12-1 using a dwarf male-sterile line as the pollen receptor. PLoS One 11:e0151373. doi: 10.1371/journal.pone.0151373
Ellstrand, N. C. (1984). Multiple paternity within the fruits of the wild radish, Raphanus sativus. Am. Nat. 123, 819–828. doi: 10.1086/284241
Emberlin, J., and Norris-Hill, J. (1991). Spatial variation of pollen deposition in North London. Grana 30, 190–195. doi: 10.1080/00173139109427798
Ennos, R. (1994). Estimating the relative rates of pollen and seed migration among plant populations. Heredity 72, 250–259. doi: 10.1038/hdy.1994.35
Fenart, S., Austerlitz, F., Cuguen, J., and Arnaud, J. F. (2007). Long distance pollen-mediated gene flow at a landscape level: the weed beet as a case study. Mol. Ecol. 16, 3801–3813. doi: 10.1111/j.1365-294X.2007.03448.x
Fernandez-Juricic, E., and Jokimäki, J. (2001). A habitat island approach to conserving birds in urban landscapes: case studies from southern and northern Europe. Biodivers. Conserv. 10, 2023–2043. doi: 10.1023/A:1013133308987
Franceschinelli, E. V., Elias, M. A., Bergamini, L. L., Silva-Neto, C. M., and Sujii, E. R. (2017). Influence of landscape context on the abundance of native bee pollinators in tomato crops in Central Brazil. J. Insect Conserv. 21, 715–726. doi: 10.1007/s10841-017-0015-y
Goto, S., Shimatani, K., Yoshimaru, H., and Takahashi, Y. (2006). Fat-tailed gene flow in the dioecious canopy tree species Fraxinus mandshurica var. japonica revealed by microsatellites. Mol. Ecol. 15, 2985–2996. doi: 10.1111/j.1365-294X.2006.02976.x
Greenleaf, S. S., and Kremen, C. (2006). Wild bee species increase tomato production and respond differently to surrounding land use in Northern California. Biol. Conserv. 133, 81–87.
Guidugli, M., Nazareno, A., Feres, J., Contel, E., Mestriner, M., and Alzate-Marin, A. (2016). Small but not isolated: a population genetic survey of the tropical tree Cariniana estrellensis (Lecythidaceae) in a highly fragmented habitat. Heredity 116, 339–347. doi: 10.1038/hdy.2015.108
Hager, A. G., Wax, L. M., Simmons, F. W., and Stoller, E. W. (1997). Waterhemp Management in Agronomic Crops. Urbana, IL: University of Illinois.
Hardy, O. J., González-Martínez, S. C., Fréville, H., Boquien, G., Mignot, A., Colas, B., et al. (2004). Fine-scale genetic structure and gene dispersal in Centaurea corymbosa (Asteraceae) I. Pattern of pollen dispersal. J. Evol. Biol. 17, 795–806. doi: 10.1111/j.1420-9101.2004.00713.x
Hinz, J. R., and Owen, M. D. (1997). Acetolactate synthase resistance in a common waterhemp (Amaranthus rudis) population. Weed Techol. 11, 13–18. doi: 10.1017/S0890037X00041269
Ismail, S. A., Ghazoul, J., Ravikanth, G., Uma Shaanker, R., Kushalappa, C., and Kettle, C. (2012). Does long-distance pollen dispersal preclude inbreeding in tropical trees? Fragmentation genetics of Dysoxylum malabaricum in an agro-forest landscape. Mol. Ecol. 21, 5484–5496. doi: 10.1111/mec.12054
Jha, S., and Dick, C. W. (2010). Native bees mediate long-distance pollen dispersal in a shade coffee landscape mosaic. Proc. Natl. Acad. Sci. U.S.A. 107, 13760–13764. doi: 10.1073/pnas.1002490107
Jongejans, E., Skarpaas, O., and Shea, K. (2008). Dispersal, demography and spatial population models for conservation and control management. Perspect. Plant Ecol. Evol. Syst. 9, 153–170.
Klein, E. K., Lavigne, C., and Gouyon, P. H. (2006a). Mixing of propagules from discrete sources at long distance: comparing a dispersal tail to an exponential. BMC Ecol. 6:3. doi: 10.1186/1472-6785-6-3
Klein, E. K., Lavigne, C., Picault, H., Renard, M., and Gouyon, P. H. (2006b). Pollen dispersal of oilseed rape: estimation of the dispersal function and effects of field dimension. J. Appl. Ecol. 43, 141–151.
Krauss, S., He, T., Barrett, L., Lamont, B., Enright, N., Miller, B., et al. (2009). Contrasting impacts of pollen and seed dispersal on spatial genetic structure in the bird-pollinated Banksia hookeriana. Heredity 102, 274–285. doi: 10.1038/hdy.2008.118
Kremer, A., Ronce, O., Robledo-Arnuncio, J. J., Guillaume, F., Bohrer, G., Nathan, R., et al. (2012). Long-distance gene flow and adaptation of forest trees to rapid climate change. Ecol. Lett. 15, 378–392. doi: 10.1111/j.1461-0248.2012.01746.x
Ksiazek-Mikenas, K., Fant, J. B., and Skogen, K. A. (2019). Pollinator-mediated gene flow connects green roof populations across the urban matrix: a paternity analysis of the self-compatible form Penstemon hirsutus. Front. Ecol. Evol. 7:299. doi: 10.3389/fevo.2019.00299
Lavigne, C., Klein, E., Vallée, P., Pierre, J., Godelle, B., and Renard, M. (1998). A pollen-dispersal experiment with transgenic oilseed rape. Estimation of the average pollen dispersal of an individual plant within a field. Theor. Appl. Genet. 96, 886–896.
Levin, D. A., and Kerster, H. W. (1974). “Gene flow in seed plants,” in Evolutionary Biology, eds T. Dobzhansky, M. K. Hecht, and W. C. Steere (Boston, MA: Springer), 139–220. doi: 10.1007/978-1-4615-6944-2_5
Liu, J., Davis, A. S., and Tranel, P. J. (2012). Pollen biology and dispersal dynamics in waterhemp (Amaranthus tuberculatus). Weed Sci. 60, 416–422. doi: 10.1614/WS-D-11-00201.1
Loureiro, I., Escorial, M.-C., and Chueca, M.-C. (2016). Pollen-mediated movement of herbicide resistance genes in Lolium rigidum. PLoS One 11:e0157892. doi: 10.1371/journal.pone.0157892
Ma, B., Subedi, K., and Reid, L. (2004). Extent of cross-fertilization in maize by pollen from neighboring transgenic hybrids. Crop Sci. 44, 1273–1282.
Marchelli, P., Smouse, P. E., and Gallo, L. A. (2012). Short-distance pollen dispersal for an outcrossed, wind-pollinated southern beech (Nothofagus nervosa (Phil.) Dim. et Mil.). Tree Genet. Genomes 8, 1123–1134. doi: 10.1007/s11295-012-0500-0
Matteson, K. C., Ascher, J. S., and Langellotto, G. A. (2008). Bee richness and abundance in New York City urban gardens. Ann. Entomol. Soc. Am. 101, 140–150. doi: 10.1603/0013-8746(2008)101[140:BRAAIN]2.0.CO;2
McKinney, M. L. (2008). Effects of urbanization on species richness: a review of plants and animals. Urban Ecosyst. 11, 161–176. doi: 10.1016/j.envint.2015.09.013
Millerón, M., De Heredia, U. L., Lorenzo, Z., Perea, R., Dounavi, A., Alonso, J., et al. (2012). Effect of canopy closure on pollen dispersal in a wind-pollinated species (Fagus sylvatica L.). Plant Ecol. 213, 1715–1728.
Morris, W. F., Mangel, M., and Adler, F. R. (1995). Mechanisms of pollen deposition by insect pollinators. Evol. Ecol. 9, 304–317. doi: 10.1007/BF01237776
Nathan, R., Klein, E., Robledo-Arnuncio, J. J., and Revilla, E. (2012). “Dispersal kernels: review,” in Dispersal Ecology and Evolution, eds J. Clobert, M. Baguette, T. G. Benton, and J. M. Bullock (Oxford: Oxford University Press), 187–210.
Noreen, A., Niissalo, M., Lum, S., and Webb, E. (2016). Persistence of long-distance, insect-mediated pollen movement for a tropical canopy tree species in remnant forest patches in an urban landscape. Heredity 117, 472–480. doi: 10.1038/hdy.2016.64
Okubo, A., and Levin, S. A. (1989). A theoretical framework for data analysis of wind dispersal of seeds and pollen. Ecology 70, 329–338.
Panthee, D. R., and Gardner, R. G. (2013). ‘Mountain Vineyard’ hybrid grape tomato and its parents: NC 4 Grape and NC 5 Grape tomato breeding lines. HortScience 48, 1189–1191. doi: 10.21273/HORTSCI.48.9.1189
Piotti, A., Leonardi, S., Buiteveld, J., Geburek, T., Gerber, S., Kramer, K., et al. (2012). Comparison of pollen gene flow among four European beech (Fagus sylvatica L.) populations characterized by different management regimes. Heredity 108, 322–331. doi: 10.1038/hdy.2011.77
Price, M., and Waser, N. (1979). Pollen dispersal and optimal outcrossing in Delphinium nelsoni. Nature 277, 294–297.
Quinn, L. D., Matlaga, D. P., Stewart, J. R., and Davis, A. S. (2011). Empirical evidence of long-distance dispersal in Miscanthus sinensis and Miscanthus × giganteus. Invasive Plant Sci. Manag. 4, 142–150. doi: 10.1614/IPSM-D-10-00067.1
Ramalho, C. E., and Hobbs, R. J. (2012). Time for a change: dynamic urban ecology. Trends Ecol. Evol. 27, 179–188. doi: 10.1016/j.tree.2011.10.008
Ramos, S. L. F., Dequigiovanni, G., Sebbenn, A. M., Lopes, M. T. G., Kageyama, P. Y., Macêdo, J. L. V., et al. (2016). Spatial genetic structure, genetic diversity and pollen dispersal in a harvested population of Astrocaryum aculeatum in the Brazilian Amazon. BMC Genet. 17:63. doi: 10.1186/s12863-016-0371-8
Sant’Anna, C. S., Sebbenn, A. M., Klabunde, G. H., Bittencourt, R., Nodari, R. O., Mantovani, A., et al. (2013). Realized pollen and seed dispersal within a continuous population of the dioecious coniferous Brazilian pine [Araucaria angustifolia (Bertol.) Kuntze]. Conserv. Genet. 14, 601–613.
Sarangi, D., Tyre, A. J., Patterson, E. L., Gaines, T. A., Irmak, S., Knezevic, S. Z., et al. (2017). Pollen-mediated gene flow from glyphosate-resistant common waterhemp (Amaranthus rudis Sauer): consequences for the dispersal of resistance genes. Sci. Rep. 7:44913. doi: 10.1038/srep44913
Saro, I., Robledo-Arnuncio, J., González-Pérez, M., and Sosa, P. (2014). Patterns of pollen dispersal in a small population of the Canarian endemic palm (Phoenix canariensis). Heredity. 113, 215–223. doi: 10.1038/hdy.2014.16
Simpson, E., McRoberts, N., and Sweet, J. (2006). Out-crossing between genetically modified herbicide-tolerant and other winter oilseed rape cultivars. Plant Genet. Resour. 4, 96–107.
Skarpaas, O., and Shea, K. (2007). Dispersal patterns, dispersal mechanisms, and invasion wave speeds for invasive thistles. Am. Nat. 170, 421–430. doi: 10.1086/519854
Streiff, R., Ducousso, A., Lexer, C., Steinkellner, H., Gloessl, J., and Kremer, A. (1999). Pollen dispersal inferred from paternity analysis in a mixed oak stand of Quercus robur L. and Q. petraea (Matt.) Liebl. Mol. Ecol. 8, 831–841.
Turchetto, C., Lima, J. S., Rodrigues, D. M., Bonatto, S. L., and Freitas, L. B. (2015). Pollen dispersal and breeding structure in a hawkmoth-pollinated Pampa grasslands species Petunia axillaris (Solanaceae). Ann. Bot. 115, 939–948. doi: 10.1093/aob/mcv025
Van Rossum, F. (2009). Pollen dispersal and genetic variation in an early-successional forest herb in a peri-urban forest. Plant Biol. 11, 725–737. doi: 10.1111/j.1438-8677.2008.00176.x
Van Rossum, F., Stiers, I., Van Geert, A., Triest, L., and Hardy, O. J. (2011). Fluorescent dye particles as pollen analogues for measuring pollen dispersal in an insect-pollinated forest herb. Oecologia 165, 663–674. doi: 10.1007/s00442-010-1745-7
Van Rossum, F., and Triest, L. (2010). Pollen dispersal in an insect-pollinated wet meadow herb along an urban river. Landsc. Urban Plan. 95, 201–208.
Van Tussenbroek, B. I., Valdivia-Carrillo, T., Rodríguez-Virgen, I. T., Sanabria-Alcaraz, S. N. M., Jiménez-Durán, K., Van Dijk, K. J., et al. (2016). Coping with potential bi-parental inbreeding: limited pollen and seed dispersal and large genets in the dioecious marine angiosperm Thalassia testudinum. Ecol. Evol. 6, 5542–5556. doi: 10.1002/ece3.2309
Wang, J., Kang, M., and Huang, H. (2014). Long-distance pollen dispersal ensures genetic connectivity of the low-density tree species, Eurycorymbus cavaleriei, in a fragmented karst forest landscape. Conserv. Genet. 15, 1163–1172.
Zhang, S., Xu, Q., Gaillard, M.-J., Cao, X., Li, J., Zhang, L., et al. (2016). Characteristic pollen source area and vertical pollen dispersal and deposition in a mixed coniferous and deciduous broad-leaved woodland in the Changbai mountains, northeast China. Veg. Hist. Arcaeobot. 25, 29–43. doi: 10.1007/s00334-015-0532-0
Keywords: Amaranthaceae, Solanaceae, pollen dispersal, green roofs, urban habitats, curve fitting, PDF fitting
Citation: Butcher CL, Rubin BY, Anderson SL and Lewis JD (2022) Long-Distance Pollen Dispersal in Urban Green Roof and Ground-Level Habitats. Front. Ecol. Evol. 10:790464. doi: 10.3389/fevo.2022.790464
Received: 06 October 2021; Accepted: 07 June 2022;
Published: 23 June 2022.
Edited by:
David Jack Coates, Department of Biodiversity, Conservation and Attractions (DBCA), AustraliaReviewed by:
Caroline Turchetto, Federal University of Rio Grande do Sul, BrazilKelly Ksiazek-Mikenas, Elmhurst College, United States
Copyright © 2022 Butcher, Rubin, Anderson and Lewis. This is an open-access article distributed under the terms of the Creative Commons Attribution License (CC BY). The use, distribution or reproduction in other forums is permitted, provided the original author(s) and the copyright owner(s) are credited and that the original publication in this journal is cited, in accordance with accepted academic practice. No use, distribution or reproduction is permitted which does not comply with these terms.
*Correspondence: Chelsea L. Butcher, YnV0Y2hlcmNAbm9ydGh3b29kLmVkdQ==