 Jannis Till Feigs1*
 Stephanie I. J. Holzhauer1Siyu Huang1Jörg Brunet2Martin Diekmann3Per-Ola Hedwall2Katja Kramp1Tobias Naaf1
- 1Leibniz Centre for Agricultural Landscape Research (ZALF) e.V., Müncheberg, Germany
- 2Southern Swedish Forest Research Centre, Swedish University of Agricultural Sciences, Lomma, Sweden
- 3Vegetation Ecology and Conservation Biology, Institute of Ecology, FB 2, University of Bremen, Bremen, Germany
In agricultural landscapes, forest herbs live in small, spatially isolated forest patches. For their long-term survival, their populations depend on animals as genetic linkers that provide pollen- or seed-mediated gene flow among different forest patches. However, whether insect pollinators serve as genetic linkers among spatially isolated forest herb populations in agricultural landscapes remains to be shown. Here, we used population genetic methods to analyze: (A) the genetic diversity and genetic differentiation of populations of two common, slow-colonizing temperate forest herb species [Polygonatum multiflorum (L.) All. and Anemone nemorosa L.] in spatially isolated populations within three agricultural landscapes in Germany and Sweden and (B) the movement activity of their most relevant associated pollinator species, i.e., the bumblebee Bombus pascuorum (Scopoli, 1,763) and the hoverfly Melanostoma scalare (Fabricus, 1,794), respectively, which differ in their mobility. We tested whether the indicated pollinator movement activity affected the genetic diversity and genetic differentiation of the forest herb populations. Bumblebee movement indicators that solely indicated movement activity between the forest patches affected both genetic diversity and genetic differentiation of the associated forest herb P. multiflorum in a way that can be explained by pollen-mediated gene flow among the forest herb populations. In contrast, movement indicators reflecting the total movement activity at a forest patch (including within-forest patch movement activity) showed unexpected effects for both plant-pollinator pairs that might be explained by accelerated genetic drift due to enhanced sexual reproduction. Our integrated approach revealed that bumblebees serve as genetic linkers of associated forest herb populations, even if they are more than 2 km apart from each other. No such evidence was found for the forest associated hoverfly species which showed significant genetic differentiation among forest patches itself. Our approach also indicated that a higher within-forest patch movement activity of both pollinator species might enhance sexual recruitment and thus diminishes the temporal buffer that clonal growth provides against habitat fragmentation effects.
Introduction
Agriculture is one of the main drivers of habitat fragmentation, i.e., habitat loss and spatial isolation of sub-populations of plants and animals (FAO and UNEP, 2020). In Europe, agricultural history shaped former natural landscapes in such a way that seminatural habitats today mainly occur as small spatial units such as forest patches. Many species comprising the total biodiversity in such landscapes depend on those habitats (Billeter et al., 2008). A large number of plant species require animals that serve as genetic linkers between populations from different habitat patches by transporting seeds and pollen (Lundberg and Moberg, 2003). These genetic linkers are important for the long-term maintenance of the genetic diversity of plant populations under spatial isolation (Jeltsch et al., 2013). The identity, abundance, and behavior of these genetic linkers determine their movement activity, i.e., the frequency of movement events within and between habitat patches. This influences pollen-mediated gene flow, which consequently determines the relative isolation of specific plant populations (Auffret et al., 2017). With stronger isolation, plant populations are more genetically differentiated and have lower levels of genetic diversity (Auffret et al., 2017). Negative effects of fragmentation on the genetic diversity of insect-pollinated plants have been shown (Aguilar et al., 2019). If pollinator abundances and activities are reduced in response to habitat fragmentation, this directly influences the associated plant populations (Cheptou et al., 2017; Chen et al., 2019). For forest plants, however, it is a matter of debate in how far insect movement activity results in pollen-mediated gene flow among plant populations of different small and spatially isolated patches (Kramer et al., 2008; Lowe et al., 2016). This debate often focuses exclusively on woody plants (Kramer et al., 2008; Breed et al., 2015). Meanwhile, the forest herb layer is often ignored, even though this community comprises a particularly diverse group of organisms (Dobeš et al., 2017) and thus contributes substantively to the biodiversity and functioning of forest patches (Gilliam, 2007; Valdés et al., 2020). Many clonal forest herbs with persistent root organs have an overlap of generations and long lifespans (Whigham, 2004). Forest herbs show certain characteristics, which can be interpreted as adaptations to long-term stable conditions (Honnay et al., 2005), namely, first flowering at a high age, few and heavy seeds and the absence of long-distance seed dispersal mechanisms. These traits make them especially vulnerable to habitat fragmentation (Whigham, 2004). In fact, several studies found reduced allelic richness in small forest herb populations (Van Rossum et al., 2002; Vellend, 2004; Naaf et al., 2021) and genetic differentiation among spatially isolated forest herb populations (Jacquemyn et al., 2006; Schmidt et al., 2009).
Pollen-mediated gene flow among forest patches is generally considered restricted (Honnay et al., 2005) because most forest herbs are pollinated by insects with low mobility (Wilcock and Neiland, 2002). These pollinators are expected to move even less between small patches if they are forest habitat specialists and thus avoid crossing the agricultural landscape matrix (Honnay et al., 2005). Forest-specialized hoverflies are an example of this pollinator type (Moquet et al., 2018; Proesmans et al., 2019b). However, there is also another type of insect pollinator with longer foraging distances and less habitat sensitivity, such as wild bees including bumblebees (Greenleaf, 2007; Redhead et al., 2016). These wild bees are pollinators of several forest herb species (Fussell and Corbet, 1991; Hasegawa and Kudo, 2005; Kolb, 2008), and bumblebees are expected to even increase their foraging distances in resource-poor agricultural landscapes (Persson and Smith, 2011). In theory, plant species should be more sensitive to habitat fragmentation if associated with less mobile pollinators, such as forest-specialized hoverflies, and less if associated with more mobile pollinators such as bumblebees (Breed et al., 2015).
Estimates of gene flow among spatially isolated populations of insect-pollinated forest herbs have been based on measures of genetic differentiation (Van Rossum et al., 2002; Jacquemyn et al., 2006). This approach allows limited conclusions about the contribution of pollen-mediated gene flow. To address the question of whether pollinators serve as genetic linkers for spatially isolated forest herb populations requires an integrated design that includes both the population genetics of the forest herb and the movement of its associated pollinators. Such a combined approach has been identified as an important research field for some time (Sork et al., 1999; Breed et al., 2015). Studies addressing both the plants and their pollinators typically analyzed the population genetic structure of plants and then compared plant species associated with groups of pollinators with different traits. This has been reported for closely related plant species with different pollinator types (Kramer et al., 2011; Breed et al., 2015) and for plant species within the same landscape with different associated pollinators (Naaf et al., 2021). Previous research has mainly focused on mobility in terms of the potential geographic distance that a specific pollinator type covers in a particular habitat. By additionally specifying the movement activity of a pollinator species, we can integrate the variability of a species’ movement behavior, which depends on a variety of factors, such as season and landscape context. The movement behavior (i.e., the pollinator’s decision to move between two locations) is a matter of foraging economy, meaning a trade-off between resource availability in a habitat patch and energy costs to get there (Hadley and Betts, 2012). The chances of a pollinator visiting a plant population within the landscape are largely affected by the spatial arrangement of land-use types (Kamm et al., 2010; Cranmer et al., 2012). Thus, the actual movement activity of a pollinator at a specific habitat patch can better explain the genetic diversity and differentiation of associated plant populations than the geographic distances between patches or abstract estimates of pollinator mobility.
Movement activity of pollinators and pollen transport can be estimated directly by using pollen analogs (Van Rossum, 2009; Martínez-Bauer et al., 2021). However, with this method, the number of plant populations studied and the trackable pollination distances are limited. Other direct methods as observations are very work intensive or expensive as, for example, radar tracking (Pope and Jha, 2017). An alternative, indirect way to estimate the pollinator movement activity among multiple populations and over larger distances is the analysis of the genetic diversity and differentiation of pollinators using, for example, microsatellite markers (Osborne et al., 2002; Goulson, 2010). This is because the pollinators’ genetic structure reflects their movement limitations and habitat dependencies (Cushman et al., 2015). By applying such methods, we can combine genetic and spatial information for a high number of individuals. If we link the population genetic data with information on sampling locations, we can estimate the movement activity involving one specific forest patch or among forest patches. Additionally, based on genetic information, we can assign bumblebee individuals to common nests to infer the nest density and the routes of foraging flights (Chapman et al., 2003; Darvill et al., 2004; Knight et al., 2005; Pope and Jha, 2017).
Here, we combine the population genetic analysis of two slow-colonizing forest herbs with the genetically inferred movement activity of their associated pollinators, one bumblebee and one hoverfly species. We conducted the research in three Central European agricultural landscapes. Our objective was to determine the influence of pollinator movement activity on forest herb genetic diversity and differentiation with the following hypotheses:
H1: The hoverfly species is less mobile and more strongly associated with forest habitats than the bumblebee species.
H2: A higher pollinator movement activity leads to a higher pollen-mediated gene flow among forest herb populations.
We tested these hypotheses by examining whether the following predictions hold true:
P1: If H1 is true, we would expect to find a more pronounced spatial genetic structure at the landscape scale for the hoverfly species than for the bumblebee species.
P2: If H2 is true, we would expect to find (a) a higher genetic diversity within forest herb populations, and (b) a lower genetic differentiation among forest herb populations when the pollinator movement activity is high.
Materials and methods
Landscape windows
We conducted this study in three 5 km × 5 km landscape windows within typical Central European agricultural landscapes in western Germany, eastern Germany and southern Sweden (Figure 1). The three landscape windows were similar in terms of landscape composition (Table 1). The landscape window in western Germany showed a higher proportion of forest and grassland cover and a lower proportion of crop cover than the other two landscape windows.
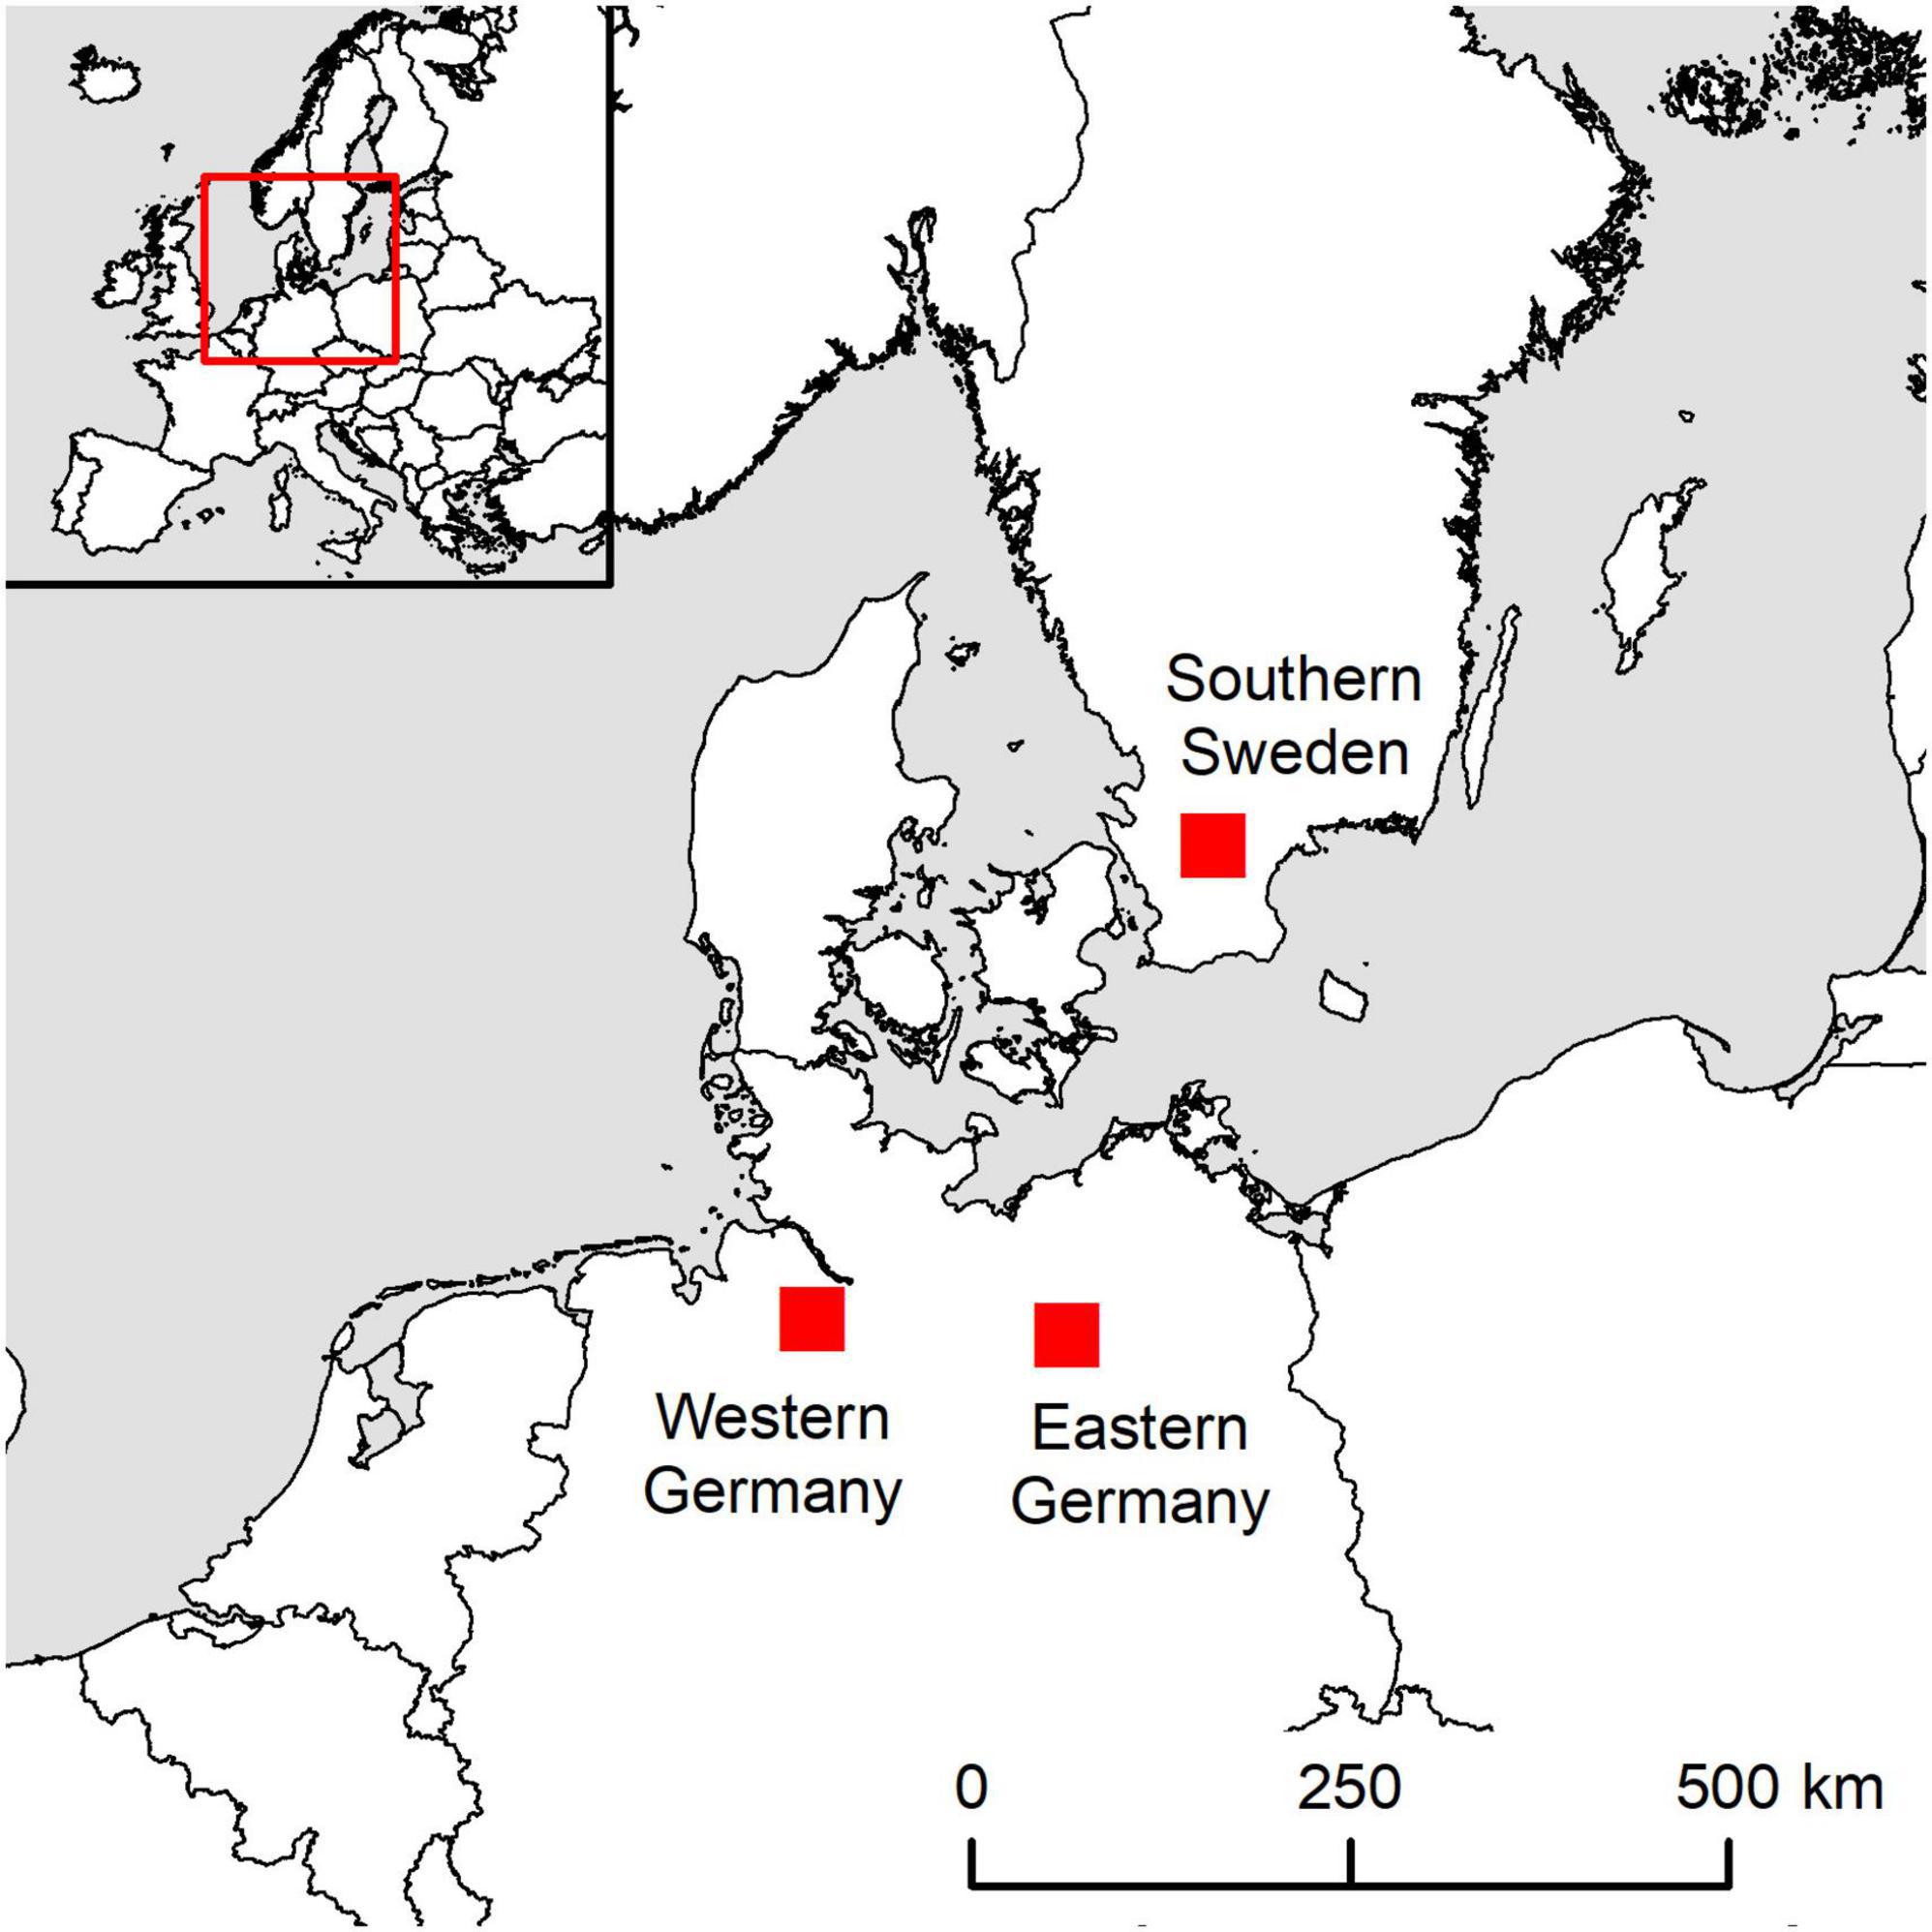
Figure 1. Locations of landscape windows (red squares) in Germany and Sweden.
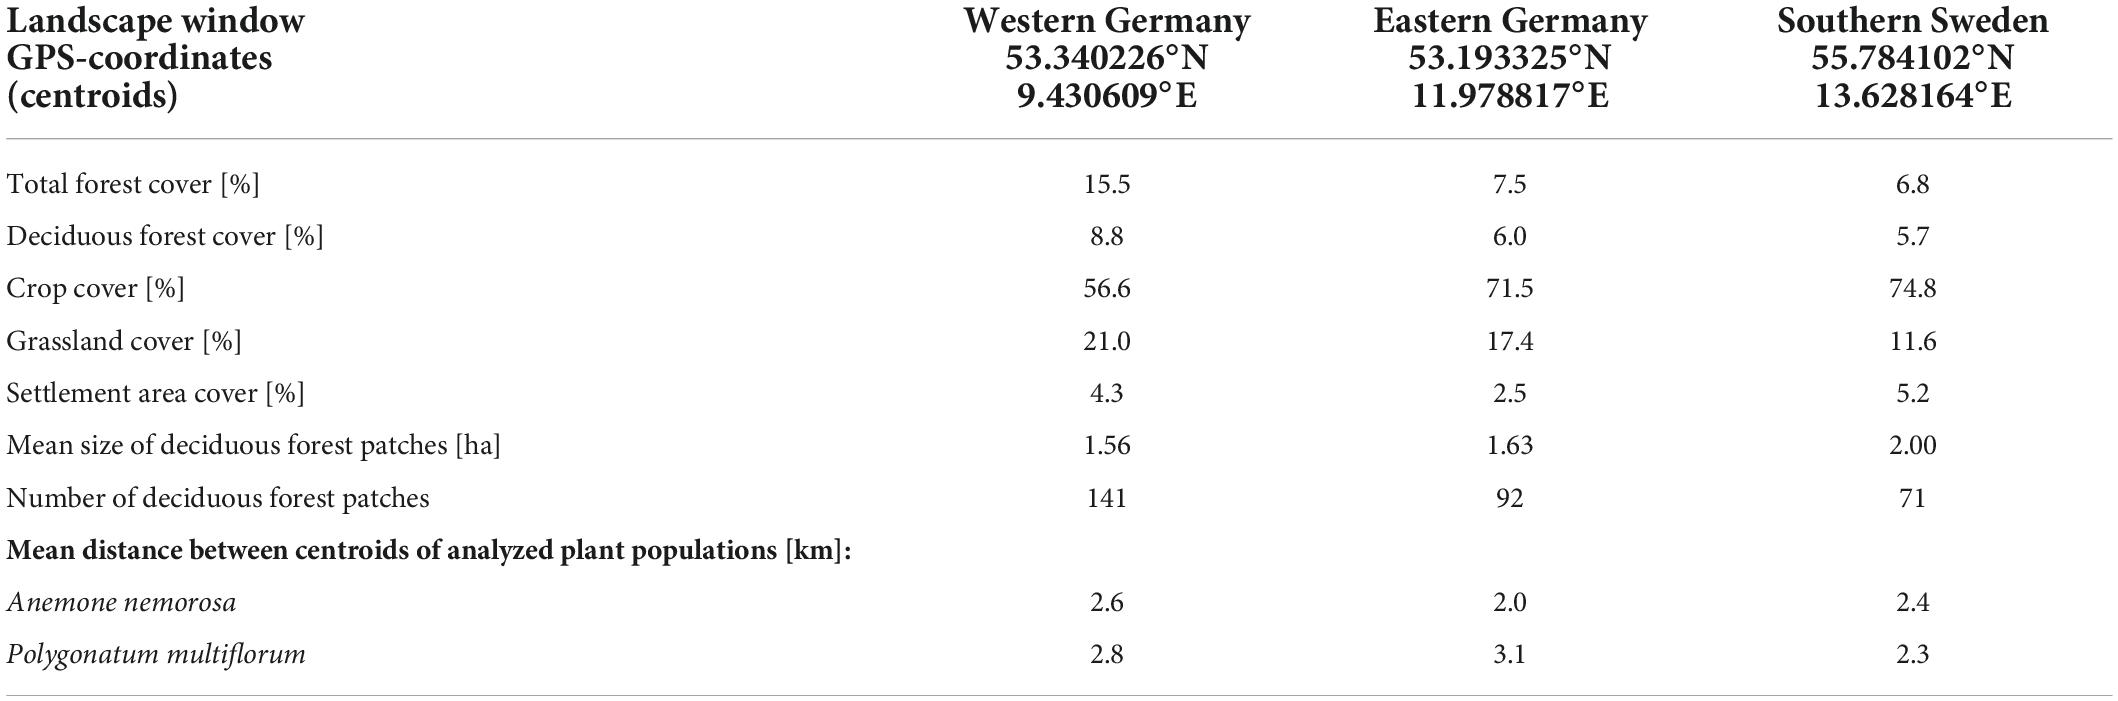
Table 1. Locations and land-use type composition of the three landscape windows (based on recent orthophotos).
Selection of forest herb species
We selected the forest herb species Anemone nemorosa L. and Polygonatum multiflorum (L.) All., two slow-colonizing forest specialists associated with different pollinator types (Naaf et al., 2021). The pollinator types differ in their habitat sensitivity and preferences, flight ranges, and movement behavior (Supplementary Table 3). For each of the two species, we studied one associated representative pollinator species, i.e., a bumblebee species for P. multiflorum and a hoverfly species for A. nemorosa (Supplementary Table 3). The corolla of P. multiflorum spezialises on elongated mouth organs, such as those of long-tongued bumblebees, whereas there is no such specialization in A. nemorosa, which is visited by a wider range of hoverflies, wild bees and other pollinators.
Sampling and identification of the most relevant pollinators
In each landscape window, we selected six deciduous forest patches, in which we collected leaf material of the forest herbs and pollinator individuals. Sampling of pollinators associated with A. nemorosa took place in April 2018 and 2019 and those pollinators associated with P. multiflorum were sampled in May 2018 and 2019.
The most relevant pollinator species should be common in all three landscape windows and show an important contribution to the pollination of the forest herb. To identify the most relevant pollinator species of each plant species and to capture a sufficient number of insect individuals for conducting population genetic analyses, we combined Malaise traps and observations, which included hand net catches of all flower visitors (Supplementary material 1). The Malaise trap sampling provided information about the pollinator species abundance and evenness. With the flower observations, we could quantify the proportion of flower visits per pollinator species. To increase the number of collected individuals per species and forest patch, we added further hand net catches in 2019.
The Malaise traps were installed in flowering stands of forest herbs (Supplementary Figures 1B,D) to passively catch pollinators that are attracted by the specific forest herb species. We standardized the insect visitation observations of the forest herbs at one transect of 25 m x 2 m per forest patch for A. nemorosa (Supplementary Figure 1A) and one patch of 2 m x 2 m per forest patch for P. multiflorum (Supplementary Figure 1C). The observations were conducted four to ten times per forest patch for 30 min between 9 a.m. and 8 p.m. and under appropriate weather conditions, i.e., no rain, temperatures > 10°C and low wind velocity (Supplementary Tables 2.1, 2.2). For southern Sweden, no observations were available as the preconditions were not met during the periods of field work. In total, we observed pollinators of P. multiflorum for 38.5 h with an average visitation rate of 3.2 visits/h per patch and of A. nemorosa for 36 h with an average visitation rate of 2.5 visits/h per transect (Supplementary material 2).
We evaluated the relevance of pollinator species for each herb species based on Malaise trap sampling, pollinator observations and literature information. According to the literature (Hasegawa and Kudo, 2005; Kosiński, 2012), long-tongued bumblebees are the most important pollinators of P. multiflorum, which was corroborated in our abundance and observation data. The species Bombus pascuorum (Scopoli, 1,763) was the most frequent flower visitor, with 57 visits out of 123 total observed visits (46%) (Supplementary Figures 2.1A,B). Moreover, from those bumblebee species that were recorded as flower visitors of P. multiflorum, B. pascuorum was the most abundant species in the Malaise trap samples, representing 97 out of 158 total individuals (61%) (Supplementary Figures 2.1C–E). Therefore, we chose B. pascuorum as the most relevant pollinator for P. multiflorum. Despite the fact that A. nemorosa is a generalist, hoverflies are especially important pollinators because of their very high local abundances in forests in spring (Strickmann, 2008). In our flower observations of A. nemorosa, we observed only nine individuals of four species of hoverflies (Supplementary Figures 2.2A,B), probably because of low temperatures in April 2018 and 2019. The mean temperature during A. nemorosa observations was approximately 15°C in 2018 and 16°C in 2019, which is low for hoverfly activities. The species Melanostoma scalare (Fabricus, 1,794) was observed as flower visitor of A. nemorosa, and in the Malaise traps, it had the highest abundance of all hoverflies that could be linked to A. nemorosa, representing 159 out of a total of 475 individuals that were caught (33%) (Supplementary Figures 2.2C–E). In a previous study in forest patches of the same landscape windows, relatively high numbers of M. scalare were observed (Proesmans et al., 2019a), and the species was reported to be a flower visitor of A. nemorosa (Strickmann, 2008). Consequently, we selected M. scalare as the associated pollinator for A. nemorosa. Different from B. pascuorum, the abundance of M. scalare in the Malaise trap samples (and of all other hoverfly species) was unevenly distributed among the patches (Supplementary Table 4). For the P. multiflorum-B. pascuorum pair 17 out of 18 forest patches and for the A. nemorosa-M. scalare pair 9 out of 18 forest patches had sufficient sampling and could thus be included in our analyses (Supplementary Table 4).
Pollinator species traits
Both selected species are typical representatives of their pollinator type. The species B. pascuorum is one of the most common bumblebee species in Central Europe (Goulson, 2010). Similar to other bumblebee species it is a central place forager with a queen establishing a nest in spring at a suitable position such as a field-forest boundary (Kells and Goulson, 2003). From this central position, workers fly to habitats with flower resources for foraging, which in the case of B. pascuorum includes forests. The workers establish stable traplines, which connect different foraging locations within one flight. The species B. pascuorum is considered a doorstep forager, with workers tending to forage as close as possible to their nests (Darvill et al., 2004). During flowering of a certain plant species, B. pascuorum is relatively flower-constant, which means that it mainly collects pollen from one plant species (Chittka et al., 1999; Raine and Chittka, 2005).
The hoverfly M. scalare is a common species (Kormann, 2002) and both its larval and adult stages are associated with forest habitats (Speight, 2017). There is no available information regarding their flight ranges. An approximation can be derived first, from the related taxon Melanostoma fasciatum, of which individuals were caught at distances up to 180 m from an experimental pollen source (Wratten et al., 2003), and second, from the expectation that flight distances are short because of a small body size (Greenleaf, 2007). Since this species is not a nest-building species, it is expected to move in a linear manner through the landscape with an optimized balance of feeding and oviposition (Jauker, 2009). The species’ general mobility within the landscape is considered low (Gatter et al., 1990). In addition, these two pollinator types also differ in their numbers of generations per year and hibernation stages (Supplementary Table 3).
Insect DNA extraction and microsatellite genotyping
Total genomic DNA of the insects was extracted using the E.Z.N.A. Tissue DNA Kit (OMEGA Bio-Tek, United States) according to the manufacturer’s protocol. We used the whole specimen for M. scalare and the right hind leg for B. pascuorum. For B. pascuorum, eight nuclear microsatellite markers were used, which have already been broadly applied in several bumblebee species, including B. pascuorum (Estoup et al., 1995, 1996; Dreier et al., 2014; Supplementary Tables 5.4, 5.5). For the hoverfly M. scalare, the company AllGenetics & Biology SL (Spain) developed a new set of 13 polymorphic microsatellite primers for our study (Supplementary Tables 5.1–5.3). The fragment length analyses were performed on a 3730xl DNA analyzer (Applied Biosystems, United States) by MACROGEN Europe (Amsterdam, Netherlands) with GeneScan ROX 350 as the size standard for M. scalare and GeneScan LIZ 500 for B. pascuorum. Alleles were called manually with the software GENEMAPPER 6 (Applied Biosystems). Individuals with > 20% missing values were omitted from further analyses. Ten percent of the individuals of each species were genotyped for a second time to quantify the error rate (Bonin et al., 2004; Supplementary Tables 5.3, 5.5–5.7). For all species the locus-specific error rate never exceeded 5% (mainly due to allelic dropout). We included all markers in further analyses after checking them for linkage disequilibrium. We used the function pair.ia() from the R package poppr 2.9.3 (Kamvar et al., 2014), which calculates the standardized index of association between the different microsatellite loci, including a permutation approach. For B. pascuorum, no pair of markers exceeded an index value of 0.1 (Supplementary Figure 6C), and for M. scalare, no pair of markers exceeded an index value of 0.08 (Supplementary Figure 6D), which we considered sufficiently independent. Because the pollinator specimens originated from two different sampling years (2018 and 2019), we tested whether there was significant genetic differentiation between the sampling years with a hierarchical analysis of molecular variance (AMOVA). The AMOVA framework uses pairwise squared genetic distances between individuals to calculate the proportion of genetic variance that can be explained by different levels of hierarchical subdivision (Excoffier et al., 1992). Here, we used landscape windows and sampling years as the hierarchical levels. We implemented AMOVA with the function amova() from the R package pegas 1.1 (Paradis, 2010) with Euclidean distances and 1,000 permutations, which tested each hierarchical level against a random distribution. For the samples of B. pascuorum, the AMOVA found no significant differentiation between the sampling years (Supplementary Table 7). For M. scalare, the AMOVA found a significant differentiation between the sampling years, which explained 1.7% of the total variation (Supplementary Table 7). However, this was likely because the forest patches had been sampled unequally between the years. For M. scalare, we had samples from 2018 and 2019 only in southern Sweden. In a further hierarchical AMOVA for the samples from southern Sweden with the years as first and forest patches as second level, the years were not significant, but forest patches significantly explained 2.7% of the variation (Supplementary Table 7). Thus, we pooled individuals from both sampling years for both pollinator species for further analyses.
Genetic indicators of pollinator movement activity
The genetic structure of the pollinators reflects their movement activity (Loxdale and Lushai, 2001; Osborne et al., 2002; Mola and Williams, 2019), which we estimated based on their genetic information and sampling locations. We used six indicators to assess the among-forest patch movement activity, and four indicators to assess the total movement activity of each pollinator species (Table 2). We measured these indicators in three modes: for a single forest patch (1), for forest patch pairs (1:1), and for a focal forest patch in relation to all other forest patches in the landscape window (1:n).
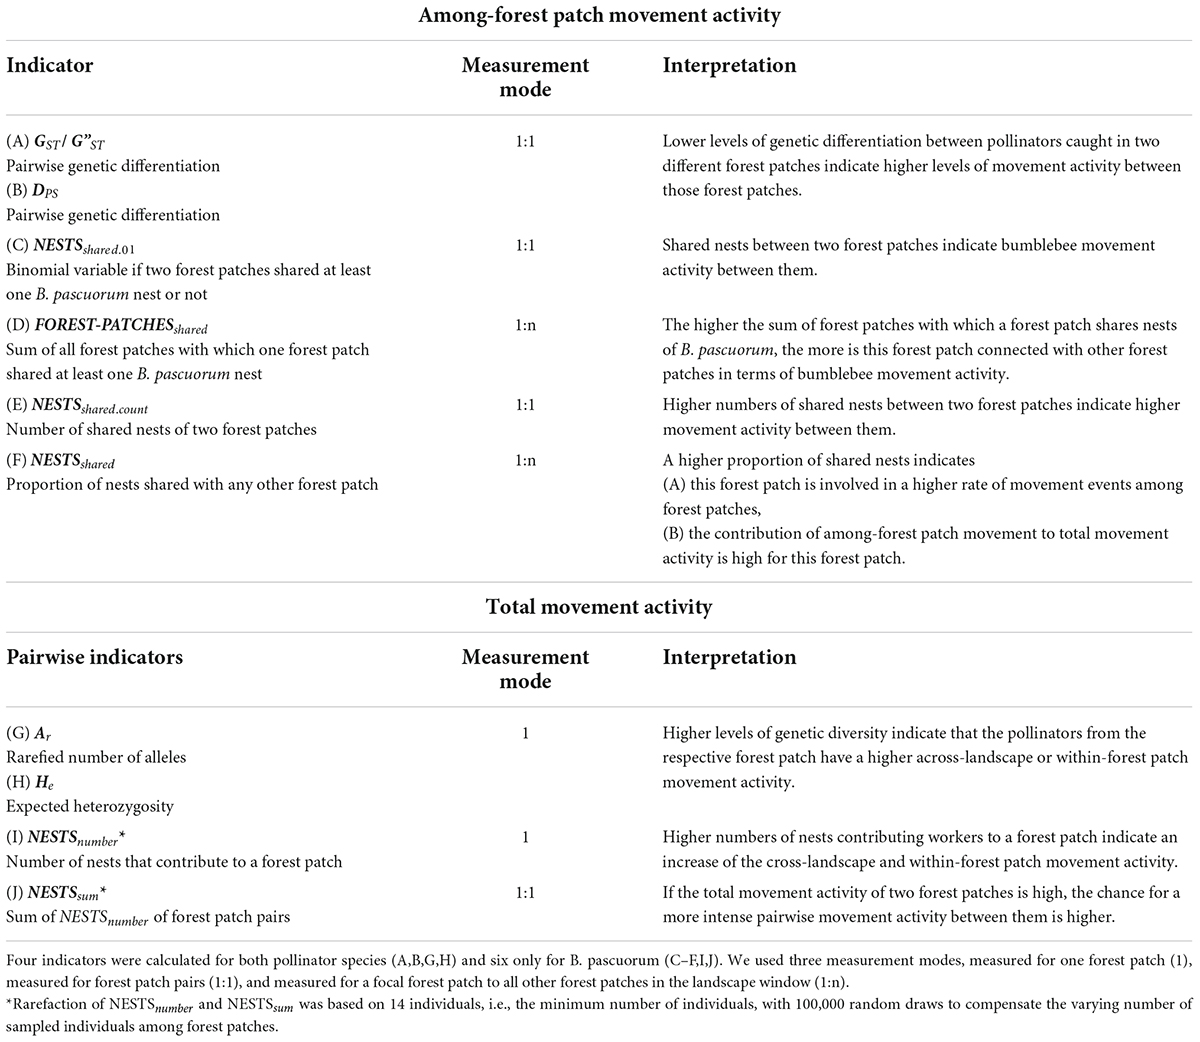
Table 2. Indicators of pollinator movement activity that indicate the among-forest patch and the total movement activity.
We defined the among-forest patch movement activity as the cumulative frequency of movement events of a specific pollinator species among the sampled forest patches. For both pollinator species we estimated this movement activity between pairs of forest patches based on two measures of genetic differentiation as indicators (Tables 2A,B) according to Slatkin and Barton (1989) who showed that measures of genetic differentiation can be used to estimate the numbers of individuals that move among populations. For the bumblebee species B. pascuorum, we also used four additional indicators of among-forest patch movement activity based on their nest-building behavior (Tables 2C–F). If individuals from common nests are found in multiple forest patches, we expect a higher rate of movement activity between these forest patches because bumblebees: are known to communicate about forage resources (Dornhaus and Chittka, 1999); are flower constant (Chittka et al., 1999; Goulson, 2010); and establish fixed traplines (Ohashi and Thomson, 2009). For the identification of nests of B. pascuorum, we applied the full-likelihood algorithm of the software COLONY 2.0., which assigns individuals to maternal and paternal families and links those individuals with identical parents to groups of full-sibship, i.e., common nests (Jones and Wang, 2010). We assumed that all our bumblebee samples were workers given that we sampled at a time of year when nests were already large and primarily comprised of workers (von Hagen and Aichhorn, 2003). We used the settings “monogamous mating” for both males and females and “medium long run” as published for B. pascuorum in Dreier et al. (2014). We analyzed combinations of landscape windows and years separately. Each run was repeated with a different random number of seeds. If the probability of individuals being full-siblings was larger than 80% in both runs we treated them as individuals from a shared nest.
We defined the total movement activity as the cumulative frequency of movement events of pollinator individuals collected in a forest patch. The total movement activity involves (A) movements among a focal forest patch and all other locations outside the forest patch (the across-landscape movement), and (B) the movements within the focal forest patch (within-forest patch movement). The across-landscape movement can include movements from forest patches which were not sampled. The number and origin of foraging pollinator individuals in a forest patch depends on the species’ distribution in the landscape and on the landscape permeability. Thus, the relationship between the across-landscape and within-forest patch movement activity is specific for each pollinator species. For B. pascuorum, we expected the relative proportion of across-landscape movements and within-forest patch movements to be a trade-off between its long potential flight ranges and its doorstep-foraging behavior. For M. scalare, we expected the within-forest patch movement activity to be more dominant over the across-landscape movement activity given its low mobility. The indicators of total movement activity used here do not allow to differentiate between the across-landscape and the within-forest patch movement activity.
We used two measures of genetic diversity as indicators for the total movement activity which were applicable for both pollinator species (Tables 2G,H). In general low levels of genetic diversity can indicate low connectivity (Cushman et al., 2015) and small numbers of individuals (Frankham, 1996). Here, we interpret an increase of genetic diversity as an increase of the total movement activity which includes (A) a higher frequency of across-landscape movement events, i.e., higher connectivity, and (B) a higher frequency of within-forest patch movement events, i.e., larger numbers of individuals, which are active within the forest patch. We used allelic richness (Ar) and expected heterozygosity (He) as measures of genetic diversity because they can be used without any assumption about Hardy-Weinberg equilibrium, which we did not expect for a group of pollinators caught in one sampling site (forest patch). This should also be valid for the nest-building central-place foraging bumblebee (Woodard et al., 2015), for which higher levels of genetic diversity were shown to be correlated with larger colony sizes (Herrmann et al., 2007). Due to its central nest-building behavior, the prediction of the bumblebee movement behavior is complex because the contribution of different factors like nest size and nest density are not completely resolved yet (Knight et al., 2005). Thus, we added two further indicators of total movement activity for B. pascuorum that addressed the number of nests which contributed workers to the forest patches (Tables 2I,J). These measures were based on the nest estimations described above.
Sampling, genotyping, and population genetic structure of the forest herbs
In this study, we consider the forest herb individuals from each forest patch as a population. The analyzed populations were selected as representatives of old populations in ancient deciduous forest remnants to reduce signals of founder effects and to display gene flow effects. Old maps showed that those forest patches were forested in the eighteenth or nineteenth century. In spring 2018, we collected fresh leaf samples from up to 20 individuals. We used 10–20 individuals per population for analysis (Supplementary Tables 8.1, 8.3). Less than 20 individuals were used when population sizes were very small or genotyping failed (Naaf et al., 2021). For both forest herb species, we used six microsatellite markers for genotyping, which had been developed for congeneric species. We checked the allele data sets for repeated multilocus genotypes and excluded one sample of P. multiflorum with a repeated multilocus genotype within the same forest patch from further analysis. Further information regarding the sampling, estimation of population size and genotyping is given in Supplementary Tables 5.6, 5.7 and in Naaf et al. (2021).
For both forest herb species, we calculated four measures of genetic diversity within populations, i.e., allelic richness (Ar), expected heterozygosity (He), observed heterozygosity (Ho), and the inbreeding coefficient 1-Ho/He (F) as well as three measures of pairwise genetic differentiation between populations, i.e., GST, G”ST and DPS (1 minus the proportion of shared alleles). All these measures differ in their meaning and sensitivity (Waits and Storfer, 2016). For example, allelic richness is considered most sensitive for detecting recent losses of genetic diversity (Allendorf et al., 2012). While GST and G”ST are based on heterozygosity, DPS quantifies the proportion of shared alleles among populations (Waits and Storfer, 2016). Because GST and G”ST were strongly correlated for all four species (r ≥ 0.99) we only used G”ST in the downstream analysis as it is the recommended measure when analyzing small populations with microsatellites (Waits and Storfer, 2016). We tested the F-values for a significant deviation from zero using a two-sided permutation test with 999 permutations (Meirmans et al., 2018).
Data analysis
For different measurement modes we used specific types of models. For movement indicators that were measured for a single forest patch (1) or for a focal forest patch in relation to all other forest patches in the same landscape window (1:n), we used linear mixed models (LMM) (Supplementary 11.3, 11.4). This model type allowed us to integrate the different landscape windows as a random effect. We implemented the LMMs with the lme function from the R package nlme 3.1–155 (Pinheiro et al., 2019). For movement indicators that were measured for forest patch pairs (1:1), we used maximum-likelihood population-effects MLPE models (Clarke et al., 2002; Supplementary materials 11.1, 11.5). The MLPE models take the non-independence of population pairs sharing a common population into account. This correlation structure was implemented with the function corMLPE (Pope, 2020) and then used as an argument in the lme function.
We were interested in every combination of plant genetic diversity and differentiation measure and pollinator movement indicator. Thus, we performed multiple tests with the same set of movement indicators on each measure of genetic diversity or genetic differentiation. Such an approach can result in an increased probability of a type I error. To evaluate if a detected effect was potentially false positive, we also calculated corrected p-values (q) by controlling false discovery rate (FDR).
Genetic structuring of the pollinator species
Addressing our prediction 1, i.e., that the hoverfly shows a more pronounced spatial genetic structure than the bumblebee, we used hierarchical AMOVA to determine if and to what extent each pollinator species showed genetic structure according to the sampled forest patches. A significant differentiation among the forest patches would indicate that a species prefers movement within habitat patches over movement among them. We conducted this analysis per pollinator species with the landscape windows as the first level to address the nested sampling design and the forest patches as the second level. Each hierarchical level was tested against a random distribution. To test whether the pollinator populations showed effects of isolation-by-distance, we modeled the pairwise genetic differentiation of the pollinators as a function of geographic distance with MLPE models. We included the landscape window as a random effect in the models.
Linking the herbs’ genetic diversity and differentiation to indicators of pollinator movement
To test our prediction 2a, i.e., that higher movement activities of the pollinators result in higher genetic diversity in the associated forest herb populations, we modeled the population genetic diversity of the forest herb populations as a function of the pollinator movement indicators (measurements modes: 1 and 1:n) using LMMs. Landscape window was treated as a random effect (random intercept models). Originally, we intended to include plant population size as a covariable in the models given that population size is a major determinant of genetic diversity within populations (Leimu et al., 2006). However, the small sample size of 17 for the P. multiflorum-B. pascuorum pairs, and 9 for the A. nemorosa-M. scalare pairs did not allow the inclusion of more than one predictor at a time. Instead, we tested, whether the population size of the plant species had an effect on the genetic indicators of pollinator movement using LMMs with landscape window as a random effect as above. We did not find any significant effect (Supplementary material 11.3).
For our prediction 2b, i.e., that higher pairwise movement activities of the pollinators between forest herb populations results in lower genetic differentiation between them, we applied MLPE models to model the pairwise genetic differentiation among the forest herb populations as a function of the pairwise pollinator movement activity (measurement mode 1:1). The pairwise analysis with 40 P. multiflorum-B. pascuorum pairs and 18 A. nemorosa-M. scalare pairs allowed us to use geographic distance as a covariable in addition to the movement indicators. We used the landscape window as a random effect. The MLPE models were only reduced if a predictor was far from being significant (p > 0.1) based on a t-test.
Results
Genetic diversity and differentiation of forest herbs
The two forest herbs exhibited a similar degree of genetic diversity in terms of Ar and He (Table 3). The mean Ho of P. multiflorum was higher than its mean He, while for A. nemorosa, the mean Ho was lower than its mean He. This difference was also reflected in the distribution of F-values. Six out of 17 populations of P. multiflorum had an F-value significantly smaller than zero (Supplementary Figure 8.1), while all nine populations of A. nemorosa had an F-value significantly greater than zero (Supplementary Figure 8.2).
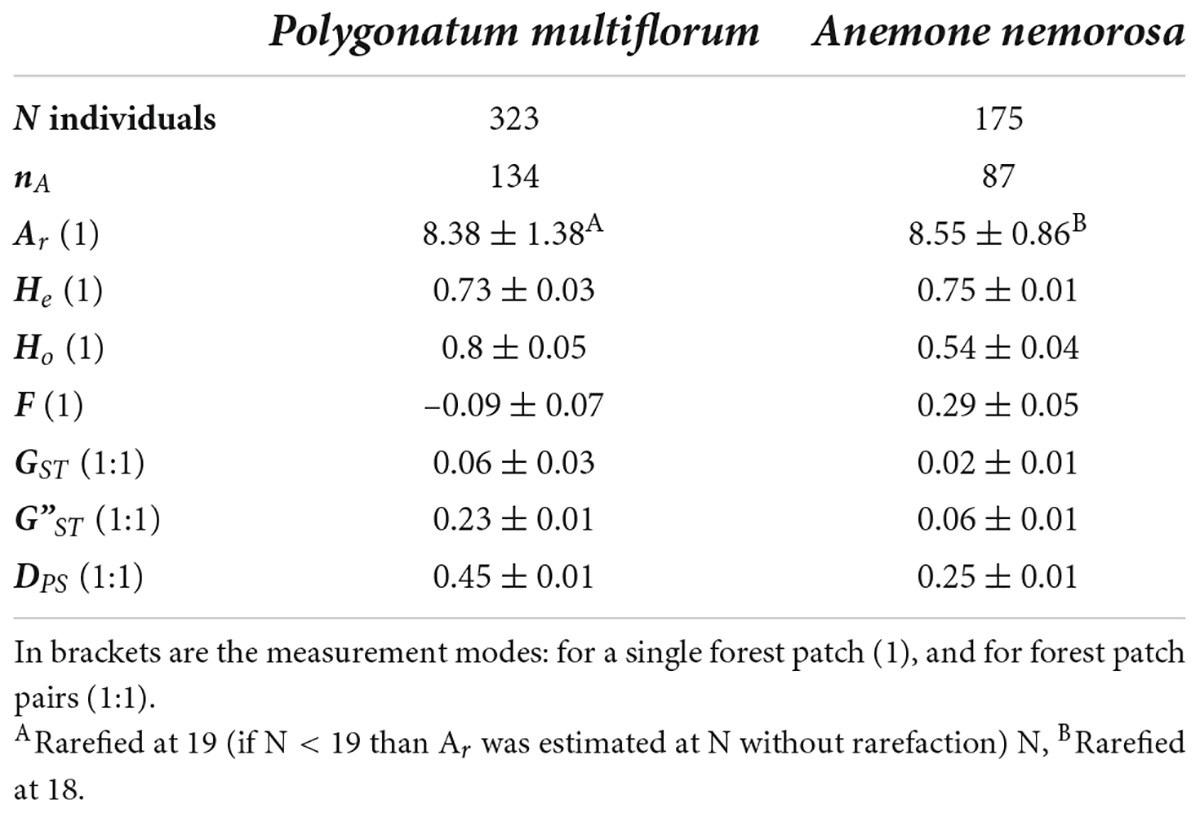
Table 3. Number (N) of sampled and genotyped forest herb individuals, number of alleles (nA), mean and standard deviation of allelic richness (Ar), expected heterozygosity (He), observed heterozygosity (Ho), inbreeding coefficient (F), and pairwise genetic differentiation (GT, G”ST, DPS).
Indicators of pollinator movement
The number of sampled and genotyped individuals and, as a consequence, nA of the two pollinator species differed strongly. All genetic diversity values were lower for M. scalare than for B. pascuorum (Table 4). For B. pascuorum GST ranged from 0 to 0.03, G”ST from 0 to 0.1, and DPS from 0.16 to 0.32. For M. scalare, GST ranged from 0 to 0.05, G”ST from 0 to 0.09, and DPS from 0.09 to 0.2.
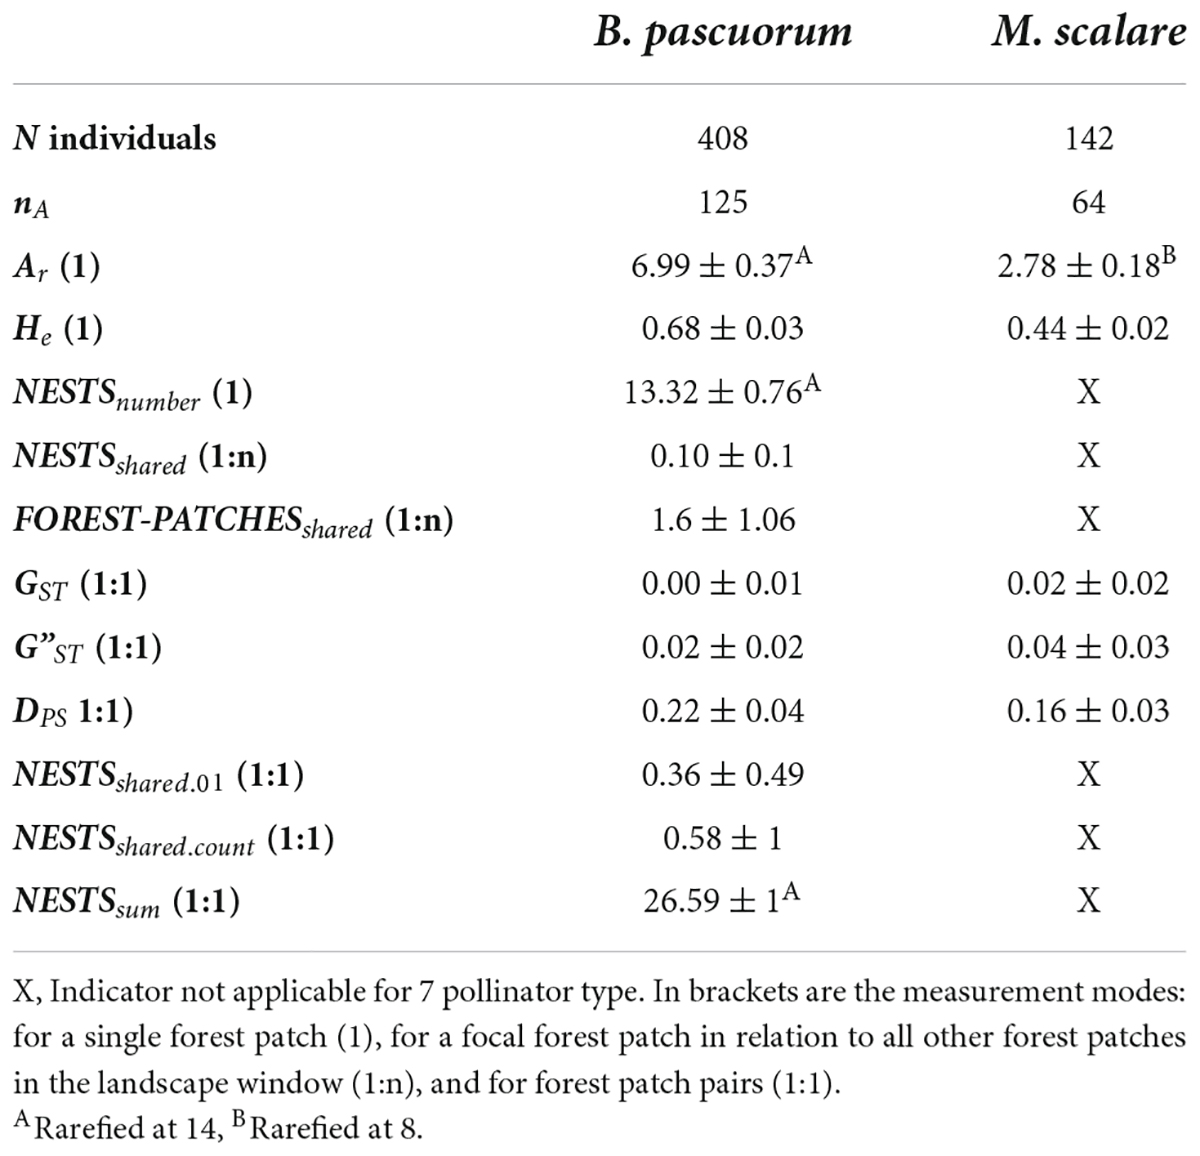
Table 4. Number (N) of sampled and genotyped pollinator individuals and number of alleles (nA), mean and standard deviation of movement indicators within the forest patch: allelic richness (Ar), expected heterozygosity (He), NESTSnumber, NESTSshared, and FOREST-PATCHESshared; movement indicators among the forest patches: GST, G”T, DPS, pairwise NESTSshared.01, pairwise NESTSshared.count, and pairwise NESTSsum.
The full-sibship analysis identified a total of 362 nests of B. pascuorum based on the genotypes of 408 individuals. Of these, 316 were singletons, i.e., nests with only one associated individual, leaving 46 nests with more than one associated individual. There was only one forest patch in southern Sweden that did not share any B. pascuorum nest with any other forest patch (Figure 2). The total number of nests shared by individuals from different forest patches per landscape window (Table 5) as well as the indicators for the among-forest patch movement activity (NESTSshared.01, FOREST-PATCHESshared, NESTSshared.count, and NESTSshared) (Table 4) were markedly higher in western Germany than in eastern Germany and southern Sweden. No nest was shared between more than two forest patches (Figure 2).
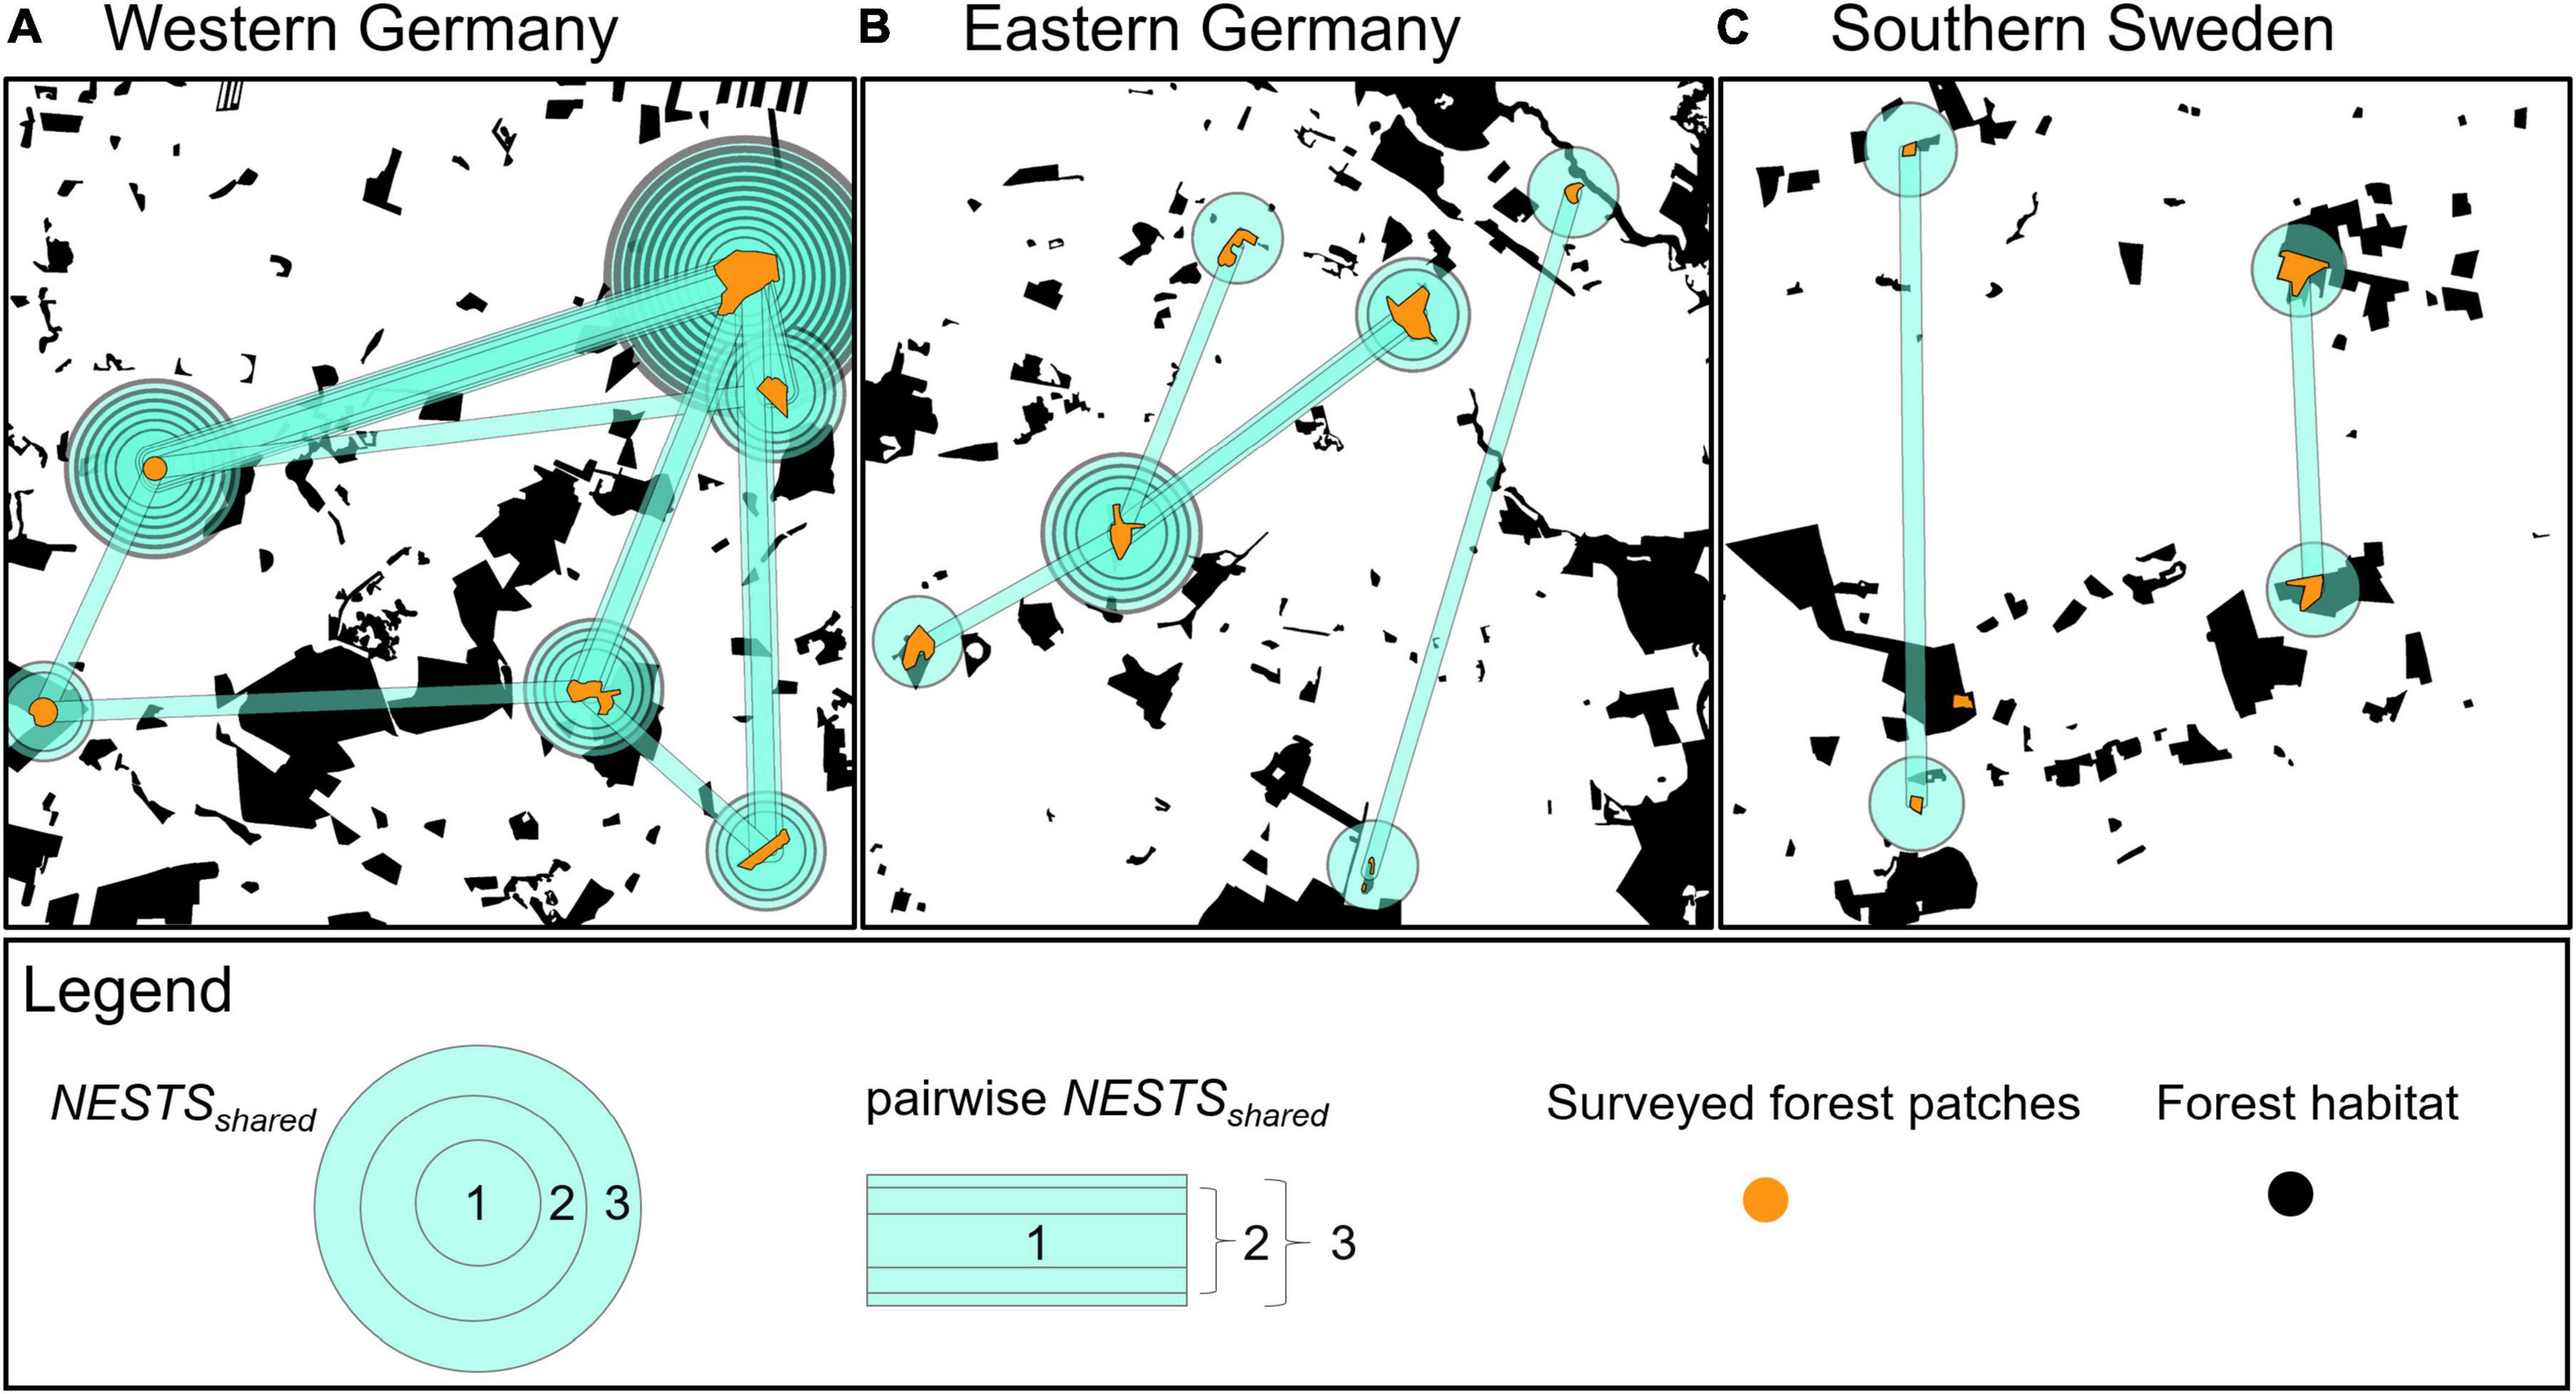
Figure 2. Distribution of shared nests (nests with individuals in different forest patches) of B. pascuorum within and among forest patches in three 5 km × 5 km landscape windows (A–C). The number of rectangles between two forest patches shows how many nests they shared. The number of circles show how many nests one forest patch shared with all other forest patches within the same landscape window.
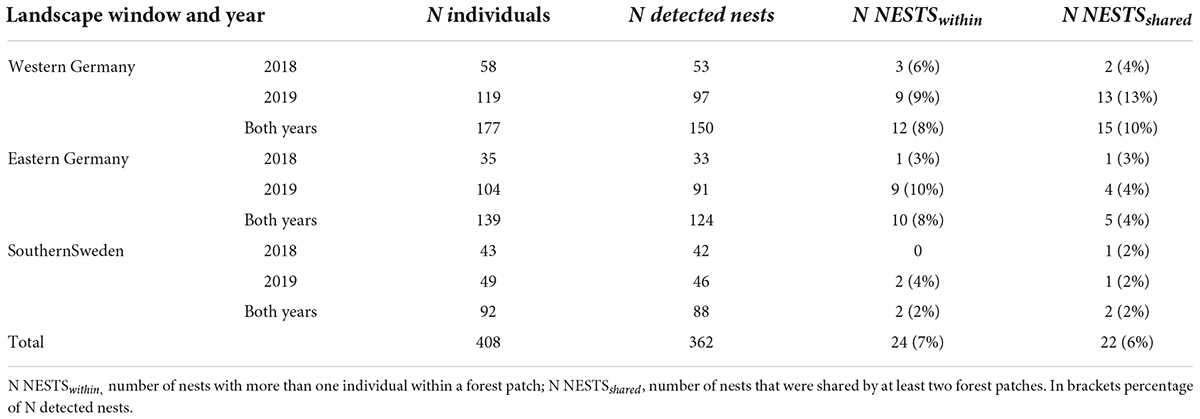
Table 5. Summary of full-sibship assignment (COLONY 2.0) for B. pascuorum for three landscape windows and 2 years.
Genetic structuring of the pollinators
The hierarchical AMOVA revealed that both levels (1. landscape windows, 2. forest patches) contributed significantly to the genetic structure of both pollinator species. However, while the forest patches in which the individuals were sampled explained 2.4% of the hoverfly’s genetic variance, they explained only 0.5% of the bumblebee’s genetic variance (Supplementary Table 11.2). In the MLPE models, geographic distance had a significant effect on G”ST but not on DPS of M. scalare (Figure 3 and Supplementary Table 11.1). With every kilometer, the G”ST of M. scalare increased by 12%. For B. pascuorum, we found no effect of geographic distance on DPS or on G”ST.
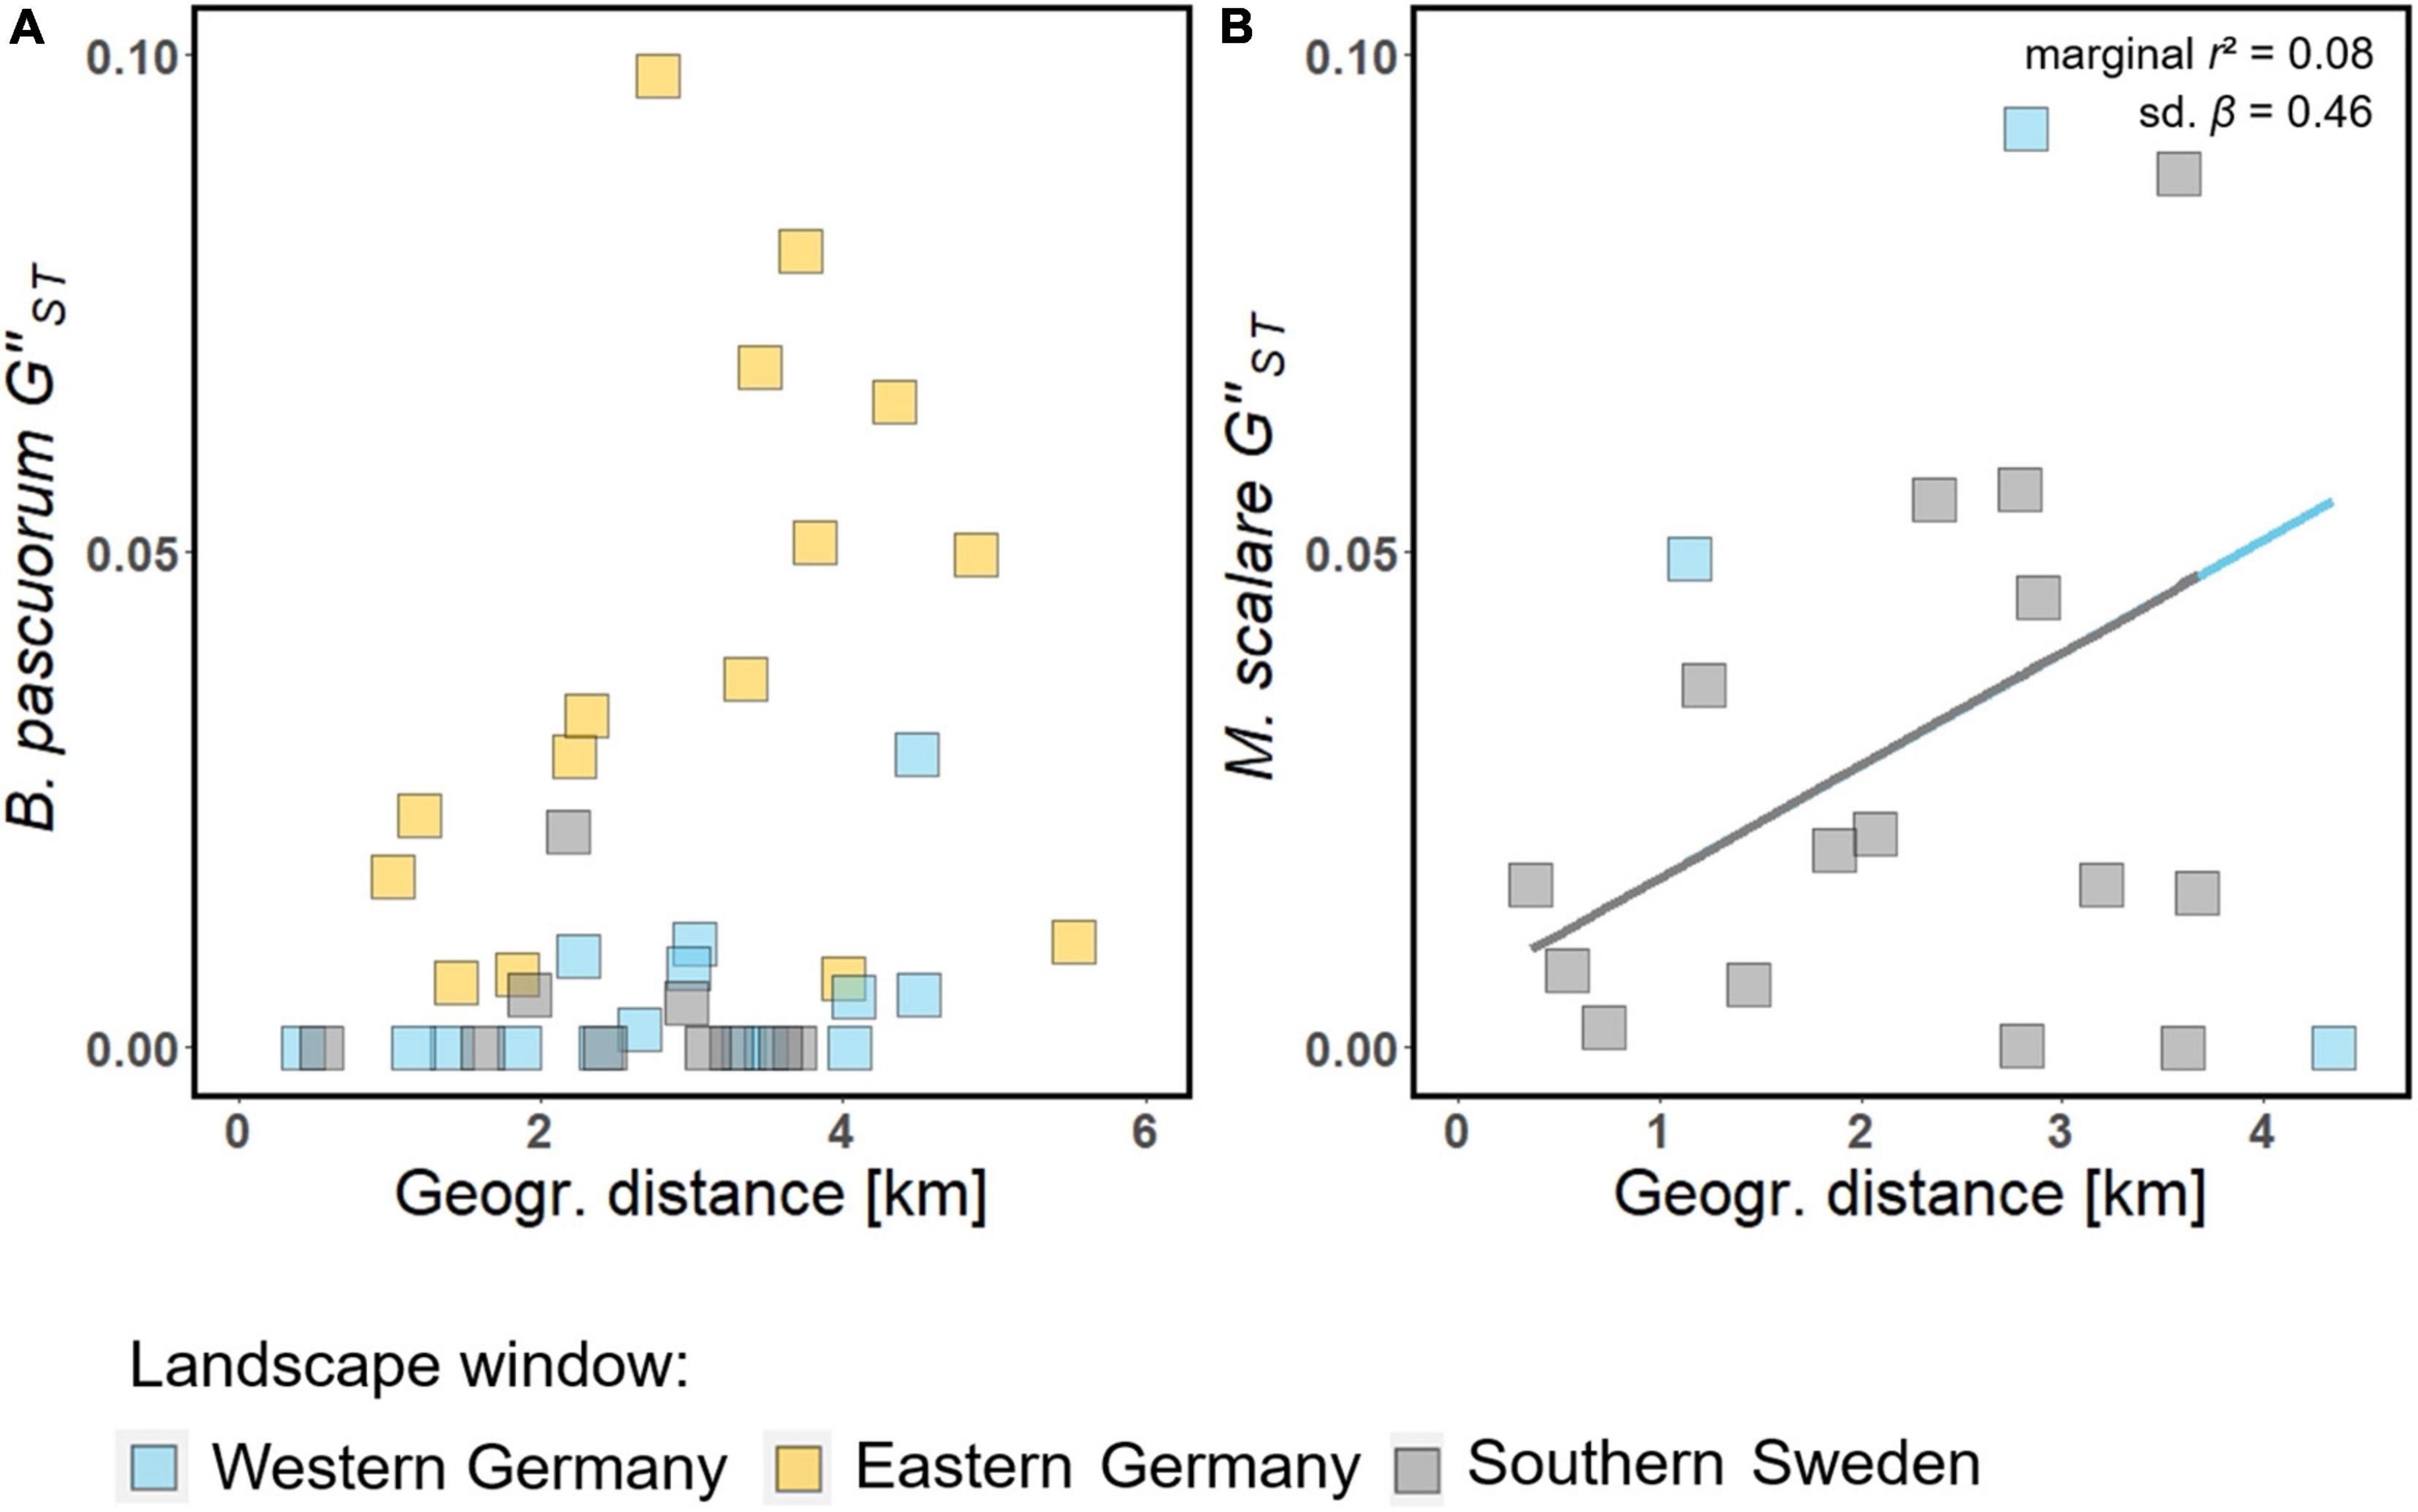
Figure 3. Effects of geographic distance on pairwise genetic differentiation of M. scalare (B) and B. pascuorum (A) according to MLPE models. Straight lines: effects with a p < 0.05. The marginal r2 and standardized regression coefficient (sd. β) are shown in the upper-right part for M. scalare. Filled squares: raw data.
Effects of pollinator movement activity on the genetic diversity of the forest herb populations within forest patches
Indicators of pollinator movement activity had significant effects on the genetic diversity of both forest herb species according to linear mixed models (Figure 4 and Supplementary Table 11.4). For the P. multiflorum-B. pascuorum pair, five out of 20 movement indicator-genetic diversity measure combinations were significant, with two additional combinations showing a trend (p < 0.1). The different indicators of movement activity showed partly contrasting effect directions. With higher NESTSshared and FOREST-PATCHESshared, there were more alleles in a forest herb population (Figures 4A,B). In contrast, Ar of B. pascuorum had a negative effect on Ar of P. multiflorum (Figure 4F). F increased with FOREST-PATCHESshared (Figure 4C). A value of FOREST-PATCHESshared of approximately 4 was close to F = 0 for P. multiflorum. In contrast, He of B. pascuorum had a negative effect on F (Figure 4G). Similarly, the movement indicators had opposite effects on Ho of P. multiflorum (Figures 4D,H). The effects of movement indicators on Ho of P. multiflorum were significant and borderline significant, respectively, only when not corrected for multiple testing (Supplementary Table 11.4).
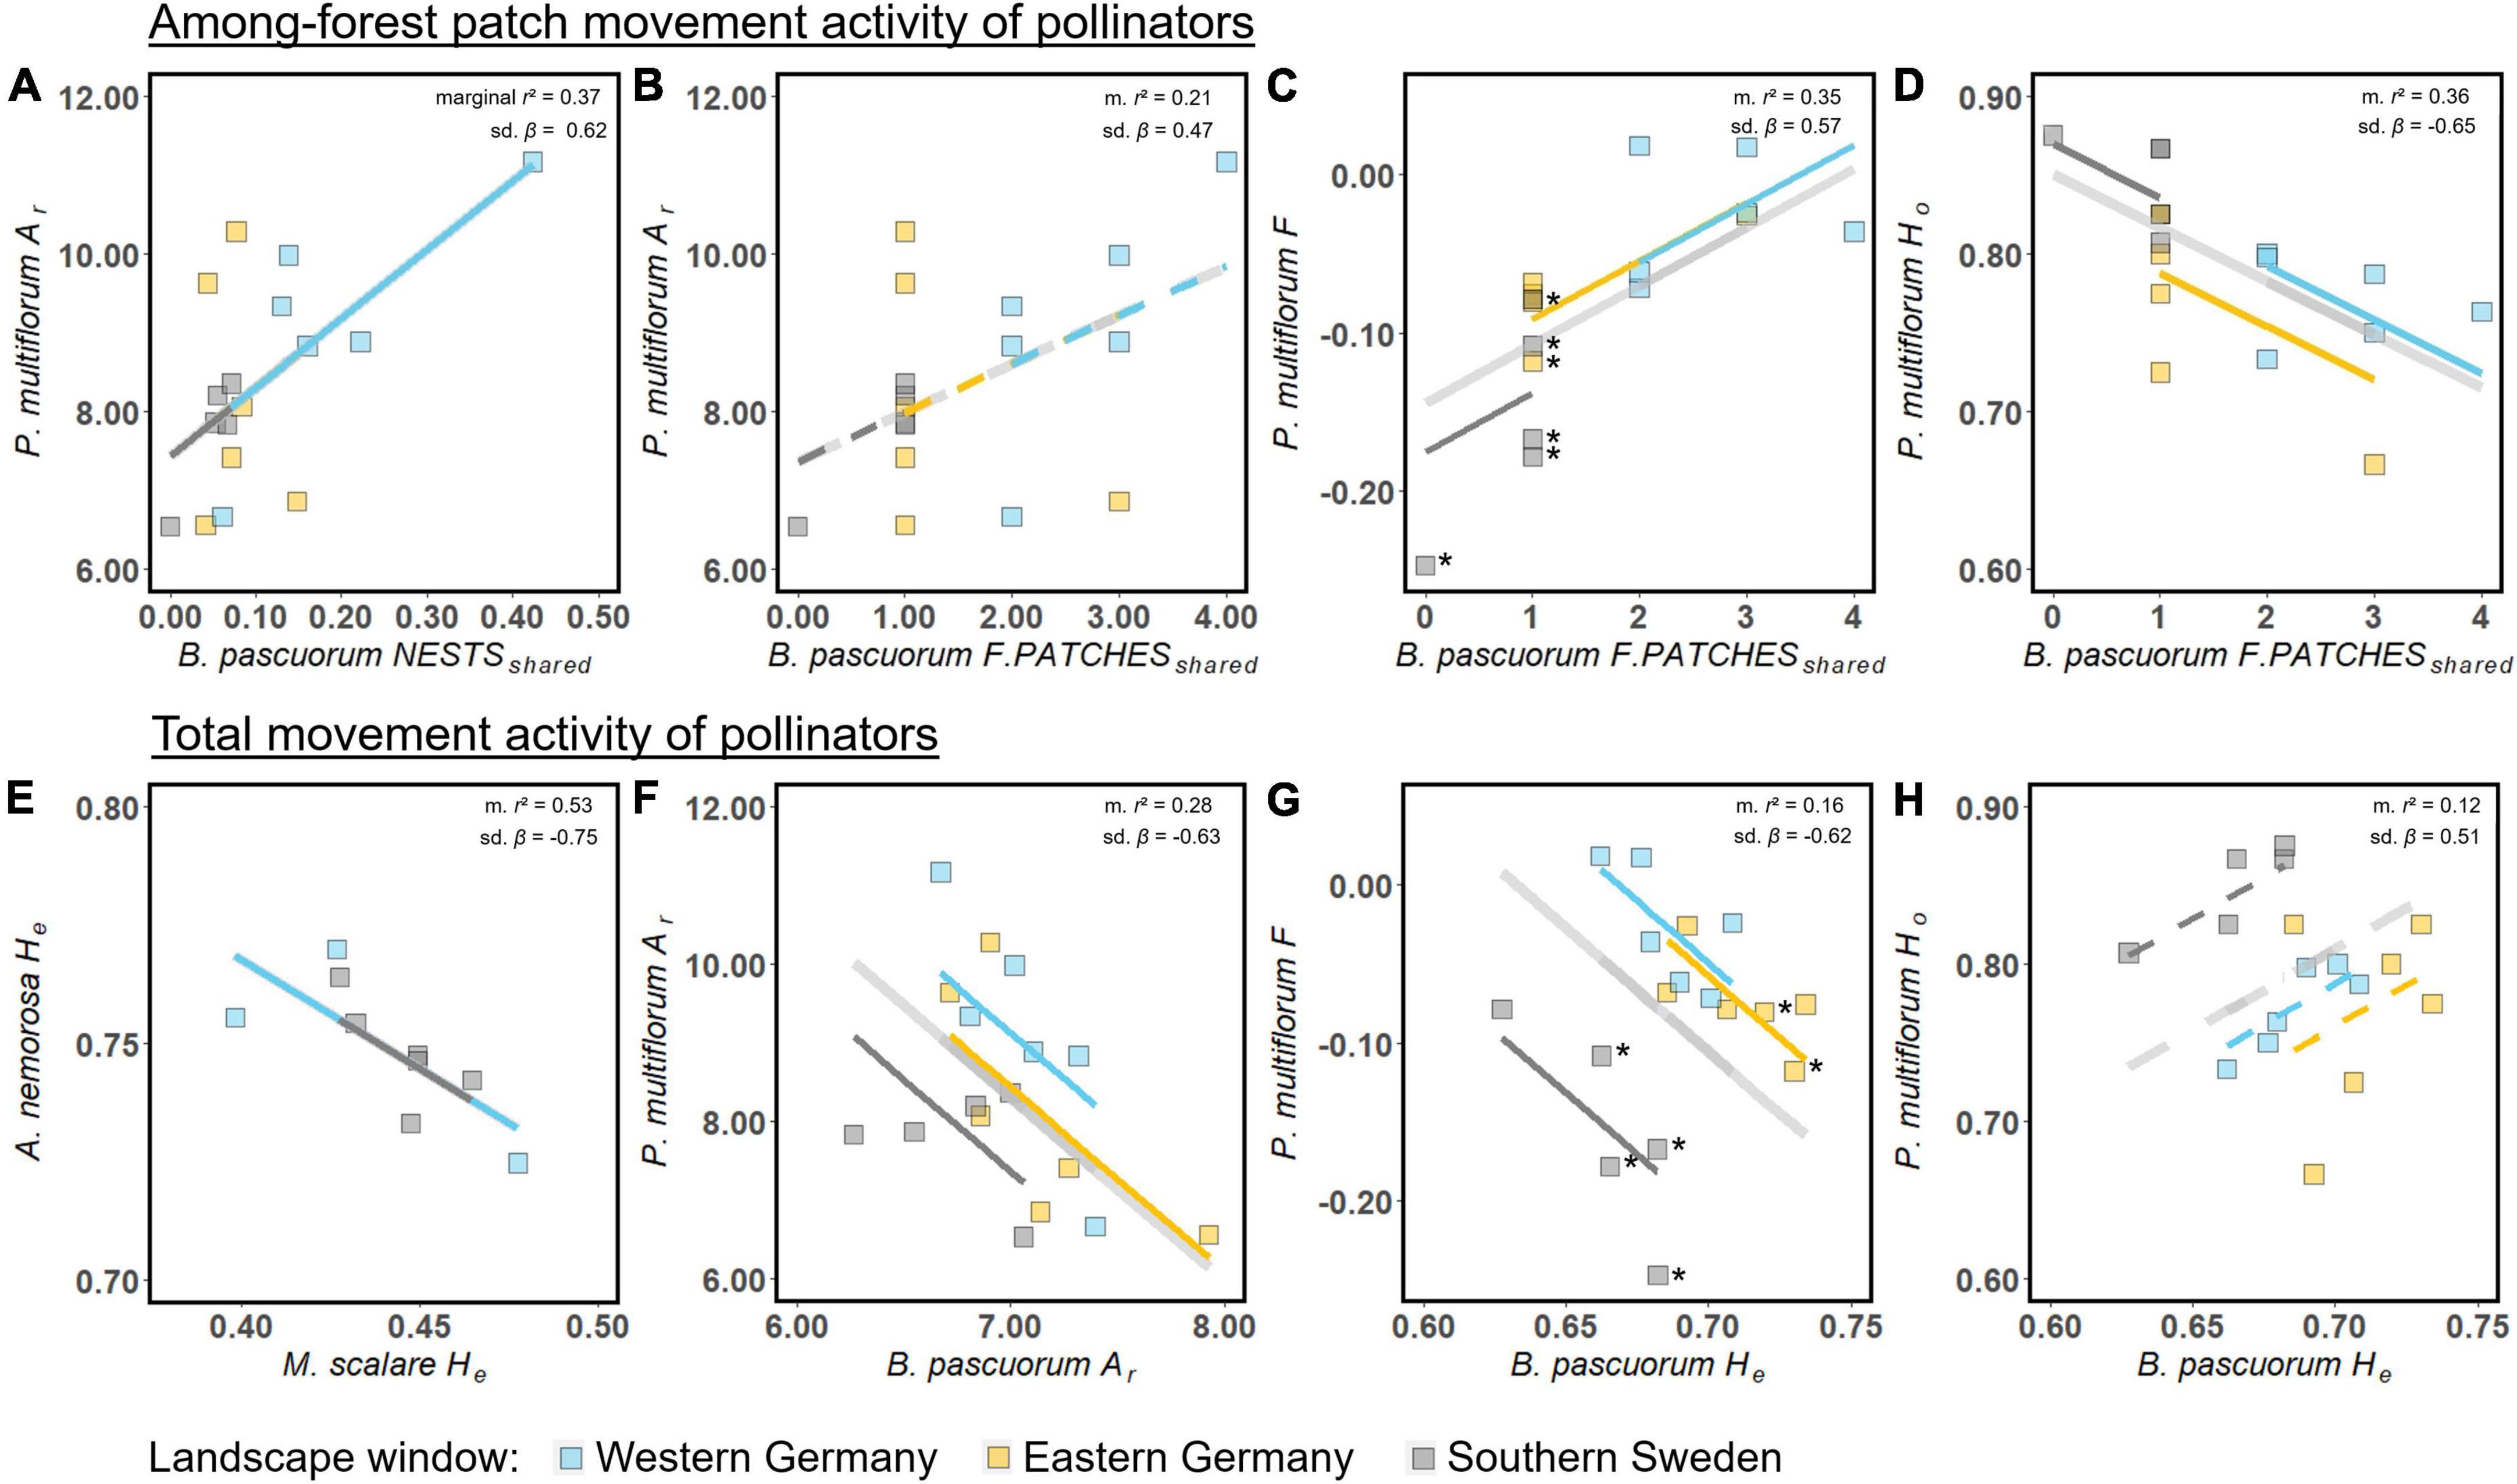
Figure 4. Effects of genetic indicators of pollinator movement activity among the forest patches (A–D) and total pollinator movement activity (E–H) of B. pascuorum and M. scalare on population genetic diversity of the forest herbs P. multiflorum and A. nemorosa, respectively, according to LMMs. Shown are the global effect of a model (bright gray line) and the effects in each landscape window, with p < 0.05 (solid lines) and p < 0.1 (dashed lines). The marginal r2 and standardized regression coefficient (sd. β) are shown in the upper-right part of each figure. All models for testing H2 with p < 0.1 are shown here. F. PATCHESshared: FOREST-PATCHESshared. The filled squares are the raw data. Forest herb populations with a significant negative F are marked with *.
For the A. nemorosa-M. scalare pair, we found one significant effect out of eight movement indicator-genetic diversity measure combinations, i.e., with a higher He of M. scalare, He of A. nemorosa decreased (Figure 4E).
Effects of pairwise pollinator movement activity on the genetic differentiation between forest herb populations
Two out of eight MLPE models showed significant effects of pairwise indicators of bumblebee pollinator movement activity on the genetic differentiation of P. multiflorum (Figure 5 and Supplementary Table 11.5). The DPS of P. multiflorum increased with increasing DPS of B. pascuorum. There was no significant effect for M. scalare-A. nemorosa pair.
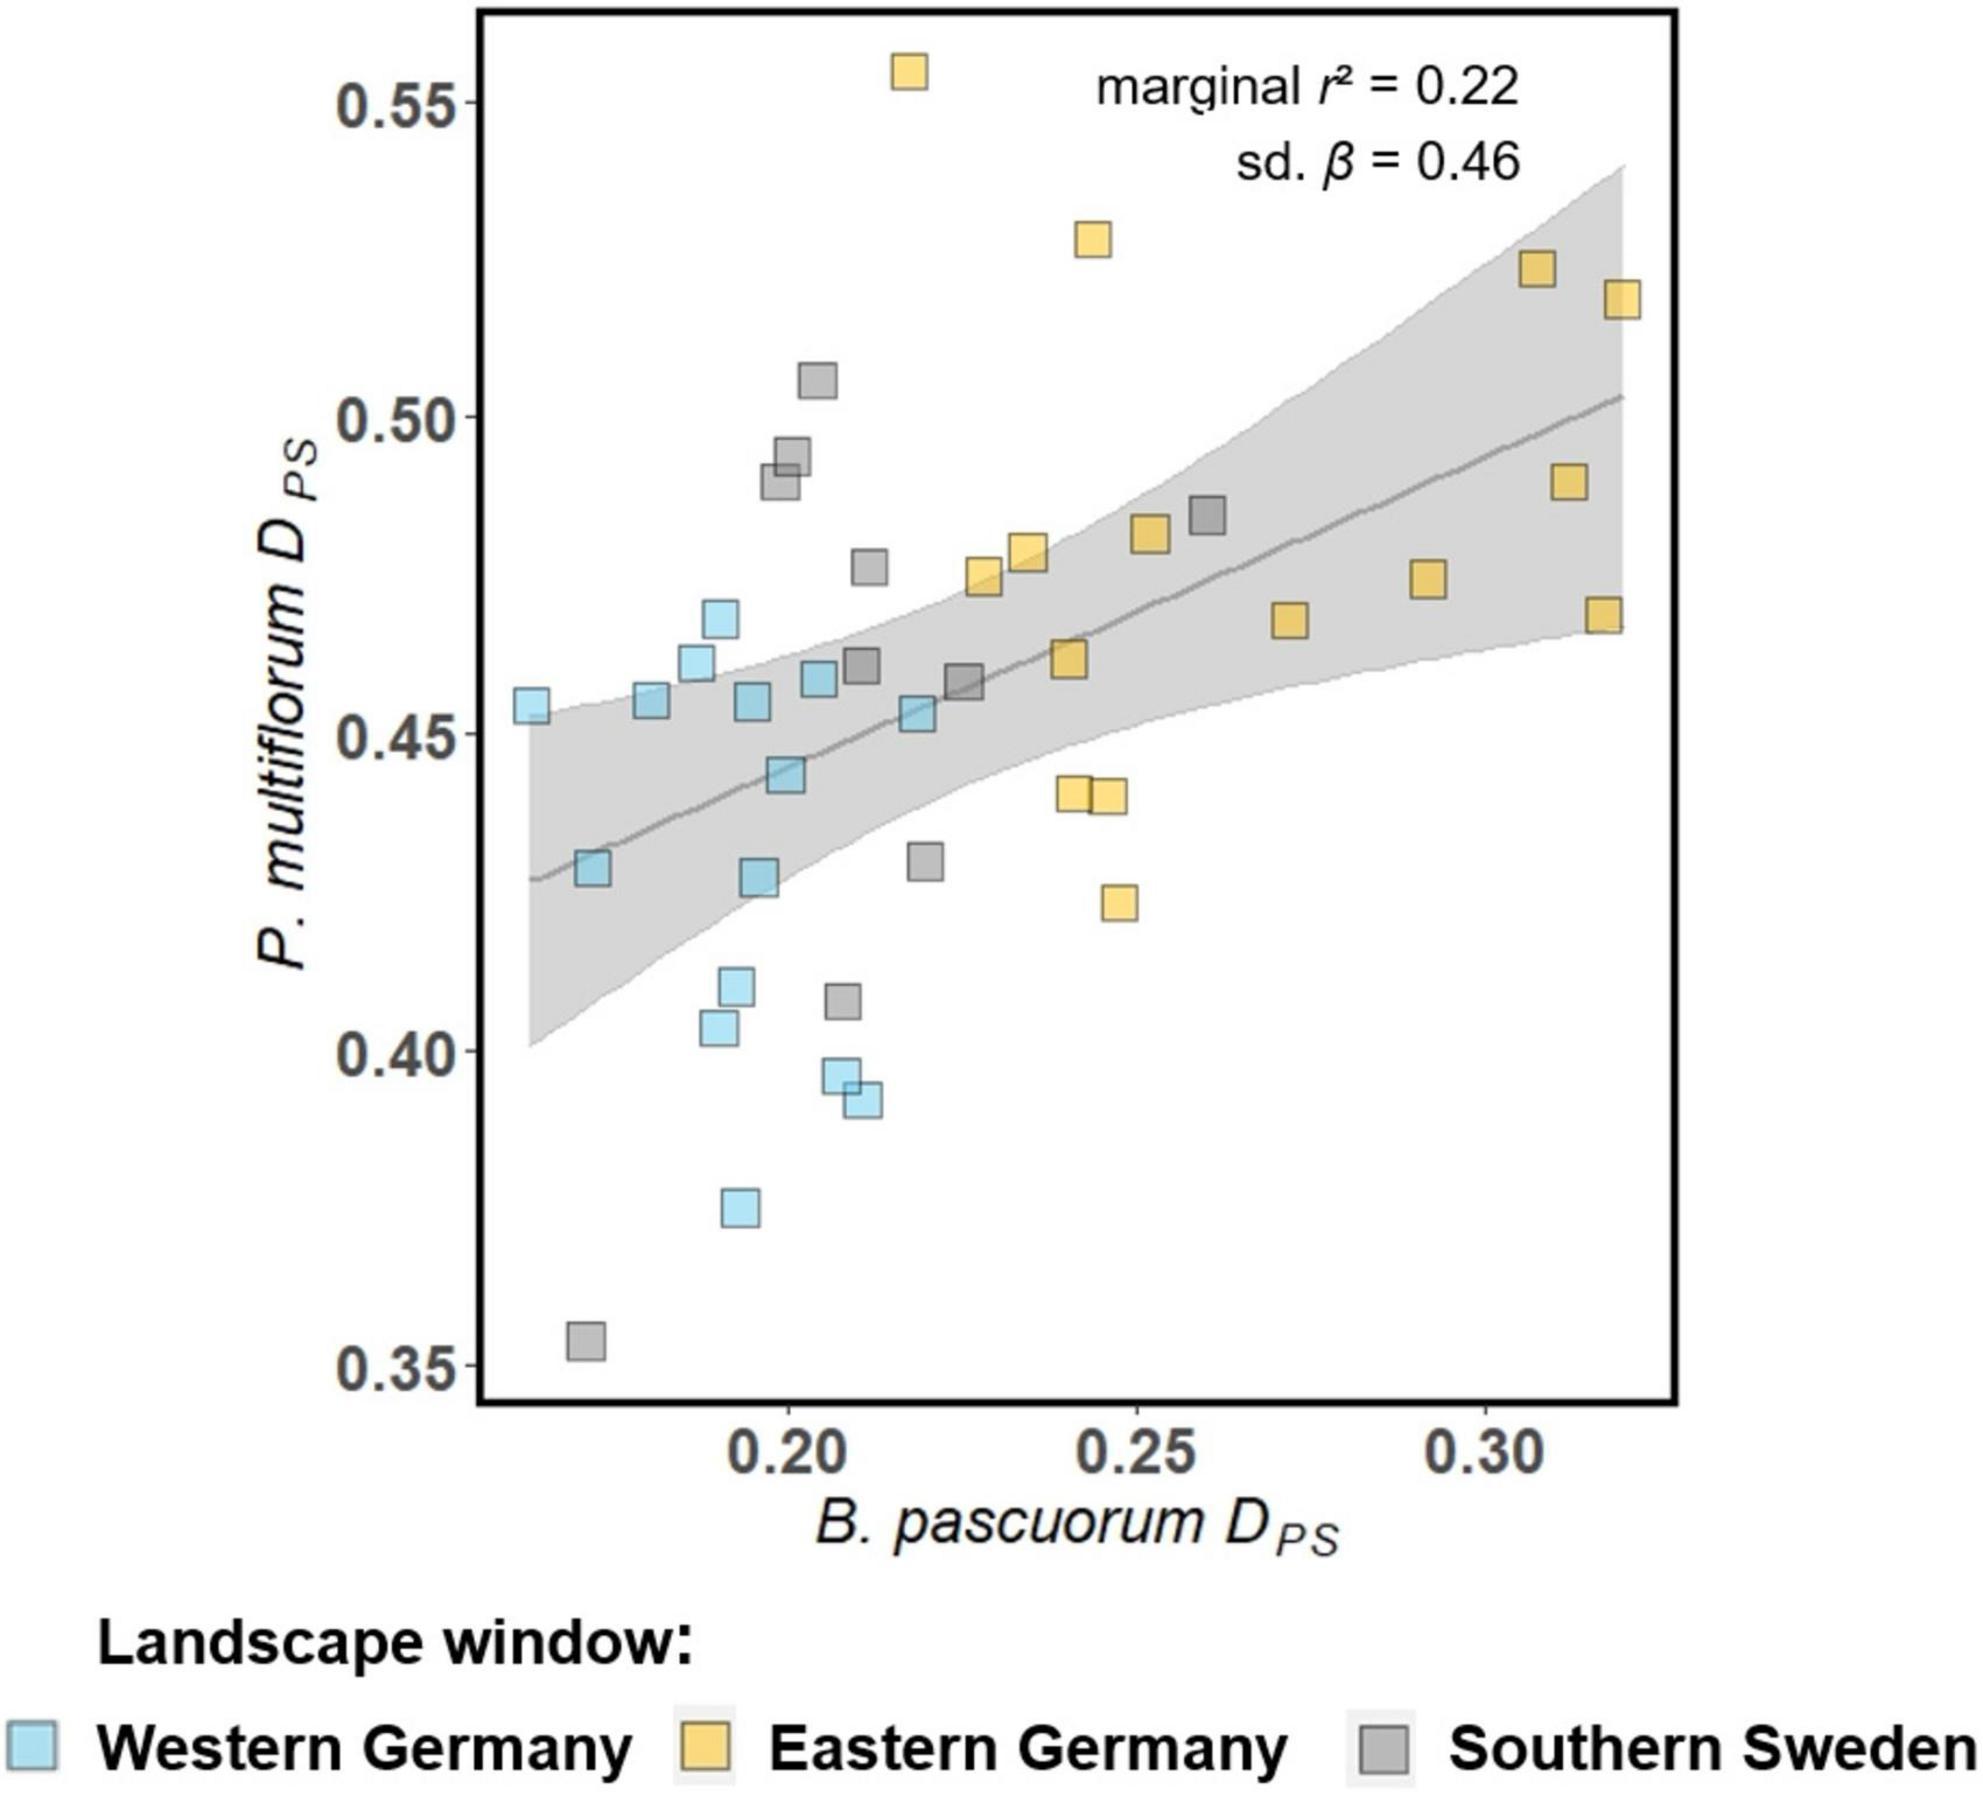
Figure 5. Effects of genetic indicators of pollinator movement activity of B. pascuorum on pairwise genetic differentiation of the associated forest herb P. multiflorum according to MLPE models. Shown are the global effect of the model (gray line) with p < 0.05 (solid lines), and p < 0.1 (dashed lines), the marginal r2 and the standardized regression coefficient (sd. β) (upper-right part of each figure), and the 95% confidence bands are in gray. The filled squares are the partial residuals.
Discussion
Our integrated approach not only supported our assumptions about differences in flight distances and habitat sensitivity between the two studied pollinator species (H1) but also demonstrated that the movement activity of the pollinators influences forest herb population genetics (H2). Different pollinator movement indicators showed contrasting effects on the forest herbs’ genetic diversity and differentiation. The positive effects of movement indicators that solely indicated pairwise movement activity between forest patches (B. pascuorum: NESTSshared, FOREST-PATCHESshared, DPS) revealed the presence of pollen-mediated gene flow among forest herb populations. This finding is noteworthy since no such effect of genetic linkers for spatially isolated forest herb populations has been shown before. In contrast, the unexpected, negative effects of movement indicators that indicated the total movement activity (B. pascuorum: Ar, He; M. scalare: He) could point to an acceleration of genetic drift within forest herb populations. We elaborate our interpretation of the findings in the following paragraphs.
Pollinator types differ in their potential to function as genetic linkers (H1)
Our results confirm that the genetic structuring of the two pollinator species differs. As predicted (P1), the genetic differentiation of the hoverfly, Melanostoma scalare, was sensitive to geographic distance on the studied scale and showed structuring according to the forest patches. In contrast, we found no such effect of geographic distance on the genetic differentiation of the bumblebee, Bombus pascuorum, of which the genetic structure was hardly explained by the forest patches (Figure 3 and Supplementary Table 11.2). This is likely because M. scalare covers shorter flight distances than B. pascuorum and is more strongly associated with forest habitat (Supplementary Table 3). These differences should be reflected in the effects of their movement activity on forest herb population genetics (Breed et al., 2015).
The results for B. pascuorum are in line with previous landscape-scale population genetic research on the same species, which showed low genetic differentiation (Chapman et al., 2003) and a weak signal of isolation by distance (Dreier et al., 2014). However, Chapman et al. (2003) only used measures based on heterozygosity, which also showed a weaker signal of differentiation than DPS in our study. In contrast to GST or G”ST, DPS does not assume any population genetic preconditions such as Hardy-Weinberg equilibrium. Thus, our approach indicates that DPS should be included in future research addressing genetic differentiation among sampling sites within a population of highly mobile organisms on a landscape scale.
Population genetic studies of hoverflies are rare and focused on migratory species on a European scale (Francuski et al., 2013; Raymond et al., 2013). The comparability between these species and M. scalare is limited because the migration behavior of hoverfly species (migratory vs. resident) is of central importance for their population structure (Luder et al., 2018).
Bombus pascuorum is a genetic linker of Polygonatum multiflorum populations (H2)
Our results indicate that B. pascuorum serves as a genetic linker among P. multiflorum populations in different forest patches. This is supported by (A) the finding of an unexpectedly high number of forest patches that shared nests of B. pascuorum, (B) positive effects of among-forest patch movement indicators of B. pascuorum on genetic diversity (Ar) and differentiation (DPS) of P. multiflorum, and (C) positive effects of among-forest patch movement indicators of B. pascuorum on the F-value of P. multiflorum.
More forests shared nests than expected
We found that 16 out of 17 forest patches shared at least one B. pascuorum nest (Figure 2 and Supplementary Figure 10), despite the high percentage of singletons (Table 5). This is a higher proportion (94%) than expected as it indicates that the pollinators cover larger distances among forest patches than previously reported forage distances. We only included nests that could be detected in multiple runs. This is a conservative approach. Thus the real number of shared nests might be even higher. The mean distance between all forest patches was 2.83 km (± 1.22 km), and the mean distance between forest patches sharing a nest was still 2.42 km (± 1.20 km) (Figure 2, Table 5, and Supplementary Table 9.3). These distances appear large in comparison to reported foraging distances of B. pascuorum, where distances larger than 1 km are considered rare (Darvill et al., 2004; Knight et al., 2005; Westphal et al., 2006; Redhead et al., 2016). The mentioned studies describe the movement behavior of B. pascuorum workers in summer with a high availability of flower resources, while we analyzed their movement behavior in spring. Plants in most other habitats do not flower that early in the year (Proesmans et al., 2019b). Thus, forest herbs are especially important as nectar resources for insect species active early in the year, including B. pascuorum (Goulson et al., 2010). Our study indicates that spatially isolated forest herb populations in different forest patches are visited by B. pascuorum workers from a shared nest even if geographic distances are over 2 km.
Movement activity of Bombus pascuorum indicates inflow of alleles (P2a) and a reduction in genetic differentiation among Polygonatum multiflorum populations (P2b)
As predicted (P2a), we found a positive effect of the among-forest patch movement activity of B. pascuorum (NESTSshared and FOREST-PATCHESshared) on the Ar of P. multiflorum (Figures 4A,B). Consistently with prediction 2b, we found that, the pairwise movement indicator (DPS) of B. pascuorum positively affected the pairwise genetic differentiation of P. multiflorum (DPS). This means that a higher bumblebee movement activity decreases the genetic differentiation of the forest herb. Higher gene flow is considered to homogenize populations (Ellstrand, 2014). Previous research has shown that plant populations associated with more mobile pollinator species are less differentiated (Kramer et al., 2011) and have more diverse pollen pools (Breed et al., 2015; Torres-Vanegas et al., 2019). Our findings add that a higher movement activity of a single pollinator species also results in an increase in the genetic diversity and genetic connectivity of the associated plant.
Bumblebee movement reduces heterozygote excess (P2a)
For the interpretation of the effects of FOREST-PATCHESshared on the F-value and Ho (Figures 4C,D), we have to consider that most populations (15 out of 17) of P. multiflorum had a negative F-value, which indicates heterozygote excess. Therefore, the F-value cannot be interpreted as a measure for inbreeding in this case. Reasons for heterozygote excess are diverse and can be of either a methodological or biological nature (Stoeckel et al., 2006). For P. multiflorum, there are two possible biological reasons. First, previous work has shown that a negative F-value occurs in populations of clonal species (Reichel et al., 2016), such as P. multiflorum. If the populations have a low rate of individuals reaching sexual maturity (Kosiński, 2015), many sampled genotypes reflect a former population structure, when the forest habitat was less fragmented and hosted a higher number of individuals. With a high proportion of clonal reproduction within the population, approaching Hardy-Weinberg equilibrium will take a long time which is reflected in the negative F-value in our populations (Reichel et al., 2016). With a longer time of clonal reproduction the heterozygote excess will even increase by the accumulation of mutations (Stoeckel et al., 2006). Second, the number of inflorescences and the number of flowers within a florescence differs tremendously among P. multiflorum individuals within a forest patch. If a low number of individuals dominates recruitment within a forest patch, this will also result in heterozygote excess (Pudovkin et al., 1996; Stoeckel et al., 2006). We found that a higher bumblebee movement activity among the forest patches resulted in F-values of P. multiflorum closer to 0, while with a lower movement activity among the forest patches, F-values became more negative. This means that with a higher pollen-mediated gene flow, the populations approach Hardy-Weinberg-equilibrium faster. This is because pollen influx increases the number of homozygous offspring through sexual recruitment by involving more different pollen donors from more forest patches. This also explains the decrease in Ho of P. multiflorum with more pollen-mediated gene flow among forest patches (Figure 4D). This dynamic phenomenon counterbalances both the effects of prolonged clonal growth and the effects of a low number of breeders within a forest patch. In our model, we found such a balanced situation, when one forest patch shared B. pascuorum nests with four other forest patches reaching Hardy-Weinberg equilibrium (F = 0) (Figure 4C).
High total pollinator movement activity reduces genetic diversity and increases differentiation of the associated forest herb
The movement indicators representing the total movement activity, including the within-forest patch movement activity (B. pascuorum: Ar, He; M. scalare: He), had unexpected effects on the genetic diversity and differentiation of both forest herbs: With a higher total movement activity (Ar, He) of the pollinators, the genetic diversity of forest herb populations decreased (Figures 4E–H). Theoretically, these patterns could represent non-causal relationships due to the correlation with another, not tested factor, such as a forest patch or landscape attribute. However, we lack any candidate variable that would influence all four species in the observed way particularly, because the two pollinator types had been selected for their contrasting traits concerning their mobility and sensitivity to the agricultural matrix. Thus, we consider it more convincing to interpret the observed effects as signs of accelerated genetic drift in forest herb populations receiving a more intense pollination service. There are two arguments for this interpretation.
First, for a doorstep forager species such as B. pascuorum, the within-forest patch movement might constitute a large part of its total movement activity because the forest offers both potential nesting (Svensson et al., 2000) and foraging (Kreyer et al., 2004) habitat (Supplementary Table 3). Therefore, high values of the movement indicators Ar and He may reflect the within-forest patch rather than the across-landscape movement activity. This interpretation is supported by the additional finding that the Ar of B. pascuorum was correlated (r = 0.63 and p = 0.006) with the number of nests with multiple individuals caught within a forest patch (Table 5 and Supplementary Table 9.2). If it is true, high indicator values should point to a high local pollination service rather than a long-distance pollen-mediated gene flow. Previous research showed for Bombus impatiens that the abundance of nests per hectare could predict the bumblebees’ pollination service for pumpkins (McGrady et al., 2021), and that the abundance of bumblebee individuals was positively correlated with the seed set of Trifolium species as host plants (Geib et al., 2015).
Second, long-living plants can store their genetic diversity over a longer time even under habitat fragmentation (Fuller and Doyle, 2018). This applies in particular to clonal forest herbs, such as P. multiflorum (Honnay et al., 2005). If sexual recruitment in these species increases, genetic diversity erodes faster (Honnay et al., 2005; Van Rossum, 2008). In this respect, previous studies have shown this dynamic for small fragmented plant populations (Van Rossum, 2008; Meloni et al., 2013).
Combining both arguments, our results might indicate that a higher within-forest patch movement activity, implying a higher pollination service, leads to higher sexual recruitment (Aguilar et al., 2006). This higher sexual recruitment might cause a faster loss of alleles thus far conserved via clonal growth (Figure 4F). A higher within-forest patch movement activity of B. pascuorum and an increased sexual recruitment should also result in a reduction of heterozygote excess, i.e., a higher F-value. However, as discussed above, it is likely that populations of P. multiflorum are dominated by a few larger clones, which serve as pollen donors. In this case, an increase in sexual recruitment would intensify the heterozygote excess. This would be an explanation for the negative effect of He of B. pascuorum on the F-values of P. multiflorum (Figure 4G).
Following the same rationale, we may interpret the negative effect of He of M. scalare on the He of A. nemorosa (Figure 4E) as follows: a high within-forest patch movement activity/pollination service of M. scalare indicated by He leads to more sexual recruitment of A. nemorosa within a forest patch. This accelerates genetic drift and reduces the long-term conservation of alleles through clonal reproduction.
The long-term survival of genotypes and thus populations by clonal reproduction has been discussed as a plant strategy to survive long enough to bridge periods of unfavorable conditions (Eriksson, 1996; Piessens et al., 2005). One example of such unfavorable conditions is the lack of pollinators (Eriksson, 1996). Our findings suggest that this strategy might not be successful under habitat fragmentation if the pollinator movement activity within a habitat patch is high, but an adequate amount of among-habitat patch movement is missing.
Melanostoma scalare is not a genetic linker of Anemone nemorosa populations
With our linear mixed models, we found no effect of the movement activity of M. scalare that could be linked to pollen-mediated gene flow among A. nemorosa populations. This was an expected result since M. scalare is a habitat specialist that flies over short distances. We showed, however, that the hoverfly’s movement activity within the forest patch reduced the genetic diversity of A. nemorosa (Figure 4E). This finding supports the argumentation that M. scalare is a relevant pollinator of A. nemorosa populations but not a relevant genetic linker among them. Nevertheless, it is important to consider three factors for interpreting this outcome. First, the sample size of M. scalare individuals per forest patch was too small for population genetic analysis in half of our forest patches (Supplementary materials 2, 4). Therefore, the number of forest patches that could be included in the models for the M. scalare-A. nemorosa pair was rather low. Second, our pollinator observations could not definitively confirm a strong association between A. nemorosa and M. scalare in the forest patches of this study (Supplementary Figure 2.2; Naaf et al., 2021). Identifying the most important pollinator of A. nemorosa is challenging because its flowering period is very early in the year when the temperatures are still (too) low for most insect pollinators. The number and type of pollinators that visit A. nemorosa can vary strongly with the weather conditions in a specific year, especially because the species is a generalist that accepts many different visitor types (see section “Materials and methods”: Sampling and identification of the associated pollinators; Supplementary materials 1–3). Third, the mean population size of A. nemorosa (1,923,304 individuals) was large in comparison to the mean population size of P. multiflorum (1,204 individuals). Nevertheless, its mean visitation rate of 2.5 visits/h per transect was lower than the 3.2 visits/h of P. multiflorum. In a larger population, the effect of gene flow on genetic diversity and genetic differentiation requires a longer time to become apparent (Varvio et al., 1986). If there are indeed few events in which M. scalare transports pollen of A. nemorosa among forest patches, the signal may be below the detectability of our sampling design.
Landscape composition might influence the genetic linkage of forest herb populations
The level of movement activity of B. pascuorum as well as the levels of genetic diversity and differentiation of P. multiflorum populations differed among the agricultural landscape windows. In western Germany, the observed effects indicated the highest level of pollen-mediated gene flow due to bumblebee movement (Figures 4A–D, 5). Western Germany also had the highest total forest and grassland cover, the highest number of forest patches and the lowest crop cover (Table 1). These differences in landscape composition may explain the different levels of pollen-mediated gene flow. The foraging behavior of bumblebees is very sensitive to the quality of foraging resources and the available types of habitats (Carvell et al., 2011, 2012). If the landscape composition influences pollinator movement this also affects the population dynamics of the associated plant species (Cranmer et al., 2012). For example, the amount of fake pollen transported by bumblebees among populations of Primula vulgaris was higher above grassland than above cropland (Van Geert et al., 2014). Woodland and grassland, at the expense of cropland in the landscape surrounding P. multiflorum populations increased allelic richness and reduced heterozygote excess (Naaf et al., 2021, 2022). It is also likely that our movement indicators reflect a certain landscape composition. Bumblebee nesting and foraging behavior is influenced by the arrangement and distribution of specific land-use types (Cranmer et al., 2012; Kallioniemi et al., 2017). Even though we found no evidence for M. scalare being a genetic linker of A. nemorosa populations among forest patches, the landscape composition still affects the hoverfly’s movement activity. With a very high number of hedgerows, there might also be more movement of forest-specialized hoverflies between the forest patches in spring (Haenke et al., 2014).
Considering landscape effects, we have to take into account that the agricultural landscape itself has been changing over time (Skokanová et al., 2016). This is also true for our three landscape windows (unpublished data). Within the temporal scale applied for population genetic analyses and depicted by microsatellite markers Ar and He are assumed to have slightly different reaction times (Epps and Keyghobadi, 2015). Thus, Ar of P. multiflorum might reflect a more recent landscape composition than He of A. nemorosa. A deeper understanding of how different land-use types affect the movement activity of pollinators is crucial if we want to ensure the long-term survival of isolated forest herb populations in agricultural landscapes that depend on pollinators as genetic linkers.
Conclusion
Our results revealed that the bumblebee B. pascuorum serves as a genetic linker for the forest herb P. multiflorum, while we found no such evidence for the forest-specialized hoverfly M. scalare, which is an important pollinator of A. nemorosa. For spatially isolated forest herb populations that are connected by bumblebee movement, pollen-mediated gene flow in agricultural landscapes may be present even over distances > 2 km. Genetic links are apparently affected by the landscape composition, which needs further study. We also found hints for both forest herb-pollinator pairs that a higher total pollinator activity might accelerate genetic drift through enhanced sexual recruitment and thus might diminish the temporal buffer that clonal growth provides against habitat fragmentation effects. This should be considered in landscape planning with the aim of increasing pollinator abundance. Conservation measures such as wild flower strips in proximity to forest patches, which aim to increase local pollinator activities would counterintuitively increase the loss of genetic diversity in forest herb populations if it is not counterbalanced by sufficient functional connectivity and by preserving larger forest habitats. A deeper and more comprehensive understanding of the behavior of genetic linkers will help to manage agricultural landscapes in a way that allows genetic exchange between (semi-)natural habitats.
Data availability statement
The allele tables of the forest herbs are accessible on DRYAD via https://doi.org/10.5061/dryad.tb2rbp00k. The allele tables of the pollinators are also accessible on DRYAD via doi: 10.5061/dryad.sf7m0cg8w. The r-script for the analysis is stored as Supplementary material.
Author contributions
SIJH, TN, and KK conceived and designed the study. JTF, SIJH, TN, SH, and KK performed the molecular lab work. JTF, TN, and SH did the allele calling. JTF analyzed the data and wrote the first draft of the manuscript with contributions of TN, SH, SIJH, and KK. All authors contributed to revisions and involved in site selection, field work, and sampling.
Funding
This research was funded by the German Research Foundation (research grants NA 1067/2-1, HO 4742/2-1, and KR 5060/1-1). This includes the research work of JTF, KK, SH, SIJH, and TN. This work was supported by the FWO Scientific research network FLEUR (http://www.fleur.ugent.be). This research was also partly funded by German Federal Ministry of Food and Agriculture (BMEL) and the Ministry for Science, Research and Culture of the State of Brandenburg (MWFK).
Acknowledgments
We thank Jana Buntschuh, Julius Schwarz, and Dustin Kulanek for their support during field work, species identification, and lab work.
Conflict of interest
The authors declare that the research was conducted in the absence of any commercial or financial relationships that could be construed as a potential conflict of interest.
Publisher’s note
All claims expressed in this article are solely those of the authors and do not necessarily represent those of their affiliated organizations, or those of the publisher, the editors and the reviewers. Any product that may be evaluated in this article, or claim that may be made by its manufacturer, is not guaranteed or endorsed by the publisher.
Supplementary material
The Supplementary Material for this article can be found online at: https://www.frontiersin.org/articles/10.3389/fevo.2022.908258/full#supplementary-material
References
Aguilar, R., Ashworth, L., Galetto, L., and Aizen, M. A. (2006). Plant reproductive susceptibility to habitat fragmentation: review and synthesis through a meta-analysis. Ecol. Lett. 9, 968–980. doi: 10.1111/j.1461-0248.2006.00927.x
Aguilar, R., Cristóbal-Pérez, E. J., Balvino-Olvera, F. J., de Jesús Aguilar-Aguilar, M., Aguirre-Acosta, N., Ashworth, L., et al. (2019). Habitat fragmentation reduces plant progeny quality: a global synthesis. Ecol. Lett. 22, 1163–1173. doi: 10.1111/ele.13272
Allendorf, F. W., Luikart, G. H., and Aitken, S. N. (2012). Conservation and the Genetics of Populations. Oxford: Wiley-Blackwell.
Auffret, A. G., Rico, Y., Bullock, J. M., Hooftman, D. A., Pakeman, R. J., Soons, M. B., et al. (2017). Plant functional connectivity–integrating landscape structure and effective dispersal. J. Ecol. 105, 1648–1656. doi: 10.1111/1365-2745.12742
Billeter, R., Liira, J., Bailey, D., Bugter, R., Arens, P., Augenstein, I., et al. (2008). Indicators for biodiversity in agricultural landscapes: a pan-European study. J. Appl. Ecol. 45, 141–150. doi: 10.1111/j.1365-2664.2007.01393.x
Bonin, A., Bellemain, E., Bronken Eidesen, P., Pompanon, F., Brochmann, C., and Taberlet, P. (2004). How to track and assess genotyping errors in population genetics studies. Mol. Ecol. 13, 3261–3273. doi: 10.1111/j.1365-294X.2004.02346.x
Breed, M. F., Ottewell, K., Gardner, M., Marklund, M. H., Dormontt, E., and Lowe, A. (2015). Mating patterns and pollinator mobility are critical traits in forest fragmentation genetics. Heredity 115, 108–114. doi: 10.1038/hdy.2013.48
Carvell, C., Osborne, J., Bourke, A., Freeman, S., Pywell, R. F., and Heard, M. (2011). Bumble bee species’ responses to a targeted conservation measure depend on landscape context and habitat quality. Ecol. Appl. 21, 1760–1771. doi: 10.1890/10-0677.1
Carvell, C., Jordan, W. C., Bourke, A. F., Pickles, R., Redhead, J. W., and Heard, M. S. (2012). Molecular and spatial analyses reveal links between colony-specific foraging distance and landscape-level resource availability in two bumblebee species. Oikos 121, 734–742. doi: 10.1111/j.1600-0706.2011.19832.x
Chapman, R. E., Wang, J., and Bourke, A. F. G. (2003). Genetic analysis of spatial foraging patterns and resource sharing in bumble bee pollinators. Mol. Ecol. 12, 2801–2808. doi: 10.1046/j.1365-294X.2003.01957.x
Chen, M., Zhao, X.-Y., and Zuo, X.-A. (2019). Comparative pollen limitation and pollinator activity of Caragana korshinskii Kom. in natural and fragmented habitats. Sci. Total Environ. 654, 1056–1063. doi: 10.1016/j.scitotenv.2018.11.148
Cheptou, P. O., Hargreaves, A. L., Bonte, D., and Jacquemyn, H. (2017). Adaptation to fragmentation: evolutionary dynamics driven by human influences. Philos. Trans. R. Soc. B Biol. Sci. 372:20160037. doi: 10.1098/rstb.2016.0037
Chittka, L., Thomson, J. D., and Waser, N. M. (1999). Flower constancy, insect psychology, and plant evolution. Naturwissenschaften 86, 361–377. doi: 10.1007/s001140050636
Clarke, R. T., Rothery, P., and Raybould, A. F. (2002). Confidence limits for regression relationships between distance matrices: estimating gene flow with distance. J. Agricultural Biol. Environ. Statistics 7, 361–372. doi: 10.1198/108571102320
Cranmer, L., McCollin, D., and Ollerton, J. (2012). Landscape structure influences pollinator movements and directly affects plant reproductive success. Oikos 121, 562–568. doi: 10.1111/j.1600-0706.2011.19704.x
Cushman, S. A., McRae, B. H., and McGarigal, K. (2015). “Basics of landscape ecology: an introduction to landscapes and population processes for landscape geneticists,” in Landscape Genetics: Concepts, Methods, Applications, eds N. Balkenhol, S. A. Cushman, A. T. Storfer and L. P. Waits (West Sussex: John Wiley & Sons). doi: 10.1002/9781118525258.ch02
Darvill, B., Knight, M. E., and Goulson, D. (2004). Use of genetic markers to quantify bumblebee foraging range and nest density. Oikos 107, 471–478. doi: 10.1111/j.0030-1299.2004.13510.x
Dobeš, C., Konrad, H., and Geburek, T. (2017). Potential population genetic consequences of habitat fragmentation in central European Forest trees and associated understorey species—an introductory survey. Diversity 9:9. doi: 10.3390/d9010009
Dornhaus, A., and Chittka, L. (1999). Evolutionary origins of bee dances. Nature 401, 38–38. doi: 10.1038/43372
Dreier, S., Redhead, J. W., Warren, I. A., Bourke, A. F., Heard, M. S., Jordan, W. C., et al. (2014). Fine-scale spatial genetic structure of common and declining bumble bees across an agricultural landscape. Mol. Ecol. 23, 3384–3395. doi: 10.1111/mec.12823
Ellstrand, N. C. (2014). Is gene flow the most important evolutionary force in plants? Am. J. Botany 101, 737–753. doi: 10.3732/ajb.1400024
Epps, C. W., and Keyghobadi, N. (2015). Landscape genetics in a changing world: disentangling historical and contemporary influences and inferring change. Mol. Ecol. 24, 6021–6040. doi: 10.1111/mec.13454
Eriksson, O. (1996). Regional dynamics of plants: a review of evidence for remnant, source-sink and metapopulations. Oikos 77, 248–258. doi: 10.2307/3546063
Estoup, A., Scholl, A., Pouvreau, A., and Solignac, M. (1995). Monoandry and polyandry in bumble bees (Hymenoptera; Bombinae) as evidenced by highly variable microsatellites. Mol. Ecol. 4, 89–94. doi: 10.1111/j.1365-294X.1995.tb00195.x
Estoup, A., Solignac, M., Cornuet, J. M., Goudet, J., and Scholl, A. (1996). Genetic differentiation of continental and island populations of Bombus terrestris (Hymenoptera: Apidae) in Europe. Mol. Ecol. 5, 19–31. doi: 10.1111/j.1365-294X.1996.tb00288.x
Excoffier, L., Smouse, P. E., and Quattro, J. M. (1992). Analysis of molecular variance inferred from metric distances among DNA haplotypes: application to human mitochondrial DNA restriction data. Genetics 131, 479–491. doi: 10.1093/genetics/131.2.479
FAO and UNEP (2020). The State of the World’s Forests 2020. Forests, Biodiversity and People. Rome: FAO. Available online at: https://www.fao.org/documents/card/en/c/ca8642en
Francuski, L., Djurakic, M., Ludoški, J., and Milankov, V. (2013). Landscape genetics and spatial pattern of phenotypic variation of Eristalis tenax across Europe. J. Zool. Systematics Evol. Res. 51, 227–238. doi: 10.1111/jzs.12017
Frankham, R. (1996). Relationship of genetic variation to population size in wildlife. Conservation Biol. 10, 1500–1508. doi: 10.1046/j.1523-1739.1996.10061500.x
Fuller, M. R., and Doyle, M. W. (2018). Gene flow simulations demonstrate resistance of long-lived species to genetic erosion from habitat fragmentation. Conservation Genet. 19, 1439–1448. doi: 10.1007/s10592-018-1112-5
Fussell, M., and Corbet, S. A. (1991). Forage for bumble bees and honey bees in farmland: a case study. J. Apicultural Res. 30, 87–97. doi: 10.1080/00218839.1991.11101239
Gatter, W., Schmid, U., Gatter, W., and Jauch, G. (1990). Die wanderungen der schwebfliegen (Diptera. Syrphidae) am Randecker Maar. Spixiana 15, 44–59.
Geib, J. C., Strange, J. P., and Galen, C. (2015). Bumble bee nest abundance, foraging distance, and host-plant reproduction: implications for management and conservation. Ecol. Appl. 25, 768–778. doi: 10.1890/14-0151.1
Gilliam, F. S. (2007). The ecological significance of the herbaceous layer in temperate forest ecosystems. BioScience 57, 845–858. doi: 10.1641/B571007
Goulson, D. (2010). Bumblebees: Behaviour, Ecology, and Conservation. Oxford: Oxford University Press on Demand.
Goulson, D., Lepais, O., O’Connor, S., Osborne, J. L., Sanderson, R. A., Cussans, J., et al. (2010). Effects of land use at a landscape scale on bumblebee nest density and survival. J. Appl. Ecol. 47, 1207–1215. doi: 10.1111/j.1365-2664.2010.01872.x
Greenleaf, S. S. (2007). Bee foraging ranges and their relationship to body size. Oecologia 153, 589–596. doi: 10.1007/s00442-007-0752-9
Hadley, A. S., and Betts, M. G. (2012). The effects of landscape fragmentation on pollination dynamics: absence of evidence not evidence of absence. Biol. Rev. 87, 526–544. doi: 10.1111/j.1469-185X.2011.00205.x
Haenke, S., Kovács-Hostyánszki, A., Fründ, J., Batáry, P., Jauker, B., Tscharntke, T., et al. (2014). Landscape configuration of crops and hedgerows drives local syrphid fly abundance. J. Appl. Ecol. 51, 505–513. doi: 10.1111/1365-2664.12221
Hasegawa, T., and Kudo, G. (2005). Comparisons of growth schedule, reproductive property and allocation pattern among three rhizomatous Polygonatum species with reference to their habitat types. Plant Species Biol. 20, 23–32. doi: 10.1111/j.1442-1984.2005.00120.x
Herrmann, F., Westphal, C., Moritz, R. F., and Steffan-Dewenter, I. (2007). Genetic diversity and mass resources promote colony size and forager densities of a social bee (Bombus pascuorum) in agricultural landscapes. Mol. Ecol. 16, 1167–1178. doi: 10.1111/j.1365-294X.2007.03226.x
Honnay, O., Jacquemyn, H., Bossuyt, B., and Hermy, M. (2005). Forest fragmentation effects on patch occupancy and population viability of herbaceous plant species. New Phytol. 166, 723–736. doi: 10.1111/j.1469-8137.2005.01352.x
Jacquemyn, H., Brys, R., Honnay, O., Hermy, M., and Roldan-Ruiz, I. (2006). Sexual reproduction, clonal diversity and genetic differentiation in patchily distributed populations of the temperate forest herb Paris quadrifolia (Trilliaceae). Oecologia 147, 434–444. doi: 10.1007/s00442-005-0287-x
Jauker, F. (2009). Pollinator dispersal in an agricultural matrix: opposing responses of wild bees and hoverflies to landscape structure and distance from main habitat. Landscape Ecol. 24, 547–555. doi: 10.1007/s10980-009-9331-2
Jeltsch, F., Bonte, D., Pe’er, G., Reineking, B., Leimgruber, P., Balkenhol, N., et al. (2013). Integrating movement ecology with biodiversity research - exploring new avenues to address spatiotemporal biodiversity dynamics. Movement Ecol. 1:6. doi: 10.1186/2051-3933-1-6
Jones, O. R., and Wang, J. (2010). COLONY: a program for parentage and sibship inference from multilocus genotype data. Mol. Ecol. Resources 10, 551–555. doi: 10.1111/j.1755-0998.2009.02787.x
Kallioniemi, E., Åström, J., Rusch, G. M., Dahle, S., Åström, S., and Gjershaug, J. O. (2017). Local resources, linear elements and mass-flowering crops determine bumblebee occurrences in moderately intensified farmlands. Agriculture Ecosystems Environ. 239, 90–100. doi: 10.1016/j.agee.2016.12.039
Kamm, U., Gugerli, F., Rotach, P., Edwards, P., and Holderegger, R. (2010). Open areas in a landscape enhance pollen-mediated gene flow of a tree species: evidence from northern Switzerland. Landscape Ecol. 25, 903–911. doi: 10.1007/s10980-010-9468-z
Kamvar, Z. N., Tabima, J. F., and Grünwald, N. J. (2014). Poppr: an R package for genetic analysis of populations with clonal, partially clonal, and/or sexual reproduction. PeerJ 2:281. doi: 10.7717/peerj.281
Kells, A. R., and Goulson, D. (2003). Preferred nesting sites of bumblebee queens (Hymenoptera: Apidae) in agroecosystems in the UK. Biol. Conservation 109, 165–174. doi: 10.1016/S0006-3207(02)00131-3
Knight, M. E., Martin, A. P., Bishop, S., Osborne, J. L., Hale, R. J., Sanderson, R. A., et al. (2005). An interspecific comparison of foraging range and nest density of four bumblebee (Bombus) species. Mol. Ecol. 14, 1811–1820. doi: 10.1111/j.1365-294X.2005.02540.x
Kolb, A. (2008). Habitat fragmentation reduces plant fitness by disturbing pollination and modifying response to herbivory. Biol. Conservation 141, 2540–2549. doi: 10.1016/j.biocon.2008.07.015
Kosiński, I. (2012). Generative reproduction dynamics in populations of the perennial herb Polygonatum multiflorum (Asparagaceae). Ann. Botanici Fennici 49, 217–228. doi: 10.5735/085.049.0401
Kosiński, I. (2015). Ontogenetic development and maturity of individuals of Polygonatum multiflorum. Flora-Morphol. Distribution Functional Ecol. Plants 216, 1–5. doi: 10.1016/j.flora.2015.08.002
Kramer, A. T., Ison, J. L., Ashley, M. V., and Howe, H. F. (2008). The paradox of forest fragmentation genetics. Conservation Biol. 22, 878–885. doi: 10.1111/j.1523-1739.2008.00944.x
Kramer, A. T., Fant, J. B., and Ashley, M. V. (2011). Influences of landscape and pollinators on population genetic structure: examples from three Penstemon (Plantaginaceae) species in the Great Basin. Am. J. Botany 98, 109–121. doi: 10.3732/ajb.1000229
Kreyer, D., Oed, A., Walther-Hellwig, K., and Frankl, R. (2004). Are forests potential landscape barriers for foraging bumblebees? Landscape scale experiments with Bombus terrestris agg. and Bombus pascuorum (Hymenoptera, Apidae). Biol. Conservation 116, 111–118. doi: 10.1016/S0006-3207(03)00182-4
Leimu, R., Mutikainen, P., Koricheva, J., and Fischer, M. (2006). How general are positive relationships between plant population size, fitness and genetic variation? J. Ecol. 94, 942–952. doi: 10.1111/j.1365-2745.2006.01150.x
Lowe, A., Cavers, S., Boshier, D., Breed, M., and Hollingsworth, P. (2016). The resilience of forest fragmentation genetics—no longer a paradox—we were just looking in the wrong place. Heredity 116:348. doi: 10.1038/hdy.2015.86
Loxdale, H., and Lushai, G. (2001). “Use of genetic diversity in movement studies of flying insects. Insect movement: mechanisms and consequences,” in Proceedings of the Royal Entomological Society’s 20th Symposium, (London: CABI). doi: 10.1079/9780851994567.0361
Luder, K., Knop, E., and Menz, M. H. M. (2018). Contrasting responses in community structure and phenology of migratory and non-migratory pollinators to urbanization. Diversity Distributions 24, 919–927. doi: 10.1111/ddi.12735
Lundberg, J., and Moberg, F. (2003). Mobile link organisms and ecosystem functioning: implications for ecosystem resilience and management. Ecosystems 6, 87–98. doi: 10.1007/s10021-002-0150-4
Martínez-Bauer, A. E., Chadwick, F. J., Westmoreland, A. J., and Lander, T. A. (2021). Novel pollen analogue technique shows bumblebees display low floral constancy and prefer sites with high floral diversity. Landscape Ecol. 36, 3231–3247. doi: 10.1007/s10980-021-01304-9
McGrady, C., Strange, J., López-Uribe, M., and Fleischer, S. (2021). Wild bumble bee colony abundance, scaled by field size, predicts pollination services. Ecosphere 12:e03735. doi: 10.1002/ecs2.3735
Meirmans, P. G., Liu, S., and van Tienderen, P. H. (2018). The analysis of polyploid genetic data. J. Heredity 109, 283–296. doi: 10.1093/jhered/esy006
Meloni, M., Reid, A., Caujapé-Castells, J., Marrero, A., Fernández-Palacios, J., Mesa-Coelo, R., et al. (2013). Effects of clonality on the genetic variability of rare, insular species: the case of Ruta microcarpa from the Canary Islands. Ecol. Evol. 3, 1569–1579. doi: 10.1002/ece3.571
Moquet, L., Laurent, E., Bacchetta, R., and Jacquemart, A. L. (2018). Conservation of hoverflies (Diptera, Syrphidae) requires complementary resources at the landscape and local scales. Insect Conservation Diversity 11, 72–87. doi: 10.1111/icad.12245
Mola, J. M., and Williams, N. M. (2019). A review of methods for the study of bumble bee movement. Apidologie 50, 497–514. doi: 10.1007/s13592-019-00662-3
Naaf, T., Feigs, J. T., Huang, S., Brunet, J., Cousins, S. A. O., Decocq, G., et al. (2021). Sensitivity to habitat fragmentation across European landscapes in three temperate forest herbs. Landscape Ecol. 36, 2831–2848. doi: 10.1007/s10980-021-01292-w
Naaf, T., Feigs, J. T., Huang, S., Brunet, J., Cousins, S. A. O., Decocq, G., et al. (2022). Context matters: the landscape matrix determines the population genetic structure of temperate forest herbs across Europe. Landscape Ecol. 37, 1365–1384. doi: 10.1007/s10980-021-01376-7
Ohashi, K., and Thomson, J. D. (2009). Trapline foraging by pollinators: its ontogeny, economics and possible consequences for plants. Ann. Bot. 103, 1365–1378. doi: 10.1093/aob/mcp088
Osborne, J. L., Loxdale, H. D., and Woiwod, I. P. (2002). “Monitoring insect dispersal: methods and approaches. dispersal ecology,” in Proceedings of the the 42nd Symposium of the British Ecological Society held at the University of Reading, (Oxford: Blackwell Publishing).
Paradis, E. (2010). pegas: an R package for population genetics with an integrated–modular approach. Bioinformatics 26, 419–420. doi: 10.1093/bioinformatics/btp696
Persson, A. S., and Smith, H. G. (2011). Bumblebee colonies produce larger foragers in complex landscapes. Basic Appl. Ecol. 12, 695–702. doi: 10.1016/j.baae.2011.10.002
Piessens, K., Honnay, O., and Hermy, M. (2005). The role of fragment area and isolation in the conservation of heathland species. Biol. Conservation 122, 61–69. doi: 10.1016/j.biocon.2004.05.023
Pinheiro, J., Bates, D., DebRoy, S., and Sarkar, D. (2019). R Core Team. (2019). nlme: Linear and Nonlinear Mixed Effects Models. R package version 3.1–140.
Pope, N. S., and Jha, S. (2017). Inferring the foraging ranges of social bees from sibling genotypes sampled across discrete locations. Conservation Genetics 18, 645–658. doi: 10.1007/s10592-017-0941-y
Pope, N. (2020). corMLPE: a Correlation Structure for Symmetric Relational Data. R Package Version 0.0.2.
Proesmans, W., Bonte, D., Smagghe, G., Meeus, I., Decocq, G., Spicher, F., et al. (2019a). Small forest patches as pollinator habitat: oases in an agricultural desert? Landscape Ecol. 34, 487–501. doi: 10.1007/s10980-019-00782-2
Proesmans, W., Bonte, D., Smagghe, G., Meeus, I., and Verheyen, K. (2019b). Importance of forest fragments as pollinator habitat varies with season and guild. Basic Appl. Ecol. 34, 95–107. doi: 10.1016/j.baae.2018.08.004
Pudovkin, A., Zaykin, D., and Hedgecock, D. (1996). On the potential for estimating the effective number of breeders from heterozygote-excess in progeny. Genetics 144, 383–387. doi: 10.1093/genetics/144.1.383
Raine, N. E., and Chittka, L. (2005). Comparison of flower constancy and foraging performance in three bumblebee species (Hymenoptera: Apidae: Bombus). Entomol. Generalis 28:081. doi: 10.1127/entom.gen/28/2005/81
Redhead, J. W., Dreier, S., Bourke, A. F., Heard, M. S., Jordan, W. C., Sumner, S., et al. (2016). Effects of habitat composition and landscape structure on worker foraging distances of five bumble bee species. Ecol. Appl. 26, 726–739. doi: 10.1890/15-0546
Raymond, L., Plantegenest, M., and Vialatte, A. (2013). Migration and dispersal may drive to high genetic variation and significant genetic mixing: the case of two agriculturally important, continental hoverflies (Episyrphus balteatus and Sphaerophoria scripta). Mol. Ecol. 22, 5329–5339. doi: 10.1111/mec.12483
Reichel, K., Masson, J.-P., Malrieu, F., Arnaud-Haond, S., and Stoeckel, S. (2016). Rare sex or out of reach equilibrium? the dynamics of FIS in partially clonal organisms. BMC Genet. 17:1–16. doi: 10.1186/s12863-016-0388-z
Schmidt, T., Arens, P., Smulders, M. J., Billeter, R., Liira, J., Augenstein, I., et al. (2009). Effects of landscape structure on genetic diversity of Geum urbanum L. populations in agricultural landscapes. Flora-Morphol. Distribution Funct. Ecol. Plants 204, 549–559. doi: 10.1016/j.flora.2008.07.005
Skokanová, H., Faltan, V., and Havlícek, M. (2016). Driving forces of main landscape change processes from past 200 years in Central Europe-differences between old democratic and post-socialist countries. Ekológia 35:50. doi: 10.1515/eko-2016-0004
Slatkin, M., and Barton, N. H. (1989). A comparison of three indirect methods for estimating average levels of gene flow. Evolution 43, 1349–1368. doi: 10.1111/j.1558-5646.1989.tb02587.x
Sork, V. L., Nason, J., Campbell, D. R., and Fernandez, J. F. (1999). Landscape approaches to historical and contemporary gene flow in plants. Trends Ecol. Evol. 14, 219–224. doi: 10.1016/S0169-5347(98)01585-7
Speight, M. (2017). Species accounts of European Syrphidae, 2017. Syrph Net Database European Syrphidae (Diptera) 97:294.
Stoeckel, S., Grange, J., Fernández-Manjarres, J. F., Bilger, I., Frascaria-Lacoste, N., Frascacaria-Lacoste, N., et al. (2006). Heterozygote excess in a self-incompatible and partially clonal forest tree species—Prunus avium L. Mol. Ecol. 15, 2109–2118. doi: 10.1111/j.1365-294X.2006.02926.x
Strickmann, M. (2008). Untersuchung zur Bestäubungsbiologie und Samenproduktion an Anemone nemorosa in Brandenburg. Münster: University of Münster.
Svensson, B., Lagerlöf, J., and Svensson, B. G. (2000). Habitat preferences of nest-seeking bumble bees (Hymenoptera: Apidae) in an agricultural landscape. Agriculture Ecosystems Environ. 77, 247–255. doi: 10.1016/S0167-8809(99)00106-1
Torres-Vanegas, F., Hadley, A. S., Kormann, U. G., Jones, F. A., Betts, M. G., and Wagner, H. H. (2019). The landscape genetic signature of pollination by trapliners: evidence from the tropical herb. Heliconia tortuosa. Front. Genetics 10:1206. doi: 10.3389/fgene.2019.01206
Valdés, A., Lenoir, J., De Frenne, P., Andrieu, E., Brunet, J., Chabrerie, O., et al. (2020). High ecosystem service delivery potential of small woodlands in agricultural landscapes. J. Appl. Ecol. 57, 4–16. doi: 10.1111/1365-2664.13537
Van Geert, A., Triest, L., and van Rossum, F. (2014). Does the surrounding matrix influence corridor effectiveness for pollen dispersal in farmland? Perspect. Plant Ecol. Evol. Systematics 16, 180–189. doi: 10.1016/j.ppees.2014.05.004
Van Rossum, F., Echchgadda, G., Szabadi, I., and Triest, L. (2002). Commonness and long-term survival in fragmented habitats: primula elatior as a study case. Conservation Biol. 16, 1286–1295. doi: 10.1046/j.1523-1739.2002.01162.x
Van Rossum, F. (2008). Conservation of long-lived perennial forest herbs in an urban context: primula elatior as study case. Conservation Genetics 9, 119–128. doi: 10.1007/s10592-007-9314-2
Van Rossum, F. (2009). Pollen dispersal and genetic variation in an early-successional forest herb in a peri-urban forest. Plant Biol. 11, 725–737. doi: 10.1111/j.1438-8677.2008.00176.x
Varvio, S.-L., Chakraborty, R., and Nei, M. (1986). Genetic variation in subdivided populations and conservation genetics. Heredity 57, 189–198. doi: 10.1038/hdy.1986.109
Vellend, M. (2004). Parallel effects of land-use history on species diversity and genetic diversity of forest herbs. Ecology 85, 3043–3055. doi: 10.1890/04-0435
von Hagen, E., and Aichhorn, A. (2003). Hummeln Bestimmen, Ansiedeln, Vermehren, Schützen. Nottuln: Fauna Verlag.
Waits, L. P., and Storfer, A. (2016). “Basics of population genetics: quantifying neutral and adaptive genetic variation for landscape genetic studies,” in Landscape Genetics: Concepts, Methods, Applications, eds N. Balkenhol, S. A. Cushman, A. T. Storfer and L. P. Waits (West Sussex: John Wiley & Sons). doi: 10.1002/9781118525258.ch03
Westphal, C., Steffan-Dewenter, I., and Tscharntke, T. (2006). Bumblebees experience landscapes at different spatial scales: possible implications for coexistence. Oecologia 149, 289–300. doi: 10.1007/s00442-006-0448-6
Whigham, D. F. (2004). Ecology of woodland herbs in temperate deciduous forests. Ann. Rev. Ecol. Evol. Systematics 35, 583–621. doi: 10.1146/annurev.ecolsys.35.021103.105708
Wilcock, C., and Neiland, R. (2002). Pollination failure in plants: why it happens and when it matters. Trends Plant Sci. 7, 270–277. doi: 10.1016/S1360-1385(02)02258-6
Woodard, S. H., Lozier, J. D., Goulson, D., Williams, P. H., Strange, J. P., and Jha, S. (2015). Molecular tools and bumble bees: revealing hidden details of ecology and evolution in a model system. Mol. Ecol. 24, 2916–2936. doi: 10.1111/mec.13198
Keywords: colony, genetic linker, habitat fragmentation, heterozygote excess, SSR, mobility, movement indicators, plant-pollinator interaction
Citation: Feigs JT, Holzhauer SIJ, Huang S, Brunet J, Diekmann M, Hedwall P-O, Kramp K and Naaf T (2022) Pollinator movement activity influences genetic diversity and differentiation of spatially isolated populations of clonal forest herbs. Front. Ecol. Evol. 10:908258. doi: 10.3389/fevo.2022.908258
Received: 30 March 2022; Accepted: 25 July 2022;
Published: 26 September 2022.
Edited by:
Robert B. Page, Texas A&M University-San Antonio, United StatesReviewed by:
Mariano Ordano, Fundación Miguel Lillo, ArgentinaLudwig Triest, Vrije University Brussel, Belgium
Copyright © 2022 Feigs, Holzhauer, Huang, Brunet, Diekmann, Hedwall, Kramp and Naaf. This is an open-access article distributed under the terms of the Creative Commons Attribution License (CC BY). The use, distribution or reproduction in other forums is permitted, provided the original author(s) and the copyright owner(s) are credited and that the original publication in this journal is cited, in accordance with accepted academic practice. No use, distribution or reproduction is permitted which does not comply with these terms.
*Correspondence: Jannis Till Feigs, SmFubmlzX1RpbGwuRmVpZ3NAemFsZi5kZQ==