 Jaime Martínez-Harms1*
 Pablo C. Guerrero2,3,4
 María José Martínez-Harms3,5
 Nicolás Poblete1
 Katalina González1
 Doekele G. Stavenga6
 Misha Vorobyev7
- 1Instituto de Investigaciones Agropecuarias, INIA-La Cruz, La Cruz, Chile
- 2Departamento de Botánica, Facultad de Ciencias Naturales y Oceanográficas, Universidad de Concepción, Concepción, Chile
- 3Institute of Ecology and Biodiversity (IEB), Concepción, Chile
- 4Millennium Institute Biodiversity of Antarctic and Subantarctic Ecosystems (BASE), Santiago, Chile
- 5Millennium Institute in Coastal Socio-Ecology, Pontificia Universidad Católica de Chile, Santiago, Chile
- 6Groningen Institute for Evolutionary Life Sciences, University of Groningen, Groningen, Netherlands
- 7Department of Optometry and Vision Science, University of Auckland, Auckland, New Zealand
The Atacama Desert, one of the driest places on earth, holds a rich biodiversity that becomes most appreciable in years when unusual rainfall accumulation triggers a phenomenon of explosive development of ephemeral herbaceous and woody desert species known as “desierto florido” or “blooming desert.” Despite the scientific importance of this unique phenomenon only few studies have addressed the mechanisms of flower phenotypic divergence under the fluctuating environment provided by this recurrent event. We investigated the mechanisms of floral color diversity in Cistanthe longiscapa (Montiaceae), a dominant species across the ephemeral blooming landscape of Atacama Desert. Our analyses show that the variation in colors of C. longiscapa flowers result from petals containing betalain pigments with different absorption spectra. The different pigment composition of petals causes flower color differences in the visible and ultraviolet (UV) range of the spectrum. Through color vision models we show that C. longiscapa flowers are highly polymorphic in their color appearance for insect pollinators. Our results highlight the variable nature in flower color of C. longiscapa varieties blooming simultaneously in a geographical restricted area. Given the importance of color in attracting floral visitors, the observed color variability could contribute to increased cross pollination in extreme desert conditions, while accounting for complex and fluctuating histories of plant-pollinator interactions.
Introduction
The Atacama Desert, one of the driest places on earth, stretches along the western border of South America from coastal regions between 18 and 30°S up to 5,000 m (Arroyo et al., 1988; Schulz et al., 2012). Arid (precipitation of ≤50 mm/y) and hyperarid climates (≤ 5 mm/y) can be recognized within this region, which in spite of its persistent aridity, undergoes pronounced rainfall fluctuations at interannual and interdecadal time scales. While interannual rainfall variability seems to be modulated to a large extent by El Niño-Southern Oscillation (ENSO), the pronounced low frequency changes during the past century, characterized by the occurrence of ‘humid’ (1920–1945; 1976–2002) and extremely dry (around 1910 and 1945–1975) periods, appears to be linked to large-scale climatic fluctuations in the Pacific region associated with the Interdecadal Pacific Oscillation (IPO) (Schulz et al., 2012). Rainfall fluctuations are directly associated with changes in the abundance of plants and animals, with intensive rainfall events inducing drastic changes in the desert landscape.
Despite representing one of the harshest environments of the planet, there is a rich biodiversity of plants and animals adapted to the unique extreme conditions of the Atacama Desert (Rundel et al., 1991). The colonization of the Atacama Desert by some plants and animals required a long lag time, occurring much later than the formations of its arid climates (Guerrero et al., 2013). In line with this, the evolution in some clades inhabiting this region seems to have occurred relatively recently (Guerrero et al., 2013). The highly diverse biota of the Atacama Desert becomes most appreciable in years when unusual accumulation of precipitation induces an explosive development of ephemeral herbaceous and woody desert species (Armesto et al., 1993; Vidiella et al., 1999; Jaksic, 2001). During these events, known as “desierto florido” or “blooming desert,” different annual and geophyte species share dominance in a sequential appearance, triggering outbreaks of insects and vertebrates associated with these ecosystems (Vidiella et al., 1999; Chávez et al., 2019). Despite its scientific importance, little is known about the eco-evolutionary processes triggered by this unique phenomenon. For instance, plants native to this ecosystem have evolved traits associated not only with unpredictable dynamics of rainfall tolerance, but also traits to ensure pollination during short but massive blooming in the Desert (González and Pérez, 2010). Most of our current understanding of flower signals arises from non-arid biomes, while studies on the mechanisms underlying floral diversification and plant-pollinator interactions under such extreme environments are still scarce (Trunschke et al., 2021).
Variability in floral traits represents an essential condition to induce processes of floral isolation mediated by pollinators (Johnson, 2010). Pollinators rely on attributes such as color, shape and floral volatiles to detect and discriminate between flowers (Hirota et al., 2012; Reverté et al., 2016; Martínez-Harms et al., 2018). Variations in floral attributes can cause pollinators to behave selectively toward floral variants (Vickery, 1992; Salzmann and Schiestl, 2007; Dormont et al., 2014), inducing processes of floral isolation (“ethological isolation” sensu Grant, 1949) that can contribute to the formation and maintenance of reproductive barriers to hybridization. Variations in floral traits are common between species and can also occur naturally within species or as the result of hybridization events (Ippolito et al., 2004; Martínez-Harms et al., 2018, 2020). The eco-evolutionary mechanisms contributing to maintain intra-specific variations in floral attributes include processes such as selection by biotic and abiotic factors and non-adaptive processes such as equilibrium between gene flow and drift (reviewed in Narbona et al., 2018; Sapir et al., 2021). On the other hand, hybridization is considered a major source of genetic diversity, promoting phenotypic variability in plants (Goulet et al., 2017). Under such scenarios, pollinators can mediate processes of floral isolation that can lead to divergence in floral traits and the formation of new races or species. Understanding the mechanisms by which variations in floral characters arise and their consequences on floral visitors can provide valuable insights about the evolutionary processes derived from plant-pollinator interactions.
Previous studies have shown that differences in floral color can induce pollinators to behave selectively toward certain flowers (Vickery, 1992; Schemske and Bradshaw, 1999; Hirota et al., 2012). Flower color involves two optical phenomena: (i) the reflection and scattering of light by floral structures, and (ii) wavelength-selective absorption by floral pigments (Kay et al., 1981; Lee, 2007; Vignolini et al., 2012; Stavenga and van der Kooi, 2016; van der Kooi et al., 2017; Wilts et al., 2018). Although much remains to be studied about the optical properties of flowers, we know that due to the different refractive indices of the petals’ cellular components, incident light is reflected and scattered (Vignolini et al., 2012; Stavenga and van der Kooi, 2016; van der Kooi et al., 2017; Wilts et al., 2018). Pigments, on the other hand, have been extensively characterized with respect to their spectral properties, biosynthesis and biological functions. Pigments accumulate and localize at different subcellular compartments of floral tissue, reducing light scattering and providing specific hue depending on their absorption spectrum (Exner and Exner, 1910; Kugler, 1963; Kay et al., 1981; Stavenga and van der Kooi, 2016). Therefore, variations in flower color can result from differences in the structure of flowers, differences in the floral content of pigments or a combined effect of the two phenomena.
Here we investigate the mechanisms of flower coloring of Cistanthe longiscapa (Barnéoud) Carolin ex M.A.Hershkovitz (Montiaceae), a dominant species across the ephemeral blooming landscape at the hyperarid Atacama Desert. A massive blooming of this species took place near the city of Caldera, Chile, during September-October 2021 (Figures 1A,B), that consisted of two distinctive large patches dominated by purple and yellow flower color forms of C. longiscapa (Figure 1C). The flowering event called the attention of the general public all over the world and was widely reported in social media (France24, 2021; Reuters, 2021).
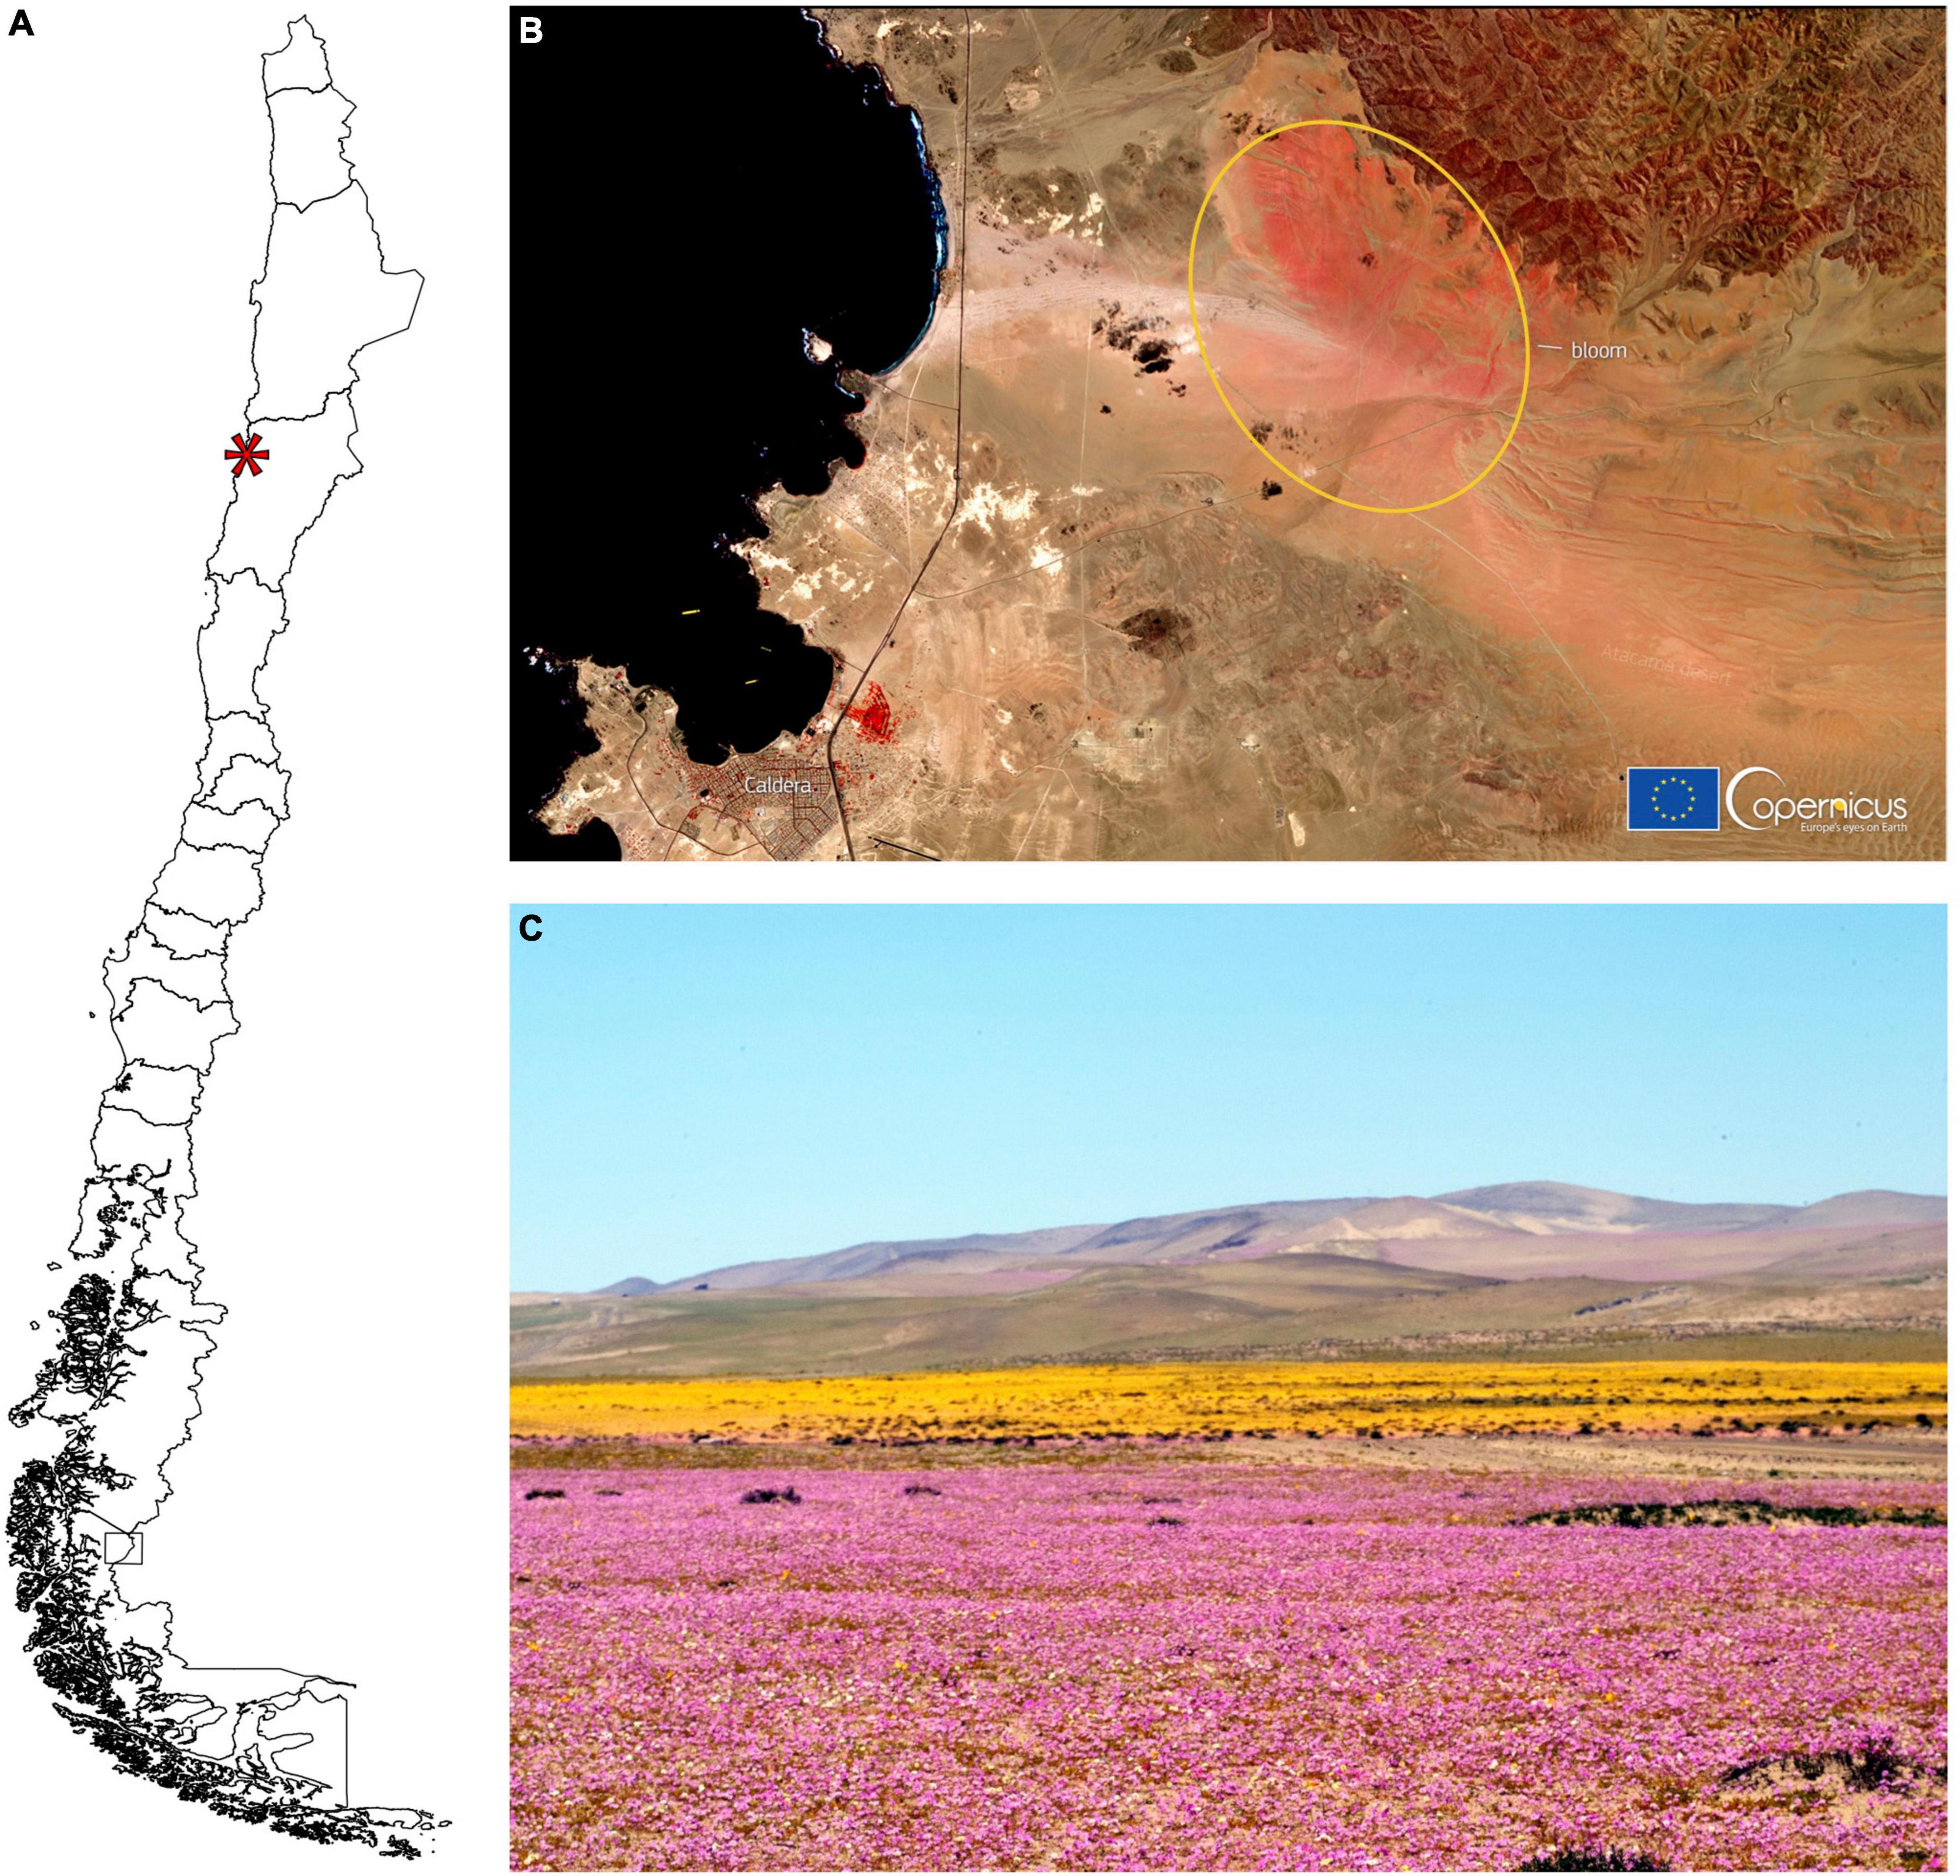
Figure 1. Blooming in the Atacama Desert. (A) Map of Chile indicating with an asterisk the location of where the studied blooming event took place. (B) Copernicus satellite image from 13th October 2021 of the desert near the city Caldera (lower left) and the area with the abundant flower bloom (yellow ellipse) (Credit: European Union, Copernicus Sentinel-2 imagery). (C) Photograph of the area showing the dominant purple and yellow flower colors of Cistanthe longiscapa (photo by J. Martínez-Harms).
It is important to note that the yellow flower variant was initially described as Calandrinia litoralis Phil (Philippi, 1860) and was later synonymized with C. longiscapa based on herbarium material (Hershkovitz, 1991). In the areas where patches of yellow and purple flowers were close to each other reddish, pinkish and whitish flowers could be found in more abundance (Figures 2A–H, 4 and Supplementary Figure 1), floral variants that could have resulted from the cross pollination of the dominant varieties, could be found in more abundance than elsewhere (Figures 2A–H, 4 and Supplementary Figure 1). We extensively analyzed flower coloring with respect to: (i) their diversity; (ii) the mechanisms underlying color differences; and (iii) the implications of color diversity on the way flowers are perceived by pollinators. As a representative pollinator we consider the honeybee (Apis mellifera), an insect whose vision has been investigated in detail (Vorobyev and de Ibarra, 2012). Since the set of photoreceptors of most hymenopterans evaluated so far are similar to that of Apis mellifera (Peitsch et al., 1992), our analysis can be extended to other hymenopterans, which represents a guild of pollinators that have been observed visiting flowers of C. longiscapa (Supplementary Figure 2). We discuss our findings in the context of the ecological and evolutionary consequences of species inhabiting one of the driest places on earth.
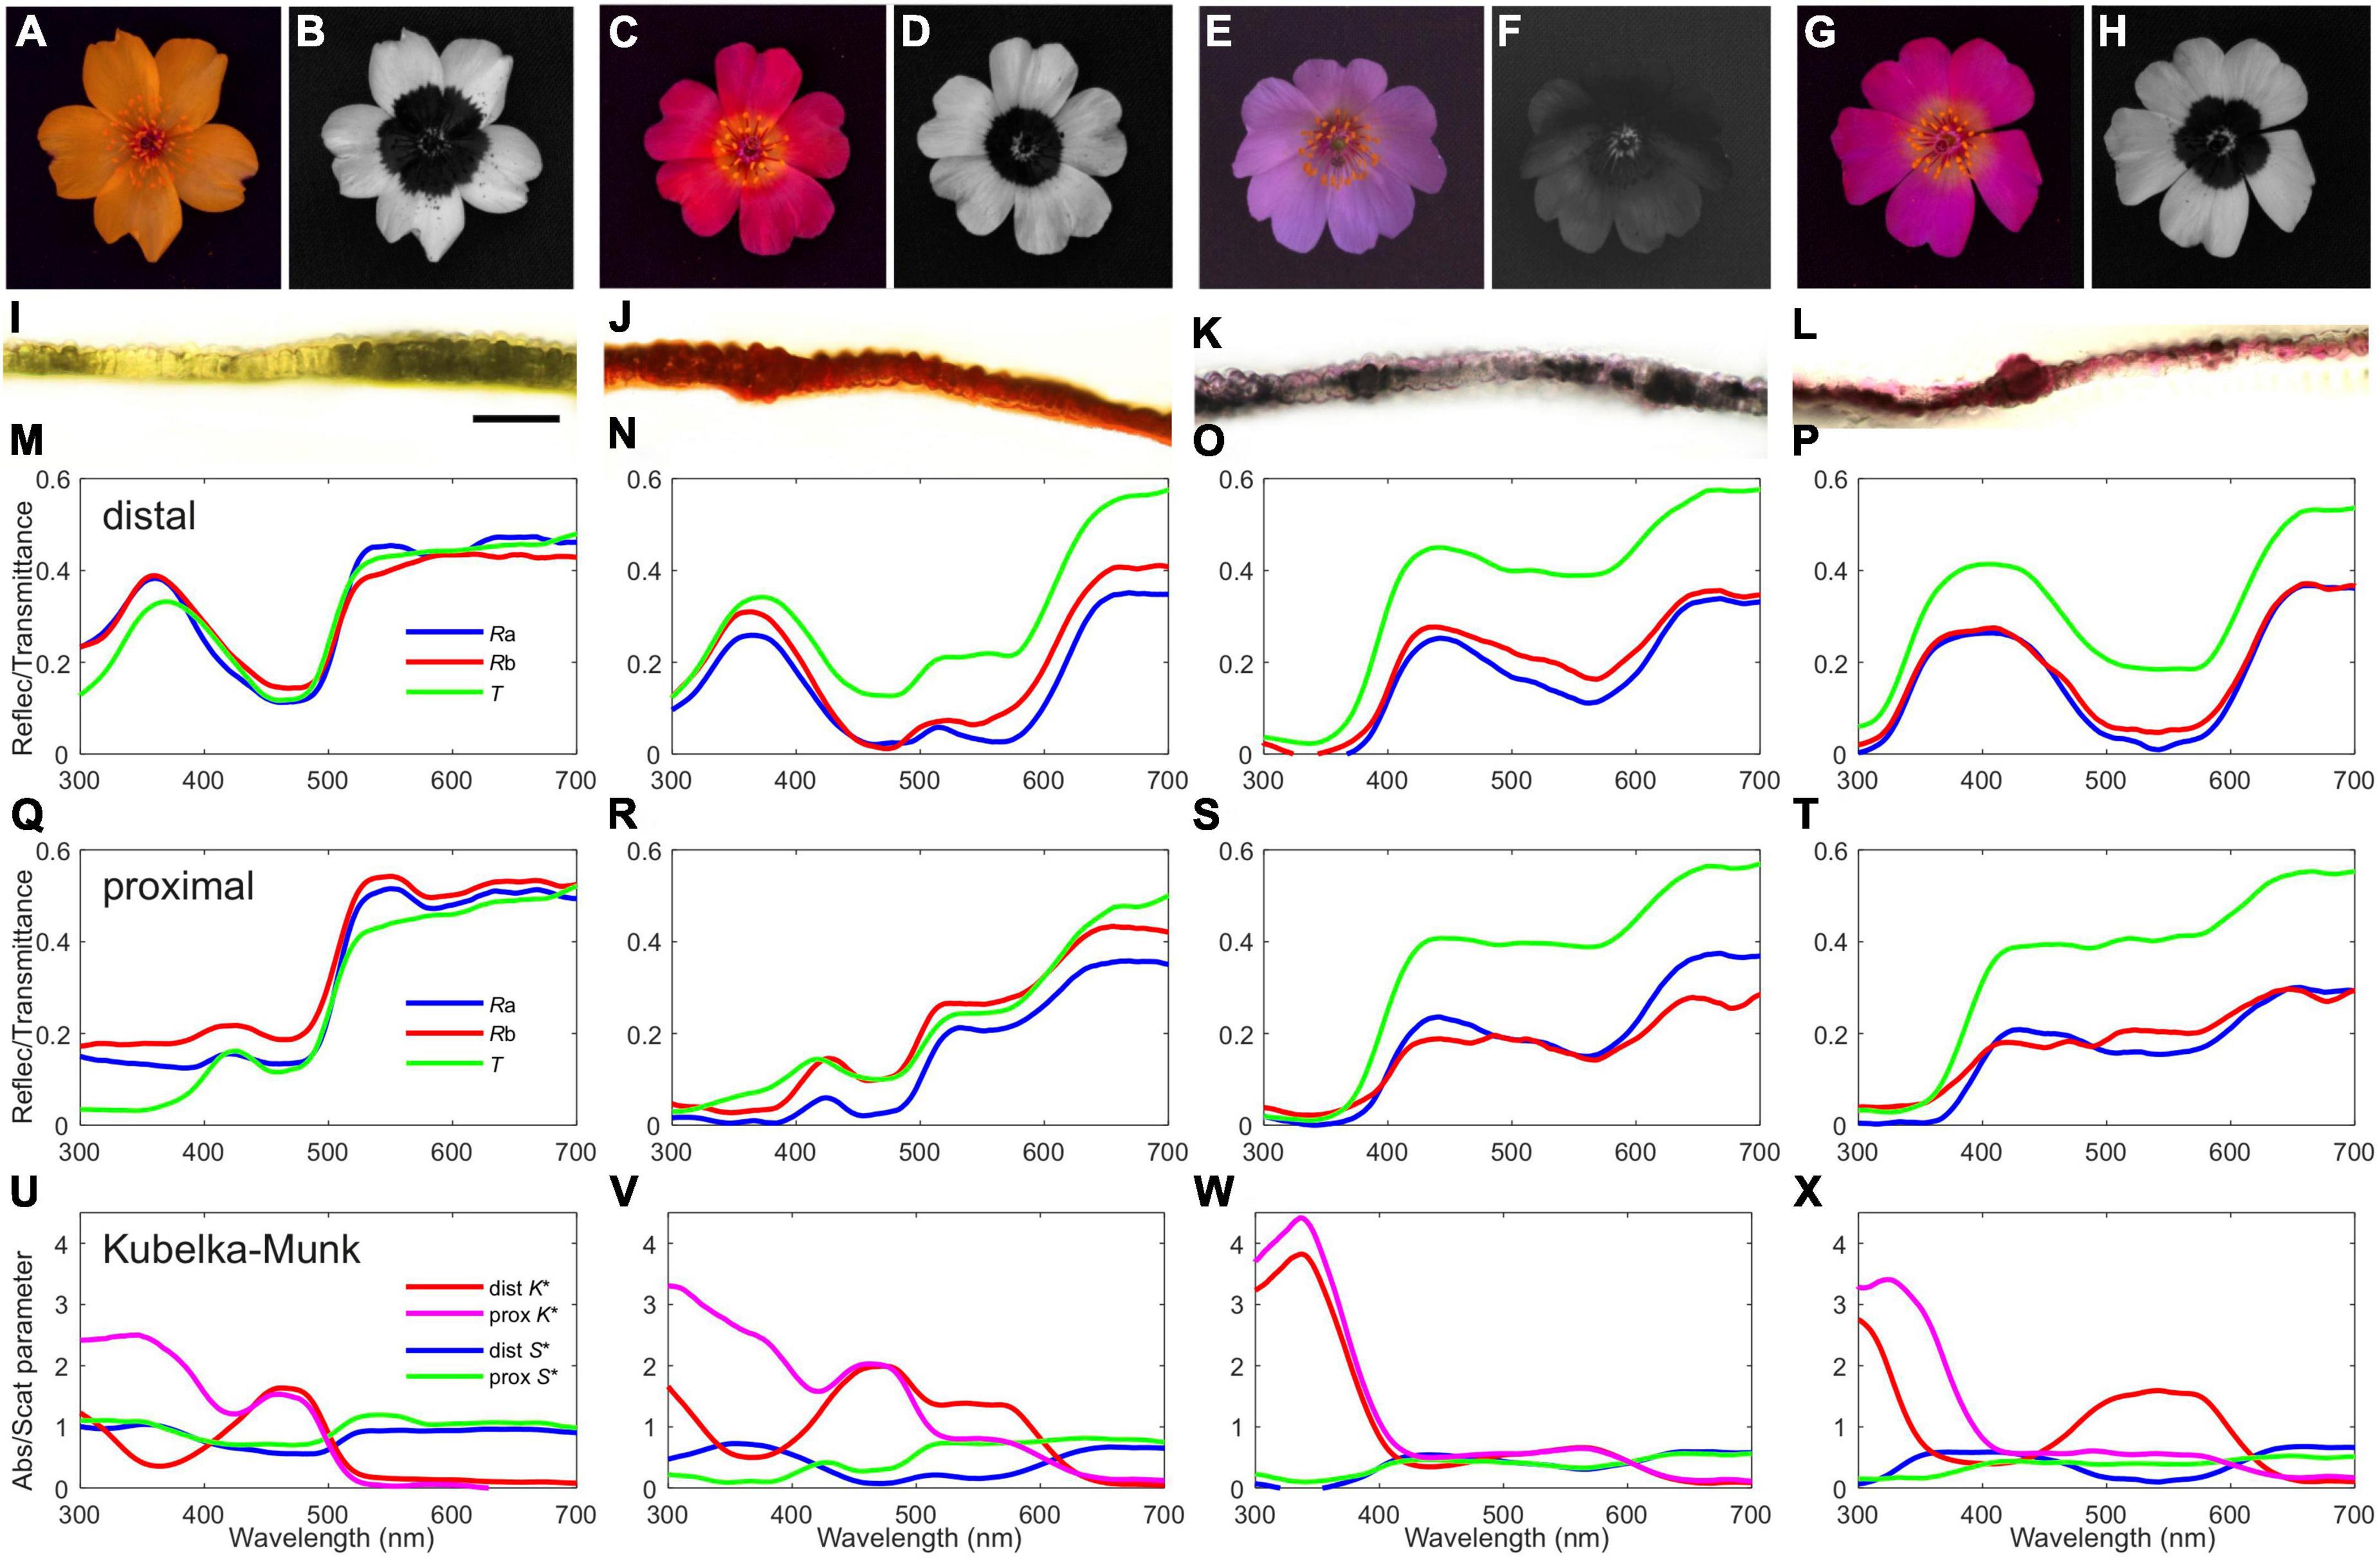
Figure 2. Variously colored Cistanthe longiscapa flowers, petal anatomy and spectral characteristics. (A, C, E, G) RGB photographs. (B, D, F, H) UV photographs. (I–L) Transversal sections of the petals of the respective flowers above (scale bar, in I, 100 μm). (M–P and Q–T) Reflectance (R) and transmittance (T) spectra measured with an integrating sphere from distal and proximal petal areas, respectively; Ra – adaxial, Rb – abaxial. (U–X) Absorption (K*) and scattering (S*) parameters calculated with a Kubelka-Munk procedure; dist – distal, prox – proximal.
Materials and methods
Plant material
Plant material was collected in the field and kept fresh until measurements and histological procedures were carried out. The flowers of C. longiscapa were studied at the peak of the flowering season in October 2021 in a location near the city of Caldera (−27.0667°S; −70.8178°W), where a massive flowering event of this species took place (Figure 1).
Photographic characterization of ultraviolet-patterns
A digital camera modified for increased ultraviolet (UV) sensitivity (EOS 10D, Canon USA Inc., Lake Success, NY, USA) equipped with a quartz lens (105 mm, UV-Nikkor, Nikon, Tokyo, Japan) was used to take images of flowers. For UV exposures, a narrow band-pass filter was used (Baader U-Venus-Filter, Baader Planetarium, Mammendorf, Germany), which consists of a Schott UG11 substrate with dielectric coating that blocks wavelengths in the visible and infrared range while transmitting between 320 and 380 nm with a half-band-width of 60 nm. For exposures in the visible spectrum, we used a bandpass filter that transmits light between 400 and 700 nm.
Anatomical study
To investigate petal structures, petal thickness and pigment distribution in flowers, cross sections of fresh plant material were examined. In order to provide mechanical support to floral components, petal pieces were embedded in a 10% agarose solution close to its solidification temperature (approximately 55°C). The agarose-embedded petal pieces were cut with a razor blade and the sections were observed and photographed under a microscope (Zeiss, Axioskop) (Stavenga and van der Kooi, 2016; van der Kooi and Stavenga, 2019).
Spectrophotometry
Reflectance and transmittance spectra of flowers were measured using an integrating sphere (Avantes Avasphere-50-REFL). For the reflectance measurements, petal pieces were illuminated from within the sphere by positioning them at the aperture of the integrating sphere and illuminating them with an optical fiber connected to a deuterium-halogen lamp (Avantes AvaLight-DH-S). The reflected light was collected by a second optical fiber connected to a spectrometer (Avantes Avaspec-ULS2048CL-EVO). Reflectance spectra of both the adaxial (Ra) and the abaxial (Rb) side were measured. For the transmittance measurements, petal pieces were illuminated from outside the sphere by an optical fiber connected to the deuterium-halogen lamp. Furthermore, in a survey of 110 flowers, reflectance spectra of petals were measured with a setup where an optical fiber connected to the deuterium-halogen lamp was used to illuminate patches of petals, while a second optic fiber connected to another spectrometer (Ocean Optics USD2000, Dunedin, FL, USA) collected the light reflected by the petal. The spectrometers were calibrated using a white reference standard (Avantes WS-2).
Kubelka-Munk analysis of the absorption and scattering characteristics of the flowers
The reflectance and transmittance of a flower petal depend on its structural components and their absorption and reflection/scattering characteristics. If the flower can be considered to consist of a stack of layers with specific absorption and scattering parameters for each layer, the stack transfer matrix is defined by (Stavenga and van der Kooi, 2016):
with T the transmittance and Ra and Rb the adaxial and abaxial reflectance, respectively. Here we treat the Cistanthe petals as a single layer with equal reflectances for illumination from above and below, Ra = Rb = R. The petal’s scattering parameter S* then follows from
with
and the absorption parameter then is
The scattering and absorption coefficient, i.e., the scattering and absorption per unit length of the petal medium, follow with the petal thickness, d: S = S*/d and K = K*/d (Stavenga and van der Kooi, 2016).
Plotting loci of flowers in insect color space
Flower colors were plotted in a chromaticity diagram using the receptor noise limited (RNL) color opponent model, which is one of several diagrams used for displaying colors, most notably the Maxwell triangle (Neumeyer, 1980), the COC model (Backhaus, 1991), the color hexagon (Chittka, 1992) and several other models based on behavioral results of von Helversen (1972) (Brandt and Vorobyev, 1997; Vorobyev and Brandt, 1997; Garcia et al., 2017). According to the RNL model, colors can be depicted as points in a chromaticity diagram where the discriminability between colors is given by the Euclidean distance between points (Figure 3D). The greater the distance, the more reliable is the discrimination (Vorobyev and Osorio, 1998; Vorobyev et al., 2001a). This model has been used to describe color discrimination in the honeybee (Vorobyev and Osorio, 1998; Vorobyev et al., 2001a) and in a number of other animals (Goldsmith and Butler, 2003; Koshitaka et al., 2008; Lind et al., 2013). It is important to note that the RNL model predicts the lower limit for discrimination threshold that is set by the noise, which is achieved only after intensive training under controlled laboratory conditions. In more naturalistic conditions, color discrimination may significantly deviate from the predictions of the RNL model because the behavior of animals depend, among other factors, on their previous experience, physiological state or the amount and type of reinforcement associated with stimuli (e.g., Giurfa, 2004; Avarguès-Weber et al., 2010; Reser et al., 2012; Avarguès-Weber and Giurfa, 2014; Martínez-Harms et al., 2014; Sommerlandt et al., 2016). Furthermore, the RNL model would often predict discrimination between the natural variability of the same flower type, indicating the need of behavioral validation of such predictions (Dyer et al., 2012; Garcia et al., 2018). For details of modeling see Supplementary materials. The analyses were performed using the PAVO package (Maia et al., 2019).
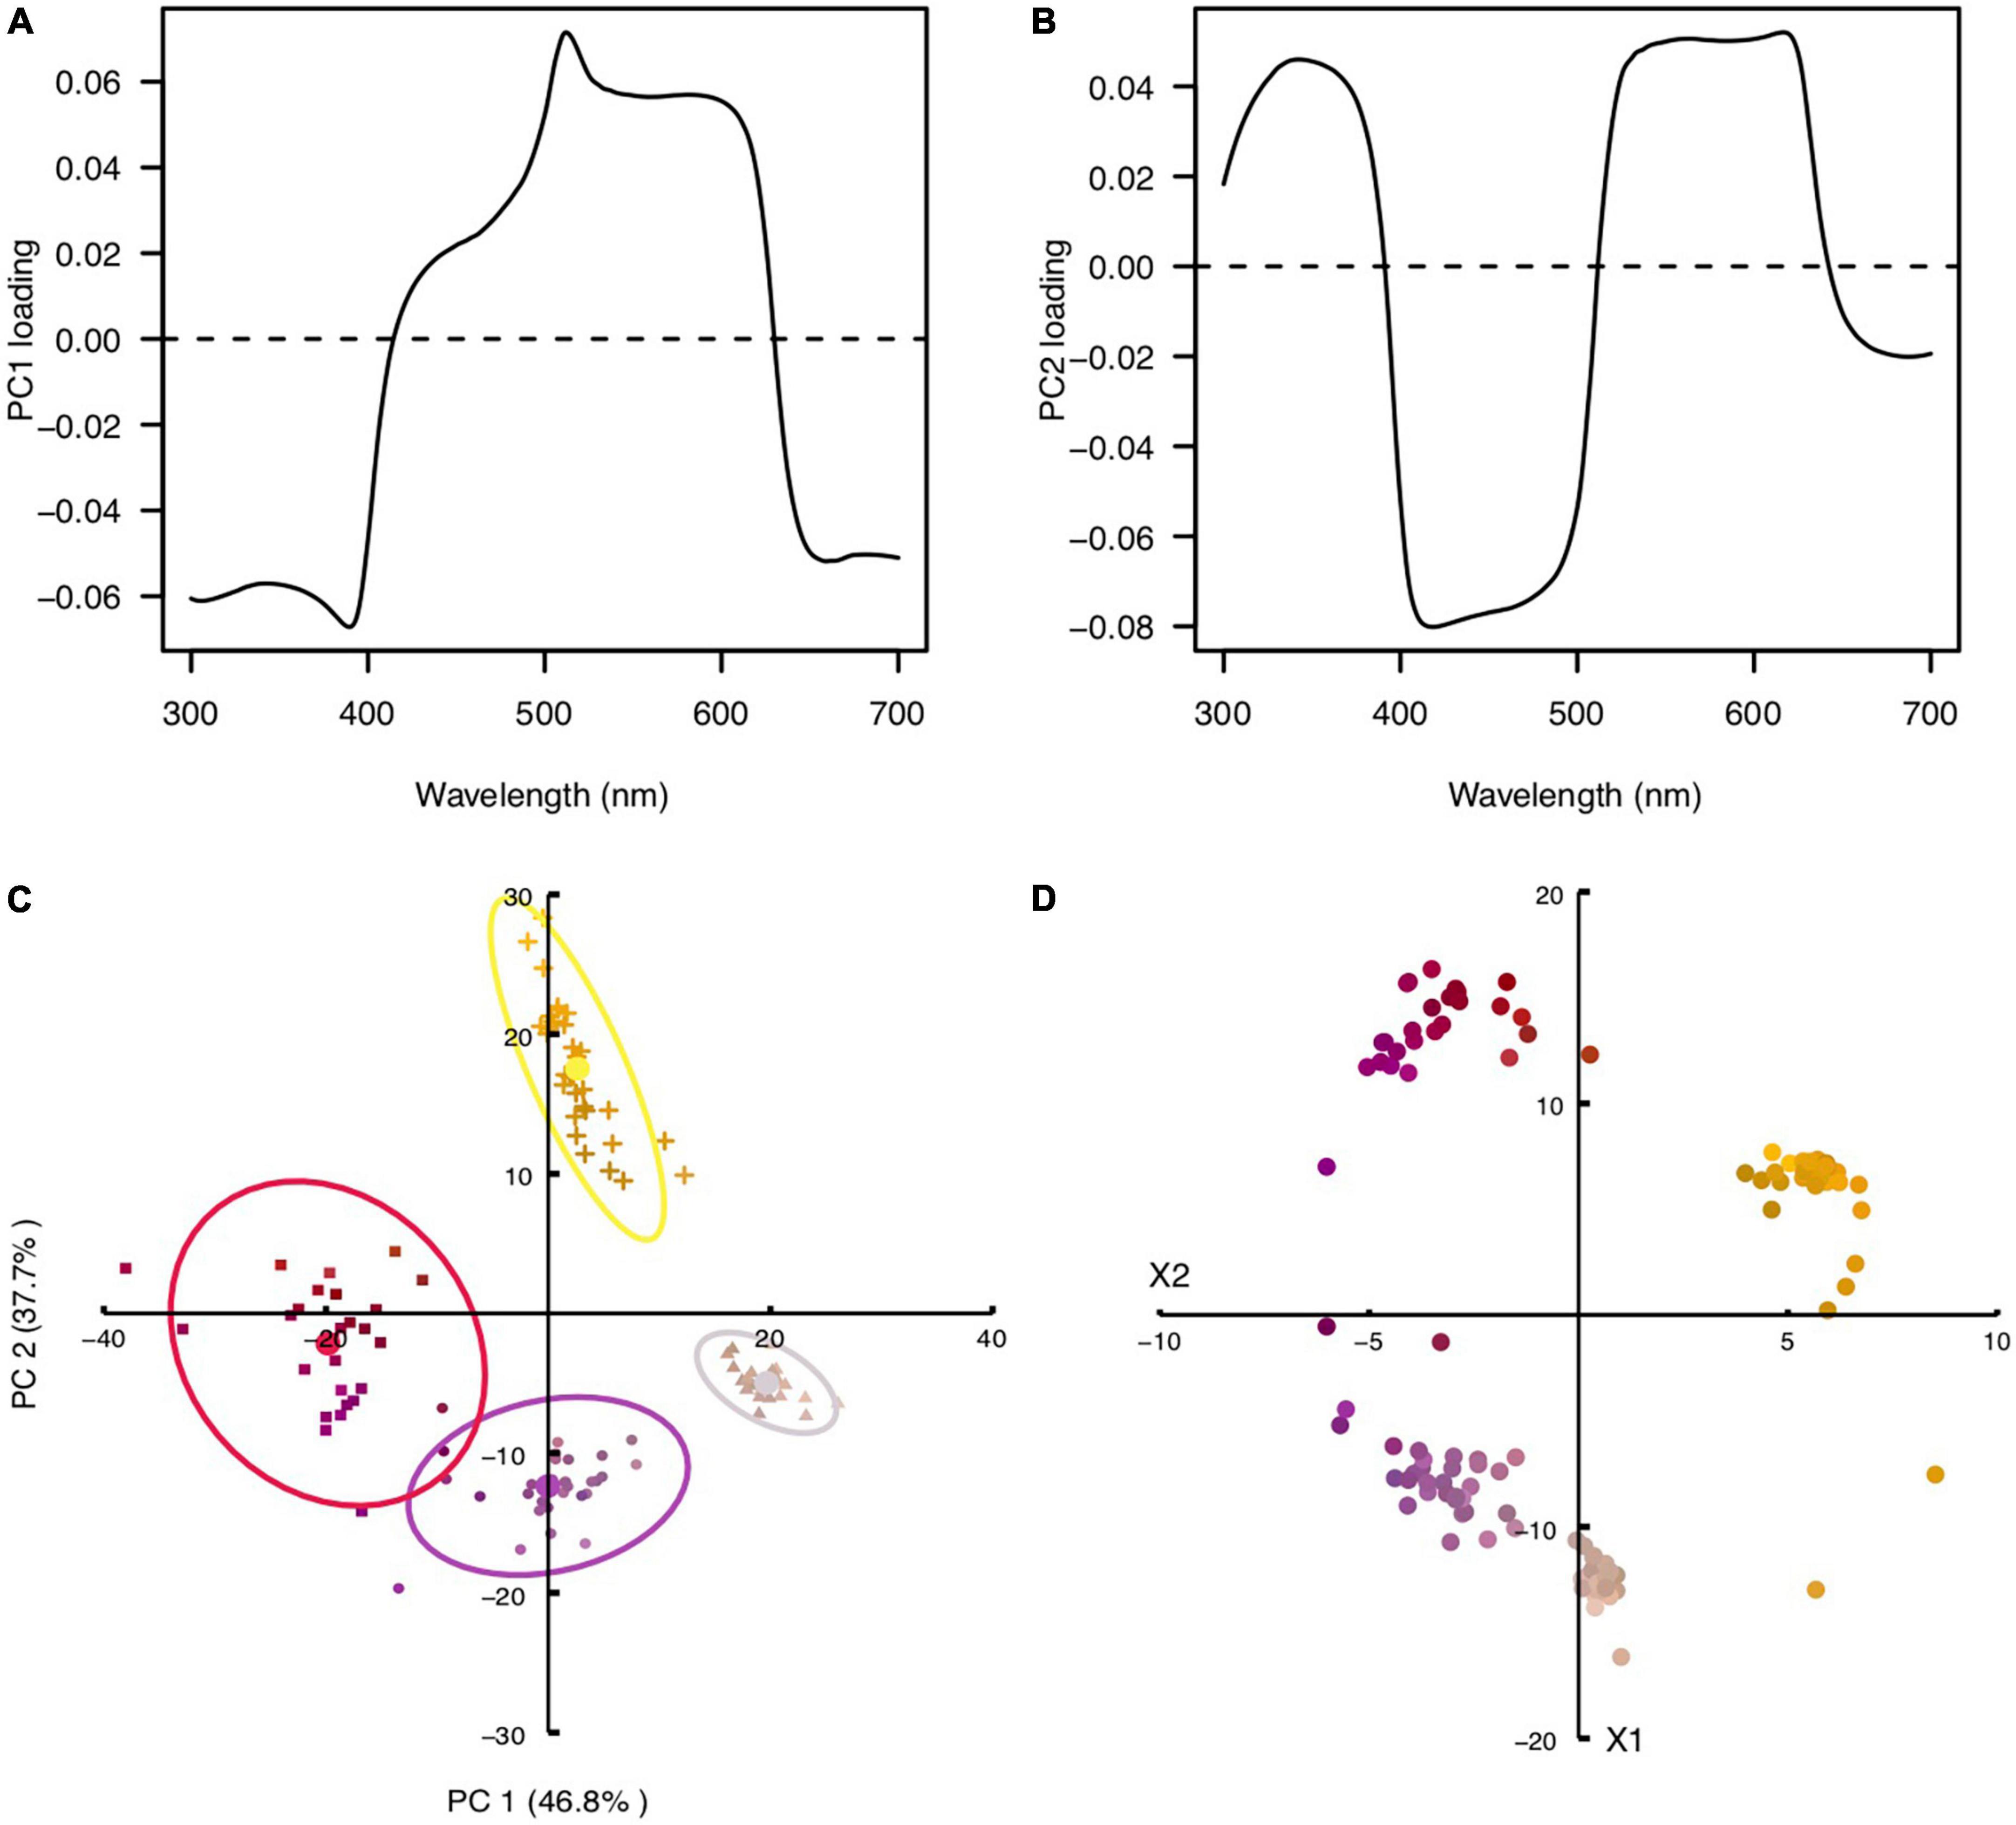
Figure 3. Principal component and chromaticity analysis of Cistanthe longiscapa flowers. (A) Principal component 1 as a function of wavelength, which accounted for 47% of the total variance in flower color. (B) Principal component 2 as a function of wavelength, which accounted for 38% of the total variance in flower color. (C) Clusters of flowers in the PCA diagram. (D) Clusters of flowers in the chromaticity diagram. The colors of the symbols in (C, D) resemble the colors of the flowers as seen by humans.
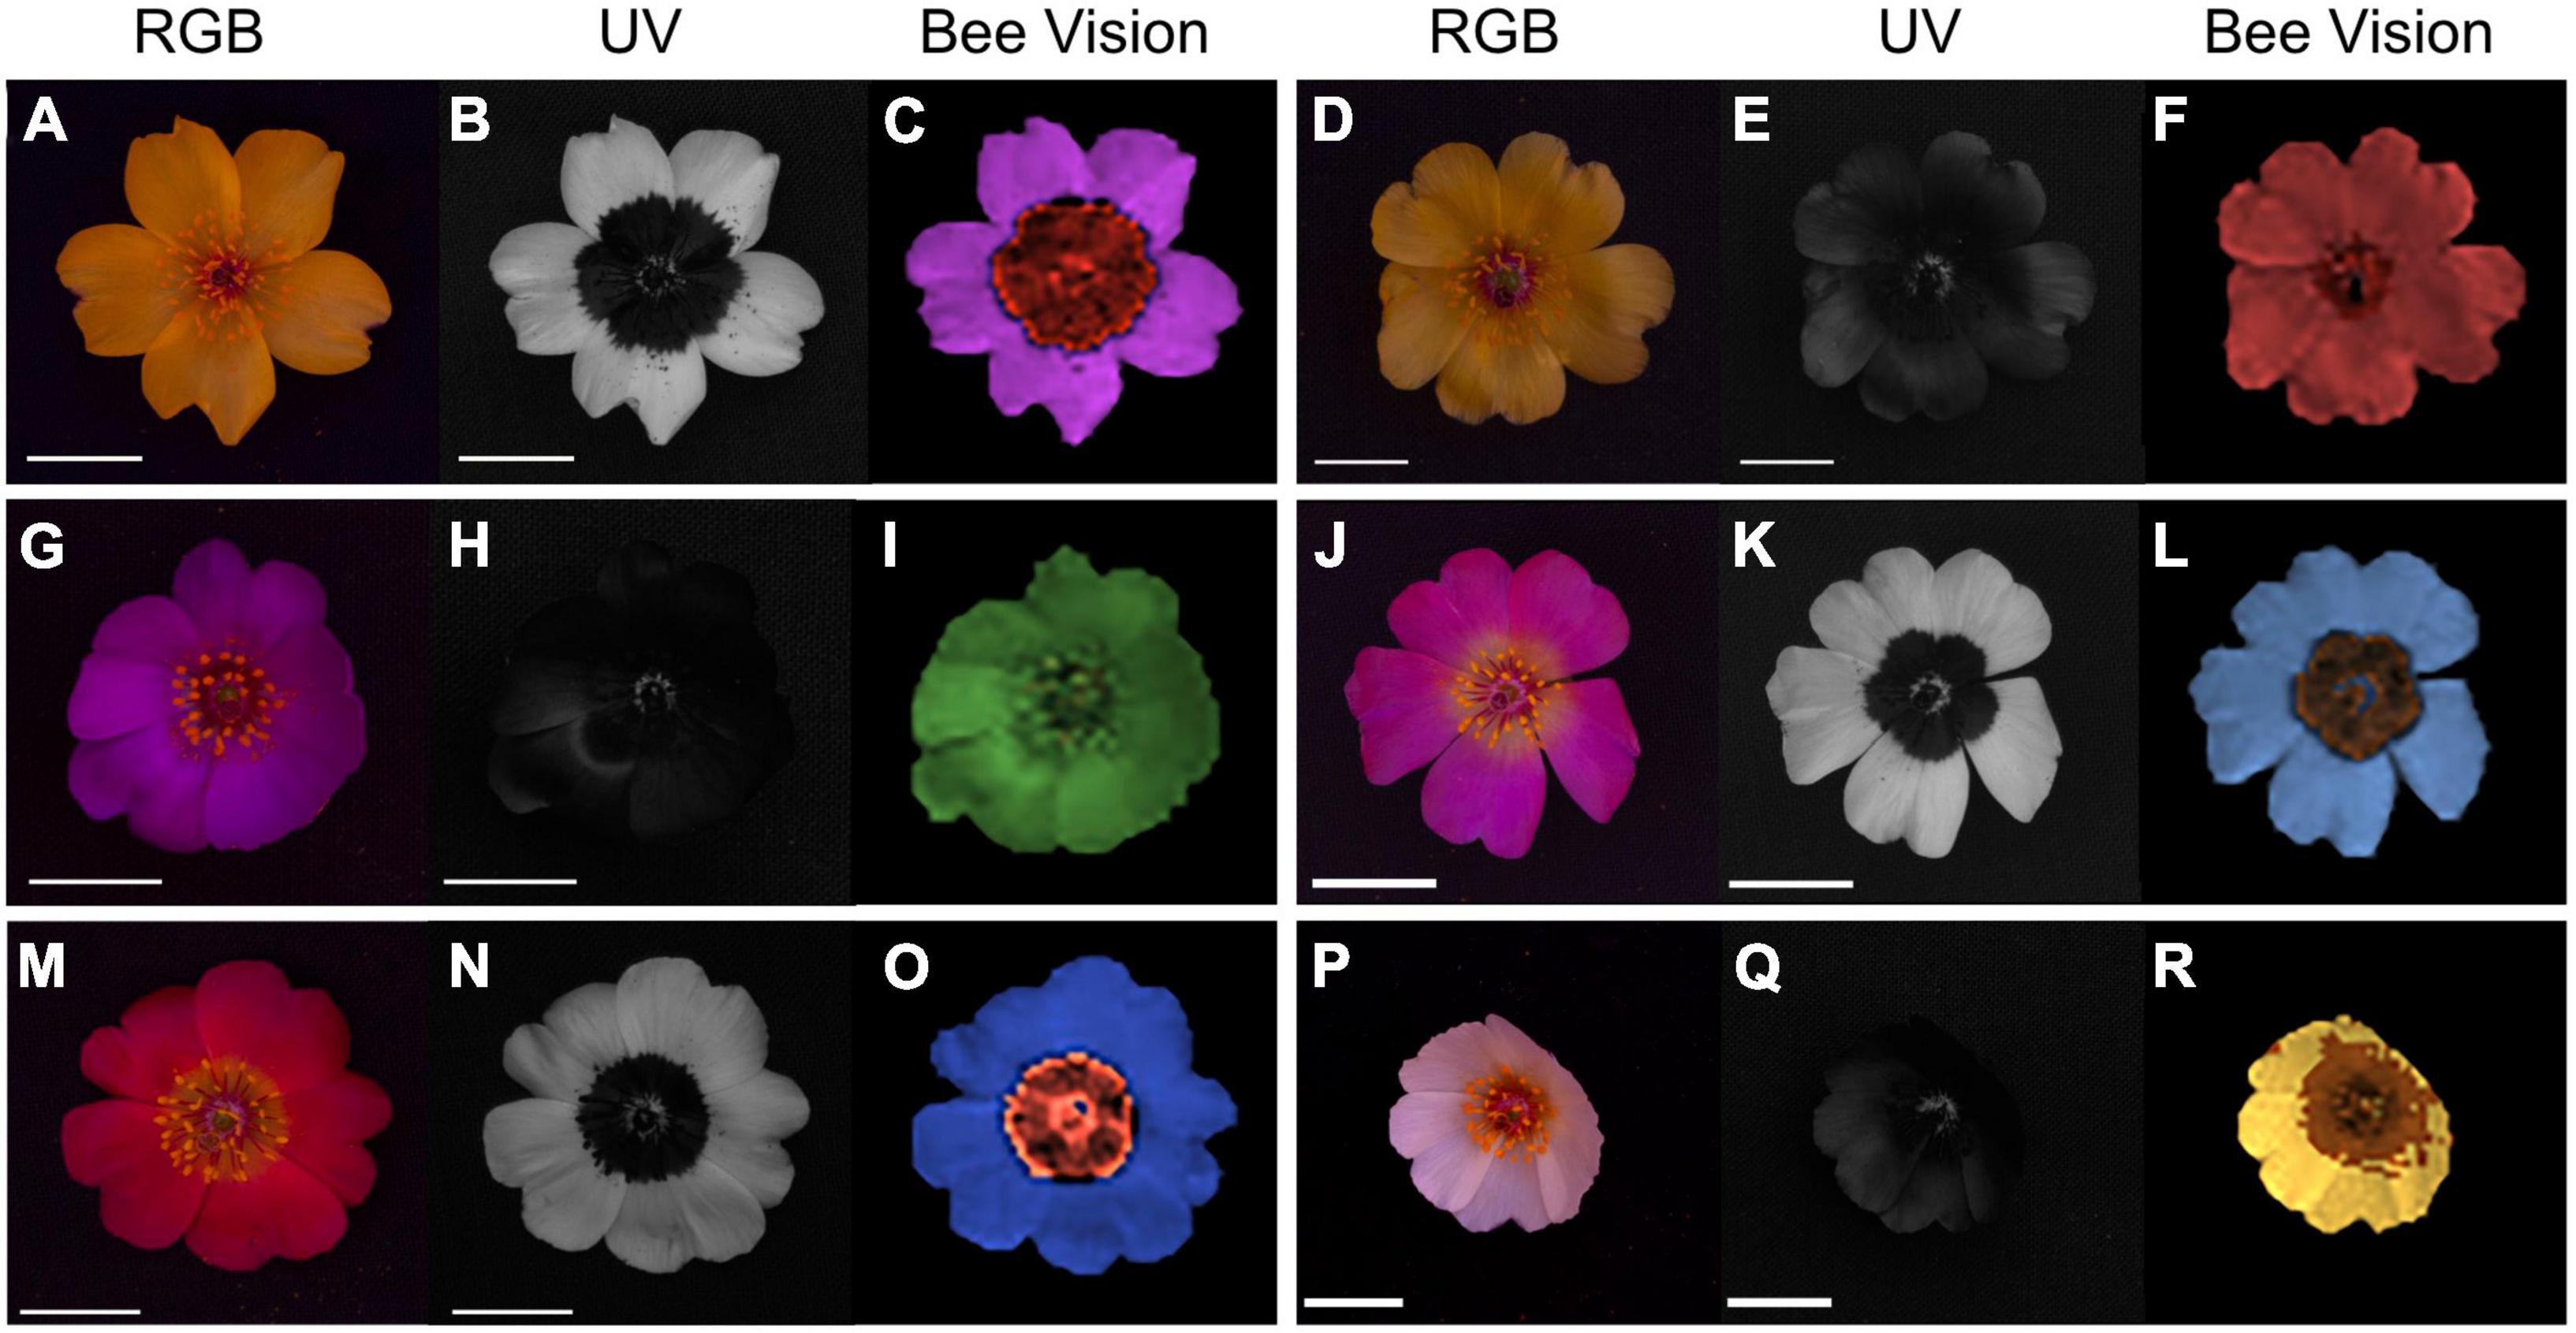
Figure 4. Color varieties of Cistanthe longiscapa flowers shown in RGB (A,D,G,J,M,P), and UV photographs (B,E,H,K,N,Q) and images represented as they would be seen through the eyes of honeybees (C,F,I,L,O,R).
To describe the difference between flowers belonging to different groups, we used the Fisher Discriminant Analysis (Fisher, 1936). This method finds a direction in a multidimensional space that provides a best separation between the groups. The best separation is postulated to correspond to the maximum of the signal-to noise ratio, which is defined as the square root of the squared difference between the groups to their variance. This maximal signal-to noise ratio can be considered as a distance between clusters. Let μ1 and μ2 be the vector means of the two sets of multidimensional data, and Σ1 and Σ2 be the covariance matrices of these data, then the maximal separation is achieved along the direction (Σ1+Σ2)−1 (μ1 + μ2). The ratio of the square of the difference between the means to the variance along this direction is given by:
Note that the derivation of Eq. (3) is neither based on the assumption of normality of the distributions nor on the assumption of equality of variances of the groups (both these assumptions are used in a conventional linear discriminant analysis).
Modeling flowers as seen through the eyes of an insect pollinator
The honeybee has three spectral types of photoreceptors, maximally sensitive in the UV-, blue- and green-wavelength range, which are referred to as S, M, and L, for the short-, middle-, and long-wavelength-sensitive photoreceptor, respectively (Menzel and Backhaus, 1991). To create images of flowers as they are seen through the eyes of a honeybee, we applied the procedure described in Vorobyev et al. (2001b). Briefly, we made UV- and RGB-photographs of the flowers and also measured their reflectance spectra. We then calculated the quantum catch values for the L, M and S photoreceptors (LMS values) for the different flower regions assuming that the illumination was D65 daylight and substituted the RGB values in the images with the LMS values (Wyszecki and Stiles, 1982; see Supplementary materials for more details). The software for image processing written using Wolfram Mathematica 10, is available on request.
Results
Floral coloration
To characterize the differences in coloration between varieties of Cistanthe longiscapa flowers, we made RGB and UV photographs. Figure 2 shows exemplary cases of flowers with yellow (Figures 2A,B), reddish (Figures 2C,D), purple (Figures 2E,F) and pink (Figures 2G,H) colored petals, revealing that flowers differ in their reflectance in the visible and UV range of the spectrum. Whereas the color in the (for humans) visible wavelength range was rather uniform (Figures 2A,C,E,G), the UV photographs show that some flowers have distinct differences between the distal and proximal areas, thus forming a UV reflection pattern usually referred to as a bullseye (Figures 2B,D,H).
Floral anatomy and pigment distribution
In order to visualize the petal structures and pigment distribution and to estimate petal thickness, cross sections of petals were carried out. This revealed that the thin petals of C. longiscapa are composed of a single cell layer and that pigments are distributed homogeneously in the petal cells (Figures 2G–I). The petal thickness was found to be d = 80 ± 20 μm.
Flower spectral characteristics
To characterize the differences between the distal and proximal petal areas, we measured reflectance and transmittance spectra of the set of flowers of Figures 2A–H. The reflectance spectra of the adaxial and abaxial sides appeared to be very similar for both the distal (Figures 2M–P) and proximal (Figures 2Q–T) petal areas. This allows the application of a single layer Kubelka-Munk type analysis, which yielded the petal’s absorption and scattering parameters (Figures 2U–X).
The absorption in three wavelength ranges, i.e., the UV (<400 nm), the blue (400–500 nm) and the orange-red (500–650 nm) wavelength ranges, shows specific variations. The distal and proximal areas of the yellow flower of Figures 2A,B contain a pigment with peak absorption ∼465 nm. The proximal area contains additionally a UV-absorbing pigment. The pigmentation of the distal and proximal areas of the reddish flower of Figures 2C,D is very similar, but it contains additionally a pigment with peak absorption in the orange wavelength range (∼570 nm). The purple flower of Figures 2E,F contains the same pigments in a much lower concentration, but the UV-absorbing pigment is dominant throughout the petal. The pink flower of Figures 2G,H instead has distally a large amount of the orange-absorbing pigment, which is less present proximally, but there the UV-absorbing pigment is dominant again.
Flower color diversity
Reflectance spectra measurements were further performed on flowers of 110 different plant individuals along a transect. In order to visualize the spectral differences between flowers, a principal component analysis (PCA) was performed, using the reflectance between 300 and 700 nm at intervals of 1 nm. The analysis revealed that two principal components (PCs) explained 84.5% of the variance in flower color. The analysis highlights the variability in the floral spectral reflectance of individual flowers blooming simultaneously in a geographically restricted area. PC1 accounted for 47% of the total variance and separated flowers with high reflectance between 400 and 600 nm from flowers with high reflectance in the UV range and above 600 nm (Figure 3A). PC2 accounted for 38% of the total variance and separated flowers with high reflectance in the UV and long wavelength range (above 500 nm) from flowers with high reflectance in the middle wavelength range (between 400 and 500 nm) (Figure 3B). Plotting PC1 versus PC2 scores for each flower results in a reflectance scatterplot that clusters flowers according to their spectral reflectance in different sections of the scatterplot in 4 clusters.
Flower color appearance for pollinators
Color loci of the 110 flowers mentioned above were plotted in the chromaticity diagram of the most common hymenopteran pollinator, the honeybee Apis mellifera, using the RNL model. Most hymenopterans investigated so far possess trichromatic color vision, with photoreceptors maximally sensitive in the UV, blue and green regions of the spectrum. Because trichromaticity represents the ancestral condition among arthropods (Briscoe and Chittka, 2001; van der Kooi et al., 2021), modeling a perceptual space using the spectral sensitivity of honeybees provides a good approximation about the way flowers are perceived by a wide variety of hymenopterans, pollinator guild that has been observed visiting flowers of C. longiscapa (Supplementary Figure 2). Our analysis revealed that the loci of C. longiscapa flowers distribute widely in the chromaticity diagram of the honeybee (Figure 3D). The flower colors belonging to human red, purple, white and yellow categories form clearly distinguishable clusters in the RNL diagram. The colors corresponding to pink and red human color categories slightly overlap in the RNL diagram. The separation between the clusters has been quantified using Fisher Discriminant Analysis and assessed as the ratio of the distance between the means to the standard deviation of the spread of the data along the line of the best separation between the clusters (Eq. 3). The results are presented in the Table 1. All separations, with the exception of that for the red and pink categories, significantly exceed 1, indicating that these clusters can be easily discriminated based on receptor signals of a honeybee, given that a suitable algorithm of discrimination between categories is used.
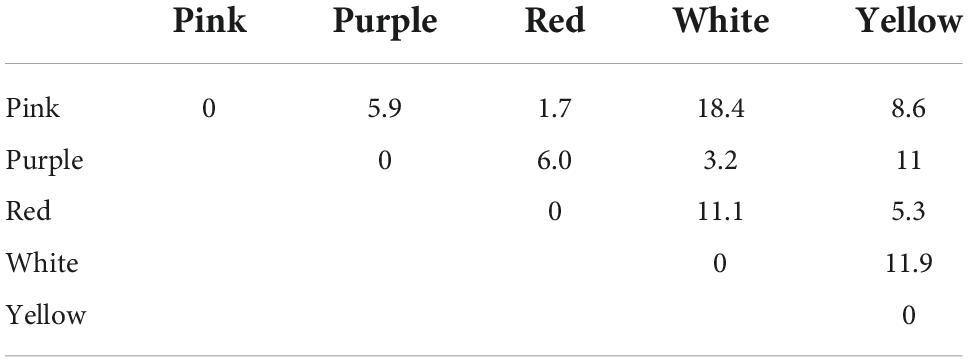
Table 1. Separation between color clusters belonging to different human categories assessed as the ratio of the distance between mean of the clusters to the standard deviation along the line of the best separation (Eq. 3).
The fact that flower colors cluster in different sections of the chromaticity diagram indicates that for trichromatic hymenopterans, flowers from the different clusters appear different in color, thus falling in different color categories. For instance, flowers that appear yellow to humans, i.e., those with high reflectance above 500 nm, which vary in UV reflectance will have a different appearance for hymenopterans. Similarly, purplish flowers with low reflectance in the UV, appear different in color to those purplish flowers with appreciable UV reflectance. It is important to note that empirical evidence of color categories in bees is lacking (e.g., Benard and Giurfa, 2008). A matrix with the color perceptual distance between all flowers of C. longiscapa considered in this study is provided in the Supplementary materials (Supplementary Figure 3).
Since color vision of bees differ substantially from that of humans, the latter gives little insight into the appearance of flowers to bees (Vorobyev and de Ibarra, 2012). The reconstruction of flower images as they are seen through the eyes of bees illustrates the differences in appearance of flowers with similar spectral reflectance in the visible spectrum range but that differ in their UV-reflecting properties (Figure 4). This is the case when comparing yellow flowers with appreciable UV (Figures 4A–C) to yellow flowers having negligible levels of UV reflectance (Figures 4D–F). The same holds when comparing purple and pink flowers with different levels of UV reflectance (flowers of Figures 4G–I vs. flowers of Figures 4J–L). An interesting result is the similarity for honeybees of flowers that for humans appear quite distinguishable, as is the case for UV-reflecting pink flowers (Figures 4J–L) and the reddish flowers (Figures 4M–O). The color similarity of these flowers for bees is due to the lack of photoreceptors sensitive to red in the color vision system of honeybees, which in turn relies on UV photoreceptors. In case of flowers with low UV reflectance that appear white to humans, bees will not see these flowers as white given that they do not stimulate the three spectral types of bee photoreceptors (Figure 4R). Finally, flowers that appear uniform in color to humans with UV-bullseye patterns have a center-surround color pattern for bees (Figures 4C,L,O). Although the differences in flower appearance revealed by our results are not surprising considering the distinct UV sensitivity of insects, the analysis highlights that C. longiscapa flower color varieties occurring simultaneously in the Atacama Desert are highly variable in their color appearance for insect pollinators.
Discussion
Cistanthe longiscapa, due to its massive flowering events, represents a dominant feature across the ephemeral blooming landscape at the Atacama Desert. An interesting aspect of the 2021 blooming event was the co-occurrence of C. longiscapa plants displaying different flower colors. We investigated the mechanisms underlying those color differences and found that result from flowers having pigments with different absorption spectra (Figures 2U–X). The different pigment composition of petals causes flower color differences in the visible and UV range of the spectrum (Figure 2). The variability in C. longiscapa flower colors was visualized through a PCA analysis, which separates flowers in 4 clusters, based on their reflectance in different wavelength ranges (Figures 3A–C). Using color vision modeling we find that C. longiscapa flowers are highly polymorphic in their color appearance for insect pollinators and that their spectral reflectance differences in the visible and UV range of the spectrum affect the way they are perceived by floral visitors (Figures 3D, 4). Altogether, our results highlight the variable nature of floral color of C. longiscapa forms blooming simultaneously in a geographical restricted area. Given the importance of flower color for attracting floral visitors, the observed color variability could mediate the assurance of cross pollination under highly fluctuating pollinator environment conditions.
The Cistanthe are species belonging to Montiaceae that, as members of the Caryophyllales, owe their flower and fruit pigmentation to betalains (Chung et al., 2015) that accumulate in the vacuoles of the cells (Wink, 1997; Sadowska-Bartosz and Bartosz, 2021). The presence of betalains in flowers of Cistanthe is further supported by preliminary experiments on extracts from yellow, purple and pink flowers that reveal pigments with different absorption spectra that are stable at pH from 3 to 7 (in preparation). The betalains are water-soluble, tyrosine-derived pigments, containing betalamic acid as their central chromophore (Stafford, 1994; Tanaka et al., 2008). In plants, betalains are taxonomically restricted to most families of the order Caryophyllales and their biosynthetic pathway is mutually exclusive with that of the more common anthocyanins (Stafford, 1994; Timoneda et al., 2019). Betalains comprise yellow-orange betaxanthins and red-violet betacyanins, with absorption peak wavelengths ∼470 nm and ∼536 nm, well corresponding to the pigments identified in the flowers of C. longiscapa (Figures 2U–X). Our results show that in the thin single cell layered petals of C. longiscapa, betalains co-occur with UV-absorbing pigments (Figures 2U–X), which most likely correspond to flavonoids (Narbona et al., 2021). On the other hand, the color of the reddish flowers seems to result from two types of betalains, with absorption peaks in the blue and orange wavelength range respectively, accumulating together in the vacuoles of the petal cells (Figures 2J,V). Betalains are of special interest regarding their evolutionary origin and homologous functional roles with anthocyanin pigments (Jain and Gould, 2015; Timoneda et al., 2019). While both classes of pigments have comparable spectral properties and have the same histological location, recent evidence indicates that they are effective as photoprotectants, in conferring tolerance to drought and salinity stress and as scavengers of reactive oxygen species in plants facing a variety of abiotic stressors (Jain and Gould, 2015).
Despite their functional similarities with anthocyanins, betalains also have distinctive properties. For instance, unlike anthocyanins, the color of betalains is stable between pH = 3-7 (Strack et al., 2003). This may provide advantages for species like C. longiscapa, which upon experiencing water stress switch the mode of carbon assimilation from C3 to Crassulacean acid metabolism (CAM), shifting from a relatively stable vacuolar pH to large diurnal pH fluctuations (Winter and Holtum, 2014; Jain and Gould, 2015; Ossa et al., 2022). Having stable pigments under such fluctuating conditions would ensure their functionality in a harsh, hyperarid environment such as the Atacama Desert (Jain and Gould, 2015). Despite the long interest in betalain pigments, they have been mostly studied in a few model species and much remains to be elucidated with respect to their diversity and biosynthetic and regulatory pathway. Evidence has accumulated about the variability of pigment content in flowers in response to abiotic stress along geoclimatic gradients (Koski and Ashman, 2016; Dudek et al., 2020). The variability in pigment composition revealed by our results points at Cisthanthe as suitable models to study betalain biosynthesis, as well as their adaptive role under extreme environments.
Plants native to the Atacama Desert have evolved traits associated not only with tolerance to abiotic stress, but also traits involved in ensuring reproduction during short but massive blooming in the Desert (González and Pérez, 2010). In angiosperms, female reproductive success is often constrained by the supply of pollen, a phenomenon known as pollen limitation, which has been associated with the stochastic nature of pollination (Burd, 1994; Larson and Barrett, 2000; Ashman et al., 2004). Pollen limitation is expected to be particularly strong in habitats such as the Atacama Desert, where unpredictable rainfall drives large interannual variations in plant cover and pollinator abundance (González and Pérez, 2010). Variable pollinator environments could also favor the evolution of strategies to cope with pollen limitation. For instance, the evolution of autonomous selfing (i.e., the ability of flowers to self-fertilize) could provide reproductive assurance in the absence of appropriate pollen vectors (Baker, 1955; Goodwillie et al., 2005). While empirical evidence for increased seed set due to autonomous selfing is available for a few annual species (Kalisz and Vogler, 2003; Pérez et al., 2006), its acquisition seems to be more difficult in perennial species, indicating that the adoption of selfing depends on the species’ life form (Morgan et al., 1997). Alternatively, the evolution of floral attractive traits would also allow plants to cope with pollen limitation under fluctuating pollinator environments. A high investment in floral display or reward would increase the attraction of floral visitors and the probability of pollination (Billings and Mooney, 1968; Fabbro and Körner, 2004). An evaluation of the Atacama Desert flora showed that strong pollen limitation was not a general trend and that low pollen limitation levels in annual desert plants, such as C. longiscapa, result from the adoption of autonomous selfing as strategy to ensure pollination (González and Pérez, 2010). With respect to investment in reward, flowers of C. longiscapa do not provide nectar but provide copious amounts of pollen that might attract a variety of pollinators dependent on this type of resource. Although no association between flower size and pollen limitation was detected (González and Pérez, 2010), further studies are needed to evaluate the extent to which other attractive floral traits, such as color and volatiles, contribute to ensure reproduction in plants inhabiting the Atacama Desert.
The specialized floral morphologies observed in some species inhabiting the Atacama Desert suggest that pollinators have played an important role in the evolution of some desert plants. Mechanical and ethological isolation are the two proposed mechanisms by which pollinators would influence the evolution of flowering plants (Grant, 1949). Under processes of ethological isolation, pollinators’ selective behaviors would induce the isolation of floral variants, contributing to the formation of reproductive barriers to hybridization, eventually leading to the development of new races or species (Grant, 1994). Two sympatric modes of origin of ethological isolation have been proposed: (i) hybrid speciation followed by the segregation of a new flower form that captures a new type of pollinator; (ii) the separation of a polymorphic variant for floral characters from other members of its population by flower-constant behavior and assortative mating (Grant, 1994). When seen through the eyes of honeybees, flowers of C. longiscapa can appear quite different from each other in color, providing a scenario that could potentially lead to processes of ethological isolation. Although the circumstances under which such polymorphism developed are unclear, the fact that C. longiscapa is a self-autonomous species suggests that pollinators may have promoted cross pollination between the two more common yellow and purple varieties, resulting in the more uncommon UV-reflecting pink and red forms. A higher incidence of autonomous selfing may have contributed to the persistence of those more uncommon forms throughout several generations (Buide et al., 2021). Several mechanisms have been proposed for the maintenance of high levels of variability in floral traits. For instance, negative frequency-dependent selection, although unlikely in pollen rewarding species, has been pointed out as a mechanism for maintaining color polymorphism in rewardless flower plants (e.g., Gigord et al., 2001; Schiestl, 2005; Basist et al., 2021). Opposing selection regimes exerted simultaneously by mutualists and antagonists is also thought to contribute to the maintenance of flower color polymorphism (Irwin et al., 2003; Frey, 2004; de Jager and Ellis, 2014). An interesting example is Claytonia virginica (Montiaceae), whose color polymorphism is thought to be maintained through positive pollinator-mediated selection for redder flowers, whereas white flowers receive less damage from herbivores and pathogens (Frey, 2004). Spatial or temporal fluctuation in selection can also maintain phenotypic variation (Siepielski et al., 2009, 2013; Tang and Huang, 2010). A long-term study in the Mojave Desert inhabiting species, Linanthus parryae, demonstrated that flower color is subject to fluctuating selection exerted by temporal and spatial variation in spring precipitation (Schemske and Bierzychudek, 2001, 2007). We propose that understanding how biotic and abiotic factors affect flower evolution requires knowledge about the influence of those factors on specific traits along with historical insights about how those factors fluctuate in time and space. In the case of C. longiscapa, its outstanding flower color polymorphism may represent an ongoing process of divergence under a complex and fluctuating history of interactions with pollinators. Considering the historical nature of plant-pollinator interactions, the diversity of floral forms provided by C. longiscapa and other species across the Atacama Desert may also shed light about the sensory and cognitive capacities of the pollinators contributing to shape this unique flowering landscape.
Data availability statement
The raw data supporting the conclusions of this article will be made available by the authors, without undue reservation.
Author contributions
JM-H, NP, and DS collected the data. JM-H, DS, and MV performed the analyses. JM-H drafted the manuscript. All authors revised subsequent versions and contributed to the design of the study.
Funding
This study was financially supported by AFOSR/EOARD (grant FA9550-15-1-0068) to DS. JM-H was funded by FONDECYT (grant 11201217). MM-H was funded by FONDECYT (grant 11201053), ANID-Millennium Science Initiative Program (Code ICN2019_015), and ANID-Millennium Science Initiative Program UPWELL (Code NCN19_153). PG was funded by FONDECYT (grant 1211441). MM-H and PG were funded by ANID/BASAL (grant FB210006).
Acknowledgments
We thank Camila Martínez, Ana Morales, and Valeska Rojas for their help during the course of this study. We also thank Carolina Véjar and the Chile Bosque group for sharing the enthusiasm about the 2021 blooming desert. Finally, we thank Michail Belov for sharing his photos of pollinators and Bernardita Martínez for welcoming us in her house while collecting the field data.
Conflict of interest
The authors declare that the research was conducted in the absence of any commercial or financial relationships that could be construed as a potential conflict of interest.
Publisher’s note
All claims expressed in this article are solely those of the authors and do not necessarily represent those of their affiliated organizations, or those of the publisher, the editors and the reviewers. Any product that may be evaluated in this article, or claim that may be made by its manufacturer, is not guaranteed or endorsed by the publisher.
Supplementary material
The Supplementary Material for this article can be found online at: https://www.frontiersin.org/articles/10.3389/fevo.2022.957318/full#supplementary-material
References
Armesto, J. J., Vidiella, P. E., and Gutiérrez, J. R. (1993). Plant communities of the fog-free coastal desert of Chile: Plant strategies in a fluctuating environment. Rev. Chil. Hist. Nat. 66, 271–282.
Arroyo, M. T. K., Squeo, F. A., Armesto, J. J., and Villagran, C. (1988). Effects of aridity on plant diversity in the northern Chilean Andes: Results of a natural experiment. Ann. Mo. Bot. Gard. 75, 55–78. doi: 10.2307/2399466
Ashman, T.-L., Knight, T. M., Steets, J. A., Amarasekare, P., Burd, M., Campbell, D. R., et al. (2004). Pollen limitation of plant reproduction: Ecological and evolutionary causes and consequences. Ecology 85, 2408–2421. doi: 10.1890/03-8024
Avarguès-Weber, A., and Giurfa, M. (2014). Cognitive components of color vision in honey bees: How conditioning variables modulate color learning and discrimination. J. Comp. Physiol. A 200, 449–461. doi: 10.1007/s00359-014-0909-z
Avarguès-Weber, A., de Brito Sanchez, M. G., Giurfa, M., and Dyer, A. G. (2010). Aversive reinforcement improves visual discrimination learning in free-flying honeybees. PLoS One 5:e15370. doi: 10.1371/journal.pone.0015370
Backhaus, W. (1991). Color opponent coding in the visual system of the honeybee. Vision Res. 31, 1381–1397. doi: 10.1016/0042-6989(91)90059-E
Baker, H. G. (1955). Self-compatibility and establishment efter ‘long-distance’ dispersal. Evolution 9, 347–349. doi: 10.2307/2405656
Basist, G., Dyer, A. G., Garcia, J. E., Raleigh, R. E., and Lawrie, A. C. (2021). Why variation in flower color may help reproductive success in the endangered Australian orchid Caladenia fulva. Front. Plant Sci. 12:599874. doi: 10.3389/fpls.2021.599874
Benard, J., and Giurfa, M. (2008). The cognitive implications of asymmetric color generalization in honeybees. Anim. Cogn. 11, 283–293. doi: 10.1007/s10071-007-0112-5
Billings, W. D., and Mooney, H. A. (1968). The ecology of artic and alpine plants. Biol. Rev. 43, 481–529. doi: 10.1111/j.1469-185X.1968.tb00968.x
Brandt, R., and Vorobyev, M. (1997). Metric analysis of threshold spectral sensitivity in the honeybee. Vis. Res. 37, 425–439. doi: 10.1016/s0042-6989(96)00195-2
Briscoe, A. D., and Chittka, L. (2001). The evolution of color vision in insects. Annu. Rev. Entomol. 46, 471–510.
Buide, M. L., Del Valle, J. C., Prado-Comesaña, A., and Narbona, E. (2021). The effects of pollination, herbivory and autonomous selfing on the maintenance of flower colour variation in Silene littorea. Plant Biol. 23, 275–284. doi: 10.1111/plb.13209
Burd, M. (1994). Bateman’s principle and plant reproduction: The role of pollen limitation in fruit and seed set. Bot. Rev. 60, 83–139. doi: 10.1007/BF02856594
Chávez, R. O., Moreira-Muñoz, A., Galleguillos, M., Olea, M., Aguayo, J., Latín, A., et al. (2019). GIMMS NDVI time series reveal the extent, duration, and intensity of “blooming desert” events in the hyper-arid Atacama Desert, Northern Chile. Int. J. Appl. Earth Obs. Geoinf. 76, 193–203. doi: 10.1016/j.jag.2018.11.013
Chittka, L. (1992). The color hexagon - a chromaticity diagram based on photoreceptor excitations as a generalized representation of color opponency. J. Comp. Physiol. A 170, 533–543.
Chung, H.-H., Schwinn, K. E., Ngo, H. M., Lewis, D. H., Massey, B., Calcott, K. E., et al. (2015). Characterisation of betalain biosynthesis in Parakeelya flowers identifies the key biosynthetic gene DOD as belonging to an expanded LigB gene family that is conserved in betalain-producing species. Front. Plant Sci. 6:499. doi: 10.3389/fpls.2015.00499
de Jager, M. L., and Ellis, A. G. (2014). Floral polymorphism and the fitness implications of attracting pollinating and florivorous insects. Ann. Bot. 113, 213–222. doi: 10.1093/aob/mct189
Dormont, L., Delle-Vedove, R., Bessière, J.-M., and Schatz, B. (2014). Floral scent emitted by white and coloured morphs in orchids. Phytochemistry 100, 51–59. doi: 10.1016/j.phytochem.2014.01.009
Dudek, B., Schneider, B., Hilger, H. H., Stavenga, D. G., and Martínez-Harms, J. (2020). Highly different flavonol content explains geographic variations in the UV reflecting properties of flowers of the corn poppy, Papaver rhoeas (Papaveraceae). Phytochemistry 178:112457. doi: 10.1016/j.phytochem.2020.112457
Dyer, A. G., Boyd-Gerny, S., McLoughlin, S., Rosa, M. G. P., Simonov, V., and Wong, B. B. M. (2012). Parallel evolution of angiosperm colour signals: Common evolutionary pressures linked to hymenopteran vision. Proc. R. Soc. B 279, 3606–3615. doi: 10.1098/rspb.2012.0827
Exner, F., and Exner, S. (1910). Die physikalischen Grundlagen der Blütenfärbungen. Sitzgsber. Akad. Wiss. Wien. Math. Naturwiss. Kl. 119, 191–245.
Fabbro, T., and Körner, C. (2004). Altitudinal differences in flower traits and reproductive allocation. Flora 199, 70–81. doi: 10.1078/0367-2530-00128
Fisher, R. A. (1936). The use of multiple measurements in taxonomic problems. Ann. Eugen. 7, 179–188. doi: 10.1111/j.1469-1809.1936.tb02137.x
France24. (2021). Chile’s ‘Flowering Desert’ a Window on Effects of Climate Change. Paris: France24.
Frey, F. M. (2004). Opposing natural selection from herbivores and pathogens may maintain floral-color variation in Claytonia virginica (Portulacaceae). Evolution 58, 2426–2437. doi: 10.1111/j.0014-3820.2004.tb00872.x.
Garcia, J. E., Shrestha, M., and Dyer, A. G. (2018). Flower signal variability overwhelms receptor-noise and requires plastic color learning in bees. Behav. Ecol. 29, 1286–1297. doi: 10.1093/beheco/ary127
Garcia, J. E., Spaethe, J., and Dyer, A. G. (2017). The path to colour discrimination is S-shaped: Behaviour determines the interpretation of colour models. J. Comp. Physiol. A 203, 983–997. doi: 10.1007/s00359-017-1208-2
Gigord, L. D. B., Macnair, M. R., and Smithson, A. (2001). Negative frequency-dependent selection maintains a dramatic flower color polymorphism in the rewardless orchid Dactylorhiza sambucina (L.) Soò. Proc. Natl. Acad. Sci. U.S.A. 98, 6253–6255. doi: 10.1073/pnas.111162598
Giurfa, M. (2004). Conditioning procedure and color discrimination in the honeybee Apis mellifera. Naturwissenschaften 91, 228–231. doi: 10.1007/s00114-004-0530-z
Goldsmith, T. H., and Butler, B. K. (2003). The roles of receptor noise and cone oil droplets in the photopic spectral sensitivity of the budgerigar, Melopsittacus undulatus. J. Comp. Physiol. A 189, 135–142. doi: 10.1007/s00359-002-0385-8
González, A. V., and Pérez, F. (2010). Pollen limitation and reproductive assurance in the flora of the coastal Atacama Desert. Int. J. Plant Sci. 171, 607–614. doi: 10.1086/653135
Goodwillie, C., Kalisz, S., and Eckert, C. G. (2005). The evolutionary enigma of mixed mating systems in plants: Occurrence, theoretical explanations, and empirical evidence. Ann. Rev. Ecol., Evol. Syst. 36, 47–79. doi: 10.1146/annurev.ecolsys.36.091704.175539
Goulet, B. E., Roda, F., and Hopkins, R. (2017). Hybridization in plants: Old ideas, new techniques. Plant Physiol. 173:65. doi: 10.1104/pp.16.01340
Grant, V. (1949). Pollination systems as isolating mechanisms in angiosperms. Evolution 3, 82–97. doi: 10.1111/j.1558-5646.1949.tb00007.x
Grant, V. (1994). Modes and origins of mechanical and ethological isolation in angiosperms. Proc. Natl. Acad. Sci. U.S.A. 91, 3–10. doi: 10.1073/pnas.91.1.3
Guerrero, P. C., Rosas, M., Arroyo, M. T. K., and Wiens, J. J. (2013). Evolutionary lag times and recent origin of the biota of an ancient desert (Atacama-Sechura). Proc. Natl. Acad. Sci. U.S.A. 110, 11469–11474. doi: 10.1073/pnas.1308721110
Hershkovitz, M. A. (1991). Taxonomic notes on Cistanthe. Calandrinia, and Talinum (Portulacaceae). Phytologia 70, 209–225. doi: 10.5962/bhl.part.3806
Hirota, S. K., Nitta, K., Kim, Y., Kato, A., Kawakubo, N., Yasumoto, A. A., et al. (2012). Relative role of flower color and scent on pollinator attraction: Experimental tests using F1 and F2 hybrids of daylily and nightlily. PLoS One 7:e39010 doi: 10.1371/journal.pone.0039010
Ippolito, A., Fernandes, G. W., and Holtsford, T. P. (2004). Pollinator preferences for Nicotiana alata, N. forgetiana and their F1 hybrids. Evolution 58, 2634–2644. doi: 10.1111/j.0014-3820.2004.tb01617.x
Irwin, R. E., Strauss, S. Y., Storz, S., Emerson, A., and Guibert, G. (2003). The role of herbivores in the mainenance of a flower color polymorphism in wild radish. Ecology 84, 1733–1743.
Jain, G., and Gould, K. S. (2015). Are betalain pigments the functional homologues of anthocyanins in plants? Environ. Exp. Bot. 119, 48–53. doi: 10.1016/j.envexpbot.2015.06.002
Jaksic, F. M. (2001). Ecological effects of El Niño in terrestrial ecosystems of western South America. Ecography 24, 241–250. doi: 10.1034/j.1600-0587.2001.240301.x
Johnson, S. D. (2010). The pollination niche and its role in the diversification and maintenance of the southern African flora. Philos. Trans. R. Soc. B 365, 499–516. doi: 10.1098/rstb.2009.0243
Kalisz, S., and Vogler, D. W. (2003). Benefits of autonomous selfing under unpredictable pollinator environments. Ecology 84, 2928–2942. doi: 10.1093/aob/mct146
Kay, Q. O. N., Daoud, H. S., and Stirton, C. H. (1981). Pigment distribution, light reflection and cell structure in petals. Bot. J. Linnean Soc. 83, 57–83. doi: 10.1111/j.1095-8339.1981.tb00129.x
Koshitaka, H., Kinoshita, M., Vorobyev, M., and Arikawa, K. (2008). Tetrachromacy in a butterfly that has eight varieties of spectral receptors. Proc. R. Soc. Biol. Sci. Series B 275, 947–954. doi: 10.1098/rspb.2007.1614
Koski, M. H., and Ashman, T.-L. (2016). Macroevolutionary patterns of ultraviolet floral pigmentation explained by geography and associated bioclimatic factors. New Phytol. 211, 708–718. doi: 10.1111/nph.13921
Kugler, H. (1963). UV-Musterungen auf Blüten und ihr Zustandekommen. Planta 59, 296–329. doi: 10.1007/BF01872300
Larson, B. M. H., and Barrett, S. C. H. (2000). A comparative analysis of pollen limitation in flowering plants. Biol. J. Linnean Soc. 69, 503–520. doi: 10.1111/j.1095-8312.2000.tb01221.x
Lee, D. (2007). Nature’s Palette: the Science of Plant Color. Chicago, LI: University of Chicago Press.
Lind, O., Chavez, J., and Kelber, A. (2013). The contribution of single and double cones to spectral sensitivity in budgerigars during changing light conditions. J. Comp. Physiol. A 200, 197–207. doi: 10.1007/s00359-013-0878-7
Maia, R., Gruson, H., Endler, J. A., and White, T. E. (2019). PAVO 2: New tools for the spectral and spatial analysis of colour in R. Methods Ecol. Evol. 10, 1097–1107. doi: 10.1111/2041-210X.13174
Martínez-Harms, J., Hadar, R., Márquez, N., Menzel, R., Shmida, A., Stavenga, D. G., et al. (2020). Enhanced UV-reflection facilitated a shift in the pollination system of the red poppy, Papaver rhoeas (Papaveraceae). Plants 9:927. doi: 10.3390/plants9080927
Martínez-Harms, J., Márquez, N., Menzel, R., and Vorobyev, M. (2014). Visual generalization in honeybees: Evidence of peak shift in color discrimination. J. Comp. Physiol. A 200, 317–325. doi: 10.1007/s00359-014-0887-1
Martínez-Harms, J., Warskulat, A.-C., Dudek, B., Kunert, G., Lorenz, S., Hansson, B. S., et al. (2018). Biosynthetic and functional color-scent associations in flowers of Papaver nudicaule and their impact on pollinators. ChemBioChem 19, 1553–1562. doi: 10.1002/cbic.201800155
Menzel, R., and Backhaus, W. (1991). “Color vision in insects,” in Vision and Visual Dysfunction: the Perception of Colour, ed. P. Gouras (New York, NY: Macmillian), 262–293.
Morgan, M. T., Schoen, D. J., and Bataillon, T. M. (1997). The evolution of self-fertilization in perennials. Am. Nat. 150, 618–638. doi: 10.1086/286085
Narbona, E., del Valle, J. C., and Whittall, J. B. (2021). Painting the green canvas: How pigments produce flower colours. Biochemist 43, 6–12. doi: 10.1042/bio_2021_137
Narbona, E., Wang, H., Ortiz, P. L., Arista, M., and Imbert, E. (2018). Flower colour polymorphism in the Mediterranean Basin: Occurrence, maintenance and implications for speciation. Plant Biol. 20, 8–20. doi: 10.1111/plb.12575
Neumeyer, C. (1980). Simultaneous color contrast in the honeybee. J. Comp. Physiol. 139, 165–176. doi: 10.1007/BF00657079
Ossa, P. G., Moreno, A. A., Orellana, D., Toro, M., Carrasco-Valenzuela, T., Riveros, A., et al. (2022). Transcriptomic analysis of the C3-CAM transition in Cistanthe longiscapa, a drought tolerant plant in the Atacama Desert. bioRxiv [Preprint]. doi: 10.1101/2022.03.16.484649
Peitsch, D., Fietz, A., Hertel, H., Desouza, J., Ventura, D. F., and Menzel, R. (1992). The spectral input systems of hymenopteran insects and their receptor-based color vision. J. Comp. Physiol. A 170, 23–40. doi: 10.1007/BF00190398
Pérez, F., Arroyo, M. T. K., Medel, R., and Hershkovitz, M. A. (2006). Ancestral reconstruction of flower morphology and pollination systems in Schizanthus (Solanaceae). Am. J. Bot. 93, 1029–1038. doi: 10.3732/ajb.93.7.1029
Philippi, R. A. (1860). Florula Atacamensis; Seu, Enumeratio Plantarum, Quas in Itinere per Desertum Atacamense. Karlsruhe: Halis Saxonum.
Reser, D. H., Wijesekara Witharanage, R., Rosa, M. G. P., and Dyer, A. G. (2012). Honeybees (Apis mellifera) learn color discriminations via differential conditioning independent of long wavelength (green) photoreceptor modulation. PLoS One 7:e48577. doi: 10.1371/journal.pone.0048577
Reverté, S., Retana, J., Gómez, J. M., and Bosch, J. (2016). Pollinators show flower colour preferences but flowers with similar colours do not attract similar pollinators. Ann. Bot. 118, 249–257. doi: 10.1093/aob/mcw103
Rundel, P. W., Dillon, M. O., Palma, B., Mooney, H. A., Gulmon, S. L., and Ehleringer, J. R. (1991). The phytogeography and ecology of the coastal Atacama and Peruvian deserts. Aliso 13, 1–49. doi: 10.5642/aliso.19911301.02
Sadowska-Bartosz, I., and Bartosz, G. (2021). Biological properties and applications of betalains. Molecules 26:2520. doi: 10.3390/molecules26092520
Salzmann, C. C., and Schiestl, F. P. (2007). Odour and colour polymorphism in the food-deceptive orchid Dactylorhiza romana. Plant Syst. Evol. 267, 37–45. doi: 10.1007/s00606-007-0560-z
Sapir, Y., Gallagher, M. K., and Senden, E. (2021). What maintains flower colour variation within populations? Trends Ecol. Evol. 36, 507–519. doi: 10.1016/j.tree.2021.01.011
Schemske, D. W., and Bierzychudek, P. (2001). Perspective: Evolution of flower color in the desert annual Linanthus parryae Wright revisited. Evolution 55, 1269–1282. doi: 10.1111/j.0014-3820.2001.tb00650.x.
Schemske, D. W., and Bierzychudek, P. (2007). Spatial differentiation for flower color in the desert annual Linanthus parryae: Was wright right? Evolution 61, 2528–2543. doi: 10.1111/j.1558-5646.2007.00219.x
Schemske, D. W., and Bradshaw, H. D. (1999). Pollinator preference and the evolution of floral traits in monkeyflowers (Mimulus). Proc. Natl. Acad. Sci. U.S.A. 96, 11910–11915. doi: 10.1073/pnas.96.21.11910
Schiestl, F. P. (2005). On the success of a swindle: Pollination by deception in orchids. Naturwissenschaften 92, 255–264. doi: 10.1007/s00114-005-0636-y
Schulz, N., Boisier, J. P., and Aceituno, P. (2012). Climate change along the arid coast of northern Chile. Int. J. Climatol. 32, 1803–1814. doi: 10.1002/joc.2395
Siepielski, A. M., DiBattista, J. D., and Carlson, S. M. (2009). It’s about time: The temporal dynamics of phenotypic selection in the wild. Ecol. Lett. 12, 1261–1276. doi: 10.1111/j.1461-0248.2009.01381.x
Siepielski, A. M., Gotanda, K. M., Morrissey, M. B., Diamond, S. E., DiBattista, J. D., and Carlson, S. M. (2013). The spatial patterns of directional phenotypic selection. Ecol. Lett. 16, 1382–1392. doi: 10.1111/ele.12174
Sommerlandt, F. M. J., Spaethe, J., Rössler, W., and Dyer, A. G. (2016). Does fine color discrimination learning in free-flying honeybees change mushroom-body calyx neuroarchitecture? PLoS One 11:e0164386. doi: 10.1371/journal.pone.0164386
Stafford, H. A. (1994). Anthocyanins and betalains: Evolution of the mutually exclusive pathways. Plant Sci. 101, 91–98. doi: 10.1016/0168-9452(94)90244-5
Stavenga, D. G., and van der Kooi, C. J. (2016). Coloration of the Chilean Bellflower, Nolana paradoxa, interpreted with a scattering and absorbing layer stack model. Planta 243, 171–181. doi: 10.1007/s00425-015-2395-0
Strack, D., Vogt, T., and Schliemann, W. (2003). Recent advances in betalain research. Phytochemistry 62, 247–269. doi: 10.1016/S0031-9422(02)00564-2
Tanaka, Y., Sasaki, N., and Ohmiya, A. (2008). Biosynthesis of plant pigments: Anthocyanins, betalains and carotenoids. Plant J. 54, 733–749. doi: 10.1111/j.1365-313X.2008.03447.x
Tang, X.-X., and Huang, S.-Q. (2010). Fluctuating selection by water level on gynoecium colour polymorphism in an aquatic plant. Ann. Bot. 106, 843–848. doi: 10.1093/aob/mcq172
Timoneda, A., Feng, T., Sheehan, H., Walker-Hale, N., Pucker, B., Lopez-Nieves, S., et al. (2019). The evolution of betalain biosynthesis in Caryophyllales. New Phytol. 224, 71–85. doi: 10.1111/nph.15980
Trunschke, J., Lunau, K., Pyke, G. H., Ren, Z.-X., and Wang, H. (2021). Flower color evolution and the evidence of pollinator-mediated selection. Front. Plant Sci. 12:617851. doi: 10.3389/fpls.2021.617851
van der Kooi, C. J., and Stavenga, D. G. (2019). Vividly coloured poppy flowers due to dense pigmentation and strong scattering in thin petals. J. Comp. Physiol. A 205, 363–372. doi: 10.1007/s00359-018-01313-1
van der Kooi, C. J., Elzenga, J. T. M., Dijksterhuis, J., and Stavenga, D. G. (2017). Functional optics of glossy buttercup flowers. J. R. Soc. Interface 14:20160933. doi: 10.1098/rsif.2016.0933
van der Kooi, C. J., Stavenga, D. G., Arikawa, K., Belušič, G., and Kelber, A. (2021). Evolution of insect color vision: From spectral sensitivity to visual ecology. Ann. Rev. Entomol. 66, 435–461. doi: 10.1146/annurev-ento-061720-071644
Vickery, R. K. (1992). Pollinator preferences for yellow, orange, and red flowers of Mimulus verbenaceus and M. cardinalis. Great Basin Nat. 52, 145–148.
Vidiella, P. E., Armesto, J. J., and Gutiérrez, J. R. (1999). Vegetation changes and sequential flowering after rain in the southern Atacama Desert. J. Arid Environ. 43, 449–458. doi: 10.1006/jare.1999.0565
Vignolini, S., Thomas, M. M., Kolle, M., Wenzel, T., Rowland, A., Rudall, P. J., et al. (2012). Directional scattering from the glossy flower of Ranunculus: How the buttercup lights up your chin. J. R. Soc. Interface 9, 1295–1301. doi: 10.1098/rsif.2011.0759
von Helversen, O. (1972). “The relationship between difference in stimuli and choice frequency in training experiments with the honeybee,” in Information Processing in the Visual Systems of Anthropods, ed. R. Wehner (Berlin: Springer), 323–334.
Vorobyev, M., and Brandt, R. (1997). How do insect pollinators discriminate colors? Isr. J. Plant Sci. 45, 103–113.
Vorobyev, M., and de Ibarra, N. H. (2012). “Honey bee vision in relation to flower patterns,” in Honeybee Neurobiology and Behavior: a Tribute to Randolf Menzel, eds C. G. Galizia, D. Eisenhardt, and M. Giurfa (Dordrecht: Springer), 285–301.
Vorobyev, M., and Osorio, D. (1998). Receptor noise as a determinant of colour thresholds. Proc. R. Soc. Biol. Sci. Series B 265, 351–358. doi: 10.1098/rspb.1998.0302
Vorobyev, M., Brandt, R., Peitsch, D., Laughlin, S. B., and Menzel, R. (2001a). Colour thresholds and receptor noise: Behaviour and physiology compared. Vis. Res. 41, 639–653. doi: 10.1016/S0042-6989(00)00288-1
Vorobyev, M., Marshall, J., Osorio, D., Hempel, de Ibarra, N., and Menzel, R. (2001b). Colourful objects through animal eyes. Color Res. Appl. 26, S214–S217.
Wilts, B. D., Rudall, P. J., Moyroud, E., Gregory, T., Ogawa, Y., Vignolini, S., et al. (2018). Ultrastructure and optics of the prism-like petal epidermal cells of Eschscholzia californica (California poppy). New Phytol. 219, 1124–1133. doi: 10.1111/nph.15229
Wink, M. (1997). “Compartmentation of Secondary Metabolites and Xenobiotics in Plant Vacuoles,” in Advances in Botanical Research, eds R. A. Leigh, D. Sanders, and J. A. Callow (Cambridge, MA: Academic Press), 141–169.
Winter, K., and Holtum, J. A. M. (2014). Facultative crassulacean acid metabolism (CAM) plants: Powerful tools for unravelling the functional elements of CAM photosynthesis. J. Exp. Bot. 65, 3425–3441. doi: 10.1093/jxb/eru063
Keywords: Atacama Desert, polymorphism, flower color, floral pigments, pollinators, color vision
Citation: Martínez-Harms J, Guerrero PC, Martínez-Harms MJ, Poblete N, González K, Stavenga DG and Vorobyev M (2022) Mechanisms of flower coloring and eco-evolutionary implications of massive blooming events in the Atacama Desert. Front. Ecol. Evol. 10:957318. doi: 10.3389/fevo.2022.957318
Received: 30 May 2022; Accepted: 27 September 2022;
Published: 21 October 2022.
Edited by:
Daniel Marques Almeida Pessoa, Federal University of Rio Grande do Norte, BrazilReviewed by:
Adrian G. Dyer, RMIT University, AustraliaEduardo Narbona, Universidad Pablo de Olavide, Spain
Copyright © 2022 Martínez-Harms, Guerrero, Martínez-Harms, Poblete, González, Stavenga and Vorobyev. This is an open-access article distributed under the terms of the Creative Commons Attribution License (CC BY). The use, distribution or reproduction in other forums is permitted, provided the original author(s) and the copyright owner(s) are credited and that the original publication in this journal is cited, in accordance with accepted academic practice. No use, distribution or reproduction is permitted which does not comply with these terms.
*Correspondence: Jaime Martínez-Harms, amFpbWUubWFydGluZXpAaW5pYS5jbA==