 Brian Villmoare1*
 Mark Grabowski2,3
- 1Department of Anthropology, University of Nevada, Las Vegas, NV, United States
- 2Research Centre in Evolutionary Anthropology and Palaeoecology, Liverpool John Moores University, Liverpool, United Kingdom
- 3Department of Biosciences, Centre for Ecological and Evolutionary Synthesis (CEES), University of Oslo, Oslo, Norway
Introduction
Encephalization has long been understood to be a key adaptation in the human lineage, and over the last four million years species attributed to Australopithecus and Homo have shown demonstrable trends toward increased brain size. However, our understanding of past populations is limited by our reliance on the fossil record. For some poorly preserved species, we are currently dependent on a few or even a single cranium. This places limits on our ability to infer subtle changes in brain size, even as the broader trend of encephalization is clear.
DeSilva et al. (2021) hypothesize that modern human brain size has decreased, starting at roughly 3,000 years ago. They offer a model in which directional selection for decreased brain size, and/or stabilizing selection for maintaining large brains, was relaxed due to the ability to store information externally in social groups. Under this model, which they analogize from ants, following the development of complex societies, the cumulative intelligence and knowledge of the social group acted to relax the strong forces of selection that had been present in earlier human populations. They propose that “group-level cognition may select for reduced brain size and/or adaptive brain size variation” (DeSilva et al., 2021, p 7).
Do we see a decrease in brain size in modern humans?
DeSilva et al. (2021) base their relevant conclusions on the results of a “change-point analysis,” in which they identify a change in mean brain size, starting at roughly 3,000 years ago (or 3 ka), coinciding with the widespread appearance of complex societies. Their data set is a collection of 987 fossil and museum specimens ranging from Miocene hominid Rudapithecus (9.85 million years ago or Ma) to modern humans (300 ka to 100 years).
The dataset itself raises several questions. The first is whether the sample is appropriate to test the hypothesis that brain size reduced due to changes associated with the transition to agriculture and the rise of complex societies. Since this transition occurred at different times across the globe (see Barker, 2009), rather than over a single 3–5 ka year period, under the hypothesis of DeSilva et al. (2021) we should detect the change in different modern human populations at different times. However, the dataset of DeSilva et al. (2021) is not organized to test the hypothesis in this fashion. Populations from around the globe are lumped together, with only 23 crania sampled over what we would argue to be a critical window with regards to their hypothesis, 5–1 ka, and coming from Algeria, England, Mali, China, and Kenya, among other locations. Later modern human samples are focused on Zimbabwe (at 1.06 ka), the Pecos Pueblo sample from the United States (1 ka), and finally, 165 crania (28% of the total sample) are from Australian pre-Neolithic hunter-gatherer populations and dated in DeSilva et al. (2021) to 100 years ago. In that same dating category, 307 (53% of the total sample) are from unspecified Morton Collection crania, where we have no way of knowing how many may be from pre-Neolithic and post-Neolithic populations. We also observe that the sample of DeSilva et al. (2021) generates a modern human mean of 1,297 cc in the final 100-year category, which is well below other published estimates of contemporary world-wide modern mean human cranial capacity that range from ~1,340 cc up to ~1,460 cc (Beals et al., 1984; Henneberg, 1988; Ruff et al., 1997; DeSousa and Cunha, 2012).
Second, the sample relies on the combination of fossil and modern human specimens, with temporal intervals between these crania ranging from 2.85 million years (Ma) to 100 years, and data points at each time interval ranging from 578 to 1 (Figure 1). Even within their sample of modern humans, starting with the 300-ka year old Jebel Irhoud skulls from Morocco, the intervals range from 105 ka years to 100 years. This produces a heavily unbalanced sample. Of the 987 total specimens (and 836 modern human crania) in the analysis, 578 specimens are from just two sources—the Morton Collection in Philadelphia and Peter Brown's Analysis of Australian and Asian recent modern humans (Brown et al., 2004; Lewis et al., 2011). Both samples are placed in the final 100-years category, which means that more than half of the specimens of a 9.8-million-year analysis are placed in the final 100 years (Figure 1).
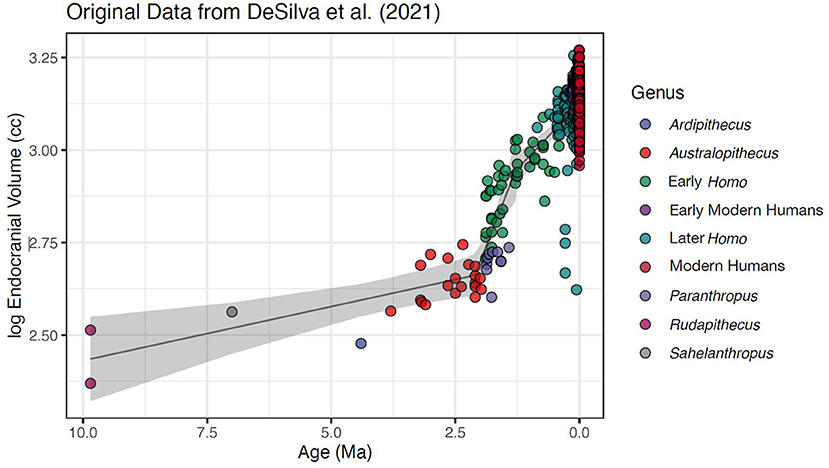
Figure 1. Original dataset from DeSilva et al. (2021). Residuals from the regression are heavily skewed and heteroscedastic, and the temporal intervals between samples ranges from 2.85 million years to 100 years. Of the total of 987 total specimens in this 9.85 Ma analysis, 578 are in the final 100-year interval. Also shown is fitted regression lines from a linear model with 95% confidence intervals around the slope; changepoints were found using segmented R package at 2.1 ± 0.1 Ma, 1.3 ± 0.1 Ma, and respective slopes of 0.03 ± 0.01, 0.35 ± 0.04, 0.14 ± 0.13 surrounding changepoints. No changepoint was located at or around 3 ka that approached significance using Davies (1987) test after accounting for previously mentioned changepoints (p-value of any additional changepoints = 0.621).
Change-point analysis is, broadly speaking, a form of regression in which the hypothesis being tested is whether there is a change in the distribution of a particular parameter (e.g., slope, residual variance, mean, etc.; Chow, 1960; Chen and Gupta, 2012). This type of analysis relies on the standard assumptions of regression: that the residuals do not deviate from (multivariate) normality and homoscedasticity. However, in the DeSilva et al. (2021) data set, the extremely disproportionate sampling of more recent populations leads to violations of these assumptions. Using the full dataset, the residuals from the change-point analysis model (Figure 1) are significantly skewed (Mardia's test p < 0.00001) and, depending on the statistic, approaching heteroscedastity (Breusch-Pagan p < = 0.100, White test p = 0.059). Even if the data are reduced to just the modern human data set starting at ~300 ka—to test the hypothesis of micro-evolution within modern humans—the residuals are still heavily skewed (Mardia's test p < 0.00001).
To understand relevant patterns over time, we propose that several adjustments must be made to the data. First, we limited the analysis to modern humans only. We challenge the notion that brain size changes between such adaptively divergent and temporally distant groups such as Rudapithecus, Australopithecus, and Homo erectus in any way inform on hypotheses relating to potential changes in modern human brain size around 3 ka driven by transitions to agriculture and social complexity in the Holocene. Analyses must be done at the appropriate scale (Du et al., 2018), and hypotheses of micro-evolutionary change within species should be addressed with data at the appropriate micro-evolutionary scale. In addition, ignoring interspecific relationships (i.e., phylogeny) and population structure can have unforeseen consequences on analyses (e.g., Felsenstein, 1985; Roseman and Auerbach, 2015). Thus, we limited the data to only modern humans changing the analysis to focus on only the last 300 ka. While including modern human population structure in our analysis (e.g., Roseman and Auerbach, 2015) could be warranted, this would require a completely different approach than used in DeSilva et al. (2021) and here we merely wish to explore the effect of using their same methods on data that is more appropriate to the research question.
Second, we reduced the data to means calculated to represent specific temporal slices, following on standard practice in time-series analysis (e.g., Auger and Lawrence, 1989; Wagner et al., 2002; Lopez et al., 2010; Palma, 2016; Hites, 2019). Using the data from DeSilva et al. (2021), we calculated 100-year mean values for the modern human data set, which focuses on the last 300 ka (Figure 2).
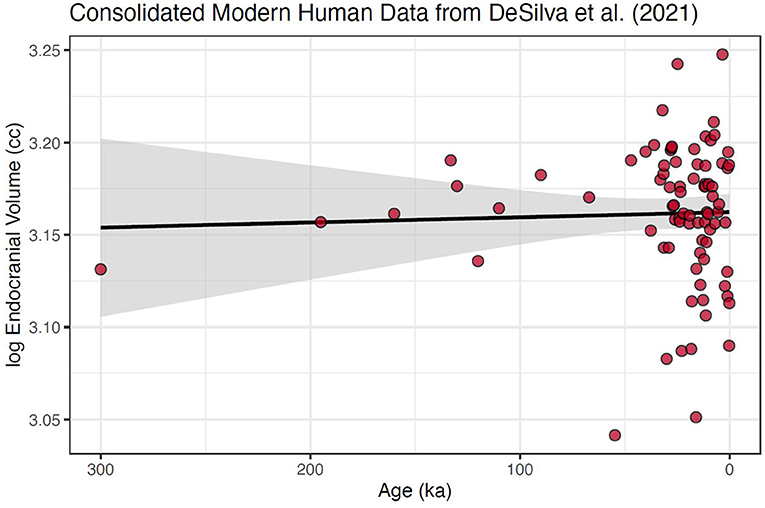
Figure 2. Modern human cranial size over the last 300 ka using data consolidated into 100-year means. This data set follows standard practice in time series analysis by having single values at each time slice. Further, the heteroscedasticity is strongly reduced (although it is still heavily skewed). Also shown is fitted regression line with 95% confidence interval around the slope; slope = 2.78e−5 ± 8.89e−5, which is not significantly different from 0 with a p-value of 0.754. No changepoint was found for this consolidated and reduced dataset.
However, due to of the paucity of older samples, even within the single-species modern human sample, these data were still significantly skewed (Mardia's test p < 0.0001). Because 60% of the data fall within the last 10% of the modern human timeline, our final step was to create a subset of the data that encompassed the data over this most well-populated interval, the last 30 ka (Figure 3). This created a more normally distributed time series, (Mardia's test p = 0.956), with the largest temporal gap reduced to only 2.8 ka. We suggest that, given the data available from DeSilva et al. (2021), this consolidated and narrowed data set is needed to produce an accurate test of the hypothesis of a shift in mean brain size in modern humans in the pre and post-agricultural period.
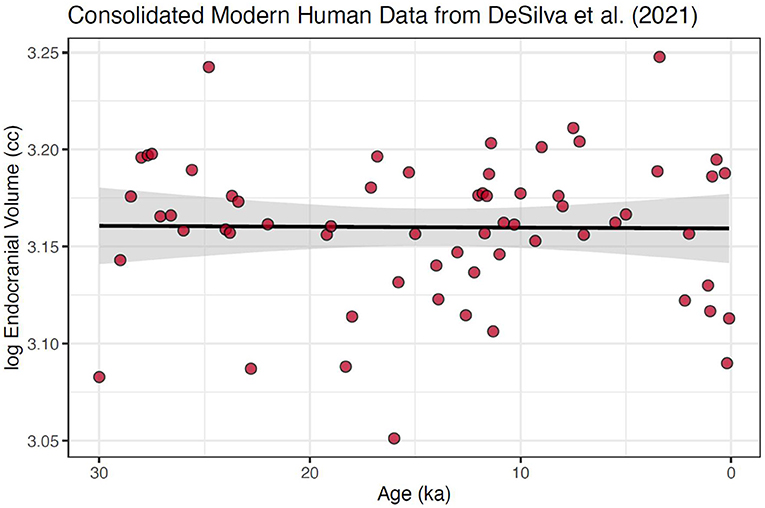
Figure 3. Modern human cranial size over the last 30 ka using data consolidated into 100-year means. This data set is neither heteroscedastic nor skewed. Further, we argue that this is the appropriate scale at which to examine the micro-evolutionary hypothesis of change due to selection changes in the Holocene. Also shown is fitted regression line with 95% confidence interval around the slope; slope = 2.80e−5 ± 8.89e−5, which is not significantly different from 0 with a p-value of 0.754. No changepoint was found for this consolidated and reduced dataset.
There are multiple methods for identifying changepoints in series data (Chen and Gupta, 2012), and we employed two methods: using standard segmented regression in SegReg (www.waterlog.info) and the R Package segmented (Muggeo, 2008) to determine if there were shifts in slope following on the changepoint hypotheses of DeSilva et al. (2021). We first used our consolidated modern human 300 ka dataset, and then the consolidated modern human 30 ka dataset.
Using either data set and either software packages, we found no significant changepoint at or near 3 ka (Figures 2, 3). This includes using the same R packages and data as in DeSilva et al. (2021), with the addition of a Davies (1987) test for significance of a changepoint around 3 ka in the package segmented (Muggeo, 2008), a step DeSilva et al. (2021) did not report (p-value for any changepoints in the consolidated 300 ka = 0.739; and p-value for any in the consolidated 30 ka dataset = 0.259).
The Davies test (Davies, 1987) is necessary in cases where a new parameter enters the model under the alternative hypothesis, here testing if the difference between the slopes at the changepoint is significantly different from zero vs. a null hypothesis of no difference as the null hypothesis has one less parameter—the changepoint (Muggeo, 2008). Calculating 100-year means on the modern human data had the effect of reducing the residuals heteroscedasticity for the 300 ka dataset (Breusch-Pagan p = 0.501, White Test p = 0.538), and for the 30 ka dataset (Breusch-Pagan p =0.610, White Test p = 0.877).
With regards to testing the hypothesis in question, our analyses showed no changes in brain size associated with the transition to agriculture during the Holocene. Overall, our conclusion is that, given a dataset more appropriate to the research question, human brain size has been remarkably stable over the last 300 ka. Thus, hypotheses of recent change are not supported by the evidence (see also Beals et al., 1984; Henneberg, 1988; Ruff et al., 1997; DeSilva et al., 2021).
Discussion
DeSilva et al. (2021) propose that human brain size has decreased, and offer innovative reasons why this may be so, primarily focusing on a model of “group level cognition.” Our analysis of these data fails to find a decrease in human brain size over the last few thousands of years. When the large sample sizes of the most recent human samples are adjusted for, the pattern disappears, and the arguments no longer need to be invoked.
We argue that, when examining questions of micro-evolutionary change, the analysis and data need to be appropriate for the specific scale of that hypothesis. Further, the data need to be otherwise relevant for the hypothesis being tested (see Houle et al., 2011). Given that the adoption of agriculture and the transition to complex societies occurred in different times at different places, the samples need to be specific enough to test the hypothesis across different times and populations, which does not appear to be the case in this instance.
Author contributions
BV and MG analyzed data and wrote and edited the manuscript. All authors contributed to the article and approved the submitted version.
Acknowledgments
We are grateful to Kjetil Voje for comments that improved this manuscript.
Conflict of interest
The authors declare that the research was conducted in the absence of any commercial or financial relationships that could be construed as a potential conflict of interest.
Publisher's note
All claims expressed in this article are solely those of the authors and do not necessarily represent those of their affiliated organizations, or those of the publisher, the editors and the reviewers. Any product that may be evaluated in this article, or claim that may be made by its manufacturer, is not guaranteed or endorsed by the publisher.
References
Auger, I., and Lawrence, C. (1989). Algorithms for the optimal identification of segmented neighborhoods. Bull. Math. Biol. 51, 39–54. doi: 10.1016/S0092-8240(89)80047-3
Barker, G. (2009). The Agricultural Revolution in Prehistory: Why Did Foragers Become Farmers? Oxford University Press: Oxford.
Beals, K., Smith, C., and Dodd, S. (1984). Brain size, cranial morphology, climate, and time machines. Curr. Anthropol. 25, 301–330. doi: 10.1086/203138
Brown, P., Sutikna, T., Morwood, M. J., Soejono, R. P., Saptomo, E. W., and Due, R. A. (2004). A new small-bodied hominin from the Late Pleistocene of Flores, Indonesia. Nature 431, 1055–1061. doi: 10.1038/nature02999
Chen, J., and Gupta, A. (2012). Parametric Statistical Change Point Analysis. New York, NY: Springer. doi: 10.1007/978-0-8176-4801-5
Chow, G. (1960). Tests of equality between sets of coefficients in two linear regressions. Econometrica 28, 591–605. doi: 10.2307/1910133
Davies, R. B. (1987). Hypothesis testing when a nuisance parameter is present only under the alternatives. Biometrika 74, 33–43. doi: 10.2307/2336019
DeSilva, J. M., Traniello, J. F. A., Claxton, A. G., and Fannin, L. D. (2021). When and why did human brains decrease in size? A new change-point analysis and insights from brain evolution in ants. Front. Ecol. Evol. 9, 742639. doi: 10.3389/fevo.2021.742639
DeSousa, A., and Cunha, E. (2012). Hominins and the emergence of the modern human brain. Prog. Brain Res. 195, 293–322. doi: 10.1016/B978-0-444-53860-4.00014-3
Du, A., et al. (2018). Pattern and process in hominin brain size evolution are scale-dependent. Proc. Biol. Sci. 285, 20172738. doi: 10.1098/rspb.2017.2738
Felsenstein, J. (1985). Phylogenies and the comparative method. Am. Nat. 125, 1–15. doi: 10.1086/284325
Hites, R. (2019). Break point analyses of human or environmental temporal trends of POPs. Sci. Total Environ. 664, 518–521. doi: 10.1016/j.scitotenv.2019.01.353
Houle, D., Pélabon, C., Wagner, G. P., and Hansen, T. F. (2011). Measurement and meaning in biology. Q. Rev. Biol. 86, 3–34. doi: 10.1086/658408
Lewis, J. E., DeGusta, D., Meyer, M. R., Monge, J. M., Mann, A. E., Holloway, R. L. (2011). The mismeasure of science: stephen jay gould versus samuel george morton on skulls and bias. PLoS Biol. 9, e1001071. doi: 10.1371/journal.pbio.1001071
Lopez, I., Gamez, M., Gaaray, J., Sandovar, T., and Varga, Z. (2010). Application of change-point problem to the detection of plant patches. Acta Biotheor. 58, 51–63. doi: 10.1007/s10441-009-9093-x
Muggeo, V. M. R. (2008). segmented: An R Package to Fit Regression Models with Broken-Line Relationships. 8, 7.
Roseman, C. C., and Auerbach, B. M. (2015). Ecogeography, genetics, and the evolution of human body form. J. Hum. Evol. 78, 80–90. doi: 10.1016/j.jhevol.2014.07.006
Ruff, C., Trinkaus, C., and Holliday, T. (1997). Body mass and encephalization in Pleistocene Homo. Nature 387, 173–176. doi: 10.1038/387173a0
Keywords: brain evolution, selection, neolithic, population genetics, human evolution
Citation: Villmoare B and Grabowski M (2022) Did the transition to complex societies in the Holocene drive a reduction in brain size? A reassessment of the DeSilva et al. (2021) hypothesis. Front. Ecol. Evol. 10:963568. doi: 10.3389/fevo.2022.963568
Received: 07 June 2022; Accepted: 11 July 2022;
Published: 29 July 2022.
Edited by:
Mathieu Lihoreau, Centre National de la Recherche Scientifique (CNRS), FranceReviewed by:
Pasquale Raia, University of Naples Federico II, ItalyRobin Dunbar, University of Oxford, United Kingdom
Alessandro Mondanaro, University of Florence, Italy
Copyright © 2022 Villmoare and Grabowski. This is an open-access article distributed under the terms of the Creative Commons Attribution License (CC BY). The use, distribution or reproduction in other forums is permitted, provided the original author(s) and the copyright owner(s) are credited and that the original publication in this journal is cited, in accordance with accepted academic practice. No use, distribution or reproduction is permitted which does not comply with these terms.
*Correspondence: Brian Villmoare, YnJpYW4udmlsbG1vYXJlQHVubHYuZWR1