 Harry Dowsett
 Peter Jacobs2,3†
 Kim de Mutsert
- 1U.S. Geological Survey, Florence Bascom Geoscience Center, Reston, VA, United States
- 2NASA Goddard Space Flight Center, Greenbelt, MD, United States
- 3Department of Environmental Science & Policy, George Mason University, Fairfax, VA, United States
- 4Division of Coastal Sciences, University of Southern Mississippi, Ocean Springs, MS, United States
Latest climate models project conditions for the end of this century that are generally outside of the human experience. These future conditions affect the resilience and sustainability of ecosystems, alter biogeographic zones, and impact biodiversity. Deep-time records of paleoclimate provide insight into the climate system over millions of years and provide examples of conditions very different from the present day, and in some cases similar to model projections for the future. In addition, the deep-time paleoecologic and sedimentologic archives provide insight into how species and habitats responded to past climate conditions. Thus, paleoclimatology provides essential context for the scientific understanding of climate change needed to inform resource management policy decisions. The Pliocene Epoch (5.3–2.6 Ma) is the most recent deep-time interval with relevance to future global warming. Analysis of marine sediments using a combination of paleoecology, biomarkers, and geochemistry indicates a global mean annual temperature for the Late Pliocene (3.6–2.6 Ma) ∼3°C warmer than the preindustrial. However, the inability of state-of-the-art climate models to capture some key regional features of Pliocene warming implies future projections using these same models may not span the full range of plausible future climate conditions. We use the Late Pliocene as one example of a deep-time interval relevant to management of biodiversity and ecosystems in a changing world. Pliocene reconstructed sea surface temperatures are used to drive a marine ecosystem model for the North Atlantic Ocean. Given that boundary conditions for the Late Pliocene are roughly analogous to present day, driving the marine ecosystem model with Late Pliocene paleoenvironmental conditions allows policymakers to consider a future ocean state and associated fisheries impacts independent of climate models, informed directly by paleoclimate information.
Introduction
The most compelling reason to look at deep time climate settings is that future conditions, based upon the most advanced Earth System Models, are outside the human experience (IPCC, 2013, 2021; Hayhoe et al., 2017). Instrumental data extend the climate record back in time by a couple of centuries, and historical or written records of storms, harvest yields, and phenological changes, extend back at most several thousand years for some regions. Deep-time records of paleoclimate provide insight into the climate system over millions of years, sampling conditions very different from the present day, and in some cases comparable to model projections for the future (Dowsett et al., 2012).
Well-known deep time intervals of global warmth include the Cretaceous (∼145–66 Ma) (O’Brien et al., 2017), the Paleocene-Eocene Thermal Maximum or PETM (∼55 Ma)(Zachos et al., 2003), the Miocene Climatic Optimum or MCO (16.75–14.5 Ma) (Burls et al., 2021), and the Late Pliocene or mid-Piacenzian Warm Period known as the MPWP (3.28–3.02 Ma) (Dowsett et al., 2016). The MPWP is particularly relevant to current and future climate policy for several reasons. As one looks back in time the first instance of atmospheric CO2 levels comparable to those of the present day (∼400–415 ppm) occurs approximately 3 million years ago (Ma) within the Piacenzian Age of the Pliocene Epoch, during the MPWP (de la Vega et al., 2020; Rae et al., 2021; Figure 1). Unlike the earlier intervals of global warmth, the relative position of tectonic plates of the Earth’s lithosphere are essentially unchanged over the last 3 million years. The MPWP is the most recent deep-time interval of global warmth, within reach of many methodologies used for analysis of Holocene environments (Dowsett et al., 2013b). Reconstructions of paleogeography, ocean temperatures and global ice volume/distribution have been produced for each of these past examples of global warmth but only the MPWP has an integrated and internally consistent reconstruction of land and sea distribution, topography and bathymetry, sea surface temperature (SST), and land cover including vegetation, soils, lakes and land ice, on a global 1° latitude by 1° longitude scale, constructed in part for use with climate modeling experiments (Dowsett et al., 2016).
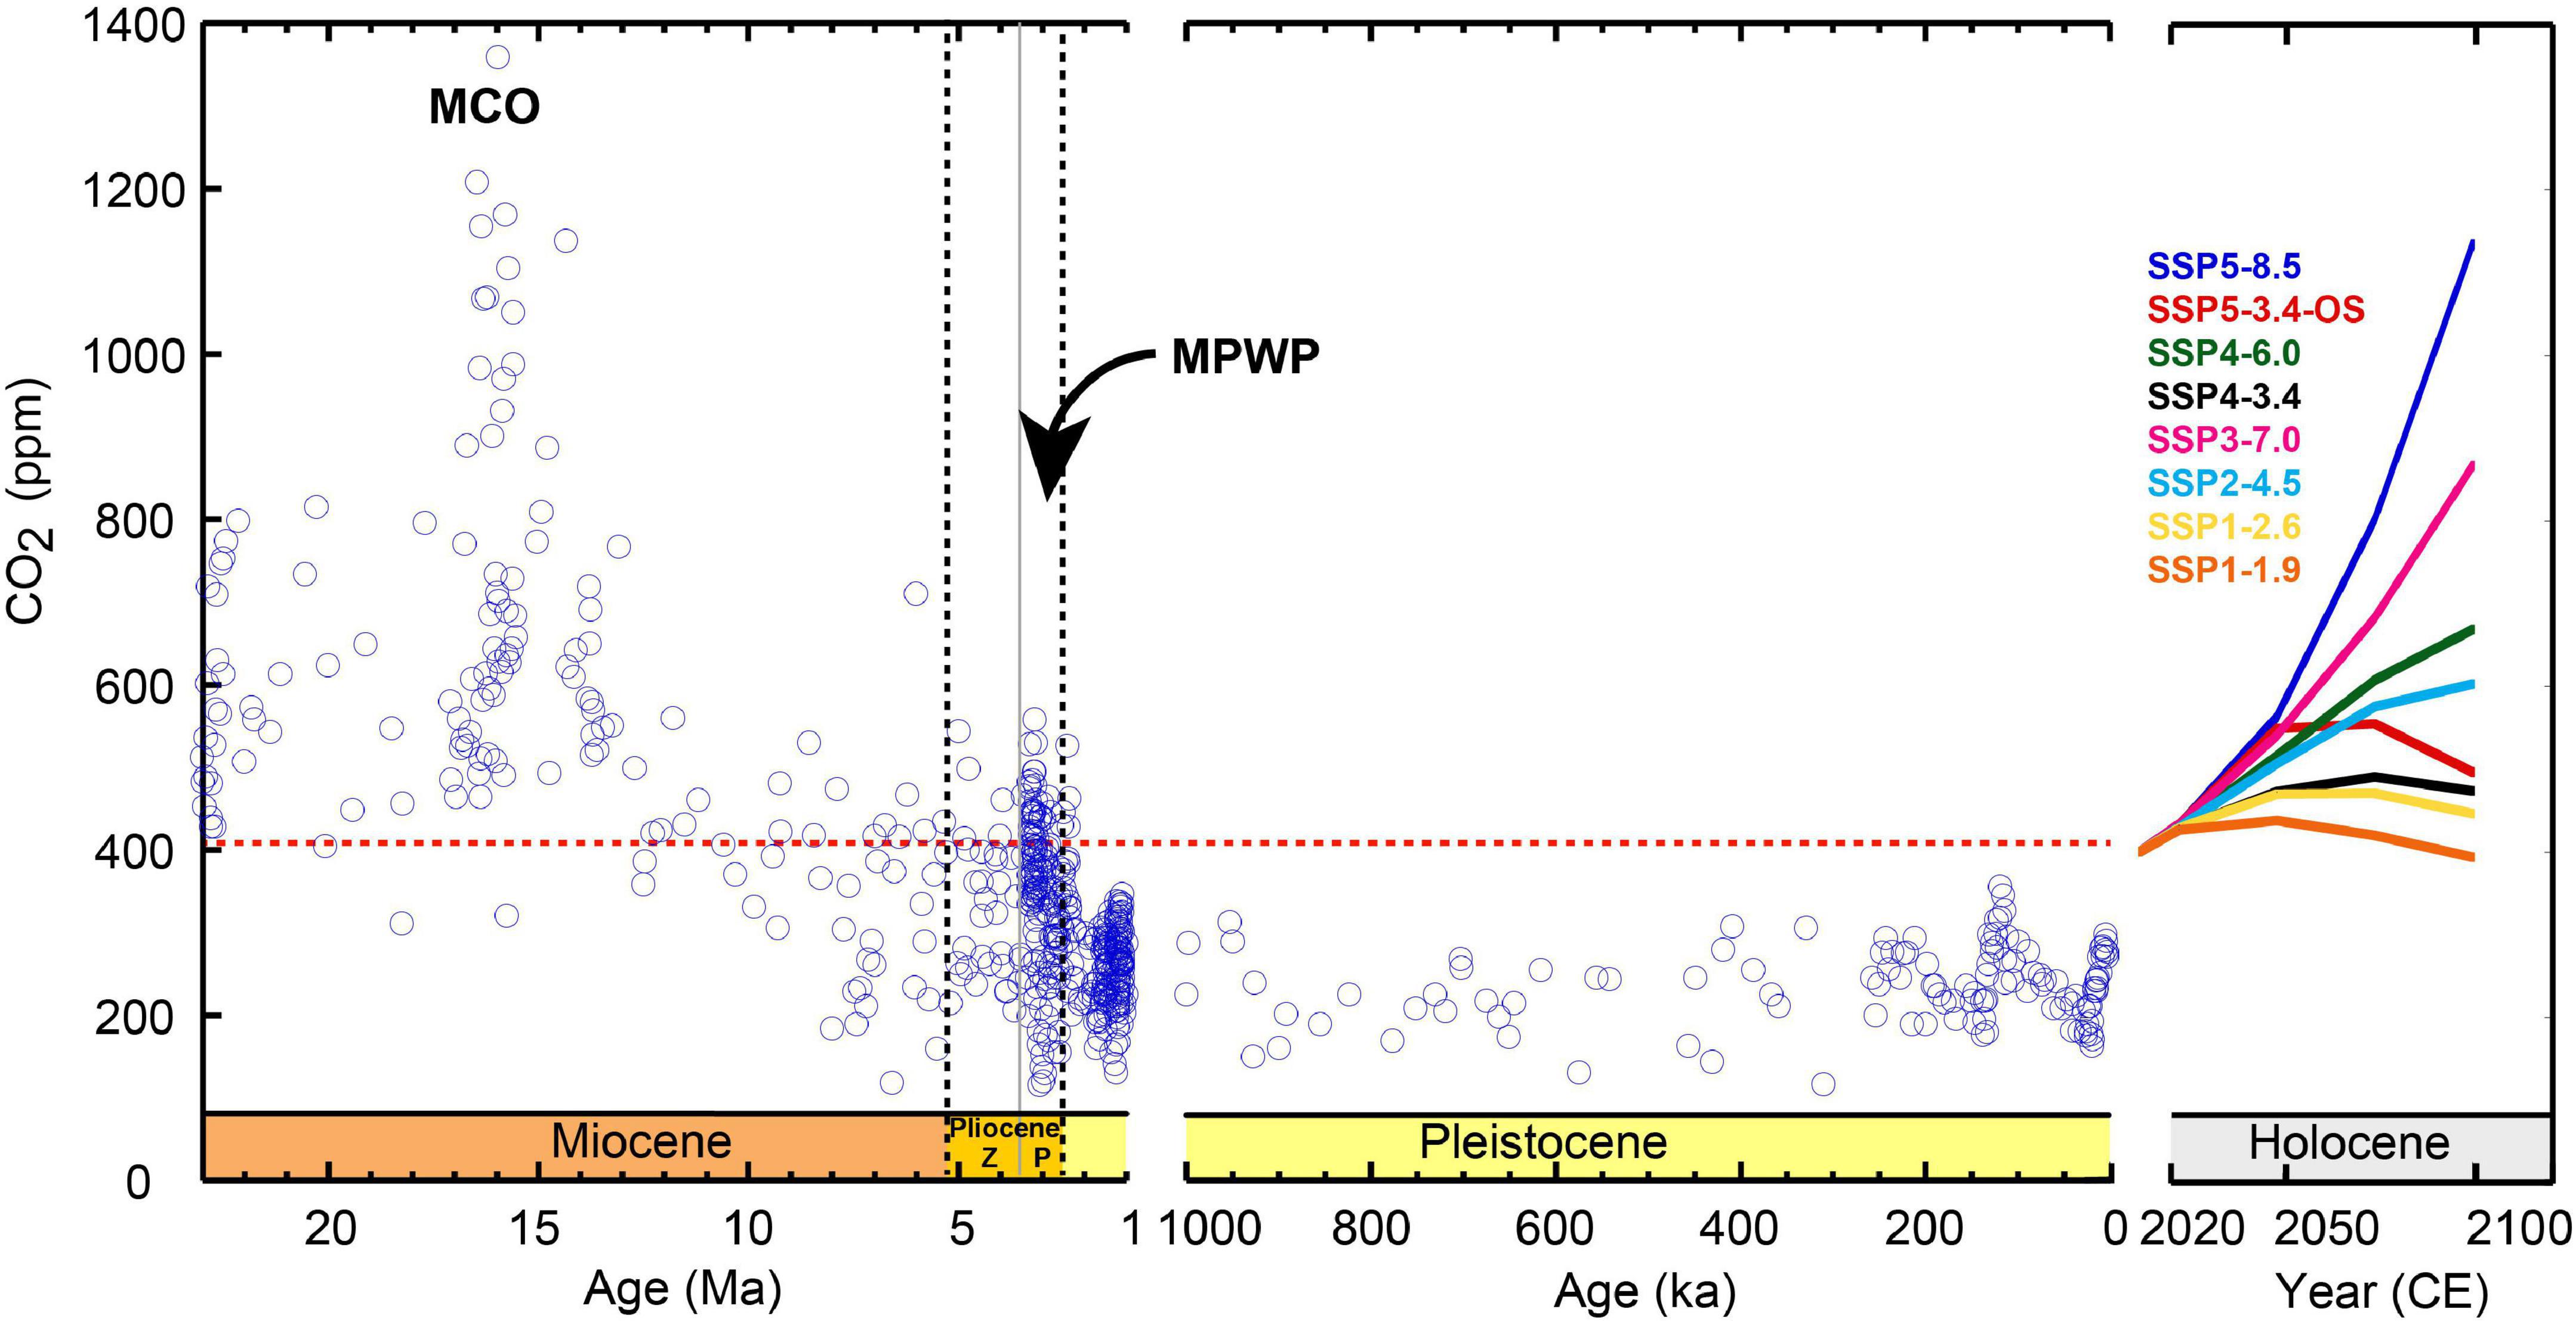
Figure 1. Paleoclimate as context for future climate change scenarios. CO2 scenarios associated with different socio-economic pathways (Meinshausen et al., 2020) are shown in color as model projections for future. Mid-Piacenzian Warm Period (MPWP) and Miocene Climatic Optimum (MCO). Horizontal red dashed line indicates current CO2 of ∼410 ppm. Note breaks in age axis. Zanclean and Piacenzian Ages of the Pliocene Epoch denoted by Z and P respectively. CO2 data are from Zhang et al. (2013); Pagani et al. (2010), Foster (2008); Hönisch et al. (2009), Badger et al. (2019); Chalk et al. (2017), Sosdian et al. (2018); Dyez et al. (2018), Martinez-Boti et al. (2015); de la Vega et al. (2020), and Greenop et al. (2014), and suggest the Earth has not experienced present–day levels of CO2 in 3 million years. Modified after Rae et al. (2021).
While global and regional deep-time paleoclimate reconstructions are valuable for understanding the dynamics of the climate system during times warmer than present day, paleoclimate models have been unable to reproduce the magnitude of warming documented by proxy methods in the mid-to-high latitude North Atlantic region during the Late Pliocene (Dowsett et al., 2012, 2013a,2019). Our intent is to show the utility of a Late Pliocene SST reconstruction, based in large part on paleontological and paleoecological data, as an end-member driver of a marine ecosystem model. The outcome of this paleoclimate-derived scenario can provide a complement to traditional climate model-driven simulations of future conditions. Climate models have demonstrated skill in simulating global temperatures (Hausfather et al., 2020). However, these models are not independent from one another, ranging from the explicit sharing of code to general conceptual design (Knutti et al., 2013; Alexander and Easterbrook, 2015). This lack of independence in the models has explicit consequences for simulations, with structural similarities reducing the spread in model output (Boé, 2018) and contributing to known biases across models (Tian and Dong, 2020). Paleoclimate data represent an “out of sample” realization of the Earth’s climate, and therefore can be used to evaluate and reduce potential model bias (Braconnot et al., 2012; Zhu et al., 2021), indirectly informing decision-making. In this example, paleoclimate data from geological archives and climate model simulations of future climate are used to drive the same ecological model, expanding the range of potential outputs beyond multi-model, multi-emissions-scenario projection ensembles. Here, paleoclimate data more directly informs decision-making, ensuring policymaking can be robust to potential biases specific to climate models. This unique perspective is relevant for framing decisions regarding management of ecosystems and biodiversity.
The PRISM paleoenvironmental reconstruction and application to climate modeling
Over the past quarter century, the U.S. Geological Survey (USGS) has reconstructed and modeled Late Pliocene paleoenvironments on a global scale as part of the long-term Pliocene Research, Interpretation, and Synoptic Mapping (PRISM) Project. The PRISM reconstruction (Dowsett et al., 2016) presently includes global scale data sets for surface and deep ocean conditions (Dowsett et al., 2009), paleogeography [topography and bathymetry, taking into account mantle convection and glacial isostatic adjustment (Rowley et al., 2013)], terrestrial biomes (Salzmann et al., 2008, 2013), soils and large lakes (Pound et al., 2014), and land ice distribution and volume (Hill, 2009; Dolan et al., 2012; Koenig et al., 2015). These data suggest a sea level equivalent change for the mid-Piacenzian of +24 m without considering changes to the size of the global ocean in the Pliocene (Dowsett et al., 2016).
Pliocene Research, Interpretation, and Synoptic Mapping data sets have been used to initiate and verify global paleoclimate model experiments for more than 25 years (Chandler et al., 1994, 2013; Sloan et al., 1996; Haywood et al., 2000; Haywood and Valdes, 2004; Chan et al., 2011; Kamae and Ueda, 2012; Stepanek and Lohmann, 2012; Yan et al., 2012; Zhang and Yan, 2012; Zhang et al., 2012; Chandan and Peltier, 2017, 2018; Otto-Bliesner et al., 2017; Chan and Abe-Ouchi, 2020; de Nooijer et al., 2020; Hopcroft et al., 2020; Baatsen et al., 2021; Han et al., 2021; Feng et al., 2022; Lohmann et al., 2022). A brief history of the synergy between PRISM and paleoclimate modeling can be found in Haywood et al. (2016) and Haywood et al. (2021).
Pliocene Research, Interpretation, and Synoptic Mapping SST estimates are based upon a combination of proxy methods including paleoecologic analyses of faunal assemblages, geochemical, and biomarker analyses. Planktonic foraminifer assemblages are analyzed using either factor analytic transfer functions (Imbrie and Kipp, 1971) or modern analogue techniques (Hutson, 1980). The factor analytic transfer function method relates modern faunal census data to physical oceanographic parameters to derive equations that are then used on fossil assemblages to make quantitative SST estimates. The modern analog technique quantifies faunal changes within deep-sea cores in terms of modern oceanographic conditions using a measure of faunal dissimilarity, to directly compare downcore (fossil) samples to each reference sample in a modern oceanographic database. In some regions of the Pacific and Southern Oceans, SST reconstructions are based upon biogeography of diatom assemblages. Temperature estimates in shallow-water regions are often reconstructed using isotopic analyses of mollusks and quantitative analysis of ostracod assemblages. Independent estimates of SST are obtained for some localities using Mg:Ca ratios in shallow-dwelling planktonic foraminifer shells and the unsaturation index of alkenones (ketones synthesized by haptophyte algae living near the ocean surface) found in raw sediment, both of which have been calibrated to present day SST (Cronin, 1988; Gladenkov et al., 1991; Barron, 1992, 1996; Allmon et al., 1996; Cronin and Dowsett, 1996; Dowsett et al., 2013a,b; Johnson et al., 2017, 2019; Robinson et al., 2018).
These global SST data were produced to gain a better understanding of the dynamics of the Pliocene climate system, for use in driving atmospheric general circulation models, and as verification of SST produced by more sophisticated coupled ocean-atmosphere model experiments. The paleoecological information from PRISM has also been used in several studies (Yasuhara et al., 2012; Saupe et al., 2014, 2015) to investigate ecological and evolutionary responses of the fossil and extant marine fauna to climate change over the last 3 million years.
The Pliocene North Atlantic monthly mean SST fields used here were derived from the PRISM3 reconstruction (Dowsett et al., 2010; Dowsett, 2022). The data are presented on a 2° latitude × 2° longitude grid for each month. Reconstructed SST suggests a northward displacement of the North Atlantic gyre and associated Gulf Stream–North Atlantic Drift current, which transfers warm water to the north. The Pliocene Model Intercomparison Project, Phase 2 (PlioMIP2) ensemble of climate models (Haywood et al., 2020) shows broad agreement with the PRISM SST reconstruction on a global scale, except for a region in the mid-to-high latitude northeastern North Atlantic where model temperatures are cooler than those reconstructed by proxy methods (Figure 2).
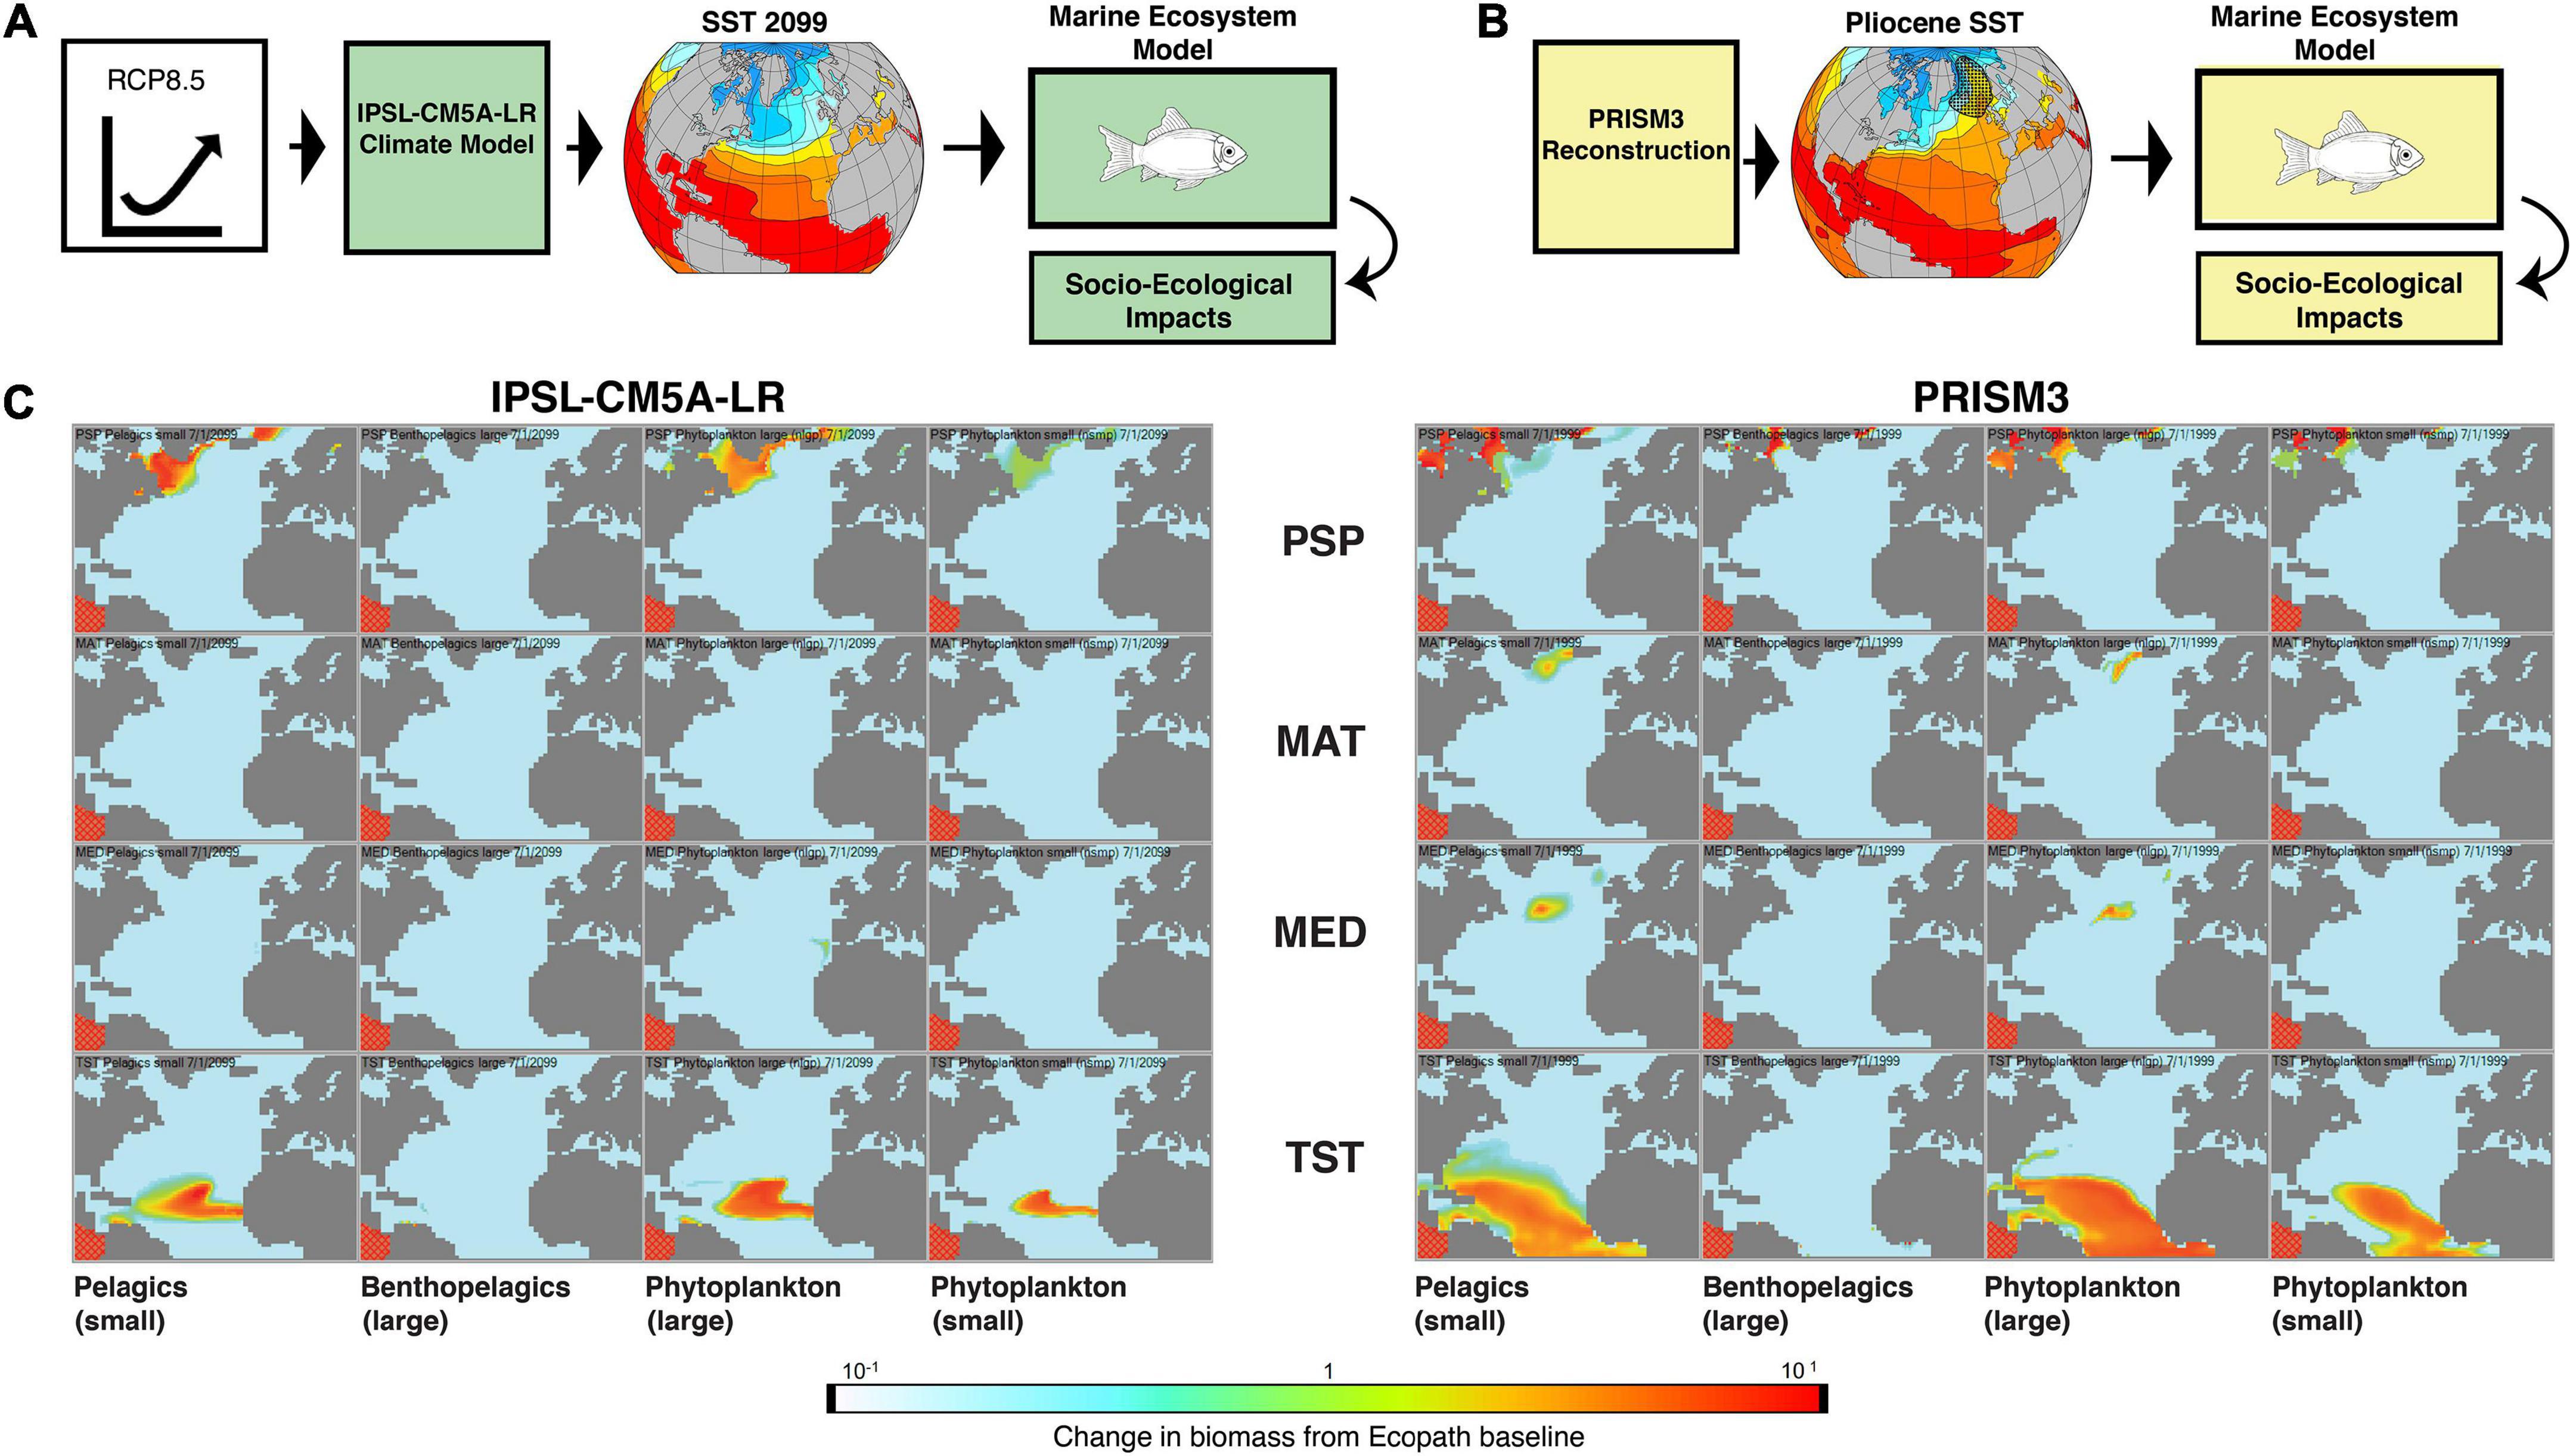
Figure 2. Conceptual framework for application of paleoclimate data to conservation management. (A) A high greenhouse gas emissions trajectory (RCP8.5) is used to drive a climate model (IPSL-CM5A-LR) to produce future SSTs. These climate model-derived SSTs are in turn used to drive a marine ecosystem model (see text for description) which provides information on potential socio-ecological impacts of future climate. (B) The Late Pliocene PRISM3 multiproxy SST reconstruction is used to drive the same marine ecological model, providing an alternative scenario for socioecological impacts of a potential future climate. Hatched pattern in northeast North Atlantic in panel (B) is a region where paleoclimate models tend to exhibit lower SST than those estimated by multiple proxies. (C) Example of relative biomass changes in the North Atlantic produced by the marine ecosystem model. IPSL climate model-derived (left) and PRISM proxy-driven (right) simulations. The columns represent selected functional groups: small pelagics; large benthopelagics; large phytoplankton; and small phytoplankton. The rows from top to bottom comprise the four model subregions: Polar-Subpolar (PSP); Mid-Atlantic (MAT); Mediterranean (MED); and Tropical-Subtropical (TST).
Marine ecosystem modeling
Ecological modeling stretches back to the foundations of ecology as a discipline. Modeling in some respects is the very genesis of ecology as a discipline separate from its foundations in economic philosophy. By the 18th century, awareness of the dependence of populations on environmental constraints had risen to the level of formal (if simplistic) dynamical modeling. These arguments are most famously exemplified by, if not exclusive to, Malthus’s writings (Turchin, 2001) on potential exponential growth in the absence of limiting environmental factors. Not long after, the logistic function model, again explicitly created in the context of considering environmental influences on population models, was introduced by Verhulst and Quetelet (Bacaër, 2011). From these origins, dynamic population modeling has grown increasingly sophisticated, incorporating key ecological interactions such as predator–prey dynamics (Wangersky, 1978) and trophic energy flows through ecosystems (Libralato et al., 2014).
Against the same socio-political background that Malthus was developing his version of a population growth model focused on change over time, others were establishing a means to estimate a current population based on incomplete observations. Laplace developed a ratio estimator to attempt a census of France contemporaneously to Malthus’ writings, though it is now recognized that this concept had been used even earlier, e.g., Graunt’s foundational investigations into the mortality statistics of 17th century London (Connor, 2022). Despite these earlier works, credit for the advent of population ratio estimators in ecology has traditionally been given to Danish fisheries scientist C.G. Johannes Petersen for his work estimating plaice (fish) abundance (Goudie and Goudie, 2007).
Dynamical modeling of population changes and statistical models for estimating population size not only formed the basis of ecology as a discipline but continue to play central roles in ecology in the context of conservation and resource management, providing the methodological basis for much of today’s fisheries science and marine ecology. In addition to these foundational modeling tools, conservation and resource management research is increasingly complemented by awareness of the interconnectedness of extant populations and ecosystems as well as the sheer scale and number of stressors (Halpern et al., 2008; Borja, 2014).
With global-scale stressors like overharvesting and climate change increasingly taking center stage (Cury et al., 2008; Halpern et al., 2008), management and conservation efforts have begun incorporating future climate projections into policy consideration. Habitat and species distribution models incorporate contemporary environmental observations as well as snapshots from future climate projections to inform policymakers (Cheung et al., 2009; Assis et al., 2018). The Fisheries and Marine Ecosystem Model Intercomparison Project (Fish-MIP) is an example of ecological modeling adopting a standardized model-intercomparison framework and comparing results driven by future climate model projections across ecological models to inform management and conservation (Warszawski et al., 2014; Tittensor et al., 2018).
This marine ecological model intercomparison framework allows decision-makers to explore the structural uncertainty associated with decisions and tradeoffs in the design of the ecological models used. Moreover, the Fish-MIP framework is designed so that these ecological models can be driven using the diverse archive of climate model projections from the Coupled Model Intercomparison Project (Taylor et al., 2012), not only informing decision-makers as to how ecosystems respond to different future emissions scenarios, but also to the structural uncertainty inherent to differences between climate models, and to how these differences may or may not interact with the structural uncertainty arising from the ecological modeling side. Jacobs (2015) further expanded upon this idea by incorporating paleoclimate data as an addition to, and comparison against, the climate model projection data suggested for Fish-MIP.
A regional marine ecosystem model was created specifically to interrogate potential impacts the proxy-model disagreement regarding North Atlantic Pliocene SST might have on future fisheries, a sector with high commercial, cultural, and political salience across local to international scales. This model used the Global Ocean model (Christensen et al., 2015) as a starting point. The 2015 version of the Global Ocean model consisted of 52 representative functional groups and was calibrated and validated using globally aggregated fish landings and environmental conditions. Practically, this meant model values in any given area were simply fractional/proportional to global values. To examine spatial differences in response to different drivers, the North Atlantic region was divided into four subregions based upon climatic/oceanographic similarity (Polar-Subpolar, Mid-Atlantic, Mediterranean, and Tropical-Subtropical), and functional group environmental preferences for each subregion were re-calibrated against historical catch as well as environmental data over the period 1950–2012 (Stock et al., 2014; Zeller et al., 2016).
The North Atlantic marine ecosystem model was then driven by climate model-derived future SST, in this case the Institute Pierre-Simon Laplace Climate Modelling Center’s IPSL-CM5A-LR under a high greenhouse gas emissions trajectory (RCP8.5). For comparison, the marine ecosystem model was also driven by PRISM3 paleontologically derived SSTs (Figure 2). While the overall warming from RCP8.5 (Meinshausen et al., 2020) would be significantly larger than Pliocene warming (relative to preindustrial conditions) if the climate model were allowed to fully equilibrate, during a transient simulation such as that performed in Jacobs (2015), the magnitude of globally-averaged change is comparable, allowing the spatial patterns rather than overall amounts of change to drive potential differences.
Discussion
As both the paleoclimate- and climate model-derived scenarios reflected large scale warming of the region of interest, there were broad commonalities across both. For example, colder region-based functional groups saw declines in both habitat extent and relative abundance, and the habitat extent of warmer region-based groups shifted poleward as temperatures previously experienced only in the tropics occurred at higher latitudes.
However, the distinct spatial patterns of change also produced some interesting differences. While both climate model- and PRISM-derived scenarios showed some northward expansion of the upper habitat extent for small pelagic tropical groups, overall habitat extent shrank in the model-derived scenario but extent increased in the PRISM-derived scenario, including an increase off the mid-Atlantic coast of the United States due to a simulated increase in available phytoplankton that did not occur in the climate model scenario. Both scenarios showed declines in large benthopelagic relative abundance in colder regions, however the PRISM simulation supported a higher overall relative abundance for this group (and ultimately a lower overall decline) despite a greater overall warming anomaly relative to the climate model scenario. One of the areas of greatest climate model and proxy SST mismatches for the MPWP, the Denmark Strait between Greenland and Iceland, also showed an increase in phytoplankton and small pelagic fish moving poleward in this area in the PRISM-derived that did not occur in the climate model-driven scenario.
Comparing the ecological model results from both the PRISM paleoclimate-derived and climate model-derived output can assist policymakers in understanding where commercial fishing and conservation strategies, previously based on expectations from climate model output alone, may be robust to additional information provided by paleoclimate. Conversely it may identify strategies that need to be revisited to address this new line of evidence.
As indicated above, while the discord between paleoclimate models and SST proxies is improving (Haywood et al., 2020; Lohmann et al., 2022) the degree of warming shown by proxy methods in the mid-to-high latitude North Atlantic is not captured by all models. We have shown how a deep–time reconstruction of Pliocene surface temperature, based upon paleoecological data, can be used to drive an ecosystem model as a complement to general circulation model temperature projections. This can potentially help policymakers avoid locking in resources that might mismatch the real-world changes we see with future warming. We suggest that this is a powerful tool for understanding the full range of potential future socio-ecological impacts when making decisions regarding conservation management and assessing biodiversity risk.
Data availability statement
Publicly availabl datasets were analyzed in this study. This data can be found here: Science Base (Dowsett, 2022): https://doi.org/10.5066/P9NTXDHW; Jacobs (2015): https://hdl.handle.net/1920/9716.
Author contributions
All authors listed have made a substantial, direct, and intellectual contribution to the work, and approved it for publication.
Funding
Funding for this work was provided by the U.S. Geological Survey Climate R&D Program.
Acknowledgments
We acknowledge the many individuals associated with the USGS PRISM Project over the past 25 years. The PRISM North Atlantic reconstruction is particularly due to the efforts of Tom Cronin, Dick Poore, Marci Robinson, and Kevin Foley. The ecological modeling work was made possible by many institutions and individuals. The authors gratefully acknowledge the Sea Around Us project (www.seaaroundus.org) at the University of British Columbia for providing historical landings data to calibrate the model, the Fish-MIP/ISI-MIP programs for access to the reanalysis and climate model output for model forcings, the Ecopath Research and Development Consortium, Joe Buszowski, and Villy Christensen for access and support for Ecopath, Ecosim, and Ecospace tools including the original Global Ocean model.
Conflict of interest
The authors declare that the research was conducted in the absence of any commercial or financial relationships that could be construed as a potential conflict of interest.
Publisher’s note
All claims expressed in this article are solely those of the authors and do not necessarily represent those of their affiliated organizations, or those of the publisher, the editors and the reviewers. Any product that may be evaluated in this article, or claim that may be made by its manufacturer, is not guaranteed or endorsed by the publisher.
References
Alexander, K., and Easterbrook, S. M. (2015). The software architecture of climate models: A graphical comparison of CMIP5 and EMICAR5 configurations. Geosci. Model Dev. 8, 1221–1232. doi: 10.5194/gmd-8-1221-2015
Allmon, W. D., Rosenberg, G., Portell, R. W., and Schindler, K. (1996). “Diversity of Pliocene-Recent mollusks in the western Atlantic: Extinction, origination, and environmental change,” in Evolution And Environment In Tropical America, eds J. B. C. Jackson, A. F. Budd, and A. G. Coates (Chicago, IL: University of Chicago Press), 217–302.
Assis, J., Tyberghein, L., Bosch, S., Verbruggen, H., Serrão, E. A., and De Clerck, O. (2018). Bio-ORACLE v2.0: Extending marine data layers for bioclimatic modelling. Glob. Ecol. Biogeogr. 27, 277–284. doi: 10.1111/geb.12693
Baatsen, M. L. J., von der Heydt, A. S., Kliphuis, M. A., Oldeman, A. M., and Weiffenbach, J. E. (2021). Warm mid-Pliocene conditions without high climate sensitivity: The CCSM4-Utrecht (CESM 1.0.5) contribution to the PlioMIP2. Clim. Past Discuss. 2021, 1–30. doi: 10.5194/cp-2021-140
Bacaër, N. (2011). “Verhulst and the logistic equation (1838),” in A Short History of Mathematical Population Dynamics, ed. N. Bacaër (London: Springer), 35–39.
Badger, M. P. S., Chalk, T. B., Foster, G. L., Bown, P. R., Gibbs, S. J., Sexton, P. F., et al. (2019). Insensitivity of alkenone carbon isotopes to atmospheric CO2 at low to moderate CO2 levels. Clim. Past 15, 539–554. doi: 10.5194/cp-15-539-2019
Barron, J. A. (1992). Pliocene paleoclimatic interpretation of DSDP Site 580 (NW Pacific) using diatoms. Mar. Micropaleontol. 20, 23–44. doi: 10.1016/0377-8398(92)90007-7
Barron, J. A. (1996). Diatom constraints on the position of the Antarctic Polar Front in the middle part of the Pliocene. Mar. Micropaleontol. 27, 195–213.
Boé, J. (2018). Interdependency in multimodel climate projections: Component replication and result similarity. Geophys. Res. Lett. 45, 2771–2779. doi: 10.1002/2017GL076829
Borja, A. (2014). Grand challenges in marine ecosystems ecology. Front. Mar. Sci. 1:1. doi: 10.3389/fmars.2014.00001
Braconnot, P., Harrison, S. P., Kageyama, M., Bartlein, P. J., Masson-Delmotte, V., Abe-Ouchi, A., et al. (2012). Evaluation of climate models using palaeoclimatic data. Nat. Clim. Chang. 2, 417–424. doi: 10.1038/nclimate1456
Burls, N. J., Bradshaw, C. D., De Boer, A. M., Herold, N., Huber, M., Pound, M., et al. (2021). Simulating miocene warmth: Insights from an opportunistic multi-model ensemble (MioMIP1). Paleoceanogr. Paleoclimatol. 36:e2020A004054. doi: 10.1029/2020PA004054
Chalk, T. B., Hain Mathis, P., Foster Gavin, L., Rohling Eelco, J., Sexton Philip, F., Badger Marcus, P. S., et al. (2017). Causes of ice age intensification across the Mid-Pleistocene Transition. Proc. Natl. Acad. Sci. U.S.A. 114, 13114–13119. doi: 10.1073/pnas.1702143114
Chan, W. L., and Abe-Ouchi, A. (2020). Pliocene Model Intercomparison Project (PlioMIP2) simulations using the Model for Interdisciplinary Research on Climate (MIROC4m). Clim. Past 16, 1523–1545. doi: 10.5194/cp-16-1523-2020
Chan, W.-L., Abe-Ouchi, A., and Ohgaito, R. (2011). Simulating the mid-Pliocene climate with the MIROC general circulation model: Experimental design and initial results. Geosci. Model Dev. 4, 1035–1049.
Chandan, D., and Peltier, W. R. (2017). Regional and global climate for the mid-Pliocene using the University of Toronto version of CCSM4 and PlioMIP2 boundary conditions. Clim. Past 13, 919–942. doi: 10.5194/cp-13-919-2017
Chandan, D., and Peltier, W. R. (2018). On the mechanisms of warming the mid-Pliocene and the inference of a hierarchy of climate sensitivities with relevance to the understanding of climate futures. Clim. Past 14, 825–856. doi: 10.5194/cp-14-825-2018
Chandler, M. A., Rind, D., and Thompson, R. (1994). Joint investigations of the middle Pliocene climate II: GISS GCM Northern Hemisphere results. Glob. Planet. Chang. 9, 197–219. doi: 10.1016/0921-8181(94)90016-7
Chandler, M. A., Sohl, L. E., Jonas, J. A., Dowsett, H. J., and Kelley, M. (2013). Simulations of the mid-PlioceneWarm Period using two versions of the NASA/GISS ModelE2-R Coupled Model. Geosci. Model Dev. 6, 517–531. doi: 10.5194/gmd-6-517-2013
Cheung, W. W. L., Lam, V. W. Y., Sarmiento, J. L., Kearney, K., Watson, R., and Pauly, D. (2009). Projecting global marine biodiversity impacts under climate change scenarios. Fish Fish. 10, 235–251. doi: 10.1111/j.1467-2979.2008.00315.x
Christensen, V., Coll, M., Buszowski, J., Cheung, W. W. L., Frölicher, T., Steenbeek, J., et al. (2015). The global ocean is an ecosystem: Simulating marine life and fisheries. Glob. Ecol. Biogeogr. 24, 507–517. doi: 10.1111/geb.12281
Connor, H. (2022). John Graunt F.R.S. (1620-74): The founding father of human demography, epidemiology and vital statistics. J. Med. Biogr. [Epub ahead of print]. doi: 10.1177/09677720221079826
Cronin, T. M. (1988). Evolution of marine climates of the U.S. Atlantic Coast during the past four million years. Philos. Trans. R. Soc. Ser B Biol. Sci. 318, 661–678.
Cronin, T. M., and Dowsett, H. J. (1996). “Biotic and oceanographic response to the Pliocene closing of the Central American isthmus,” in Evolution And Environment In Tropical America, eds J. B. C. Jackson, A. F. Budd, and A. G. Coates (Chicago, IL: University of Chicago Press), 76–104.
Cury, P. M., Shin, Y.-J., Planque, B., Durant, J. M., Fromentin, J.-M., Kramer-Schadt, S., et al. (2008). Ecosystem oceanography for global change in fisheries. Trends Ecol. Evol. 23, 338–346. doi: 10.1016/j.tree.2008.02.005
de la Vega, E., Chalk, T. B., Wilson, P. A., Bysani, R. P., and Foster, G. L. (2020). Atmospheric CO2 during the Mid-Piacenzian Warm Period and the M2 glaciation. Sci. Rep. 10:11002. doi: 10.1038/s41598-020-67154-8
de Nooijer, W., Zhang, Q., Li, Q., Zhang, Q., Li, X., Zhang, Z., et al. (2020). Evaluation of Arctic warming in mid-Pliocene climate simulations. Clim. Past 16, 2325–2341. doi: 10.5194/cp-16-2325-2020
Dolan, A. M., Koenig, S. J., Hill, D. J., Haywood, A. M., and DeConto, R. M. (2012). Pliocene Ice Sheet Modelling Intercomparison Project (PLISMIP) – experimental design. Geosci. Model Dev. 5, 963–974. doi: 10.5194/gmd-5-963-2012
Dowsett, H. J. (2022). PRISM3 Pliocene Global Sea Surface Temperature Reconstruction. Virginia: U. S. Geological Survey Data Release, doi: 10.5066/P9NTXDHW
Dowsett, H. J., Robinson, M. M., Stoll, D. K., Foley, K. M., Johnson, A. L. A., Williams, M., et al. (2013b). The PRISM (Pliocene Palaeoclimate) reconstruction: Time for a paradigm shift. Philos. Trans. R. Soc. 371, 1–24. doi: 10.1098/rsta.2012.0524
Dowsett, H. J., Foley, K. M., Stoll, D. K., Chandler, M. A., Sohl, L. E., Bentsen, M., et al. (2013a). Sea surface temperature of the mid-piacenzian ocean: A data-model comparison. Sci. Rep. 3, 1–8. doi: 10.1038/srep02013
Dowsett, H. J., Robinson, M. M., and Foley, K. M. (2009). Pliocene three-dimensional global ocean temperature reconstruction. Clim. Past 5, 769–783. doi: 10.5194/cp-5-769-2009
Dowsett, H. J., Robinson, M. M., Foley, K. M., Herbert, T. D., Otto-Bliesner, B. L., and Spivey, W. (2019). The mid-Piacenzian of the North Atlantic Ocean. Stratigraphy 16, 119–144. doi: 10.29041/strat.16.3.119-144
Dowsett, H. J., Robinson, M. M., Haywood, A. M., Hill, D. J., Dolan, A. M., Stoll, D. K., et al. (2012). Assessing confidence in Pliocene sea surface temperatures to evaluate predictive models. Nat. Clim. Chang. 2, 365–371. doi: 10.1038/NCLIMATE1455
Dowsett, H., Dolan, A., Rowley, D., Moucha, R., Forte, A. M., Mitrovica, J. X., et al. (2016). The PRISM4 (mid-Piacenzian) paleoenvironmental reconstruction. Clim. Past 12, 1519–1538. doi: 10.5194/cp-12-1519-2016
Dowsett, H., Robinson, M., Haywood, A., Salzmann, U., Hill, D., Sohl, L., et al. (2010). The PRISM3D paleoenvironmental reconstruction. Stratigraphy 7, 123–139.
Dyez, K. A., Hönisch, B., and Schmidt, G. A. (2018). Early Pleistocene Obliquity-Scale pCO2 Variability at ˜1.5 Million Years Ago. Paleoceanogr. Paleoclimatol. 33, 1270–1291. doi: 10.1029/2018PA003349
Feng, R., Bhattacharya, T., Otto-Bliesner, B. L., Brady, E. C., Haywood, A. M., Tindall, J. C., et al. (2022). Past terrestrial hydroclimate sensitivity controlled by Earth system feedbacks. Nat. Commun. 13:1306. doi: 10.1038/s41467-022-28814-7
Foster, G. L. (2008). Seawater pH, pCO2 and [lsqb][CO32–][rsqb] variations in the Caribbean Sea over the last 130 kyr: A boron isotope and B/Ca study of planktic foraminifera. Earth Planet. Sci. Lett. 271, 254–266.
Gladenkov, Y. B., Barinov, K. B., Basilian, A. E., and Cronin, T. M. (1991). Stratigraphy and paleoceanography of Pliocene deposits of Karaginsky Island, eastern Kamchatka. U.S.S.R. Quat. Sci. Rev. 10, 239–245. doi: 10.1016/0277-3791(91)90022-M
Goudie, I. B. J., and Goudie, M. (2007). Who captures the marks for the Petersen estimator? J. R. Stat. Soc. Ser. A 170, 825–839. doi: 10.1111/j.1467-985X.2007.00479.x
Greenop, R., Foster, G. L., Wilson, P. A., and Lear, C. H. (2014). Middle Miocene climate instability associated with high-amplitude CO2 variability. Paleoceanography 29, 845–853. doi: 10.1002/2014PA002653
Halpern, B. S., Walbridge, S., Selkoe Kimberly, A., Kappel Carrie, V., Micheli, F., D’Agrosa, C., et al. (2008). A Global Map of Human Impact on Marine Ecosystems. Science 319, 948–952. doi: 10.1126/science.1149345
Han, Z., Zhang, Q., Li, Q., Feng, R., Haywood, A. M., Tindall, J. C., et al. (2021). Evaluating the large-scale hydrological cycle response within the Pliocene Model Intercomparison Project Phase 2 (PlioMIP2) ensemble. Clim. Past 17, 2537–2558. doi: 10.5194/cp-17-2537-2021
Hausfather, Z., Drake, H. F., Abbott, T., and Schmidt, G. A. (2020). Evaluating the Performance of Past Climate Model Projections. Geophys. Res. Lett. 47:e2019GL085378. doi: 10.1029/2019GL085378
Hayhoe, K., Edmonds, J., Kopp, R. E., LeGrande, A. N., Sanderson, B. M., Wehner, M. F., et al. (2017). “Climate models, scenarios, and projections,” in Climate Science Special Report: Fourth National Climate Assessment, eds D. J. Wuebbles, D. W. Fahey, K. A. Hibbard, D. J. Dokken, B. C. Stewart, and T. K. Maycock (Washington, DC: U.S. Global Change Research Program).
Haywood, A. M., and Valdes, P. J. (2004). Modelling middle Pliocene warmth: Contribution of atmosphere, oceans and cryosphere. Earth Planet. Sci. Lett. 218, 363–377. doi: 10.1016/S0012-821X(03)00685-X
Haywood, A. M., Dowsett, H. J., and Dolan, A. M. (2016). Integrating geological archives and climate models for the mid-Pliocene warm period. Nat. Commun. 7:10646. doi: 10.1038/ncomms10646
Haywood, A. M., and Dowsett, H. J., PlioMIP1, and PlioMIP2 (2021). PlioMIP: The Pliocene Model Intercomparison Project. Past Glob. Chang. Mag. 29, 92–93. doi: 10.22498/pages.29.2.92
Haywood, A. M., Tindall, J. C., Dowsett, H. J., Dolan, A. M., Foley, K. M., Hunter, S. J., et al. (2020). The Pliocene Model Intercomparison Project Phase 2: Large-scale climate features and climate sensitivity. Clim. Past 16, 2095–2123. doi: 10.5194/cp-16-2095-2020
Haywood, A. M., Valdes, P. J., and Sellwood, B. W. (2000). Global scale palaeoclimate reconstruction of the middle Pliocene climate using the UKMO GCM: Initial results. Glob. Planet. Chang. 25, 239–256. doi: 10.1016/S0921-8181(00)00028-X
Hill, D. J. (2009). Modelling Earth’s Cryosphere during Pliocene Warm Peak. Ph.D. thesis, Bristol: University of Bristol.
Hönisch, B., Hemming, N. G., Archer, D., Siddall, M., and McManus, J. F. (2009). Atmospheric Carbon Dioxide Concentration Across the Mid-Pleistocene Transition. Science 324, 1551–1554. doi: 10.1126/science.1171477
Hopcroft, P. O., Ramstein, G., Pugh, T. A. M., Hunter, S. J., Murguia-Flores, F., Quiquet, A., et al. (2020). Polar amplification of Pliocene climate by elevated trace gas radiative forcing. Proc. Natl. Acad. Sci.U.S.A. 117:23401. doi: 10.1073/pnas.2002320117
Hutson, W. H. (1980). The Agulhas Current during the Late Pleistocene: Analysis of Modern Faunal Analogs. Science 207, 64–66. doi: 10.1126/science.207.4426.64
Imbrie, J., and Kipp, N. G. (1971). “A New Micropaleontological method for paleoclimatology: Application to a Late Pleistocene Caribbean core,” in The Late Cenozoic Glacial Ages, ed. K. K. Turekian (New Haven, CT: Yale University Press), 71–181.
IPCC (2013). “IPCC, 2013,” in Climate Change 2013: The Physical Science Basis. Contribution of Working Group I to the Fifth Assessment Report of the Intergovernmental Panel on Climate Change, eds T. F. D. Stocker, G.-K. Qin, M. Plattner, S. K. Tignor, J. Allen, A. Boschung, et al. (Cambridge: Cambridge University Press).
IPCC (2021). “Summary for Policymakers,” in Climate Change 2021: The Physical Science Basis. Contribution of Working Group I to the Sixth Assessment Report of the Intergovernmental Panel on Climate Change, eds V. P. Masson-Delmotte, A. Zhai, S. L. Pirani, C. Connors, S. Péan, N. Berger, et al. (Cambridge: Cambridge University Press).
Jacobs, P. H. (2015). Evaluating Effects of Climate Change on Nekton Distribution in the North Atlantic Using Ecosystem Models: Climate Model-and Paleoclimate-Derived Temperature Simulations Compared. Ph.D. thesis, Fairfax: George Mason University.
Johnson, A. L. A., Valentine, A. M., Leng, M. J., Schöne, B. R., and Sloane, H. J. (2019). Life history, environment and extinction of the scallop Carolinapecten Eboreus (Conrad) In the Plio-Pleistocene of the U.S. eastern seaboard. Palaios 34, 49–70. doi: 10.2110/palo.2018.056
Johnson, A. L. A., Valentine, A., Leng, M. J., Sloane, H. J., Schöne, B. R., and Balson, P. S. (2017). Isotopic temperatures from the early and mid-Pliocene of the US middle Atlantic coastal plain, and their implications for the cause of regional marine climate change. Palaios 32, 250–269. doi: 10.2110/palo.2016.080
Kamae, Y., and Ueda, H. (2012). Mid-Pliocene global climate simulation with MRI-CGCM2.3: Set-up and initial results of PlioMIP Experiments 1 and 2. Geosci. Model Dev. 5, 793–808. doi: 10.5194/gmd-5-793-2012
Knutti, R., Masson, D., and Gettelman, A. (2013). Climate model genealogy: Generation CMIP5 and how we got there. Geophys. Res. Lett. 40, 1194–1199. doi: 10.1002/grl.50256
Koenig, S. J., Dolan, A. M., de Boer, B., Stone, E. J., Hill, D. J., DeConto, R. M., et al. (2015). Ice sheet model dependency of the simulated Greenland Ice Sheet in the mid-Pliocene. Clim. Past 11, 369–381. doi: 10.5194/cp-11-369-2015
Libralato, S., Pranovi, F., Stergiou, K. I., and Link, J. (2014). Trophodynamics in marine ecology: 70 years after Lindeman. Mar. Ecol. Prog. Ser. 512, 1–7.
Lohmann, G., Knorr, G., Hossain, A., and Stepanek, C. (2022). Effects of CO2 and ocean mixing on Miocene and Pliocene temperature gradients. Paleoceanogr. Paleoclimatol. 37:e2020A003953. doi: 10.1029/2020PA003953
Martinez-Boti, M. A., Marino, G., Foster, G. L., Ziveri, P., Henehan, M. J., Rae, J. W. B., et al. (2015). Boron isotope evidence for oceanic carbon dioxide leakage during the last deglaciation. Nature 518, 219–222. doi: 10.1038/nature14155
Meinshausen, M., Nicholls, Z. R. J., Lewis, J., Gidden, M. J., Vogel, E., Freund, M., et al. (2020). The shared socio-economic pathway (SSP) greenhouse gas concentrations and their extensions to 2500. Geosci. Model Dev. 13, 3571–3605. doi: 10.5194/gmd-13-3571-2020
O’Brien, C. L., Robinson, S. A., Pancost, R. D., Sinninghe Damsté, J. S., Schouten, S., Lunt, D. J., et al. (2017). Cretaceous sea-surface temperature evolution: Constraints from TEX86 and planktonic foraminiferal oxygen isotopes. Earth-Sci. Rev. 172, 224–247. doi: 10.1016/j.earscirev.2017.07.012
Otto-Bliesner, B., Jahn, A., Feng, R., Brady, E., Hu, A., and Löfverström, M. (2017). Changes in arctic gateways amplify north atlantic warming in the late pliocene: Arctic gateways and pliocene climate. Geophys. Res. Lett. 44, 957–964. doi: 10.1002/2016GL071805
Pagani, M., Liu, Z. H., LaRiviere, J., and Ravelo, A. C. (2010). High Earth-system climate sensitivity determined from Pliocene carbon dioxide concentrations. Nat. Geosci. 3, 27–30. doi: 10.1038/ngeo724
Pound, M. J., Tindall, J., Pickering, S. J., Haywood, A. M., Dowsett, H. J., and Salzmann, U. (2014). Late Pliocene lakes and soils: A global data set for the analysis of climate feedbacks in a warmer world. Clim. Past 10, 167–180. doi: 10.5194/cp-10-167-2014
Rae, J. W. B., Zhang, Y. G., Liu, X., Foster, G. L., Stoll, H. M., and Whiteford, R. D. M. (2021). Atmospheric CO2 over the Past 66 Million Years from Marine Archives. Annu. Rev. Earth Planet. Sci. 49, 609–641. doi: 10.1146/annurev-earth-082420-063026
Robinson, M. M., Dowsett, H. J., Foley, K. M., and Riesselman, C. R. (2018). PRISM Marine sites—The History of PRISM sea Surface Temperature Estimation. Open-File Report 2018-1148. Reston, VA: U.S. Geological Survey. doi: 10.3133/ofr20181148
Rowley, D. B., Forte, A. M., Moucha, R., Mitrovica, J. X., Simmons, N. A., and Grand, S. P. (2013). Dynamic Topography Change of the Eastern United States Since 3 Million Years Ago. Science 340:1560. doi: 10.1126/science.1229180
Salzmann, U., Dolan, A. M., Haywood, A. M., Chan, W.-L., Voss, J., Hill, D. J., et al. (2013). Challenges in quantifying Pliocene terrestrial warming revealed by data-model discord. Nat. Clim. Chang. 3, 969–974.
Salzmann, U., Haywood, A. M., Lunt, D. J., Valdes, P. J., and Hill, D. J. (2008). A new global biome reconstruction and data-model comparison for the Middle Pliocene. Glob. Ecol. Biogeogr. 17, 432–447. doi: 10.1111/j.1466-8238.2008.00381.x
Saupe, E. E., Hendricks, J. R., Portell, R. W., Dowsett, H. J., Haywood, A. M., Hunter, S. J., et al. (2014). Macroevolutionary consequences of profound climate change on niche evolution in marine molluscs over the past three million years. Proc. R. Soc. B 281:20141995. doi: 10.1098/rspb.2014.1995
Saupe, E. E., Qiao, H., Hendricks, J. R., Portell, R. W., Hunter, S. J., Soberón, J., et al. (2015). Niche breadth and geographic range size as determinants of species survival on geological time scales. Glob. Ecol. Biogeogr. 24, 1159–1169. doi: 10.1111/geb.12333
Sloan, L. C., Crowley, T. J., and Pollard, D. (1996). Modeling of middle Pliocene climate with the NCAR GENESIS general circulation model. Mar. Micropaleontol. 27, 51–61. doi: 10.1016/0377-8398(95)00063-1
Sosdian, S. M., Greenop, R., Hain, M. P., Foster, G. L., Pearson, P. N., and Lear, C. H. (2018). Constraining the evolution of Neogene ocean carbonate chemistry using the boron isotope pH proxy. Earth Planet. Sci. Lett. 498, 362–376. doi: 10.1016/j.epsl.2018.06.017
Stepanek, C., and Lohmann, G. (2012). Modelling mid-Pliocene climate with COSMOS. Geosci. Model Dev. 5, 1221–1243.
Stock, C. A., Dunne, J. P., and John, J. G. (2014). Global-scale carbon and energy flows through the marine planktonic food web: An analysis with a coupled physical–biological model. Prog. Oceanogr. 120, 1–28. doi: 10.1016/j.pocean.2013.07.001
Taylor, K. E., Stouffer, R. J., and Meehl, G. A. (2012). An overview of CMIP5 and the experiment design. Bull. Am. Meteorol. Soc. 93, 485–498. doi: 10.1175/BAMS-D-11-00094.1
Tian, B., and Dong, X. (2020). The Double-ITCZ Bias in CMIP3, CMIP5, and CMIP6 Models Based on Annual Mean Precipitation. Geophys. Res. Lett. 47:e2020GL087232. doi: 10.1029/2020GL087232
Tittensor, D. P., Eddy, T. D., Lotze, H. K., Galbraith, E. D., Cheung, W., Barange, M., et al. (2018). A protocol for the intercomparison of marine fishery and ecosystem models: Fish-MIP v1.0. Geosci. Model Dev. 11, 1421–1442. doi: 10.5194/gmd-11-1421-2018
Turchin, P. (2001). Does population ecology have general laws? Oikos 94, 17–26. doi: 10.1034/j.1600-0706.2001.11310.x
Wangersky, P. J. (1978). Lotka-Volterra Population Models. Annu. Rev. Ecol. Syst. 9, 189–218. doi: 10.1146/annurev.es.09.110178.001201
Warszawski, L., Frieler, K., Huber, V., Piontek, F., Serdeczny, O., and Schewe, J. (2014). The Inter-Sectoral Impact Model Intercomparison Project (ISI–MIP): Project framework. Proc. Natl. Acad. Sci. 111, 3228–3232. doi: 10.1073/pnas.1312330110
Yan, Q., Zhang, Z., Wang, H., Gao, Y., and Zheng, W. (2012). Set-up and preliminary results of mid-Pliocene climate simulations with CAM3.1. Geosci. Model Dev. 5, 289–297.
Yasuhara, M., Hunt, G., Dowsett, H. J., Robinson, M. M., and Stoll, D. K. (2012). Latitudinal species diversity gradient of marine zooplankton for the last three million years. Ecol. Lett. 15, 1174–1179. doi: 10.1111/j.1461-0248.2012.01828.x
Zachos, J. C., Wara Michael, W., Bohaty, S., Delaney Margaret, L., Petrizzo Maria, R., Brill, A., et al. (2003). A transient rise in tropical sea surface temperature during the paleocene-eocene thermal maximum. Science 302, 1551–1554. doi: 10.1126/science.1090110
Zeller, D., Palomares, M. L. D., Tavakolie, A., Ang, M., Belhabib, D., Cheung, W. W. L., et al. (2016). Still catching attention: Sea Around Us reconstructed global catch data, their spatial expression and public accessibility. Mar. Policy 70, 145–152. doi: 10.1016/j.marpol.2016.04.046
Zhang, Y. G., Pagani, M., Liu, Z., Bohaty, S. M., and DeConto, R. M. (2013). A 40-million-year history of atmospheric CO2. Philos. Trans. R. Soc. A 371:20130096. doi: 10.1098/rsta.2013.0096
Zhang, Z. S., Nisancioglu, K., Bentsen, M., Tjiputra, J., Bethke, I., Yan, Q., et al. (2012). Pre-industrial and mid-Pliocene simulations with NorESM-L. Geosci. Model Dev. 5, 523–533. doi: 10.5194/gmd-5-523-2012
Zhang, Z., and Yan, Q. (2012). Pre-industrial and mid-Pliocene simulations with NorESM-L: AGCM simulations. Geosci. Model Dev. 5, 1033–1043.
Zhu, J., Otto-Bliesner, B. L., Brady, E. C., Poulsen, C. J., Tierney, J. E., Lofverstrom, M., et al. (2021). Assessment of equilibrium climate sensitivity of the community earth system model version 2 through simulation of the last glacial maximum. Geophys. Res. Lett. 48:e2020GL091220. doi: 10.1029/2020GL091220
Keywords: Pliocene, PRISM, paleoclimate, paleoecology, FishMIP, North Atlantic, PlioMIP
Citation: Dowsett H, Jacobs P and de Mutsert K (2022) Using paleoecological data to inform decision making: A deep-time perspective. Front. Ecol. Evol. 10:972179. doi: 10.3389/fevo.2022.972179
Received: 17 June 2022; Accepted: 26 July 2022;
Published: 11 August 2022.
Edited by:
Chris Schneider, University of Alberta, CanadaReviewed by:
Bruce S. Lieberman, University of Kansas, United StatesAndrew Johnson, University of Derby, United Kingdom
Copyright © 2022 Dowsett, Jacobs and de Mutsert. This is an open-access article distributed under the terms of the Creative Commons Attribution License (CC BY). The use, distribution or reproduction in other forums is permitted, provided the original author(s) and the copyright owner(s) are credited and that the original publication in this journal is cited, in accordance with accepted academic practice. No use, distribution or reproduction is permitted which does not comply with these terms.
*Correspondence: Harry Dowsett, aGRvd3NldHRAdXNncy5nb3Y=
†These authors have contributed equally to this work