 Mi Yoon Chung1
 Juha Merilä2,3
 Jialiang Li4
 Kangshan Mao4,5
 Jordi López-Pujol6,7
 Yoshihiko Tsumura8
 Myong Gi Chung9*
- 1Department of Biological Sciences, Chungnam National University, Daejeon, Republic of Korea
- 2Ecological Genetics Research Unit, Organismal and Evolutionary Biology Research Program, Faculty of Biological and Environmental Sciences, University of Helsinki, Helsinki, Finland
- 3Area of Ecology and Biodiversity, School of Biological Sciences, The University of Hong Kong, Hong Kong, Hong Kong SAR, China
- 4Key Laboratory for Bio-Resources and Eco-Environment of Ministry of Education, College of Life Science, Sichuan University, Chengdu, China
- 5Key Laboratory of Hydraulics and Mountain River Engineering, Sichuan University, Chengdu, China
- 6Botanic Institute of Barcelona (IBB), CSIC-Ajuntament de Barcelona, Barcelona, Catalonia, Spain
- 7Escuela de Ciencias Ambientales, Universidad Espíritu Santo (UEES), Samborondón, Ecuador
- 8Faculty of Life and Environmental Sciences, University of Tsukuba, Tsukuba, Ibaraki, Japan
- 9Division of Life Science and the RINS, Gyeongsang National University, Jinju, Republic of Korea
Genetic diversity is a prerequisite for evolutionary change in all kinds of organisms. It is generally acknowledged that populations lacking genetic variation are unable to evolve in response to new environmental conditions (e.g., climate change) and thus may face an increased risk of extinction. Although the importance of incorporating genetic diversity into the design of conservation measures is now well understood, less attention has been paid to the distinction between neutral (NGV) and adaptive (AGV) genetic variation. In this review, we first focus on the utility of NGV by examining the ways to quantify it, reviewing applications of NGV to infer ecological and evolutionary processes, and by exploring its utility in designing conservation measures for plant populations and species. Against this background, we then summarize the ways to identify and estimate AGV and discuss its potential use in plant conservation. After comparing NGV and AGV and considering their pros and cons in a conservation context, we conclude that there is an urgent need for a better understanding of AGV and its role in climate change adaptation. To date, however, there are only a few AGV studies on non-model plant species aimed at deciphering the genetic and genomic basis of complex trait variation. Therefore, conservation researchers and practitioners should keep utilizing NGV to develop relevant strategies for rare and endangered plant species until more estimates of AGV are available.
1. Introduction
Major sources of genetic variation include mutations, gene flow, and sexual reproduction. Mutations in DNA produce genetic variation by altering the genes of individuals in a population. Gene flow introduces new genetic variation [i.e., partial (selective introgression—some parts of gene flow may be selected against) or overall genome-wide variation] as individuals with new, different gene combinations migrate into a local population, mate with local individuals, and successfully produce offspring. Sexual reproduction increases genetic variation because of recombination and new combinations of alleles not present in either of the parental individuals are produced. The genetic variation of a given population or an entire species is referred to as “genetic diversity.” In other words, genetic diversity refers to the variation in the range of different inherited traits or macromolecules within a population or a species. Most researchers agree that genetic diversity is crucial because it helps to maintain the population’s adaptability in the face of diseases, pests, climate change, and other stressors (Fisher, 1930; Dobzhansky, 1937; Pobke, 2007; Anderson et al., 2011; Schoville et al., 2012; Hoffmann et al., 2021). Genetic diversity is also known to have an impact on population persistence (e.g., Saccheri et al., 1998). When the environment changes, a population with higher genetic diversity is more likely to be adapted to the new environment than one with less variation. Thus, preserving a species’ genetic diversity could improve its chances of surviving over evolutionary time. For the ease of upcoming discussions, a glossary of pertinent terms of population genetics and conservation genetics cited in this review is given in Supplementary material.
Information on the genetic diversity of a population or a species can be derived from either genotypic [mostly DNA-based, but also allozymes (allelic variants of enzymes)] or phenotypic (quantitative) data (Spitze, 1993; Holderegger et al., 2006; Kirk and Freeland, 2011). The framework to obtain genetic information from genotypic data is population genetics, while the framework to analyze phenotypic data is quantitative genetics. Genotypic data can be subdivided into “traditional” markers [e.g., allozymes, amplified fragment length polymorphisms (AFLPs), inter-simple sequence repeats (ISSRs), and microsatellites (SSRs)] and next-generation sequencing (NGS) information (Allendorf, 2017). Traditional markers are often restricted in number, although AFLPs can provide up to a few thousand markers that are distributed randomly across the genome. They are supposed to be “neutral” (and, thus, they are called “neutral genetic variation,” NGV), but this is not always the case (Schoville et al., 2012). NGS routinely provides tens of thousands to millions of single nucleotide polymorphisms (SNPs) that cover all (whole genome sequencing) or a substantial part of the genome (they are thus called “genomic”) and can be neutral or adaptive (“adaptive genetic variation,” AGV; Schoville et al., 2012). The pros and cons of each type of marker have been thoroughly reviewed and discussed (Mondini et al., 2009; Kirk and Freeland, 2011; Allendorf, 2017); thus, the decision of which marker to use should be based primarily on objective grounds (Schlötterer, 2004). NGV does not directly influence individuals’ fitness, which means that different alleles in the marker loci do not deliver any advantage or disadvantage to individuals. In contrast, by definition, AGV affects the fitness of both individuals and populations. Hence, the AGV of a population or species is essential for its performance and fitness when facing changing environmental conditions. In this regard, studies on AGV are broadly within the scope of (modern) ecological genetics/genomics (a sub-field of molecular ecology), defined as “the study of evolutionary processes, especially adaptation by natural selection, in an ecological context to account for phenotypic patterns observed in nature” (Wade, 2021).
Still, the term “genetic diversity (or variation)” is often used without the qualifiers “neutral” or “adaptive”—it is left to the judgment of readers to infer the nature of the diversity in study contents. This is also understandable under the notion that, as discussed below, evolutionary biologists and conservation geneticists value genetic diversity because the variation of what is neutral now can be adaptive when conditions change (“temporal conditional neutrality,” de Lafontaine et al., 2018), although such distinction is often neglected by non-specialists (Holderegger et al., 2006). We may recall the classic case of the peppered moth (Biston betularia)—the black morph is adaptive in an industrial environment but lethal in a natural one (Cook et al., 2012). Likewise, heavy metal tolerant genotypes are highly adaptive in heavy metal contaminated soils but at disadvantage otherwise (Antonovics et al., 1971). There are also examples where some alleles/genotypes are favored in some environmental conditions but neutral otherwise (Futuyma and Kirkpatrick, 2017). Indeed, genes can be classified as neutral or adaptive, depending on whether they have an impact on the fitness of the individuals that bear them (adaptive) or not (neutral), but the difference is more subtle and context dependent. The selection coefficient (which measures the “adaptivity”) can vary from almost zero to infinity and depends on the environmental settings (i.e., a gene can be neutral in some environment and adaptive in another), population size, and the genetic composition of the population. Thus, the same gene can be neutral, quasi-neutral, somewhat adaptive, or lethal, depending on the conditions. One important point here is that there is no way to tell if a gene is irrelevant for future adaptation, and thus, neutral and adaptive diversities are hard to define.
Most conservation biologists acknowledge the usefulness of NGV for conservation and restoration purposes in plants (e.g., Hamrick and Godt, 1996a; Neale, 2012; Ottewell et al., 2016; Whitlock et al., 2016; Chung et al., 2020). These researchers are, thus, implicitly assuming that the levels of NGV [e.g., percentage of polymorphic loci (%PN; hereafter “N” indicates neutral), allelic richness (AR) or Hardy–Weinberg (H–W) expected heterozygosity (He-N)] would be indicative of demographic factors that also affect the levels of AGV [but see also (García-Dorado and Caballero, 2021; Teixeira and Huber, 2021) for the debate on the traditional assumption that NGV would be a proxy for AGV; see also section “Controversy over the similarity between NGV and AGV” later]. These parameters, coupled with Wright (1951) FST-N (or GST-N; Nei, 1973, 1978) (proportion of variation between populations at neutral marker loci), have been widely used to develop conservation strategies and to implement appropriate actions (Hamrick and Godt, 1996a,b; Toro and Caballero, 2005; Rivers et al., 2014; Frankham, 2015; Haig et al., 2016; Ottewell et al., 2016; Allendorf, 2017; see Table 1 for the definition of parameters measuring neutral and adaptive genetic diversity and structure in seed plants). The two commonly used metrics for estimating NGV (He-N and FST-N or GST-N) are key parameters that can be directly linked to the “small population” paradigm (Ellstrand and Elam, 1993; Frankham, 1996) and the concept of “extinction vortex” (A and F vortices; Gilpin and Soulé, 1986; but see Teixeira and Huber, 2021). Reviews based on allozymes have revealed that some life-history and ecological traits such as life form, breeding system, geographic range, and seed dispersal mechanism significantly influence the values of He-N and GST-N in seed plant species (Hamrick and Godt, 1996a). Conservation practitioners could use the robust allozyme genetic diversity databases (>700 species) to develop conservation strategies for plant species that lack any genetic information; this recommendation should only be followed if there is absolutely no other genetic information available.
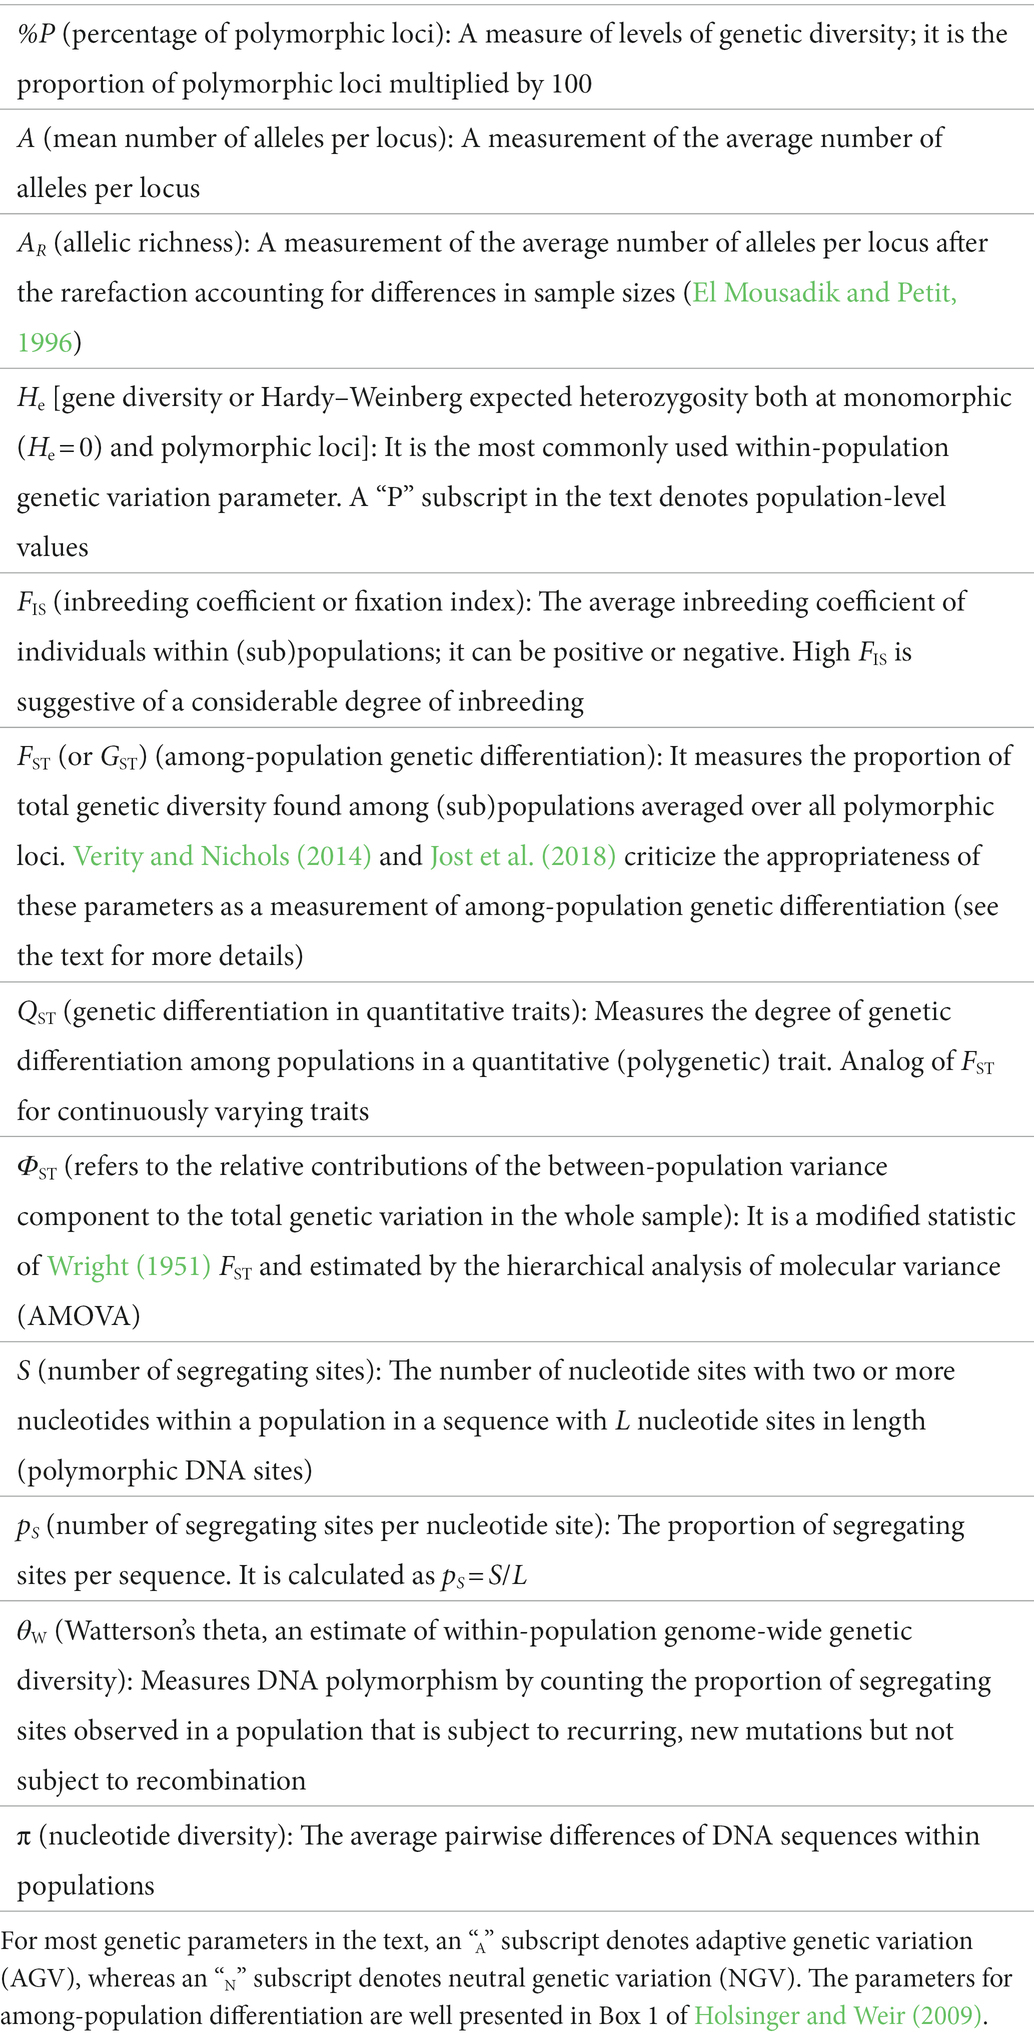
Table 1. Definition of population genetic terms for seed plants cited in the review.
Traditionally, AGV has been quantified in plants through common garden and reciprocal transplant experiments by assessing broad-sense (H2) and narrow-sense heritabilities (h2) within populations for a specific quantitative trait or by estimating QST, an analog to FST, for among-population divergence in a trait (reviewed in Holderegger et al., 2006). More recently, some researchers (Fitzpatrick and Keller, 2015; Jordan et al., 2017), using genomic (AGV) and environmental data [e.g., genomic offset (genomic vulnerability)], have assessed the degree of (mal)adaptation of focal populations to their new environmental conditions to gain insights to their conservation (for its prospects and limitations, see Hoffmann et al., 2021; Rellstab et al., 2021).
We are currently facing a critical time to preserve the genetic diversity and resources of plants due to global warming and habitat destruction. Therefore, it is timely to discuss the applications of NGV and AGV to the conservation of rare and endangered plants or those susceptible to changing environmental conditions. This in particular is desirable from the view of the gap between academic research and its implementation in conservation practice (Holderegger et al., 2019). To bridge this gap, it can be conducive to providing an overview covering both NGV and AGV and their utility in the conservation biology of plants. In this review, we first introduce the approaches how to estimating NGV [based on (putatively) neutral markers] and AGV (based on quantitative traits and single genes or genomic regions underlying local adaptation). Next, we briefly discuss their applications to the conservation and management of threatened plant species. We further introduce the relationship between NGV and AGV and the controversy over their similarity. We close this review by recommending using NGV—through traditional neutral markers—to conservation ends if genomic data (e.g., SNPs) are not available for a given plant species and by proposing future research directions. We hope that this overview would lessen the gap between genetic information (science) and its application (practice) to the conservation of rare and endangered plant species.
2. Estimation of neutral and adaptive genetic diversity
2.1. Neutral genetic diversity
He-N (the expected heterozygosity or evenness of genetic diversity; Table 1) is central for neutral population genetics because its calculation is based on the assumption that the population studied is under H–W equilibrium (i.e., random mating and absence of perturbing forces such as selection, genetic drift, mutation, and migration; Waples, 2015) and, thus, it allows to compare populations under very different conditions. Thus, He-N would be more useful when one is comparing levels of genetic diversity between populations or species. He-N is a composite metric that summarizes genetic variation at the allele level. This parameter, which is often referred to as “genetic diversity” or “gene diversity,” is calculated as He-N = 1 – Σpi2 (where pi refers to the frequency of the ith allele at a locus) averaged over all loci, including monomorphic loci. He-N is a function of the proportion of polymorphic loci, the number of alleles per polymorphic locus, and the evenness of allele frequencies within populations or species. It is probably the most employed index of NGV for neutral marker-based data (including SNPs) because it summarizes the fundamental genetic variation of a population or a species in a single statistic (Berg and Hamrick, 1997; Toro and Caballero, 2005; De Kort et al., 2021). Ho-N (the observed heterozygosity), on the other hand, would be better if one is interested in the actual measure of heterozygosity in a population. Since Ho and He are giving different information, it would be best to include both Ho and He. For markers like allozymes or SSRs, another commonly used parameter is the percentage of polymorphic loci (%PN; Table 1), which is calculated as the number of loci with two or more alleles within each population or species divided by the total number of loci resolved and multiplied by 100 (Berg and Hamrick, 1997). Another important but less used parameter is allelic richness (AR; Table 1), which is the standardized mean number of alleles per locus (A; Table 1) that accounts for differences in population sample sizes [i.e., rarefaction methodology described in Hurlbert (1971), which is a technique for assessing ecological diversity under unequal sample sizes]. The standardized AR is a more informative parameter for conservation purposes than HeP-N or %PN (El Mousadik and Petit, 1996; Petit et al., 1998; Rivers et al., 2014). This is because AR is indicative of the long-term evolutionary potential of a population (Caballero and García-Dorado, 2013), and rare alleles that influence AR measures are more localized than common ones, which may lead to conservation implications in the context of fragmentation consequences (El Mousadik and Petit, 1996; Petit et al., 1998). For example, Tsumura and his colleagues, using SSRs which were highly polymorphic regarding the number of alleles, detected five historically important populations for conservation (i.e., glacial refugia) of Cryptomeria japonica in Japan based on rare and “private” alleles (those that are found only in a single population; Takahashi et al., 2005).
For neutral DNA sequence-based polymorphisms [e.g., internal transcribed spacer (ITS), SNPs], the most commonly used parameters are the number of segregating sites (SN) and nucleotide diversity (πN; Hamilton, 2009; Table 1). Similar to %PN, SN is calculated as the number of nucleotide sites with two or more alternative nucleotides among alleles within a population in a sequence with L nucleotide sites in length. The number of segregating sites per nucleotide site (pS) is calculated as pS-N = SN/L (Table 1). Under neutrality, another parameter that can be derived from SN is θW-N (Watterson’s theta; Table 1), calculated using the formula θW-N = pS-N/an, where an is the (n–1)th harmonic number for n sampled haploid individuals (Watterson, 1975). Nucleotide diversity (πN; Nei and Li, 1979; Nei and Kumar, 2000) is a measure of heterozygosity for DNA sequences. In a similar way to He-N, πN is defined as the average number of nucleotide differences per site between each pair of DNA sequences in the sample.
Population geneticists use many different metrics to measure population differentiation in plants (Lowe et al., 2004). Wright (1951) defined FST-N (Table 1) for one locus with two alleles as a measure of the probability of identity by descent (IBD) of alleles within subpopulations relative to the total population. IBD can be generated if allele frequencies differ among subpopulations, and random mating within each subpopulation is not equivalent to random mating among all individuals of the total population. Because of the Wahlund effect due to population substructuring (i.e., the fractional reduction in heterozygosity of a subdivided population relative to the heterozygosity of a single, random-mating, H–W population with the same allele frequencies), HS ≤ HT (where HS and HT are the H–W expected frequency of heterozygotes “averaged across subpopulations” and “for the total population,” respectively), and thus 0 ≤ FST ≤ 1. If FST = 0, there is no deficit of heterozygotes because there is no allele frequency variation among subdivisions. In an extreme case, if FST = 1, there is a complete absence of heterozygotes because subpopulations are fixed for different alleles in all loci. Another commonly used measure of genetic differentiation is Nei (1973, 1978) GST-N, calculated as GST-N = DST /HT, where DST is the component of among-population genetic diversity and HT is the total genetic diversity. GST-N values are usually averaged over all polymorphic loci to estimate population divergence for a given species. A GST-N value of 0.10 means that 90% of total genetic diversity resides within populations, and 10% resides among populations. GST-N may be regarded as a multi-allelic variant of Wright (1951) FST-N (Berg and Hamrick, 1997), and an analog of the latter parameter, θ, is often calculated following an analysis of variance formulation by Weir and Cockerham (1984). In addition, the hierarchical analysis (at two-, three- or four-levels) of molecular variance (AMOVA; Excoffier et al., 1992) has been often used to characterize the partition of the observed genetic variation among (ΦST) and within populations for regions. As the classical FST is dependent on within-population diversity (HS), Meirmans and Hedrick (2011) suggested the use of standardized F′ST (for “inferring demographic history and migration”; Hedrick, 2005), and Jost (2008) D (for “describing allelic differentiation among populations”) as complementary summary statistics to FST. In a similar context, Verity and Nichols (2014) stress that “in some situations, GST is insufficient on its own and needs to be supplemented by another measure such as Hedrick (2005) G′ST or D.” Similarly, Jost et al. (2018) argue that the two main classes of measures [i.e., FST, GST, and θ as “fixation index measures”; D, EST (entropy differentiation) and KST (differentiation measure based on allele number) as “allelic differentiation measures”] provide very different but complementary types of information and should be used simultaneously in conservation genetics.
Finally, in terms of Wright (1951) F-statistics, FIS (the probability of IBD of alleles within individuals relative to the subpopulations in which they occur; Table 1) and FIT (the probability of IBD of alleles within individuals relative to the total population) are in the range of −1 to 1. By definition, the inbreeding coefficient F is the probability that two homologous alleles in an individual are IBD from a recent common ancestor (Sewall Wright originally used f for the coefficient of inbreeding but F has become more common in modern usage). FIS-N is called the average inbreeding coefficient of individuals within subpopulations and has been used to estimate the degree of inbreeding within populations (Berg and Hamrick, 1997). As defined above, however, FIS-N measures the deviation of a population from H–W equilibrium and has several other explanations than inbreeding, such as mutation, Wahlund effect, and null alleles (for details see Waples, 2015).
2.2. Adaptive genetic diversity
2.2.1. Genetic diversity in quantitative traits
It is worth noting at the outset that the genetic diversity of quantitative traits is not always adaptive; quantitative traits can be neutral. Genetic investigation on fitness-related [phenology (bud set, bud break), cold and drought tolerance, growth (specific leaf area), reproductive output, survival, biomass-accumulation, etc] and non-fitness-related (morphology) traits in plant species have been targeted by researchers to gain insights into local (mal)adaptation (De Kort et al., 2013; Capblancq et al., 2020). For instance, Exposito-Alonso et al. (2018) conducted a drought experiment on Arabidopsis thaliana from different regions of Europe and found that populations from both Mediterranean and Scandinavian regions display genetic variation in drought resistance suggesting potential for adaptation to changing climate. As another example, Olson et al. (2013) found that northern populations of Populus balsamifera exhibit earlier bud set and later bud break than southern populations likely as an adaptation to shorter growing seasons and earlier onset of winters.
In the same way, as He-N is a measurement of NGV, a more general and less precise measure of genetic variability in a quantitative trait is the broad-sense heritability (H2), the ratio of total genetic variance (VG) to the total phenotypic variance of a trait (Vp), defined as H2 = VG/VP (Podolsky, 2001; Volis et al., 2005; Ye et al., 2014). In addition to additive genetic variance (VA), VG further includes contributions due to dominance and epistatic interactions, i.e., non-additive genetic variance (Ye et al., 2014). H2 is a less appropriate guide to the ability to evolve via natural selection in random mating populations. However, narrow-sense heritability (h2) is used to measure AGV within populations for specific quantitative traits (Reed and Frankham, 2001; Holderegger et al., 2006; Willi et al., 2006; Visscher et al., 2008; Mittell et al., 2015; Depardieu et al., 2020). To calculate h2, one has to separate VA from environmental (i.e., non-genetic) and non-additive (i.e., dominance and epistasis) genetic variance (Visscher et al., 2008; de Villemereuil et al., 2016). h2 is a ratio of the VA scaled to VP. Toro and Caballero (2005) considered h2 “the best indicator of adaptive potential” for a quantitative trait. Researchers routinely perform experimental procedures to estimate the variance components of phenotypic traits from individuals with known genetic relationships (e.g., half-siblings) grown under the same environment (i.e., through a common garden experiment). A typical research approach consists of estimating variance components through variance analysis of individuals (e.g., offspring of known mothers with unknown fathers) nested within families (Holderegger et al., 2006). Another commonly used measure of within-population genetic variability for quantitative traits is the coefficient of additive genetic variance (CVA; Houle, 1992). As a measure of the relative variability of a given trait, CVA is defined as the ratio of the standard deviation of VA to the mean for a given trait. The higher the coefficient of variation, the greater the level of dispersion around the mean.
The equivalent FST-N (or GST-N) for a quantitative trait is QST (Table 1; e.g., Petit et al., 2001; Chun et al., 2009, 2011; Shirk and Hamrick, 2014; de Villemereuil et al., 2016). QST calculation for a trait can be expressed as QST = VB / (VB + 2VA), where VB is the among-population variance (assumed to be additive) and VA is the average additive genetic variance within populations (Spitze, 1993; Petit et al., 2001; Savolainen et al., 2007; Whitlock, 2008; Leinonen et al., 2013; Shirk and Hamrick, 2014; de Villemereuil et al., 2016). Common garden experiments are often required to obtain estimates of QST, which can be laborious and expensive. As in the case of FST-N, QST = 1 means complete differentiation in quantitative traits, and QST = 0 represents genetic homogeneity among populations.
Neutral genetic markers can play a role in identifying adaptive traits, especially those that involve many genes (i.e., quantitative traits), as neutral marker loci can provide a baseline (or a reference) for comparisons with potentially adaptive traits. The comparison between FST-N and QST delivers a means for researchers to distinguish between natural selection and genetic drift as causes of population differentiation in complex polygenic traits (Leinonen et al., 2008). If QST > FST-N, trait divergence exceeds neutral expectation, likely caused by divergent selection. If QST < FST-N, trait divergence among populations is less than expected due to genetic drift alone; this pattern is suggestive of uniform selection or stabilizing selection across populations (selection favoring the same phenotype in different populations). Finally, if QST ≈ FST-N, trait differentiation is indistinguishable from the effects of drift, and there is no evidence for selection (i.e., there is no need to invoke natural selection—the given degree of differentiation would be expected by genetic drift alone). Meta-analyses of empirical QST–FST-N comparison studies have shown that QST typically exceeds FST-N (Merilä and Crnokrak, 2001; Leinonen et al., 2008, 2013), suggesting that quantitative genetic variation is often under the influence of divergent selection. Although Ovaskainen et al. (2011) have pointed out that the traditional QST–FST comparisons suffer from several shortcomings (e.g., compromised statistical power, theoretical weaknesses, and, as mentioned above, the use of traditional Wright’s FST), most published works are still based on the conventional QST–FST comparisons rather than the more sophisticated approach outlined by Ovaskainen et al. (2011).
2.2.2. Identification of loci underlying local adaptation
In the era of genomics, genome-wide variation may be detected using restriction site-associated DNA sequencing (RAD-seq), RNA-seq, target enrichment sequencing, and whole-genome (re)sequencing, among others, and provides genomic information for a better understanding of population genetic processes, especially local adaptation, and thus, also for conservation concerns (Figure 1; Shafer et al., 2015; Flanagan et al., 2018). In addition, multiplexed ISSR genotyping by sequencing (MIG-seq) can be useful for conservation genetics as it tolerates a wide range of DNA qualities and quantities and can be applied to endangered plants with small samples (Suyama and Matsuki, 2015). The important issue is how to identify which variants at a locus or gene are adaptive. There are four main types of traditional approaches to identifying which loci are adaptive (Schoville et al., 2012). The first method is the population differentiation approach (e.g., FST outlier methods; Eckert et al., 2010; Li et al., 2017; Anderson and Song, 2020). By calculating values of FST for multiple genes across the genome, one can detect outlier loci deviating from the neutral baseline level of differentiation (Funk et al., 2012). These outlier loci are candidates for having been under directional selection for local adaptation (Bierne et al., 2013). A second method to characterize adaptive differentiation is to estimate genotype-environment associations (GEA; also called environmental association analysis; Feng and Du, 2022) on either individual or population samples (Li et al., 2017; Forester et al., 2018). In GEA, genes showing a high correlation with a specific environmental variable are indicative of selection stemming from this variable being responsible for observed differentiation (Coop et al., 2010; Rellstab et al., 2015). GEA can detect (candidate) genes involved in a local adaptation that could remain undetectable by traditional outlier analyses (Coop et al., 2010; Rellstab et al., 2015). Hence, the detection of AGV based on a single approach needs to be considered with caution due to the occurrence of false positives (i.e., type I error) or false negatives (i.e., type II error; e.g., Li et al., 2017; Flanagan et al., 2018). However, both of these approaches suffer from a high rate of false positives, probably due to background population structure and demographic processes (de Villemereuil and Gaggiotti, 2015). To lower the false positive rate of the existing FST-based approaches under various demographic scenarios, de Villemereuil and Gaggiotti (2015) developed an FST-based genome-scan method (“BayeScEnv”) that “incorporates environmental information in the form of environmental differentiation.” There are also several other GEA methods [e.g., a Bayesian method of estimating “the empirical pattern of covariance in allele frequencies between populations from a set of markers” (Coop et al., 2010), a spatial analysis method (SAM; Joost et al., 2007), and latent factor mixed models (Frichot et al., 2013)]. For more details about the FST outlier analyses and GEA, readers may refer to a comprehensive review of Flanagan et al. (2018). A third approach to detecting AGV involves the detection of departures of allele frequency spectra from the expectations under neutrality (Chen et al., 2010). Finally, genome-wide association studies (GWAS; also called genotype–phenotype association analysis), conducted under well-designed common garden experiments, can also be used to identify genetic signatures of adaptation (e.g., SNPs association with quantitative traits that are enriched for FST outliers; e.g., Fournier-Level et al., 2011; McKown et al., 2014; Josephs et al., 2017). However, in the case of GWAS, there are a number of important biological and statistical considerations to be taken into account, and these can limit the utility of GWAS in studies of natural populations (Korte and Farlow, 2013). In addition to the above methods, the following approaches can also be used to infer natural selection on particular loci: Tajima’s D (Tajima, 1989), Fu and Li test (Fu, 1996), HKA test (Hudson et al., 1987), and MK test (McDonald and Kreitman, 1991). In fact, for the identification of candidate loci/genes under local adaptation, two or more approaches are usually used (Tsumura et al., 2007, 2014). More recently, Feng and Du (2022) summarized the methods of landscape genomics [i.e., GEA and “genetic or genomic offset” (Fitzpatrick and Keller, 2015; Capblancq et al., 2020) or “genomic vulnerability” (Bay et al., 2018)] used in tree conservation and elucidated the pros and cons of these methods. These authors also highlighted the “risk of non-adaptedness” method (Rellstab et al., 2016), a similar approach to genomic offset, which predicts the theoretically required allele frequency shifts of diverse populations of a focal tree species under multiple scenarios of climate change.
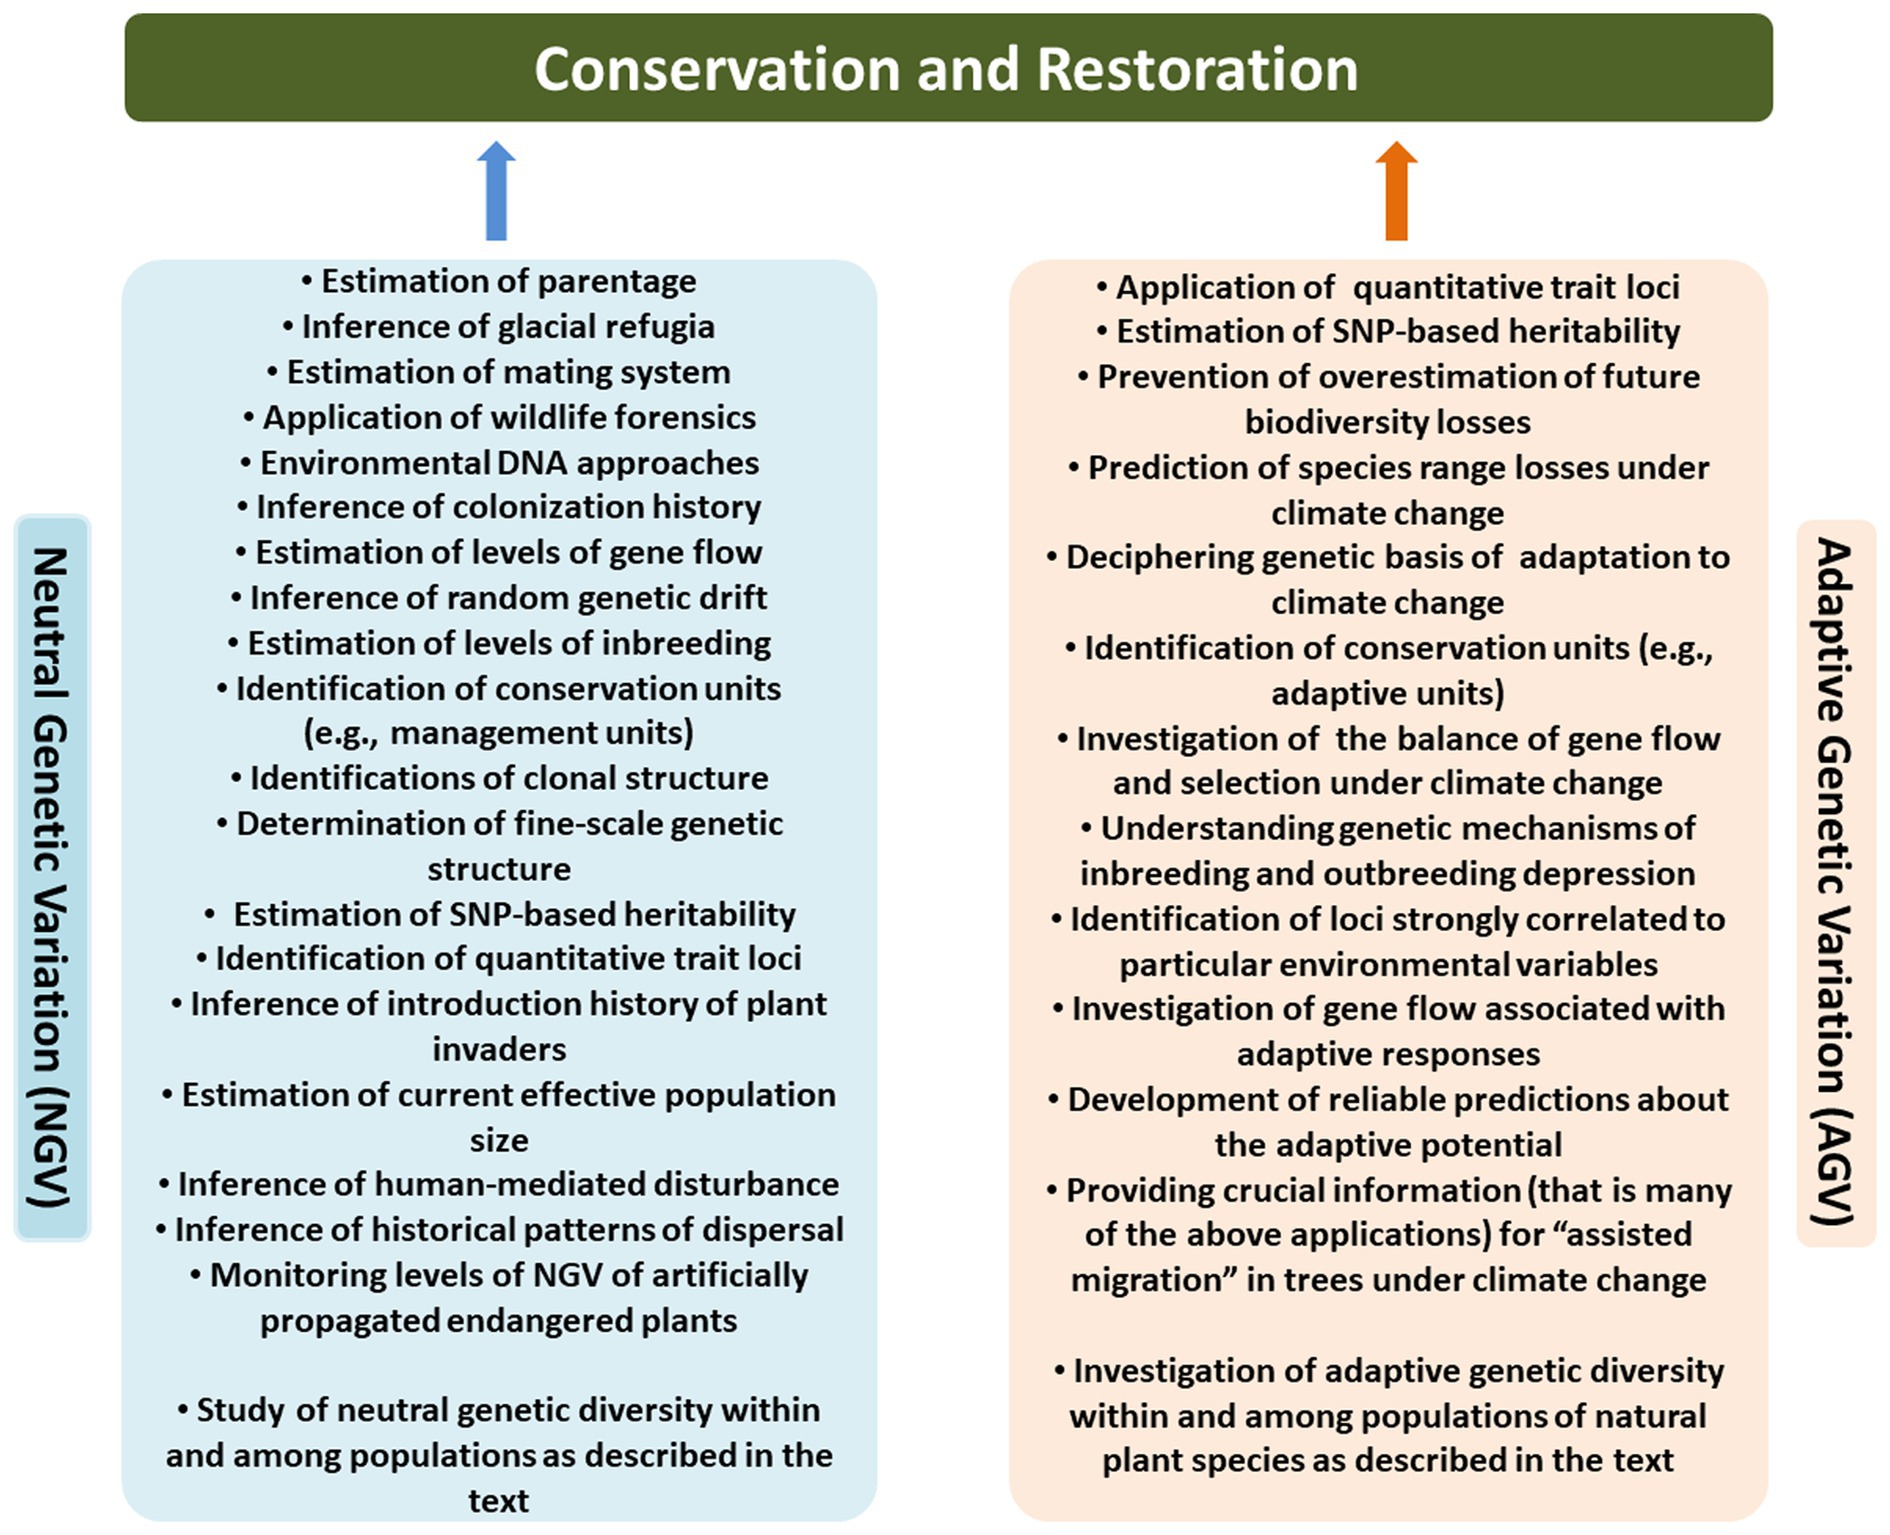
Figure 1. Summary of applications of neutral (NGV, left; in this review, we consider NGV as population genetic analyses using neutral markers) and adaptive genetic variation (AGV, right) to develop conservation and restoration strategies.
Studies on gene expression patterns generated by RNA-seq (i.e., “transcriptome analysis or transcriptomics”) can provide insights into molecular mechanisms underlying local adaptation. Such genes can be identified by showing them significant up- or down-regulation expression in response to particular environmental conditions [e.g., A. thaliana (Lasky et al., 2014); Quercus lobata (Gugger et al., 2017); reviewed in Sork (2018)]. Another approach is to study “epigenetic processes” (e.g., heritable DNA methylation of cytosines) with GWAS approaches [e.g., A. thaliana (Dubin et al., 2015); Q. lobata (Sork, 2018)].
2.2.3. Genetic diversity in single nucleotide polymorphisms, single genes, and genomic regions
Measuring AGV by SNPs or a single genetic locus can be done using approaches similar as used to estimate neutral genetic diversity. For instance, researchers can estimate genetic diversity parameters based on genetic markers linked to genes involved with adaptive traits [Le Corre and Kremer, 2003; or quantitative trait loci which are genomic regions at which AGV is associated with a particular quantitative trait and identified by using statistical associations between neutral genetic markers and phenotypic traits (Falconer and Mackay, 1996; Caballero, 2020; Figure 1)]. Typically, researchers measure He-A, πA, SA, pS-A, and FST-A (e.g., Toro and Caballero, 2005; Jeffries et al., 2016; Fischer et al., 2017; Kim et al., 2018; hereafter “A” indicates adaptive). For the calculation of SA and pS-A, L is the same as when calculated with all site parameters.
With the advent of the NGS, genomic data are used to solve problems in conservation biology (i.e., conservation genomics), which provides exciting opportunities to address broader factors and produce estimates of genome-wide heterozygosity and genetic diversity with high precision (Allendorf et al., 2010; Grueber, 2015; Ekblom et al., 2018; Supple and Shapiro, 2018). Measuring genetic diversity in a genomic region is similar to measuring it in single genes (e.g., He-A, πA, SA, pS-A, and FST-A), which is usually averaged over all loci, or averaged over sliding windows of (e.g., 10 kb size) across the genome. In addition, genome scans of a large set of loci make it possible to identify AGV related to particular traits, as well as test and quantify the adaptive potential of threatened species (Funk et al., 2018). However, if a population is perfectly adapted to its environment, and the locus conforming to this adaptation has been driven to fixation, then AGV = 0.
3. Application of neutral genetic diversity to plant conservation
An important question in restoration/reinforcement actions is whether the propagules used belong to the same conservation unit as the local individuals. This does not require NGV to reflect AGV. Key points in the application of information on NGV to conservation biology include that both ex situ and in situ restoration efforts are grounded on genetically diverse source populations because such populations may provide the best source of propagules (Godt and Hamrick, 2001; Hamrick et al., 2006; Chung et al., 2020; Gargiulo et al., 2021; Figure 1). However, conservation practitioners should be aware of the theoretical expectation that drawing propagules for genetic rescue from a large outbred source population with high NGV may bring deleterious recessive alleles into the rescued population which may expose the supplemented population to inbreeding depression (Hedrick and García-Dorado, 2016). Whether the choice of the source population is based on neutral or adaptive diversity does not change the expectation of the introduction of deleterious alleles. In addition, introducing propagules from source populations that may be genetically widely divergent (and thus strongly adapted to the local conditions) could produce the disruption of coadapted gene complexes (Fenster and Dudash, 1994) and lead to outbreeding depression (Price and Waser, 1979). Whitlock et al. (2013) conducted a meta-analysis to document “phenotypic responses to intraspecific outbreeding” from 98 studies of animal and plant species. They found “no overall effect of outbreeding on hybrid phenotypes and significant heterogeneity in outbreeding responses” within and among studies, suggesting that outbreeding costs do not always occur. Even when outbreeding depression is expressed, genetic diversity can be greatly improved with benefits to future adaptive potential, provided that the outbreeding depression does not lead to extinction. As a conservative approach, conservation managers and practitioners should seek to collect propagules (e.g., seeds) from populations that have low pairwise FST-N or GST-N values with the population(s) to be restored (i.e., a population reinforcement).
From an ecological and a conservation perspective, much of the value of NGV (comprising all analyses using markers) for conservation applications of plants depends on the question that researchers are interested in (Schlötterer, 2004; Kahilainen et al., 2014). NGV allows answering several questions relevant to conservation purposes (Figure 1). These include (i) inference of mating systems (selfing versus outcrossing; biparental inbreeding versus inbreeding due to selfing; Chung et al., 2011; Kalisz et al., 2012) to gain an idea about pollen flow, (ii) estimation of levels of inbreeding and inbreeding depression (Keller and Waller, 2002) to obtain information on the development of conservation strategies, (iii) estimation of levels of gene flow (Nason et al., 1998; Ishihama et al., 2003) to gain an idea about current and historical levels of dispersal, (iv) estimation of the relative contribution of pollen versus seed-mediated gene flow (mp/ms) to genetic diversity to gain insights into the development of conservation strategies (Ennos, 1994; Hamrick and Trapnell, 2011), (v) inference of random genetic drift (Young et al., 1996) to alleviate adverse effects by increasing population size, (vi) conduction of parentage analyses (Erickson et al., 2004) to assess the reproductive success of individuals under conservation concerns, (vii) estimation of effective population sizes (Ne; Gargiulo et al., 2021) as a surrogate for the degree of genetic drift, (viii) inference of glacial refugia (Ikeda et al., 2006) as the highest priority for protection or as source populations that could be used in genetic rescue attempts, (ix) reconstruction of (re-)colonization history (Pardini and Hamrick, 2008) to gain insights into species distribution under climate change, (x) analysis of fine-scale genetic structure (Loiselle et al., 1995) as a tool for sampling strategies, (xi) identification of clonal structure (Reusch et al., 2001) as information for designing restoration strategies, (xii) identification of conservation units (Coates et al., 2018; Tsumura, 2022; Yang et al., 2022) through phylogeographic analyses to determine which populations should be conserved separately, (xiii) analysis of environmental DNA in water, soil, air, etc (Thomsen and Willerslev, 2015) for identifying a variety of organisms and monitoring them to evaluate their past and present biodiversity, and (xiv) monitoring levels of NGV (Schwartz et al., 2007) to introduce artificially propagated endangered plants into the wild, among others (Figure 1). Not all of these aims necessarily require genomic analyses but they can be essential when designing conservation or restoration strategies, including sourcing seeds or other propagules, restoring connectivity, and assisting migration (Gann et al., 2019). Another important aspect to consider is that genetic diversity measures are relevant to wild relatives of a variety of domesticated plants [e.g., wild cabbage species (Brassica oleracea; Mittell et al., 2020); wild banana species (Musa balbisiana; Mertens et al., 2021); wild rice species (Oryza rufipogon; Zhang et al., 2022)]. Knowledge of the genetic diversity of crop wild relatives (CWR) is the basis for providing novel traits for breeding, which is gaining much importance under a scenario of ongoing climate change; some initiatives are already including the study of the genetic diversity of CWR with the final goal of food safety and food sovereignty (e.g., Mastretta-Yanes et al., 2018).
4. Application of adaptive genetic diversity to plant conservation
As discussed before, the general approaches of NGV for both in situ and ex situ conservation and restoration efforts may apply also to AGV. However, genes responsible for AGV are typically (but see Todesco et al., 2020) scattered throughout the genome and often show a higher population differentiation i.e., higher values of QST or FST-A than FST-N due to divergent selection [e.g., see a recent population genomic survey of the living fossil Ginkgo biloba (Zhao et al., 2019)]. In addition, results of about 15 times higher FST-A (0.545) for climate-related SNPs than the average genome-wide SNPs (FST-(A + N) = 0.038) have been reported in Arabidopsis halleri from the Alps (Fischer et al., 2017). These results suggest that more populations (than those for the FST-N-based decision) would be needed to preserve enough genetic variation for adaptively significant quantitative traits and genes related to climate change.
As for conservation and restoration efforts, πA and θW-A are based on adaptive loci screened from candidate genes or genome-wide loci (e.g., SNPs), and many of them which underlay adaptive traits have recently been studied for signatures of selection at single sites (Eveno et al., 2008; Eckert et al., 2009; Gailing et al., 2009; Derory et al., 2010; Ekblom et al., 2018; Kim et al., 2018; Supple and Shapiro, 2018). Quantification of AGV, as well as transcriptomics and epigenetics, constitute important and promising potential approaches for developing future conservation strategies for rare and endangered plant species (Figure 1; Eckert et al., 2009; Gailing et al., 2009; Nichols and Neale, 2010; Ouborg et al., 2010; Harrisson et al., 2014; He et al., 2016; Anderson and Song, 2020; Hohenlohe et al., 2020). As shown in Figure 1, we briefly introduce important points about the application of AGV information to conservation biology. Barbosa et al. (2018) utilized “all genomic data” (including both nuclear and mitochondrial genomes) to understand the evolutionary history of a focal species (the Cabrera vole Microtus cabrerae in the Iberian Peninsula) and define evolutionary significant units (ESUs, emphasizing the monophyly of groups of individuals or populations). They used “neutral loci” to determine the species’ current connectivity and define management units (MUs, focusing on demographic independence of groups of populations using neutrally evolving markers), and “outlier loci” to identify its adaptive variation and define (putatively) adaptive units (AUs) which may reflect adaptive differentiation under heterogeneous landscape and climate (Figure 1). For guidelines for how to identify ESUs, MUs, and AUs of focal plant species based on genetics and ecological niche modeling, readers may refer to section 4.4 in Barbosa et al. (2018). In addition, Silva et al. (2020) used SNP dataset and GEA methods to analyze the range-wide neutral and adaptive structure of the endemic herb Brasilianthus carajensis from Amazonian savannas and found three neutral genetic clusters (MUs) and six adaptive genetic clusters (AUs), which could be employed to “prevent loss of unique genetic variation and maximize the species’ resilience to future environmental change.” Similarly, Yang et al. (2022) found two MUs in the Qinghai-Tibetan Plateau endemic conifer Cupressus gigantea based on all SNPs (145,336) and putatively neutral SNPs (26,103).
There is a possibility to replace alleles to improve pest resistance or to get a better response to future climate change for a threatened species when traditional genetic rescue is not a possibility (Supple and Shapiro, 2018). Here, it is worth noting that the ability of many species to adapt or migrate to suitable habitats is unlikely to keep up with the rapid pace of climate change, which may lead to an increase in the likelihood of extinction or local extirpation (McLachlan et al., 2007; Aitken and Whitlock, 2013; Handler et al., 2022). One management option that can address this issue is “assisted migration” (Figure 1), defined as the “human-assisted movement of species in response to climate change beyond their range to mitigate local maladaptation” (Handler et al., 2022). Several empirical studies demonstrate that assisted migration is a reasonable option to circumvent the climate-driven extinction of populations and species [e.g., the conifers Picea glauca in Quebec (Benomar et al., 2016) and Pinus albicaulis in Oregon, Washington, and northwestern British Columbia (McLane and Aitkin, 2012)]. Incorporating information on the AGV of a target plant species into a program of assisted migration will be critical, which would be possible through common-garden and transplant experiments (McLachlan et al., 2007). Handler et al. (2022), focusing mainly on trees, provide a concise introduction to the scientific background and management considerations for assisted migration.
Although there are only a few AGV studies aimed at dissecting the genetic and genomic basis of complex trait variation on non-model natural plant species to date (Li et al., 2017; Anderson and Song, 2020), there is a growing interest in this topic (Fitzpatrick and Keller, 2015; Jordan et al., 2017; Yang et al., 2022). To provide critical information for prioritizing populations and species conservation, Anderson and Song (2020) encourage researchers to develop reliable predictions (or trends) about the adaptive potential of native species under climate change (Figure 1). In addition, Cook et al. (2021), with a particular focus on addressing the adaptive potential of populations and species, detail four lessons from decades of efforts to bridge the gap between evolutionary biologists (science) and conservation practitioners (practice). Although AGV has some advantages over NGV such as facilitating better predictions of species distribution, providing key genetic background for assisted migration, or enhancing evolutionary rescue based on genomic patterns of inbreeding (Shafer et al., 2015; Supple and Shapiro, 2018; Razgour et al., 2019), one may need to reconsider the necessity of genomic survey of AGV for conservation and restoration purposes in cases where QST is informative and funds are limited (Flanagan et al., 2018).
5. The relationship between neutral genetic diversity and adaptive genetic diversity
Several meta-analysis-based reviews show that neutral marker-based data (HeP-N) for plants are partially correlated with levels of (putative) AGV (h2 or H2; Podolsky, 2001; Volis et al., 2005; Holderegger et al., 2006), but others have failed to do so (Bekessy et al., 2003; Bonin et al., 2007). As another example of the former, Leimu et al. (2006) conducted a meta-analysis to test whether relationships between plant population size, fitness, and within-population nuclear genetic diversity were positive; the authors found that fitness and NGV were positively correlated in self-incompatible species.
Relatively higher correlations in many plants and animals have been found between FST-N and QST compared to HeP-N–h2 comparisons based on meta-analyses (Merilä and Crnokrak, 2001; Leinonen et al., 2008, 2013). In addition, QST is generally higher than FST-N. For example, the mean QST for seven tree species and seven herbaceous species (0.309 and 0.448, respectively) was much higher than FST-N (0.050 and 0.214, respectively; Hamrick et al., 2006). The higher QST values are presumably due to the action of natural selection (i.e., adaptations to local environmental conditions; Merilä and Crnokrak, 2001; Podolsky, 2001; Conner and Hartl, 2004; Savolainen et al., 2007; Whitlock, 2008; Chun et al., 2011; Leinonen et al., 2013). In addition, as the QST/FST-N ratio in trees is about three times larger than that in herbaceous species, extensive gene flow seen in many tree species is, thus, probably not compromising local adaptation (Petit and Hampe, 2006).
One of the take-home messages concerning QST–FST comparisons is that the development of conservation strategies based solely on FST could lead to an underestimate of the number of populations to be preserved (or sampled) to capture most of the genetic variation (NGV and AGV), particularly in woody species. However, FST estimated from herbaceous perennials that are relatively rare and isolated may be considered a proxy for QST of certain quantitative traits. Although data are still limited, genome-based FST-A estimates are considerably larger than genome-based FST-N due to divergent selection (Fischer et al., 2017; Zhao et al., 2019; Yang et al., 2022).
6. Controversy over the similarity between neutral genetic variation and adaptive genetic variation
Since the late 1980s, some conservation and evolutionary biologists have been questioning the utility of NGV for developing conservation strategies (Schemske et al., 1994; Lande, 1998; Barbosa et al., 2018; Flanagan et al., 2018; Mable, 2019; Teixeira and Huber, 2021). One of the key arguments for these authors is that the assumption that the level of NGV is indicative of AGV would not be valid. Consistent with this opinion, recent genomic analyses reveal that some animal and plant species exhibiting a demographic pattern of isolation and inbreeding show low levels of NGV while maintaining AGV at adaptively important genes (Castro-Prieto et al., 2011; Funk et al., 2016; Robinson et al., 2016; Niu et al., 2019). Given a general perception that populations with high levels of AGV are more at risk of losing it when they are small than when they are large (Willi et al., 2006), these results above would also question the small-population paradigm, which assumes that these populations are prone to extinction compared to a large population (Ellstrand and Elam, 1993). Similar to the small-population paradigm, the mechanisms underlying rapid adaptation to changing environments in introduced populations of species with low (reduced) NGV primarily due to a bottleneck (the “genetic paradox of invasion”) are also challenging the assumption of NGV as a proxy of AGV (that may lead to “spurious paradox”); but some populations may not be paradoxical (“no paradox”), owing to multiple introductions and preadaptation (Estoup et al., 2016). Thus, a better understanding or elucidation of phenotypic changes in changing environments at the genomic level has been a challenge for molecular evolutionary biologists (Ellegren and Galtier, 2016; Anderson and Song, 2020; Ge and Guo, 2020).
A recent article arguing against the traditional assumption of NGV as a proxy of AGV is that of Teixeira and Huber (2021), which is based on a few empirical and simulation-based studies mainly focused on endangered animals. The authors challenge the long-lasting assumption that ineffective selection and prevalence of random genetic drift link with low genetic diversity and small Ne within populations, which is the basis for mutational meltdown and inbreeding depression. Furthermore, the authors also provide several arguments for the limitations of NGV to predict the degree of a population’s adaptive potential. Although García-Dorado and Caballero (2021) agree with Teixeira and Huber (2021) in that the association between NGV and adaptive potential is not straightforward, the latter authors suggest genetic management preserving as much genetic diversity (including NGV) as possible and underline the importance of NGV as an essential tool in conservation biology as the primary reconstruction of demographic histories or changes. Similarly, Kardos et al. (2021), based on theoretical and empirical findings, emphasize that conserving genome-wide NGV is the best approach to preventing the loss of adaptive potential of organisms. As another reply to Teixeira and Huber (2021); DeWoody et al. (2021), using published literature (based on allozymes, AFLPs, SSRs, and SNPs), stress that the consideration of genetic diversity (NGV) in conservation has a strong theoretical justification and is backed by decades of empirical research and literature. They further argue that NGV is empirically tractable for many species given current data and technological limitations. Based on robust patterns in the field of conservation genetics from the last few decades, Willi et al. (2022) summarize the “five best-supported paradigms” (e.g., the association between small population size as well as severe demographic bottlenecks and reduced NGV; the association between small census size with inbreeding depression and low population mean performance; more drift load in populations with low NGV; a reduced response to selection in small populations or populations with low NGV; and alleviation of low population performance by restored gene flow and genetic mixing) that have been implemented in conservation. In exploring future directions based on recent developments, Willi et al. (2022) suggest researchers adopt genomic approaches to infer population demography, access the magnitude of genetic load, and screen for AGV.
In summary, one of the key arguments of Teixeira and Huber (2021) is that the “relation between genome-wide patterns of NGV and population persistence or adaptive potential remains speculative and should thus be excluded from conservation strategies.” Like many researchers, we agree on the perception that NGV may not be a perfect proxy of AGV, particularly, with respect to within-population genetic diversity. We further agree with the four independent voices (viz. DeWoody et al., 2021; García-Dorado and Caballero, 2021; Kardos et al., 2021; Willi et al., 2022), who reemphasized that NGV is at least just as important as AGV in conservation biology. This may partly be acceptable because NGV under current conditions can become AGV under changed environmental conditions (de Lafontaine et al., 2018). As presented in Figure 1, we stress that NGV and AGV should be considered differently in the context of conservation and restoration.
7. Conclusion and a way forward
We have argued that NGV is still a useful and important metric for plant conservation and that increasing access to genome-scale data will likely lead to further insights and gains in this respect (Willi et al., 2022). Even today in the genomic era, allozyme-based meta-analyses of plant population genetics remain valid (Hamrick and Godt, 1996a; Cole, 2003). Hamrick and Godt (1996a) showed that outbreeding species tend to be more genetically diverse and less differentiated than selfing species, whereas Cole (2003) revealed reduced NGV in rare species compared to common plant species; it is also worth recalling that these results convey important messages for plant conservation by providing a framework for roughly predicting levels of NGV of the target plant species if its life history characteristics are known, although there are exceptions. It is generally agreed that conservation genomic approaches are required to provide insight into AGV to complement the analyses based on NGV. Although genomes (or SNP data) are currently not available for most seed plant species of conservation concern, genetic information on some of them has been obtained by using traditional neutral markers (e.g., allozymes, AFLPs, ISSRs, and SSRs). Therefore, we recommend using NGV for conservation ends in the interim until there is more widespread access to genomic data. If conservation practitioners are in this situation, we suggest them referring Ottewell et al. (2016) who developed a simplified and straightforward framework for prioritizing management actions of plant populations (and, implicitly, species) based on genetic assessments. To this end, the authors proposed eight scenarios resulting from rating three population genetic parameters (FST or GST, He, and FIS) as “high” or “low.”
For the past two decades, several trees species have been extensively studied on both NGV and AGV by several research groups, primarily in the Northern Hemisphere (oaks in North America and Europe; balsam poplar in North America; conifers in Japan and China, particularly in the Qinghai-Tibetan Plateau), which provides good model systems, owing to (i) their life history traits that implicitly reduce background genetic structure by high levels of outcrossing and gene flow, (ii) relatively high levels of NGV and phenotypic variation applicable for association mapping, and (iii) large Ne (Alberto et al., 2013; Sork, 2018). In addition, we anticipate that future studies on other temperate deciduous trees and subalpine plants that retreated during the Last Glacial Maximum will be conducted to better understand their local adaptation and fate in the changing climate. Furthermore, numerous herbaceous plant species may be susceptible to climate change in the understory of temperate deciduous forests. Among them, we may particularly be aware of spring ephemerals with leaf senescence before canopy closure (flowering in early and fruiting in late spring) that are characterized by low rates of sexual reproduction, localized seed dispersal, and low rates of seed germination (less than 1%) and seedling establishment (Meier et al., 1995): factors contributing to their decline in eastern North America. In addition to annuals (Wang et al., 2009), genomic surveys on seaweeds (e.g., Vranken et al., 2021), mosses, and ferns and their allies wait for future uncovering of genetic responses to climate change. Genomic surveys could also be of great importance in crop wild relatives in the context of climate change.
We believe that genome datasets of hundreds of thousands to millions of SNPs as well as ecological niche modeling will allow researchers to test exciting hypotheses related to local adaptation by identifying both NGV and AGV (Smith et al., 2020; Chen et al., 2022; Yang et al., 2022). With these approaches, researchers will be able to determine which populations of the target species are more susceptible to climate change (genomic vulnerability or offset; Hoffmann et al., 2021), while at the same time providing more objective tools to identify conservation units (by delineating MUs and AUs). Furthermore, if these studies are carried out integratively and holistically, we expect that researchers will be able to better understand the “determinants of genetic diversity” (e.g., uncovering the relative contributions of species’ life history traits and ecology versus population history; Romiguier et al., 2014; Ellegren and Galtier, 2016) and to provide insights into plant invasion genetics (e.g., dissecting demographical, historical, ecological, and adaptive factors underlying biological invasions; Estoup et al., 2016; van Kleunen et al., 2018).
Author contributions
MYC and MGC designed the review and wrote the manuscript. MYC, JL, KM, JL-P, YT, JM, and MGC reviewed and edited the manuscript. MYC, JL-P, and KM secured the funding. MGC, KM, and MYC visualized the Figure 1. All authors contributed to the final version of the manuscript.
Funding
This research was supported by grants from the National Institute of Biological Resources (NIBR) of the Republic of Korea (NIBR202206101 to MYC). KM was supported by the National Natural Science Foundation of China (grant numbers U20A2080, 31622015), while JL-P was also supported by the Spanish Ministerio de Ciencia e Innovación (PID2020-119163GB-I00 funded by MCIN/AEI/10.13039/501100011033).
Acknowledgments
We would like to thank J. L. Hamrick, J. D. Nason, P. Meirmans, A. Caballero, R. Holderegger, R. Frankham, R. Jordan, and A. A. Hoffmann for their helpful input during the conceptualization and writing. We especially thank three reviewers for their constructive and valuable comments on earlier versions of this paper when submitted to another journal.
Conflict of interest
The authors declare that the research was conducted in the absence of any commercial or financial relationships that could be construed as a potential conflict of interest.
Publisher’s note
All claims expressed in this article are solely those of the authors and do not necessarily represent those of their affiliated organizations, or those of the publisher, the editors and the reviewers. Any product that may be evaluated in this article, or claim that may be made by its manufacturer, is not guaranteed or endorsed by the publisher.
Supplementary material
The Supplementary material for this article can be found online at: https://www.frontiersin.org/articles/10.3389/fevo.2023.1116814/full#supplementary-material
References
Aitken, S. N., and Whitlock, M. C. (2013). Assisted gene flow to facilitate local adaptation to climate change. Annu. Rev. Ecol. Evol. Syst. 44, 367–388. doi: 10.1146/annurev-ecolsys-110512-135747
Alberto, F. J., Aitken, S. N., Alía, R., González-Martínez, S. C., Hänninen, H., Kremer, A., et al. (2013). Potential for evolutionary responses to climate change – evidence from tree populations. Glob. Change Biol. 19, 1645–1661. doi: 10.1111/gcb.12181
Allendorf, F. W. (2017). Genetics and the conservation of natural populations: allozymes to genomes. Mol. Ecol. 26, 420–430. doi: 10.1111/mec.13948
Allendorf, F. W., Hohenlohe, P. A., and Luikart, G. (2010). Genomics and the future of conservation genetics. Nat. Rev. Genet. 11, 697–709. doi: 10.1038/nrg2844
Anderson, J. T., and Song, B.-H. (2020). Plant adaptation to climate change—where are we? J. Syst. Evol. 58, 533–545. doi: 10.1111/jse.12649
Anderson, J. T., Willis, J. H., and Mitchell-Olds, T. (2011). Evolutionary genetics of plant adaptation. Trends Genet. 27, 258–266. doi: 10.1016/j.tig.2011.04.001
Antonovics, J., Bradshaw, A. D., and Turner, R. G. (1971). Heavy metal tolerance in plants. Adv. Ecol. Res. 7, 1–85. doi: 10.1016/S0065-2504(08)60202-0
Barbosa, S., Mestre, F., White, T. A., Paupério, J., Alves, P. C., and Searle, J. B. (2018). Integrative approaches to guide conservation decisions: using genomics to define conservation units and functional corridors. Mol. Ecol. 27, 3452–3465. doi: 10.1111/mec.14806
Bay, R. A., Harrigan, R. J., Underwood, V. L., Gibbs, H. L., Smith, T. B., and Ruegg, K. (2018). Genomic signals of selection predict climate-driven population declines in a migratory bird. Science 359, 83–85. doi: 10.1126/science.aan4380
Bekessy, S. A., Ennos, R. A., Burgman, M. A., Newton, A. C., and Ades, P. K. (2003). Neutral DNA markers fail to detect genetic divergence in an ecologically important trait. Biol. Conserv. 110, 267–275. doi: 10.1016/S0006-3207(02)00225-2
Benomar, L., Lamhamedi, M. S., Rainville, A., Beaulieu, J., Bousquet, J., and Margolis, H. A. (2016). Genetic adaptation vs. ecophysiological plasticity of photosynthetic-related traits in young Picea glauca trees along a regional climatic gradient. Front. Plant Sci. 7:48. doi: 10.3389/fpls.2016.00048
Berg, E. E., and Hamrick, J. L. (1997). Quantification of genetic diversity at allozyme loci. Can. J. For. Res. 27, 415–424. doi: 10.1139/x96-195
Bierne, N., Roze, D., and Welch, J. J. (2013). Pervasive selection or is it…? Why are FST outliers sometimes so frequent? Mol. Ecol. 22, 2061–2064. doi: 10.1111/mec.12241
Bonin, A., Nicole, F., Pompanon, F., Miaud, C., and Taberlet, P. (2007). Population adaptive index: a new method to help measure intraspecific genetic diversity and prioritize populations for conservation. Conserv. Biol. 21, 697–708. doi: 10.1111/j.1523-1739.2007.00685.x
Caballero, A. (2020). Quantitative Genetics. Cambridge, United Kingdom: Cambridge University Press, doi: 10.1017/9781108630542
Caballero, A., and García-Dorado, A. (2013). Allelic diversity and its implications for the rate of adaptation. Genetics 195, 1373–1384. doi: 10.1534/genetics.113.158410
Capblancq, T., Fitzpatrick, M. C., Bay, R. A., Exposito-Alonso, M., and Keller, S. R. (2020). Genomic prediction of (mal) adaptation across current and future climatic landscapes. Annu. Rev. Ecol. Evol. Syst. 51, 245–269. doi: 10.1146/annurev-ecolsys-020720-042553
Castro-Prieto, A., Wachter, B., and Sommer, S. (2011). Cheetah paradigm revisited: MHC diversity in the world’s largest free-ranging population. Mol. Biol. Evol. 28, 1455–1468. doi: 10.1093/molbev/msq330
Chen, Y., Jiang, Z., Fan, P., Ericson, P. G. P., Song, G., Luo, X., et al. (2022). The combination of genomic offset and niche modelling provides insights into climate change-driven vulnerability. Nat. Commun. 13:4821. doi: 10.1038/s41467-022-32546-z
Chen, H., Patterson, N., and Reich, D. (2010). Population differentiation as a test for selective sweeps. Genome Res. 20, 393–402. doi: 10.1101/gr.100545.109
Chun, Y. J., Le Corre, V., and Bretagnolle, F. (2011). Adaptive divergence for a fitness-related trait among invasive Ambrosia artemisiifolia populations in France. Mol. Ecol. 20, 1378–1388. doi: 10.1111/j.1365-294X.2011.05013.x
Chun, Y. J., Nason, J. D., and Moloney, K. A. (2009). Comparison of quantitative and molecular genetic variation of native vs. invasive populations of purple loosestrife (Lythrum salicaria L., Lythraceae). Mol. Ecol. 18, 3020–3035. doi: 10.1111/j.1365-294X.2009.04254.x
Chung, M. Y., Nason, J. D., and Chung, M. G. (2011). Significant demographic and fine-scale genetic structure in expanding and senescing populations of the terrestrial orchid cymbidium goeringii (Orchidaceae). Am. J. Bot. 98, 2027–2039. doi: 10.3732/ajb.1100094
Chung, M. Y., Son, S., Herrando-Moraira, S., Tang, C. Q., Maki, M., Kim, Y.-D., et al. (2020). Incorporating differences between genetic diversity of trees and herbaceous plants in conservation strategies. Conserv. Biol. 34, 1142–1151. doi: 10.1111/cobi.13467
Coates, D. J., Byrne, M., and Moritz, C. (2018). Genetic diversity and conservation units: dealing with the species-population continuum in the age of genomics. Front. Ecol. Evol. 6:165. doi: 10.3389/fevo.2018.00165
Cole, C. T. (2003). Genetic variation in rare and common plants. Annu. Rev. Ecol. Evol. Syst. 34, 213–237. doi: 10.1146/annurev.ecolsys.34.030102.151717
Conner, J. K., and Hartl, D. L. (2004). A primer to ecological genetics. Sunderland: Sinauer Associates.
Cook, C. N., Beever, E. A., Thurman, L. L., Thompson, L. M., Gross, J. E., Whiteley, A. R., et al. (2021). Supporting the adaptive capacity of species through more effective knowledge exchange with conservation practitioners. Evol. Appl. 14, 1969–1979. doi: 10.1111/eva.13266
Cook, L. M., Grant, B. S., Saccheri, I. J., and Mallet, J. (2012). Selective bird predation on the peppered moth: the last experiment of Michael Majerus. Biol. Lett. 8, 609–612. doi: 10.1098/rsbl.2011.1136
Coop, G., Witonsky, D., Di Rienzo, A., and Pritchard, J. K. (2010). Using environmental correlations to identify loci underlying local adaptation. Genetics 185, 1411–1423. doi: 10.1534/genetics.110.114819
De Kort, H., Prunier, J. G., Duatez, S., Honnay, O., Baguette, M., Stevens, V. M., et al. (2021). Life history, climate and biogeography interactively affect worldwide genetic diversity of plant and animal populations. Nat. Commun. 12:516. doi: 10.1038/s41467-021-20958-2
De Kort, H., Vandepitte, K., and Honnay, O. (2013). A meta-analysis of the effects of plant traits and geographical scale on the magnitude of adaptive differentiation as measured by the difference between QST and FST. Evol. Ecol. 27, 1081–1097. doi: 10.1007/s10682-012-9624-9
de Lafontaine, G., Napier, J. D., Petit, R. J., and Hu, F. S. (2018). Invoking adaptation to decipher the genetic legacy of past climate change. Ecology 99, 1530–1546. doi: 10.1002/ecy.2382
de Villemereuil, P., and Gaggiotti, O. E. (2015). A new FST-based method to uncover local adaptation using environmental variables. Methods Ecol. Evol. 6, 1248–1258. doi: 10.1111/2041-210X.12418
de Villemereuil, P., Gaggiotti, O. E., Mouterde, M., and Till-Bottraud, I. (2016). Common garden experiments in the genomic era: new perspectives and opportunities. Heredity 116, 249–254. doi: 10.1038/hdy.2015.93
Depardieu, C., Girardin, M. P., Nadeau, S., Lenz, P., Bousquet, J., and Isabel, P. (2020). Adaptive genetic variation to drought in a widely distributed conifer suggests a potential for increasing forest resilience in a drying climate. New Phytol. 227, 427–439. doi: 10.1111/nph.16551
Derory, J., Scotti-Saintagne, C., Bertocchi, E., le Dantec, L., Graignic, N., Jauffres, A., et al. (2010). Contrasting relations between diversity of candidate genes and variation of bud burst in natural and segregating populations of European oaks. Heredity 105, 401–411. doi: 10.1038/hdy.2009.170
DeWoody, J. A., Harder, A. M., Mathur, S., and Willoughby, J. R. (2021). The long-standing significance of genetic diversity in conservation. Mol. Ecol. 30, 4147–4154. doi: 10.1111/mec.16051
Dubin, M. J., Zhang, P., Meng, D., Remigereau, M. S., Osborne, E. J., Paolo Casale, F., et al. (2015). DNA methylation in Arabidopsis has a genetic basis and shows evidence of local adaptation. eLife 4:e05255. doi: 10.7554/eLife.05255
Eckert, A. J., van Heerwaarden, J., Wegrzyn, J. L., Nelson, C. D., Ross-Ibarra, J., González-Martínez, S. C., et al. (2010). Patterns of population structure and environmental associations to aridity across the range of loblolly pine (Pinus taeda L., Pinaceae). Genetics 185, 969–982. doi: 10.1534/genetics.110.115543
Eckert, A. J., Wegrzyn, J. L., Pande, B., Jermstad, K. D., Lee, J. M., Liechty, J. D., et al. (2009). Multilocus patterns of nucleotide diversity and divergence reveal positive selection at candidate genes related to cold hardiness in coastal Douglas fir (Pseudotsuga menziesii var. menziesii). Genetics 183, 289–298. doi: 10.1534/genetics.109.103895
Ekblom, R., Brechlin, B., Persson, J., Smeds, L., Johansson, M., Magnusson, J., et al. (2018). Genome sequencing and conservation genomics in the Scandinavian wolverine population. Conserv. Biol. 32, 1301–1312. doi: 10.1111/cobi.13157
El Mousadik, A., and Petit, R. (1996). High level of genetic differentiation for allelic richness among populations of the argan tree [Argania spinosa (L.) Skeels] endemic to Morocco. Theor. Appl. Genet. 92, 832–839. doi: 10.1007/BF00221895
Ellegren, H., and Galtier, N. (2016). Determinants of genetic diversity. Nat. Rev. Genet. 17, 422–433. doi: 10.1038/nrg.2016.58
Ellstrand, N. C., and Elam, D. R. (1993). Population genetic consequences of small population size: implications for plant conservation. Annu. Rev. Ecol. Syst. 24, 217–242. doi: 10.1146/annurev.es.24.110193.001245
Ennos, R. A. (1994). Estimating the relative rates of pollen and seed migration among plant populations. Heredity 72, 250–259. doi: 10.1038/hdy.1994.35
Erickson, D. L., Hamrick, J. L., and Kochert, G. D. (2004). Ecological determinants of genetic diversity in an expanding population of the shrub Myrica cerifera. Mol. Ecol. 13, 1655–1664. doi: 10.1111/j.1365-294X.2004.02139.x
Estoup, A., Ravigné, V., Hufbauer, R., Vitalis, R., Gautier, M., and Facon, B. (2016). Is there a genetic paradox of biological invasion? Annu. Rev. Ecol. Evol. Syst. 47, 51–72. doi: 10.1146/annurev-ecolsys-121415-032116
Eveno, E., Collada, C., Angeles Guevara, M., Léger, V., Soto, A., Díaz, L., et al. (2008). Contrasting patterns of selection at Pinus pinaster Ait. drought stress candidate genes as revealed by genetic differentiation analyses. Mol. Biol. Evol. 25, 417–437. doi: 10.1093/molbev/msm272
Excoffier, L., Smouse, P. E., and Quattro, J. M. (1992). Analysis of molecular variance inferred from metric distances among DNA haplotypes: Application to human mitochondrial DNA restriction sites. Genetics 131, 479–491. doi: 10.1093/genetics/131.2.479
Exposito-Alonso, M., Vasseur, F., Ding, W., Wang, G., Burbano, H. A., and Weigel, D. (2018). Genomic basis and evolutionary potential for extreme drought adaptation in Arabidopsis thaliana. Nat. Ecol. Evol. 2, 353–358. doi: 10.1038/s41559-017-0423-0
Falconer, D. S., and Mackay, T. F. C. (1996). Introduction to quantitative genetics, 4th ed. London: Prentice Hall.
Feng, L., and Du, F. K. (2022). Landscape genomics in tree conservation under a changing environment. Front. Plant Sci. 13:822217. doi: 10.3389/fpls.2022.822217
Fenster, C. B., and Dudash, M. R. (1994). “Genetic considerations for plant population conservation and restoration” in Restoration of endangered species: Conceptual issues, planning and implementation. eds. M. L. Bowles and C. J. Whelan (Cambridge, United Kingdom: Cambridge University Press), 34–62. doi: 10.1017/CBO9780511623325.004
Fischer, M. C., Rellstab, C., Leuzinge, M., Roumet, M., Gugerli, F., Shimizu, K. K., et al. (2017). Estimating genomic diversity and population differentiation – an empirical comparison of microsatellite and SNP variation in Arabidopsis halleri. BMC Genomics 18:69. doi: 10.1186/s12864-016-3459-7
Fisher, R. A. (1930). The genetical theory of natural selection. London: Oxford University Press, doi: 10.5962/bhl.title.27468
Fitzpatrick, M. C., and Keller, S. R. (2015). Ecological genomics meets community-level modelling of biodiversity: mapping the genomic landscape of current and future environmental adaptation. Ecol. Lett. 18, 1–16. doi: 10.1111/ele.12376
Flanagan, S. P., Forester, B. R., Latch, E. K., Aitken, S. N., and Hoban, S. (2018). Guidelines for planning genomic assessment and monitoring of locally adaptive variation to inform species conservation. Evol. Appl. 11, 1035–1052. doi: 10.1111/eva.12569
Forester, B. R., Lasky, J. R., Wagner, H. H., and Urban, D. L. (2018). Comparing methods for detecting multi-locus adaptation with multivariate genotype-environment associations. Mol. Ecol. 27, 2215–2233. doi: 10.1111/mec.14584
Fournier-Level, A., Korte, A., Cooper, M. D., Nordborg, M., Schmitt, J., and Wilczek, A. M. (2011). A map of local adaptation in Arabidopsis thaliana. Science 334, 86–89. doi: 10.1126/science.1209271
Frankham, R. (1996). Relationship of genetic variation to population size in wildlife. Conserv. Biol. 10, 1500–1508. doi: 10.1046/j.1523-1739.1996.10061500.x
Frankham, R. (2015). Genetic rescue of small inbred populations: meta-analysis reveals large and consistent benefits of gene flow. Mol. Ecol. 24, 2610–2618. doi: 10.1111/mec.13139
Frichot, E., Schoville, S. D., Bouchard, G., and François, O. (2013). Testing for associations between loci and environmental gradients using latent factor mixed models. Mol. Biol. Evol. 30, 1687–1699. doi: 10.1093/molbev/mst063
Fu, Y. X. (1996). New statistical tests of neutrality for DNA samples from a population. Genetics 143, 557–570. doi: 10.1093/genetics/143.1.557
Funk, W. C., Forester, B. R., Converse, S. J., Darst, C., and Morey, S. (2018). Improving conservation policy with genomics: a guide to integrating adaptive potential into U.S. endangered species act decisions for conservation practitioners and geneticists. Conserv. Genet. 20, 115–134. doi: 10.1007/s10592-018-1096-1
Funk, W. C., Lovich, R. E., Hohenlohe, P. A., Hofman, C. A., Morrison, S. A., Sillett, T. S., et al. (2016). Adaptive divergence despite strong genetic drift: genomic analysis of the evolutionary mechanisms causing genetic differentiation in the island fox (Urocyon littoralis). Mol. Ecol. 25, 2176–2194. doi: 10.1111/mec.13605
Funk, W. C., McKay, J. K., Hohenlohe, P. A., and Allendorf, F. W. (2012). Harnessing genomics for delineating conservation units. Trends Ecol. Evol. 27, 489–496. doi: 10.1016/j.tree.2012.05.012
Gailing, O., Vornam, B., Leinemann, L., and Finkeldey, G. (2009). Genetic and genomic approaches to assess adaptive genetic variation in plants: Forest trees as a model. Physiol. Plant. 137, 509–519. doi: 10.1111/j.1399-3054.2009.01263.x
Gann, G. D., McDonald, T., Walder, B., Aronson, J., Nelson, C. R., Jonson, J., et al. (2019). International principles and standards for the practice of ecological restoration. Restor. Ecol. 27, S1–S46. doi: 10.1111/rec.13035
García-Dorado, A., and Caballero, A. (2021). Neutral genetic diversity as a useful tool for conservation biology. Conserv. Genet. 22, 541–545. doi: 10.1007/s10592-021-01384-9
Gargiulo, R., Adamo, M., Cribb, P. J., Bartolucci, F., Sarasan, V., Alessandrelli, C., et al. (2021). Combining current knowledge of Cypripedium calceolus with a new analysis of genetic variation in Italian populations to provide guidelines for conservation actions. Conserv. Sci. Pract. 3:e513. doi: 10.1111/csp2.513
Ge, S., and Guo, Y. -L. (2020). Evolution of genes and genomes in the genomics era. Sci. China Life Sci. 63, 602–605. doi: 10.1007/s11427-020-1672-0
Gilpin, M. E., and Soulé, M. E. (1986). “Minimum viable populations: processes of species extinction” in Conservation biology: The science of scarcity and diversity. ed. M. E. Soulé (Sunderland, United States: Sinauer), 19–34.
Godt, M. J. W., and Hamrick, J. L. (2001). Genetic diversity in rare southeastern plants. Nat. Areas J. 21, 61–70.
Grueber, C. E. (2015). Comparative genomics for biodiversity. Comp. Struct. Biotechnol. J. 13, 370–375. doi: 10.1016/j.csbj.2015.05.003
Gugger, P. F., Peñaloza-Gibbon, S., Wright, J. W., and Sork, V. L. (2017). Whole-transcriptome response to water stress in a California endemic oak Quercus lobata. Tree Physiol. 37, 632–644. doi: 10.1093/treephys/tpw122
Haig, S. M., Miller, M. P., Bellinger, R., Draheim, H. M., Mercer, D. M., and Mullins, T. D. (2016). The conservation genetics juggling act: integrating genetics and ecology, science and policy. Evol. Appl. 9, 181–195. doi: 10.1111/eva.12337
Hamrick, J. L., and Godt, M. J. W. (1996a). Effects of life history traits on genetic diversity in plant species. Philos. Trans. R. Soc. London. Ser. B-Biol. Sci. 351, 1291–1298. doi: 10.1098/rstb.1996.0112
Hamrick, J. L., and Godt, M. J. W. (1996b). “Conservation genetics of endemic plant species” in Conservation genetics: Case histories from nature. eds. J. C. Avise and J. L. Hamrick (London, United Kingdom: Chapman & Hall), 281–304. doi: 10.1007/978-1-4757-2504-9_9
Hamrick, J. L., Godt, M. J. W., and Gonzales, E. (2006). Conservation of genetic diversity in old-growth forest communities of the southeastern United States. Appl. Veg. Sci. 9, 51–57. doi: 10.1111/j.1654-109X.2006.tb00655.x
Hamrick, J. L., and Trapnell, D. W. (2011). Using population genetic analyses to understand seed dispersal patterns. Acta Oecol. Int. J. Ecol. 37, 641–649. doi: 10.1016/j.actao.2011.05.008
Handler, S., Pike, C., and St Clair, B. (2022). Assisted migration. Washington, D.C: USDA Forest Service Climate Change Resource Center. Available at: https://www.fs.usda.gov/ccrc/topics/assisted-migration.
Harrisson, K. A., Pavlova, A., Telonis-Scott, M., and Sunnucks, P. (2014). Using genomics to characterize evolutionary potential for conservation of wild populations. Evol. Appl. 7, 1008–1025. doi: 10.1111/eva.12149
He, X., Johansson, M. L., and Heath, D. D. (2016). Role of genomics and transcriptomics in selection of reintroduction source populations. Conserv. Biol. 30, 1010–1018. doi: 10.1111/cobi.12674
Hedrick, P. W. (2005). A standardized genetic differentiation measure. Evolution 59, 1633–1638. doi: 10.1111/j.0014-3820.2005.tb01814.x
Hedrick, P. W., and García-Dorado, A. (2016). Understanding inbreeding depression, purging, and genetic rescue. Trends Ecol. Evol. 31, 940–952. doi: 10.1016/j.tree.2016.09.005
Hoffmann, A. A., Weeks, A. R., and Sgrò, C. M. (2021). Opportunities and challenges in assessing climate change vulnerability through genomics. Cells 184, 1420–1425. doi: 10.1016/j.cell.2021.02.006
Hohenlohe, P. A., Funk, W. C., and Rajora, O. P. (2020). Population genomics for wildlife conservation and management. Mol. Ecol. 30, 62–82. doi: 10.1111/mec.15720
Holderegger, R., Balkenhol, N., Bolliger, J., Engler, J. O., Gugerli, F., Hochkirch, A., et al. (2019). Conservation genetics: linking science with practice. Mol. Ecol. 28, 3848–3856. doi: 10.1111/mec.15202
Holderegger, R., Kamm, U., and Gugerli, F. (2006). Adaptive vs. neutral genetic diversity: implications for landscape genetics. Landsc. Ecol. 21, 797–807. doi: 10.1007/s10980-005-5245-9
Holsinger, K., and Weir, B. S. (2009). Genetics in geographically structured populations: defining, estimating and interpreting FST. Nat. Rev. Genet. 10, 639–650. doi: 10.1038/nrg2611
Houle, D. (1992). Comparing evolvability and variability of quantitative traits. Genetics 130, 195–204. doi: 10.1093/genetics/130.1.195
Hudson, R. R., Kreitman, M., and Aguadé, M. (1987). A test of neutral molecular evolution based on nucleotide data. Genetics 116, 153–159. doi: 10.1093/genetics/116.1.153
Hurlbert, S. H. (1971). The nonconcept of species diversity: a critique and alternative parameters. Ecology 52, 577–586. doi: 10.2307/1934145
Ikeda, H., Senni, K., Fujii, N., and Setoguchi, H. (2006). Refugia of Potentilla matsumurae (Rosaceae) located at high mountains in the Japanese archipelago. Mol. Ecol. 15, 3731–3740. doi: 10.1111/j.1365-294X.2006.03054.x
Ishihama, F., Nakano, C., Ueno, S., Ajima, M., Tsumura, Y., and Washitani, I. (2003). Seed set and gene flow patterns in an experimental population of an endangered heterostylous herb with controlled local opposite-morph density. Funct. Ecol. 17, 680–689. doi: 10.1046/j.1365-2435.2003.00773.x
Jeffries, D. L., Copp, G. H., Handley, L. L., Olsén, K. H., Sayer, C. D., and Hanfling, B. (2016). Comparing RAD seq and microsatellites to infer complex phylogeographic patterns, an empirical perspective in the crucian carp, Carassius carassius. L. Mol. Ecol. 25, 2997–3018. doi: 10.1111/mec.13613
Joost, S., Bonin, A., Bruford, M. W., Despres, L., Conord, C., Erhardt, G., et al. (2007). A spatial analysis method (SAM) to detect candidate loci for selection: towards a landscape genomics approach to adaptation. Mol. Ecol. 16, 3955–3969. doi: 10.1111/j.1365-294X.2007.03442.x
Jordan, R., Hoffmann, A. A., Dillon, S. K., and Prober, S. M. (2017). Evidence of genomic adaptation to climate in Eucalyptus microcarpa: implications for adaptive potential to projected climate change. Mol. Ecol. 26, 6002–6020. doi: 10.1111/mec.14341
Josephs, E. B., Stinchcombe, J. R., and Wright, S. I. (2017). What can genome-wide association studies tell us about the evolutionary forces maintaining genetic variation for quantitative traits? New Phytol. 214, 21–33. doi: 10.1111/nph.14410
Jost, L. (2008). GST and its relatives do not measure differentiation. Mol. Ecol. 17, 4015–4026. doi: 10.1111/j.1365-294X.2008.03887.x
Jost, L., Archer, F., Flanagan, S., Gaggiotti, O., Hoban, S., and Latch, E. (2018). Differentiation measures for conservation genetics. Evol. Appl. 11, 1139–1148. doi: 10.1111/eva.12590
Kahilainen, A., Puurtinen, M., and Kotiaho, J. S. (2014). Conservation implications of species–genetic diversity correlations. Glob. Ecol. Conserv. 2, 315–323. doi: 10.1016/j.gecco.2014.10.013
Kalisz, S., Randle, A., Chaiffetz, D., Faigeles, M., Butera, A., and Beight, C. (2012). Dichogamy correlates with outcrossing rate and defines the selfing syndrome in the mixed-mating genus Collinsia. Ann. Bot. 109, 571–582. doi: 10.1093/aob/mcr237
Kardos, M., Armstrong, E., Fitzpatrick, S., Hauser, S., Hedrick, P., Miller, J., et al. (2021). The crucial role of genome-wide genetic variation in conservation. Proc. Natl. Acad. Sci. U. S. A. 118:e2104642118. doi: 10.1073/pnas.2104642118
Keller, L. F., and Waller, D. M. (2002). Inbreeding effects in wild populations. Trends Ecol. Evol. 17, 230–241. doi: 10.1016/S0169-5347(02)02489-8
Kim, Y.-Y., Kwon, S. -H., Jo, A., Kim, Y.-G., Lee, J.-W., and Kang, K.-S. (2018). Single nucleotide polymorphism (SNP) characterization of drought-responsive genes to estimate genetic variation of Populus tremula var. davidiana and eight other Populus species. Can. J. For. Res. 48, 689–696. doi: 10.1139/cjfr-2017-0387
Kirk, H., and Freeland, J. R. (2011). Applications and implications of neutral versus non-neutral markers in molecular ecology. Int. J. Mol. Sci. 12, 3966–3988. doi: 10.3390/ijms12063966
Korte, A., and Farlow, A. (2013). The advantages and limitations of trait analysis with GWAS: a review. Plant Methods 9:29. doi: 10.1186/1746-4811-9-29
Lande, R. (1998). Genetics and demography in biological conservation. Science 241, 1455–1460. doi: 10.1126/science.3420403
Lasky, J. R., Des Marais, D. L., Lowry, D. B., Povolotskaya, I., McKay, J. K., Richards, J. H., et al. (2014). Natural variation in abiotic stress responsive gene expression and local adaptation to climate in Arabidopsis thaliana. Mol. Biol. Evol. 31, 2283–2296. doi: 10.1093/molbev/msu170
Le Corre, V., and Kremer, A. (2003). Genetic variability at neutral markers, quantitative trait loci and trait in a subdivided population under selection. Genetics 164, 1205–1219. doi: 10.1093/genetics/164.3.1205
Leimu, R., Mutikainen, P., Koricheva, J., and Fischer, M. (2006). How general are positive relationships between plant population size, fitness and genetic variation? J. Ecol. 94, 942–952. doi: 10.1111/j.1365-2745.2006.01150.x
Leinonen, T., McCairns, R. J. S., O’Hara, R. B., and Merilä, J. (2013). QST – FST comparisons: evolutionary and ecological insights from genomic heterogeneity. Nat. Rev. Genet. 14, 179–190. doi: 10.1038/nrg3395
Leinonen, T., O’Hara, P. B., Cano, J. M., and Merilä, J. (2008). Comparative studies of quantitative trait and neutral marker divergence: a meta-analysis. J. Evol. Biol. 21, 1–17. doi: 10.1111/j.1420-9101.2007.01445.x
Li, Y., Zhang, X.-X., Mao, R.-L., Yang, J., Miao, C.-Y., Li, Z., et al. (2017). Ten years of landscape genomics: challenges and opportunities. Front. Plant Sci. 8:2136. doi: 10.3389/fpls.2017.02136
Loiselle, B. A., Sork, V. L., Nason, J., and Graham, C. (1995). Spatial genetic structure of a tropical understory shrub, Psychotria officinalis (Rubiaceae). Am. J. Bot. 82, 1420–1425. doi: 10.1002/j.1537-2197.1995.tb12679.x
Lowe, A., Harris, S., and Ashton, P. (2004). Ecological genetics: Design, analysis and application. Oxford: Blackwell.
Mable, B. K. (2019). Conservation of adaptive potential and functional diversity: integrating old and new approaches. Conserv. Genet. 20, 89–100. doi: 10.1007/s10592-018-1129-9
Mastretta-Yanes, A., Acevedo Gasman, F., Burgeff, C., Cano Ramírez, M., Piñero, D., and Sarukhán, J. (2018). An initiative for the study and use of genetic diversity of domesticated plants and their wild relatives. Front. Plant Sci. 9:209. doi: 10.3389/fpls.2018.00209
McDonald, J. H., and Kreitman, M. (1991). Adaptive protein evolution at the Adh locus in Drosophila. Nature 351, 652–654. doi: 10.1038/351652a0
McKown, A. D., Klápště, J., Guy, R. D., Geraldes, A., Porth, I., Hannemann, J., et al. (2014). Genome-wide association implicates numerous genes underlying ecological trait variation in natural populations of Populus trichocarpa. New Phytol. 203, 535–553. doi: 10.1111/nph.12815
McLachlan, J. S., Hellmann, J. J., and Schwartz, M. W. (2007). A framework for debate of assisted migration in an era of climate change. Conserv. Biol. 21, 297–302. doi: 10.1111/j.1523-1739.2007.00676.x
McLane, S. C., and Aitkin, S. N. (2012). Whitebark pine (Pinus albicaulis) assisted migration potential: testing establishment north of the species range. Ecol. Appl. 22, 142–153. doi: 10.1890/11-0329.1
Meier, A. J., Bratton, S. P., and Duffy, D. C. (1995). Possible ecological mechanisms for loss of vernal herb diversity in logged eastern deciduous forest. Ecol. Appl. 5, 935–946. doi: 10.2307/2269344
Meirmans, P. G., and Hedrick, P. W. (2011). Assessing population structure: FST and related measures. Mol. Ecol. Resour. 11, 5–18. doi: 10.1111/j.1755-0998.2010.02927.x
Merilä, J., and Crnokrak, P. (2001). Comparison of genetic differentiation at marker loci and quantitative traits. J. Evol. Biol. 14, 892–903. doi: 10.1046/j.1420-9101.2001.00348.x
Mertens, A., Bawin, Y., Vanden Abeele, S., Kallow, S., Toan Vu, D., Thi Le, L., et al. (2021). Genetic diversity and structure of Musa balbisiana populations in Vietnam and its implications for the conservation of banana crop wild relatives. PLoS One 16:e0253255. doi: 10.1371/journal.pone.0253255
Mittell, E. A., Cobbold, C. A., Ijaz, U. Z., Kilbride, E. A., Moore, K. A., and Mable, B. K. (2020). Feral populations of Brassica oleracea along Atlantic coasts in western Europe. Ecol. Evol. 10, 11810–11825. doi: 10.1002/ece3.6821
Mittell, E. A., Nakagawa, S., and Hadfield, J. D. (2015). Are molecular markers useful predictors of adaptive potential? Ecol. Lett. 18, 772–778. doi: 10.1111/ele.12454
Mondini, L., Noorani, A., and Pagnotta, M. A. (2009). Assessing plant genetic diversity by molecular tools. Diversity 1, 19–35. doi: 10.3390/d1010019
Nason, J. D., Herre, E. A., and Hamrick, J. L. (1998). The breeding structure of a tropical keystone plant resource. Nature 391, 685–687. doi: 10.1038/35607
Neale, J. R. (2012). “Genetic considerations in rare plant reintroduction: practical applications (or how are we doing?)” in Plant reintroduction in a changing climate. The science and practice of ecological restoration. eds. J. Maschinski, K. E. Haskins, and P. H. Raven (Washington, DC, United States: Island Press), 71–88. doi: 10.5822/978-1-61091-183-2_5
Nei, M. (1973). Analysis of gene diversity in subdivided populations. Proc. Natl. Acad. Sci. U. S. A. 70, 3321–3323. doi: 10.1073/pnas.70.12.3321
Nei, M. (1978). Estimation of average heterozygosity and genetic distance from a small number of individuals. Genetics 89, 583–590. doi: 10.1093/genetics/89.3.583
Nei, M., and Kumar, N. (2000). Molecular evolution and phylogenetics. Oxford: Oxford University Press.
Nei, M., and Li, W.-H. (1979). Mathematical model for studying genetic variation in terms of restriction endonucleases. Proc. Natl. Acad. Sci. U. S. A. 76, 5269–5273. doi: 10.1073/pnas.76.10.5269
Nichols, K., and Neale, D. B. (2010). “Association genetics, population genomics, and conservation: revealing the genes underlying adaptation in natural populations of plants and animals” in Molecular approaches in natural resource conservation and management. eds. J. J. A. DeWoody, J. W. Bickham, C. H. Michler, K. M. Nichols, O. E. Rhodes, and K. E. Woeste (New York, United States: Cambridge University Press), 123–168. doi: 10.1017/CBO9780511777592.007
Niu, X. M., Xu, Y. C., Li, Z. W., Bian, Y. T., Hou, X. H., Chen, J. F., et al. (2019). Transposable elements drive rapid phenotypic variation in Capsella rubella. Proc. Natl. Acad. Sci. U. S. A. 116, 6908–6913. doi: 10.1073/pnas.1811498116
Olson, M. S., Levsen, N., Soolanayakanahally, R. Y., Guy, R. D., Schroeder, W. R., Keller, S. R., et al. (2013). The adaptive potential of Populus balsamifera L. to phenology requirements in a warmer global climate. Mol. Ecol. 22, 1214–1230. doi: 10.1111/mec.12067
Ottewell, K. M., Bickerton, D. C., Byrne, M., and Lowe, A. J. (2016). Bridging the gap: a genetic assessment framework for population-level threatened plant conservation prioritization and decision-making. Divers. Distrib. 22, 174–188. doi: 10.1111/ddi.12387
Ouborg, N. J., Pertoldi, C., Loeschcke, V., Bijlsma, R., and Hedrick, P. W. (2010). Conservation genetics in transition to conservation genomics. Trends Genet. 26, 177–187. doi: 10.1016/j.tig.2010.01.001
Ovaskainen, O., Karhunen, M., Zheng, C., Arias, J. M. C., and Merilä, J. (2011). A new method to uncover signatures of divergent and stabilizing selection in quantitative traits. Genetics 189, 621–632. doi: 10.1534/genetics.111.129387
Pardini, E. A., and Hamrick, J. L. (2008). Inferring recruitment history from spatial genetic structure within populations of the colonizing tree Albizia julibrissin (Fabaceae). Mol. Ecol. 17, 2865–2879. doi: 10.1111/j.1365-294X.2008.03807.x
Petit, R. J., El Mousadik, A., and Pons, O. (1998). Identifying populations for conservation on the basis of genetic markers. Conserv. Biol. 12, 844–855. doi: 10.1046/j.1523-1739.1998.96489.x
Petit, C., Fréville, H., Mignot, A., Colas, B., Riba, M., Imbert, E., et al. (2001). Gene flow and local adaptation in two endemic plant species. Biol. Conserv. 100, 21–34. doi: 10.1016/S0006-3207(00)00204-4
Petit, R., and Hampe, A. (2006). Some evolutionary consequences of being a tree. Annu. Rev. Ecol. Evol. Syst. 37, 187–214. doi: 10.1146/annurev.ecolsys.37.091305.110215
Pobke, K. (2007). Draft recovery plan for 23 threatened flora taxa on Eyre peninsula, South Australia 2007–2012. South Australia: Department for Environment and Heritage.
Podolsky, R. H. (2001). Genetic variation for morphological and allozyme variation in relation to population size in Clarkia dudleyana, an endemic annual. Conserv. Biol. 15, 412–423. doi: 10.1046/j.1523-1739.2001.015002412.x
Price, M. V., and Waser, N. M. (1979). Pollen dispersal and optimal outcrossing in Delphinium nelsonii. Nature 277, 294–297. doi: 10.1038/277294a0
Razgour, O., Forester, B., Taggart, J. B., Bekaert, M., Juste, J., Ibáñez, C., et al. (2019). Considering adaptive genetic variation in climate change vulnerability assessment reduces species range loss projections. Proc. Natl. Acad. Sci. U. S. A. 116, 10418–10423. doi: 10.1073/pnas.1820663116
Reed, D. H., and Frankham, R. (2001). How closely correlated are molecular and quantitative measures of genetic variation? A meta-analysis. Evolution 55, 1095–1103. doi: 10.1111/j.0014-3820.2001.tb00629.x
Rellstab, C., Dauphin, B., and Exposito-Alonso, M. (2021). Prospects and limitations of genomic offset in conservation management. Evol. Appl. 14, 1202–1212. doi: 10.1111/eva.13205
Rellstab, C., Gugerli, F., Eckert, A. J., Hancock, A. M., and Holderegger, R. (2015). A practical guide to environmental association analysis in landscape genomics. Mol. Ecol. 24, 4348–4370. doi: 10.1111/mec.13322
Rellstab, C., Zoller, S., Walthert, L., Lesur, I., Pluess, A. R., Graf, R., et al. (2016). Signatures of local adaptation in candidate genes of oaks (Quercus spp.) with respect to present and future climatic conditions. Mol. Ecol. 25, 5907–5924. doi: 10.1111/mec.13889
Reusch, T. B. H., Stam, W. T., and Olsen, J. L. (2001). A microsatellite-based estimation of clonal diversity and population subdivision in Zostera marina, a marine flowering plant. Mol. Ecol. 9, 127–140. doi: 10.1046/j.1365-294x.2000.00839.x
Rivers, M. C., Brummitt, N. A., Lughadha, E. N., and Meagher, T. R. (2014). Do species conservation assessments capture genetic diversity? Glob. Ecol. Conserv. 2, 81–87. doi: 10.1016/j.gecco.2014.08.005
Robinson, J. A., Ortega-Del Vecchyo, D., Fan, Z., Kim, B. Y., vonHoldt, B. M., Marsden, C. D., et al. (2016). Genomic flatlining in the endangered island fox. Curr. Biol. 26, 1183–1189. doi: 10.1016/j.cub.2016.02.062
Romiguier, J., Gayral, P., Ballenghien, M., Bernard, A., Cahais, V., Chemuil, A., et al. (2014). Comparative population genomics in animals uncovers the determinants of genetic diversity. Nature 515, 261–263. doi: 10.1038/nature13685
Saccheri, I., Kuussaari, M., Vikman, P., Fortelius, W., and Hanski, I. (1998). Inbreeding and extinction in a butterfly meta-population. Nature 392, 491–494. doi: 10.1038/33136
Savolainen, O., Pyhäjärvi, T., and Knürr, T. (2007). Gene flow and local adaptation in trees. Annu. Rev. Ecol. Evol. Syst. 38, 595–619. doi: 10.1146/annurev.ecolsys.38.091206.095646
Schemske, D. W., Husband, B. C., Rickelshaus, M. H., Goodwillie, C., Parker, I. M., and Bishop, J. G. (1994). Evaluating approaches to the conservation of rare and endangered plants. Ecology 75, 584–606. doi: 10.2307/1941718
Schlötterer, C. (2004). The evolution of molecular markers – just a matter of fashion. Nat. Rev. Genet. 5, 63–69. doi: 10.1038/nrg1249
Schoville, S. D., Bonin, A., François, O., Lobreaux, S., Melodelima, C., and Manel, S. (2012). Adaptive genetic variation on the landscape: methods and cases. Annu. Rev. Ecol. Evol. Syst. 43, 23–43. doi: 10.1146/annurev-ecolsys-110411-160248
Schwartz, M. K., Luikart, G., and Waples, R. S. (2007). Genetic monitoring as a promising tool for conservation and management. Trends Ecol. Evol. 22, 25–33. doi: 10.1016/j.tree.2006.08.009
Shafer, A. B. A., Wolf, J. B. W., Alves, P. C., Bergström, L., Bruford, M. W., Brännström, I., et al. (2015). Genomics and the challenging translation into conservation practice. Trends Ecol. Evol. 30, 78–87. doi: 10.1016/j.tree.2014.11.009
Shirk, R. Y., and Hamrick, J. L. (2014). Multivariate adaptation but no increase in competitive ability in invasive Geranium carolinianum L. (Geraniaceae). Evolution 68, 2945–2959. doi: 10.1111/evo.12474
Silva, A. R., Resende-Moreira, L. C., Carvalho, C. S., Lanes, E. C. M., Ortiz-Vera, M. P., Viana, P. L., et al. (2020). Range-wide neutral and adaptive genetic structure of an endemic herb from Amazonian savannas. AoB Plants 12, 1–11. doi: 10.1093/aobpla/plaa003
Smith, A. L., Hodkinson, T. R., Villellas, J., Catford, J. A., Csergo, A. M., Blomberg, S. P., et al. (2020). Global gene flow releases invasive plants from environmental constraints on genetic diversity. Proc. Natl. Acad. Sci. U. S. A. 117, 4218–4227. doi: 10.1073/pnas.1915848117
Sork, V. (2018). Genomic studies of local adaptation in natural plant populations. J. Hered. 109, 3–15. doi: 10.1093/jhered/esx091
Spitze, K. (1993). Population structure in Daphnia obtusa: quantitative genetic and allozymic variation. Genetics 135, 367–374. doi: 10.1093/genetics/135.2.367
Supple, M. A., and Shapiro, B. (2018). Conservation of biodiversity in the genomics era. Genome Biol. 19, 131–112. doi: 10.1186/s13059-018-1520-3
Suyama, Y., and Matsuki, Y. (2015). MIG-Seq: an effective PCR-based method for genome-wide single-nucleotide polymorphism genotyping using the next-generation sequencing platform. Sci. Rep. 5:16963. doi: 10.1038/srep16963
Tajima, F. (1989). Statistical-method for testing the neutral mutation hypothesis by DNA polymorphism. Genetics 123, 585–595. doi: 10.1093/genetics/123.3.585
Takahashi, T., Tani, N., Taira, H., and Tsumura, Y. (2005). Microsatellite markers reveal high allelic variation in natural populations of Cryptomeria japonica near refugial areas of the last glacial period. J. Plant Res. 118, 83–90. doi: 10.1007/s10265-005-0198-2
Teixeira, J. C., and Huber, C. D. (2021). The inflated significance of neutral genetic diversity in conservation genetics. Proc. Natl. Acad. Sci. U. S. A. 118:e2015096118. doi: 10.1073/pnas.2015096118
Thomsen, P. F., and Willerslev, E. (2015). Environmental DNA – an emerging tool in conservation for monitoring past and present biodiversity. Biol. Conserv. 183, 4–18. doi: 10.1016/j.biocon.2014.11.019
Todesco, M., Owens, G. L., Bercovich, N., Légaré, J.-S., Soudi, S., Burge, D. O., et al. (2020). Massive haplotypes underlie ecotypic differentiation in sunflowers. Nature 584, 602–607. doi: 10.1038/s41586-020-2467-6
Toro, M. A., and Caballero, A. (2005). Characterization and conservation of genetic diversity in subdivided populations. Philos. Trans. R. Soc. London. Ser. B-Biol. Sci. 360, 1367–1378. doi: 10.1098/rstb.2005.1680
Tsumura, Y. (2022). Genetic guidelines for tree species and perspectives on the conservation and sustainable use of forests. J. For. Res. 27, 83–95. doi: 10.1080/13416979.2022.2040096
Tsumura, Y., Kado, T., Takahashi, T., Tani, N., Ujino-Ihara, T., and Iwata, H. (2007). Genome-scan to detect genetic structure and adaptive genes of natural populations of Cryptomeria japonica. Genetics 176, 2393–2403. doi: 10.1534/genetics.107.072652
Tsumura, Y., Uchiyama, K., Moriguchi, Y., Kimura, M. K., Ueno, S., and Ujino-Ihara, T. (2014). Genetic differentiation and evolutionary adaptation in Cryptomeria japonica. G3 4, 2389–2402. doi: 10.1534/g3.114.013896
van Kleunen, M., Bossdorf, O., and Dawson, W. (2018). The ecology and evolution of alien plants. Annu. Rev. Ecol. Evol. Syst. 49, 25–47. doi: 10.1146/annurev-ecolsys-110617-062654
Verity, R., and Nichols, R. A. (2014). What is genetic differentiation, and how should we measure it—GST, D, neither or both? Mol. Ecol. 23, 4216–4225. doi: 10.1111/mec.12856
Visscher, P. M., Hill, W. G., and Wray, N. R. (2008). Heritability in the genomics era – concepts and misconceptions. Nat. Rev. Genet. 9, 255–266. doi: 10.1038/nrg2322
Volis, S., Yakubov, B., Shulgina, I., Ward, D., and Mendlinger, S. (2005). Distinguishing adaptive from non-adaptive genetic differentiation: comparison of QST and FST at two spatial scales. Heredity 95, 466–475. doi: 10.1038/sj.hdy.6800745
Vranken, S., Wernberg, T., Scheben, A., Severn-Ellis, A. A., Batley, J., Bayer, P. E., et al. (2021). Genotype-environment mismatch of kelp forests under climate change. Mol. Ecol. 30, 3730–3746. doi: 10.1111/mec.15993
Wade, M. (2021) in Ecological genetics: The Stanford encyclopedia of philosophy. ed. E. N. Zalta (Stanford: Stanford University. Available at: https://plato.stanford.edu/archives/win2021/entries/ecological-genetics/)
Wang, L., Abbott, R. J., Zheng, W., Chen, P., Wang, W., and Li, J. (2009). History and evolution of alpine plants endemic to the Qinghai-Tibetan Plateau: aconitum gymnandrum (Ranunculaceae). Mol. Ecol. 18, 709–721. doi: 10.1111/j.1365-294X.2008.04055.x
Waples, R. S. (2015). Testing for Hardy–Weinberg proportions: have we lost the plot? J. Hered. 106, 1–19. doi: 10.1093/jhered/esu062
Watterson, G. A. (1975). On the number of segregating sites in genetical models without recombination. Theor. Popul. Biol. 7, 256–276. doi: 10.1016/0040-5809(75)90020-9
Weir, B. S., and Cockerham, C. C. (1984). Estimating F-statistics for the analysis of population structure. Evolution 38, 1358–1370. doi: 10.1111/j.1558-5646.1984.tb05657.x
Whitlock, M. C. (2008). Evolutionary inference from QST. Mol. Ecol. 17, 1885–1896. doi: 10.1111/j.1365-294X.2008.03712.x
Whitlock, R., Hipperson, H., Thompson, D. B. A., Butlin, R. K., and Burke, T. (2016). Consequences of in-situ strategies for the conservation of plant genetic diversity. Biol. Conserv. 203, 134–142. doi: 10.1016/j.biocon.2016.08.006
Whitlock, R., Stewart, G. B., Goodman, S. J., Piertney, S. B., Butlin, R. K., Pullin, A. S., et al. (2013). A systematic review of phenotypic responses to between-population outbreeding. Environ. Evid. 2:13. doi: 10.1186/2047-2382-2-13
Willi, Y., Kristensen, T. N., Sgrò, C. M., Weeks, A. R., Ørsted, M., and Hoffmann, A. A. (2022). Conservation genetics as a management tool: the five best-supported paradigms to assist the management of threatened species. Proc. Natl. Acad. Sci. U. S. A. 119:e2105076119. doi: 10.1073/pnas.2105076119
Willi, Y., Van Buskirk, J., and Hoffmann, A. A. (2006). Limits to the adaptive potential of small populations. Annu. Rev. Ecol. Evol. Syst. 37, 433–458. doi: 10.1146/annurev.ecolsys.37.091305.110145
Wright, S. (1951). The genetical structure of populations. Ann. Eugenics 15, 323–354. doi: 10.1111/j.1469-1809.1949.tb02451.x
Yang, H., Li, J., Milne, R. I., Tao, W., Wang, Y., Miao, J., et al. (2022). Genomic insights into the genotype-environment mismatch and conservation units of a Qinghai-Tibet Plateau endemic cypress under climate change. Evol. Appl. 15, 919–933. doi: 10.1111/eva.13377
Ye, Q., Tang, F., Wei, N., and Yao, X. (2014). Molecular and quantitative trait variation within and among small fragmented populations of the endangered plant species Psilopeganum sinense. Ann. Bot. 113, 79–86. doi: 10.1093/aob/mct255
Young, A., Boyle, T., and Brown, T. (1996). The population genetic consequences of habitat fragmentation for plants. Trends Ecol. Evol. 11, 413–418. doi: 10.1016/0169-5347(96)10045-8
Zhang, J., Pan, D., Fan, Z., Yu, H., Jiang, L., Lv, S., et al. (2022). Genetic diversity of wild rice accessions (Oryza rufipogon Griff.) in Guangdong and Hainan provinces, China, and construction of wild rice core collection. Front. Plant Sci. 13:999454. doi: 10.3389/fpls.2022.999454
Keywords: adaptive variation, conservation, demography, geneticists, neutral variation
Citation: Chung MY, Merilä J, Li J, Mao K, López-Pujol J, Tsumura Y and Chung MG (2023) Neutral and adaptive genetic diversity in plants: An overview. Front. Ecol. Evol. 11:1116814. doi: 10.3389/fevo.2023.1116814
Edited by:
Alison G. Nazareno, Federal University of Minas Gerais, BrazilReviewed by:
Yessica Rico, Instituto de Ecología (INECOL), MexicoLoreta Brandão de Freitas, Federal University of Rio Grande do Sul, Brazil
Copyright © 2023 Chung, Merilä, Li, Mao, López-Pujol, Tsumura and Chung. This is an open-access article distributed under the terms of the Creative Commons Attribution License (CC BY). The use, distribution or reproduction in other forums is permitted, provided the original author(s) and the copyright owner(s) are credited and that the original publication in this journal is cited, in accordance with accepted academic practice. No use, distribution or reproduction is permitted which does not comply with these terms.
*Correspondence: Myong Gi Chung, ✉ bWdjaHVuZ0BnbnUuYWMua3I=