 Han-Teng Liao
 Chung-Lien Pan
 Yuan Zhang
- 1Laboratory of ESG Data-Driven Decisions, Nanfang College-Guangzhou, Conghua, Guangzhou, China
- 2Higher Education Impact Assessment Center, Nanfang College-Guangzhou, Conghua, Guangzhou, China
- 3Oxford Roadmapping, Guangzhou, Guangdong, China
- 4School of Accounting, Nanfang College-Guangzhou, Conghua, Guangzhou, China
This brief research report focuses on the effects of artificial intelligence (AI) on the environment, by analyzing the latest documents issued by major standard organizations such as the International Telecommunication Union (ITU) and the Internet Society of China (ISC). By outlining the latest developments into a platform canvas for carbon neutrality management and services, this report identifies the potential of “AI of the environment” (i.e., the material composition and environmental impact of AI itself) and “AI for the environment” (i.e., the purposeful use of smart applications to benefit the environment). The role of AI is contextualized in the digital platform design for the provision of services on carbon emission data, which serves as the material foundation for smart services facing both the producers and the consumers of such information. Contributing to the design of business models that enable open innovations, this report discusses the emission impact reduction mechanisms that can optimize, substitute, induce, manage, and facilitate processes and services, indicating the potential of AI-enabled smart services such as forecasting, planning, and recommendation systems. Despite the limited disciplinary considerations and detailed discussions on specific AI technologies, this report provides a simple, practical, and flexible technology roadmap that can be used as a guide for researchers and practitioners to refine their operations and designs and to follow best practices. This report succinctly visualizes key elements of digital platforms of/for GHG emission reduction and their enabling mechanisms, serving as an AI technology roadmap for future research and innovation in the field.
1. Introduction
International organizations such as the International Telecommunication Union (ITU), have been focusing on the application of Information Communication Technologies (ICTs) to “build back greener” after COVID-19, leading to new standards for green digital transformation (ITU, 2020; Johnson, 2022). Global and European research initiatives, such as Destination Earth of the Global Earth Observation System of Systems (GEOSS), are working on building a digital ecosystem including a “datafication” paradigm, aiming to generate actionable intelligence from footprint data for smart service provision, as proposed by the Big Data Lead Scientist of the European Commission Joint Research Center (Nativi et al., 2021).
These two developments, the one from the ICT sector and the other from ecology science, exemplify the two ways in which artificial intelligence (AI) affects the environment: AI of the environment and AI for the environment. AI of the environment refers to the material composition and, thus, environmental impact of AI itself. AI for the environment indicates the purposeful use of smart applications to benefit the environment, including monitoring, predicting, and mitigating the impacts of climate change and other environmental challenges. Therefore, to maximize the positive impact of AI on the environment, it is important to consider both the environmental benefits and the costs of AI technologies. At the intersection of the two developments is the “datafication” that enables smart and sustainable services on carbon emissions or greenhouse gas emissions (GHGs), data. For instance, AI algorithms can optimize data centers’ energy consumption (Sirojan et al., 2022).
1.1. The central role of digital platforms in implementing and advancing AI applications
Digital platforms are essential to create data-driven AI applications that shape the market, human behavior, and regulations. A study in Europe looked at how digital energy platforms can help both consumers and businesses and support the European Union’s (EU) climate and digital transformation goals (Duch-Brown and Rossetti, 2020). Platforms facilitate interactions between users and stakeholders and, thus, produce value intelligence on such interactions (Nativi et al., 2021). A study argued that to solve green technology development issues, platform-based services need to address issues such as digital innovation, power structure, and government intervention (Reza-Gharehbagh et al., 2022b).
Digital platforms for carbon neutrality are expected to provide intelligent services. In December 2022, the Internet Society of China (ISC) released a request for comments on the document “Carbon Peak Carbon Neutral Management and Service Platform (CPCNMSP),” which may offer opportunities to use digital footprint data to provide smart services that drive sustainability, as defined by previous research (Nativi et al., 2021). Innovation can be advanced by combining AI and social science (Cai et al., 2019), allowing organizations such as governments and companies to be held accountable for reducing their carbon emissions. Sustainability reporting activities also often involve environmental, social, and governance (ESG) factors, emphasizing the importance of carbon and ESG data in making data-driven decisions for green and digital transformation (Liao et al., 2021).
1.2. The critical role of business models in building carbon management platforms
Thus, building business models for carbon neutrality platforms becomes critical. The achievement of carbon neutrality requires multidisciplinary collaboration to advance policies, business models, behavior changes, etc. (Macknick, 2011; Zhang et al., 2021). These play a crucial role in leveraging information and intelligence in carbon accounting and carbon markets, as supported by a conceptual paper titled “Carbon as a Metric of the Human” (Whitington, 2016). They also provide informational spaces as the material infrastructures for carbon accounting and carbon markets, as argued by an analysis of two Beijing-based enterprises working to decarbonize China. Business models are instrumental in advancing sustainable supply chain finance digital platforms (Reza-Gharehbagh et al., 2022a). Nonetheless, little research has been conducted on carbon neutrality platforms.
The aim of this study was to design a generic platform business model to simplify the collaboration and innovation around emission data. Inspired by business model research for climate services (Larosa and Mysiak, 2020), the proposed platform business model for emission data management and services emphasizes the use of canvas as a data collection and analysis framework. In addition, its mixed-method analysis shows the value of a co-creation approach to innovate with digital platforms by building value networks through collaboration. Here, the concept of “open collaboration” means the use of open platforms to promote the principles of egalitarianism, meritocracy, and self-organization (Riehle et al., 2009). This idea has inspired the notion of open innovation for market and social entrepreneurship (Dieguez et al., 2020; Gay, 2020; Temiz and Broo, 2020). These phenomena are enabled by digital technologies, such as internet platforms, and are transforming human societies (Parker et al., 2016). Hence, the development of carbon neutrality platform business models requires collaboration and innovation in the use of emission data for AI-enabled intelligent services.
2. Methods
This study applied the design science framework (Eisape, 2022). Originating from design science and employed in information technology and system research (March and Smith, 1995; Hevner et al., 2004), this framework is articulated along four research activities: build and to evaluate from design science, and theorize and justify from natural and social science. Previous experimental research on AI-enabled smart platforms (Brecht et al., 2021) and a case study on a German standard-setting organization (Eisape, 2022), demonstrated the usefulness and validity of this framework.
Focusing on the two research activities of this framework (i.e., to build and evaluate), this study followed a two-step process. First, it examined the relationship between ICT and the environment through a selected survey of technical documents on the role of the ICT sector in GHG emissions reduction for itself and other sectors. Second, focusing on value-creation statements and overall logic, it mapped the technical, environmental, and business statements retrieved to the overall platform business model canvas developed by Choudary (2015) and Parker et al. (2016).
In relation to the use and application of the platform business model, various canvases were proposed and applied for research and practice (Choudary, 2015; Allweins et al., 2021; Bätz and Siegfried, 2022; Eisape, 2022; Şimşek et al., 2022). The differences among these variants are subtle, as expected from academic and professional efforts to apply the canvas to design, build, and evaluate digital platform-based business models. The wide application of the platform canvas testifies to the usefulness of design science in information systems, information technology, and ICT. Also, adopting the latest developments in the digitalization of roadmapping workshops (de Oliveira et al., 2022), two design workshops were executed by the authors using the online tool Miro.
The selection of the ITU and Chinese technical documents is justified by their organizational influence and knowledge in the ICT sector for climate actions and their relevance to the topic. First, two standardization documents by the ITU, widely publicized at the COP27 in November 2022 (Johnson, 2022), were identified as providing the latest international and industrial science-based knowledge in the field. Second, both architectural and functional requirements of China’s “CPCNMSP” were taken from the most recent “Request for Comments” by the Internet Society of China (2022) and analyzed to collect the technical, business, and regulatory needs in the use of emission information. Finally, both the ground truths and value statements were synthesized into the platform canvas, formulating critical questions to encapsulate the retrieved requirements and value statements. These questions served as working questions to contribute to a form of technology roadmapping (Daim et al., 2019; Phaal, 2019) for both AI of and for the environment in carbon neutral management and services.
3. Results
This study found that ITU green digital transformation standards for provide the requirements, assessment, and implementation of AI of/for the environment, whereas China’s CPCNMSP outlines the technical and service requirements lack AI of the environment. This study proposed a platform canvas, shown in Figure 1, which synthesizes the selected content of these documents, featuring questions to design AI-enabled smart services of/for the environment.
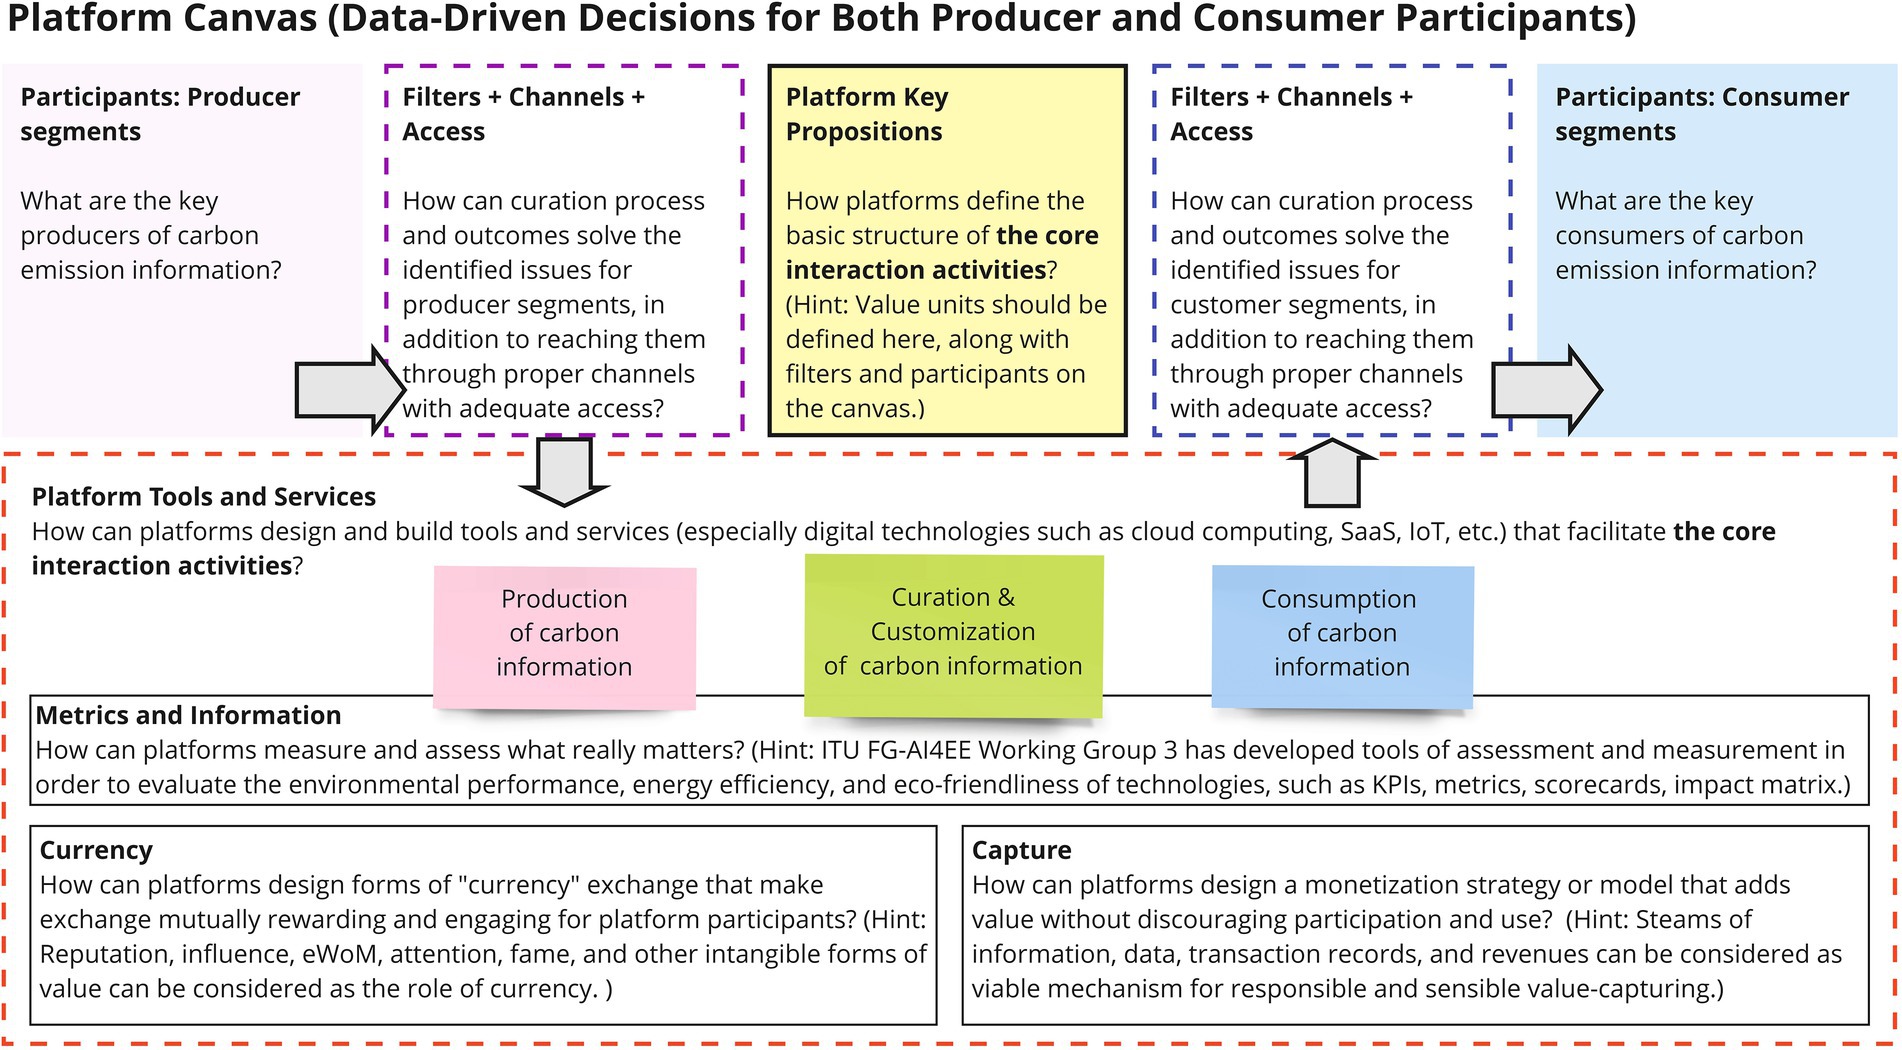
Figure 1. Platform canvas adopted and deployed for this research.
3.1. A selected survey of the ITU standards for green digital transformation
The ITU Standards for Green Digital Transformation consist of two standards developed by the ITU-T Focus Group on “Environmental Efficiency for Artificial Intelligence and other Emerging Technologies” (FG-AI4EE). It is divided into three Working Groups:
• Working Group 1 (WG1): defines the concepts and standardization requirements for deploying AI, blockchain, 5G, and other emerging technologies efficiently and sustainably, with additional consideration of their benefits in advancing the United Nations Sustainable Development Goals (UN-SDGs; FG-AI4EE, 2022a).
• Working Group 2 (WG2): develops the assessment and measurement tools in order to evaluate the environmental performance, energy efficiency, and eco-friendliness of technologies, such as KPIs, metrics, scorecards, impact matrix, etc. (FG-AI4EE, 2022b).
• Working Group 3 (WG3): describes the methodologies to implement technologies, including guidelines on solutions, use cases, and best practices (FG-AI4EE, 2022c).
Based on the tasks of these Working Groups, this study examined the AI-environment relationship. Focusing on AI of the environment, WG1 provides the definitions for the deployment of requirements for AI, blockchain, 5G, and other emerging technologies. Note that the expression “emerging technologies” can be roughly understood as digital or ICT technologies, because of the ITU mandate. WG1’s AI for the environment consists mainly in the advancement of UNSDGs. WG2 develops the assessment tools, and WG3 implements solutions for the environment.
3.1.1. Specifying the ICT environmental impact assessment methods
The ITU-T L.1470 standard (ITU-T, 2020) outlines how the ICT sector can support the Paris Agreement by accounting emissions along the ICT value chain, from electricity to end-users.
Since both digital platforms and AI belong to the ICT sector, ITU-T L.1470 outlines how the ICT sector’s GHG emissions trajectories can be compatible with the UNFCCC Paris Agreement, thereby laying the groundwork for accounting the ICT of the environment. To ensure that the ICT contribution trajectory is in line with climate change scenarios, such as the 1.5°C scenario of the Science-based Targets (SBT) initiative, the ICT possibilities were explored and examined along two perspectives, namely including and excluding electricity supply chain and grid losses (more details are provided in Supplementary material 1.1). Five ICT sub-sectors, i.e., mobile networks, fixed networks, data centers, user equipment, and enterprise networks, were also examined to identify opportunities and risks.
The complexity of the scope of GHG emissions was assessed, as it was instructive for the research on AI of environment. As illustrated in Figure 2, a company’s emission in a value chain can be classified into three categories: Scope 1, which covers the direct emissions of its operations and assets; Scope 2, which covers its purchased energy; and Scope 3, which covers supply chain emissions. More in detail, Figure 2 illustrates the roles of ICT companies as operators and manufacturers along the ICT value chain, highlighting their influence both upstream (to the suppliers of equipment and electricity) and downstream (to the end-users). Indeed, covering subsectors such as data centers, enterprise networks, and user equipment, the document accounted for overhead and embedded emissions.
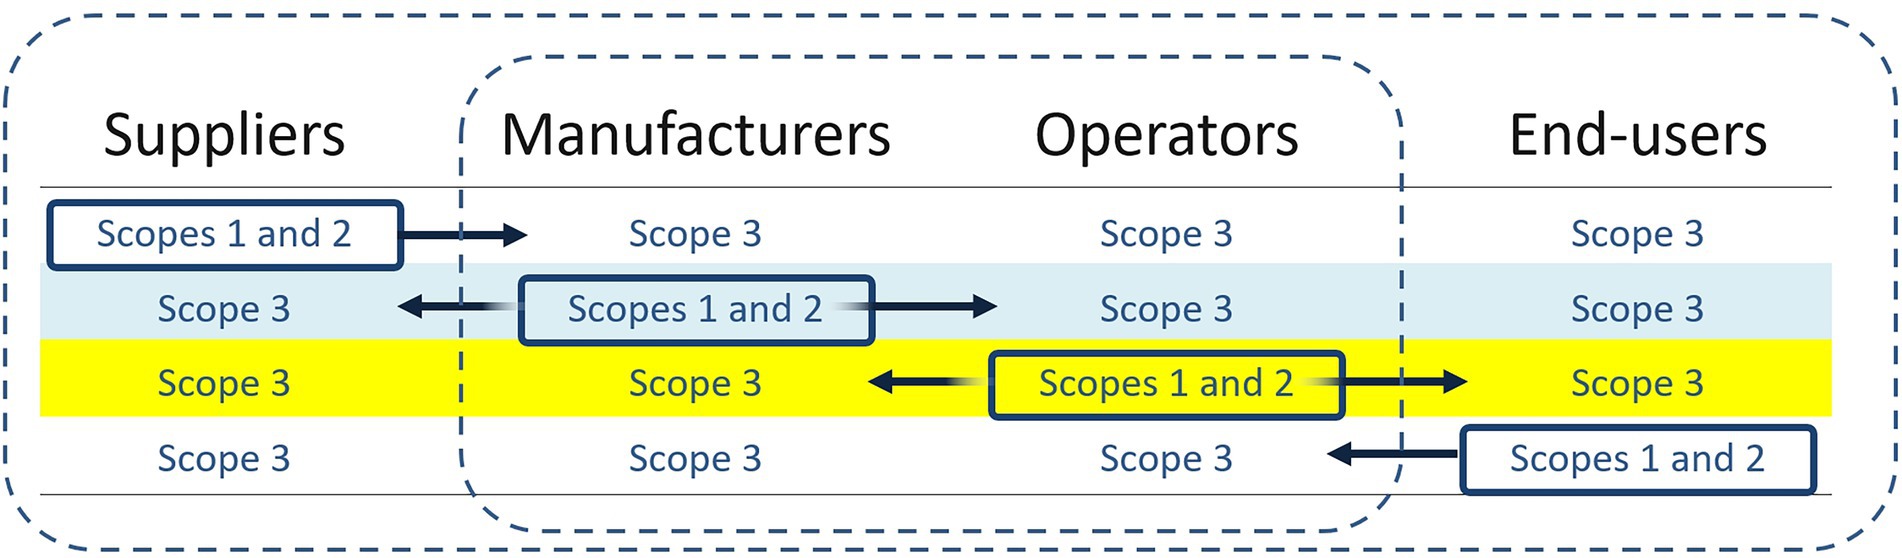
Figure 2. Accounting for the Scopes 1 and 2 of GHG emissions from the perspectives of suppliers, manufacturers, operators and end-users, and for the Scope 3 of other subjects in the supply chain. Adapted from Figure 1 of the ITU standard (ITU-T, 2020).
Appendix II includes the following statement on the opportunities of the ICT sector to help decarbonize other sectors:
On the one hand, ICTs have an environmental impact at each stage of their life cycle, from energy and natural resource consumption to e-waste. On the other, ICTs can enable vast efficiencies in lifestyle and in all sectors of the economy through the provision of digital solutions that can improve energy efficiency, inventory management, and business efficiency by reducing travel and transportation, e.g., teleworking and videoconferencing and by substituting physical products for digital information. The latter capacity is referred to collectively as second-order or enablement effects.
3.1.2. Describing the ICT solutions for the impact assessment of GHG emissions
The ITU-T L.1480 standard (ITU-T, 2022) focuses on the impact assessment of the use of ICT solutions for other sectors and GHG emissions.
Since both digital platforms and AI can other sectors, this standard describes the GHG emissions reduction mechanisms for various sectors using a structured method. Titled “Enabling the Net Zero transition,” it documents assessment principles and methods to guide the use of ICT solutions to improve the consistency, transparency, and comprehensiveness of the assessments of the impact of GHG emissions (more details are provided in Supplementary material 1.2).
Useful specifically for AI for environment, this standard provides guidance on the downstream effects on the GHG emissions of other sectors, i.e., the “net second order effect and higher order effects.” It describes enabling mechanisms for GHG emissions reduction through optimization, substitution, induced consumption, information management, and facilitation services of sectors such as energy, manufacturing, building, transportation, agriculture, and forestry. It also contains several annexes, including a list of potential ICT solutions, usage scenarios building, methodologies, an effect checklist, and a guidance for the GHG impact assessment of ICT-generated financial effects. As a toolbox to assess the GHG impact of ICT solutions for specific customers in an actual scenario, it also summarizes six main normative principles: relevance, completeness, consistency, accuracy, transparency, and conservativeness, which serve as the necessary foundations for preventing greenwashing (Liang et al., 2020; Yu et al., 2020; Montero-Navarro et al., 2021; Lee, 2022) by maintaining a “frame” for conscious AI development “for good” (Cukier et al., 2021).
3.2. China’s carbon peak carbon neutral management and service platform
The CPCNMSP document outlined the first Association Standard draft for the development of ICT solution standards for carbon neutrality management and services. It was issued on December 9, 2022, with a deadline on January 8, 2023 for the first iteration of comments (Internet Society of China, 2022). The main content of this document is summarized in Tables 1, 2.

Table 1. Architectural requirements of China’s “Carbon Peak Carbon Neutral Management and Service Platform.”
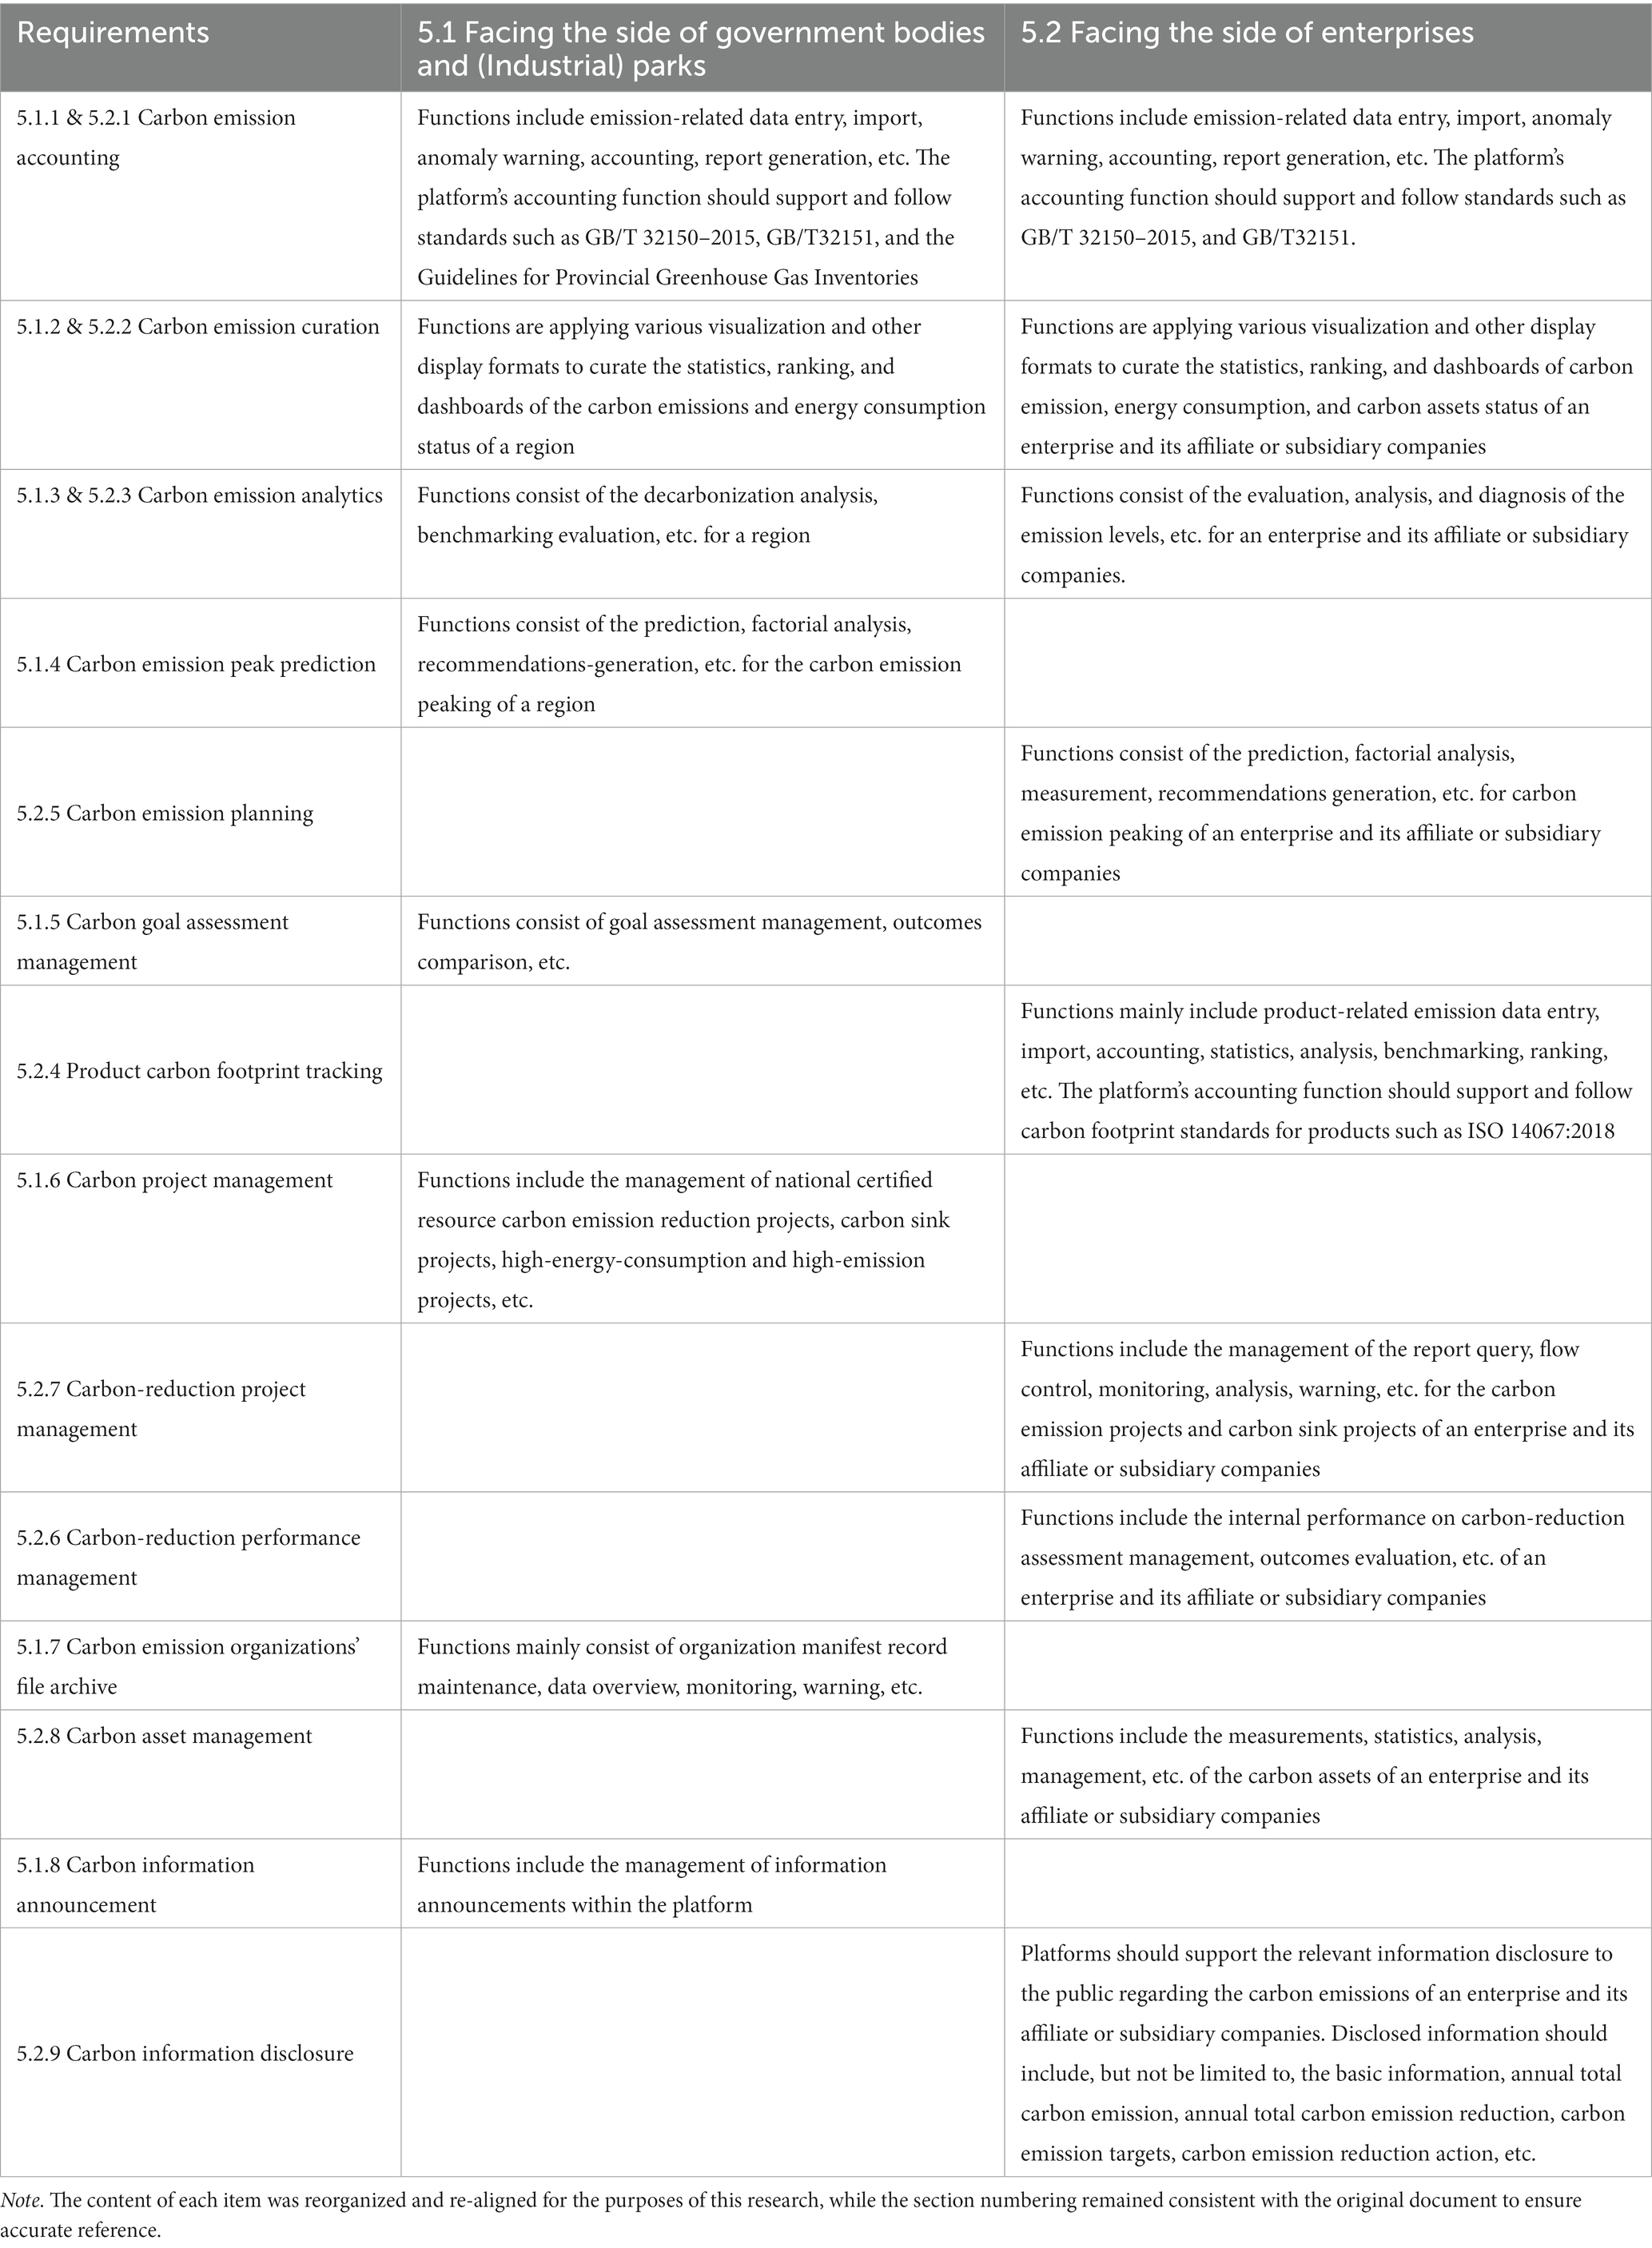
Table 2. Functional requirements of China’s “Carbon Peak Carbon Neutral Management and Service Platform.”
3.2.1. Architectural requirements
Table 1 summarizes the architectural requirements, as articulated in seven layers: data collection, infrastructure, technology support, data management, algorithm model, application, display, and curation layers. The main takeaways for smart ICT solutions for carbon neutrality are as follows:
• The algorithm model layer is crucial for machine learning and artificial innovations, between the upper two layers (i.e., application and “display and curation” layers), and several technological layers below.
• The application layer fits the definition of platform economy as a multi-sided market. It serves both the public and private sector on two sides: (1) government bodies and (industrial) parks, and (2) enterprises. As a matter of fact, in China major industrial or scientific parks are often owned and managed by local or ministerial authorities.
• The overall model follows conventional data science and analytics processes or life cycles: problem definition, data mining, data preparation, exploratory data analysis, feature engineering, model building, and model evaluation. In particular, the ICT and digital technologies such as big data, cloud computing, blockchains, digital twins, and mobile communications such as 4G, 5G, and LoRa are explicitly described in the technology support layer, with the stated goal to “ensure the integrity and authenticity of electronic data, to achieve services for the data relations, two-way traceability, sharing, etc.”
However, the CPCNMSP lacks the consideration of the environmental impact of ICT devices and related solutions.
3.2.2. Functional requirements
Table 2 summarizes the detailed functional requirements of the CPCNMSP, highlighting how the need for carbon accounting for the two-sided market participants is supported by data science processes. Several observations were made in this study:
• As shown in the first three rows of Table 2, for both sides alike, the requirements include carbon emission accounting, curation, and analytics. These functions require related data processes and outcomes to follow relevant national and international standards, as well as the needs of two-sided market participants, including specific analysis such as decarbonization analysis, emission-level benchmarking evaluation, and diagnosis.
• As shown in the fourth and fifth rows, the functions regarding prediction and planning imply the long- to short-time-frame prediction capabilities to be supported by algorithms and AI.
• As shown in the rows from sixth to tenth, the functions regarding carbon assessment, product carbon footprint tracking, and other higher-level functions for project management support, suggest the daily data managerial efforts that may require machine assistance to provide anomaly warning and prevent human errors.
• As shown in the last four rows, functions regarding information record-keeping, archive, exchange, and disclosure aim to provide the systematic foundation to organize, manage, and curate the information flow, which can also benefit from AI-enabled automation, smart assistants, and smart integrity-audits.
3.3. Platform canvas
This subsection describes the key results from the building and evaluation of carbon neutrality platforms. Additional references will be provided as theoretical justifications, following the aforementioned design science framework (March and Smith, 1995; Hevner et al., 2004; Eisape, 2022). Since it is beyond the scope of this study to provide a comprehensive review or justification, a more detailed description of the design-thinking process and outcomes is provided in Supplementary material 1.3. This subsection highlights only the key findings for carbon neutrality platforms, whose critical design questions are illustrated in Figure 1.
3.3.1. Recognizing the environmental impacts of digital platforms: Platforms of the environment
Starting from carbon emission information, the canvas asks the following design questions in the following key design building-block areas:
• Metrics and information (inside the “Platform Tools and Services” at the center of Figure 1): How can platforms measure and assess what really matters?
• Producer and consumer participants (at the top-left and top-right of Figure 1): What are the key producers and consumers of carbon emission information?
To answer the first question, digital platforms must consider their own environmental impact, as discussed earlier in the highlights of the ITU standards. The life cycle of running the platforms, from energy consumption to e-waste, should be part of the metrics. Digital platforms themselves must become carbon neutral, following the ITU-T L.1470 and L.1480 standards. Researchers, policymakers, and professionals can ITU FG-AI4EE WG3 documents for more details. As this is missing from the CPCNMSP document, its timely inclusion is advised.
3.3.2. Designing smart management and services: Platforms for the environment
To answer the second question, related to the participants at the top two corners of the canvas, the CPCNMSP document identified two categories of organizations in China: the public and the private sector. While the initial version focused on the technical support for carbon emission information service and management, the canvas of Figure 1 fills the main gap in value propositions, i.e., the central element of platform business model design.
Entering the important topic of the interactions in the use of carbon emission information, the canvas asks the following design questions to ensure the platforms-for-the-environment purpose:
• Platform key propositions (at the top-center of Figure 1): How can platforms define the basic structure of the core interaction activities?
• Platform tools and services (at the center of Figure 1): How can platforms design and build tools that facilitate the core interaction activities?
To address these design questions, the ITU-T L.1470 and L.1480 documents offer economic and business best practices, while the CPCNMSP outlines functional specifications for carbon accounting and carbon market processes (see Section 3.2.2). Here, AI-enabled application opportunities can be designed through the ITU enabling mechanisms of optimization, substitution, induced consumption, information management, and facilitation services. Specific examples include AI-assisted decarbonization analysis, benchmarking evaluation, prediction, and planning, carbon footprint tracking, energy management, emission forecasting, supply chain analysis, emission reduction recommendations, and automated data collection.
3.3.3. Building smart management and services: Platforms for the environment
As indicated by the four arrows in the canvas, to put platforms in operation it is necessary to address the actual design of production, curation, and consumption of carbon information, as shown by the three colored boxes at the center of Figure 1, which can be generated from the platforms and then, simultaneously, pulled from the targeted producer participants and pushed toward the targeted consumer participants. These push and pull processes will require the use of filters, channels, access, or any combination of the three, thereby raising the following design question on curation:
• Filters + Channels + Access (at the top of Figure 1): How can the curation process and outcomes solve the problems faced by producer and consumer participants?
The purpose of the platforms for the environment must be achieved through the meaningful interactions of participant producers and consumers on the use of carbon information. To this respect, the previously discussed ITU enabling mechanisms for different sectors can be helpful. Also, the CPCNMSP document’s top layer of “display and curation” can be improved by the user-centered design thinking principles embedded in the canvas. AI-assisted digital analytics and marketing services are expected to be helpful in this regard.
3.3.4. Evaluating business model innovations and impacts: Platforms of/for the environment
What remains to be done to make platforms economically viable, as illustrated by the “currency” and “capture” boxes at the bottom of Figure 1, with the following design questions:
• How can platforms design forms of “currency” exchange?
• How can platforms design a monetization strategy or model that adds value without discouraging platform participation and use?
The canvas suggests adding two blocks, i.e., currency and capture, to China’s CPCNNSP proposal, to ensure alignment with ITU-T L.1470 and ITU-T L.1480 standards, by emphasizing the need to articulate value-defining and -capturing activities for green digital transformation.
Focusing on the notion of platforms of and for the environment in values, based on previous research on green marketing (Chan et al., 2012; Dangelico and Vocalelli, 2017; Liao and Huang, 2021; Liao and Pan, 2021; Liu and Liao, 2021), this study suggests to consider reputation, influence, electronic word-of-mouth (eWoM), fame, and other intangible forms of value. To capture values from the streams of information, data, transaction records, and revenues, platform business models to design minimum viable ecosystems (Lewrick et al., 2018) should be considered. AI-assisted digital marketing, especially for industrial marketing in the supply chain, will play a crucial role in defining and capturing values that include the environment.
4. Discussion
The platform canvas proposed in this study summarizes the design of a digital platform to manage and provide services on carbon emission data, as the material foundation for smart services facing both producers and consumers of carbon information. This study provided a succinct summary and iteration of digital platform design for smart management and services on carbon emission data.
4.1. Designing business models that enable open innovations
The main contribution is the business model design innovations that optimize the positive impacts of digital platforms, as outlined in the latest ITU and ISC documents:
• The GHG impact reduction mechanisms can optimize, substitute, and induce consumption through the use of AI such as recommendation systems and cognitive technologies. These technologies can enhance smart services, especially at the filters, channels, or access points interfacing with producer and consumer participants on the canvas.
• The GHG impact reduction mechanisms can manage and facilitate information services via the application of smart services and machine learning modeling, especially at the core block of platform tools and services.
• The abovementioned ICT and AI for the environment mechanisms need to run on the ICT of the environment, which can also benefit from the development of the AI of the environment when considering the AI use life cycles and footprints.
4.2. Articulating value propositions of AI of and for the environment
The second contribution of this study is the articulation of value propositions of AI of /for the environment, in the context of digital platforms of carbon emission information services. This study recognizes the values behind technical work details (e.g., enabling mechanisms, assessment methods, and design requirements) done by influential organizations such as the ITU and ISC, and highlights the importance of such international public goods. Through proposed platform canvas design questions, this study summarized the value propositions of digital platforms of/for the environment.
The environmental impact of running smart digital platforms, including e-waste, software, and hardware life cycles, energy, and natural resource consumption, should be scientifically assessed according to the ITU document to ensure AI of the environment. The positive impact of such smart solutions should also be encouraged, as innovations that bring efficiencies in lifestyle, behavior, and operations change through AI-enabled mechanisms. The proposed canvas and the questions help researchers and professionals to initiate such discussions.
4.3. Limitations and future research directions
The authors acknowledge that this brief research report has limitations, such as limited disciplinary considerations, lack of discussions of specific AI technologies, and lack of a comprehensive review of all relevant literature. Also, platform canvases, as the one proposed in this study, often lack technical and economic details. In addition, future research should further justify, validate, and verify the design outcomes, as demonstrated by AI-enabled smart platform experiment research (Brecht et al., 2021). Nevertheless, this brief report provides a simple, practical, and flexible technology roadmap that can be used as a guide for researchers and practitioners to refine their operations and design, using the critical questions provided, to follow best practices, and to innovate ICT- and AI-enabled solutions on digital platforms. This report succinctly visualized key elements of digital platforms of/for GHG emission reduction and their enabling mechanisms, serving as an AI technology roadmap for future research and innovation in the field.
Data availability statement
The original contributions presented in the study are included in the article/Supplementary material, further inquiries can be directed to the corresponding authors.
Author contributions
H-TL and C-LP contributed to the conception and design of the study. H-TL collected and organized the document database. C-LP, H-TL, and YZ conducted the platform canvas workshop. H-TL wrote the first draft of the manuscript. YZ executed the project administration and funding acquisition. All authors contributed to the article and approved the submitted version.
Funding
This research was funded by the Department of Education of Guangdong Province under two grants: grant number 2019GXJK186, titled “Smart App Design Innovation Research in the Age of New Business, Arts and Engineering Disciplines,” and grant number 2022ZDJS121, titled “Roadmapping for Precision-Decarbonization.” The data analysis and visualization costs were executed by the former project and the open-access publication fees are paid by the latter project. This research was also partly funded by an internal grant titled “Information Visualization Design” by Nanfang College-Guangzhou.
Acknowledgments
The authors thank the continuous voluntary contribution of various experts in the open knowledge movement and standard organizations.
Conflict of interest
The authors declare that the research was conducted in the absence of any commercial or financial relationships that could be construed as a potential conflict of interest.
Publisher’s note
All claims expressed in this article are solely those of the authors and do not necessarily represent those of their affiliated organizations, or those of the publisher, the editors and the reviewers. Any product that may be evaluated in this article, or claim that may be made by its manufacturer, is not guaranteed or endorsed by the publisher.
Supplementary material
The Supplementary material for this article can be found online at: https://www.frontiersin.org/articles/10.3389/fevo.2023.1134381/full#supplementary-material
References
Allweins, M. M., Proesch, M., and Ladd, T. (2021). The platform canvas—conceptualization of a design framework for multi-sided platform businesses. Entrep. Educ. Pedagogy 4, 455–477. doi: 10.1177/2515127420959051
Bätz, K., and Siegfried, P. (2022). From canvas to platform: reflecting on the digital platform canvas. Ekonom. Econviews Rev. Contemp. Bus. Entrepreneur. Econ. Issues 35, 441–452. doi: 10.51680/ev.35.2.15
Brecht, P., Niever, M., Kerres, R., Ströbele, A., and Hahn, C. H. (2021). Smart platform experiment cycle (SPEC): a process to design, analyze, and atete digital platforms. AIEDAM 35, 209–225. doi: 10.1017/S0890060421000081
Cai, Y., Ramis Ferrer, B., and Luis Martinez Lastra, J. (2019). Building university-industry co-innovation networks in transnational innovation ecosystems: towards a transdisciplinary approach of integrating social sciences and artificial intelligence. Sustain. For. 11:4633. doi: 10.3390/su11174633
Chan, H. K., He, H., and Wang, W. Y. C. (2012). Green marketing and its impact on supply chain management in industrial markets. Ind. Mark. Manag. 41, 557–562. doi: 10.1016/j.indmarman.2012.04.002
Choudary, S. P. (2015). Platform Scale: How an Emerging Business Model Helps Startups Build Large Empires With Minimum Investment. Singapore: Platform Thinking Labs.
Cukier, K., Mayer-Schönberger, V., and Véricourt, F.de (2021). Framers: Human Advantage in an Age of Technology and Turmoil. New York, New York: Dutton.
Daim, T. U., Meissner, D., and Carayannis, E. (2019). Roadmapping for engineering and technology management. J. Eng. Technol. Manag. 52, 1–2. doi: 10.1016/j.jengtecman.2019.02.003
Dangelico, R. M., and Vocalelli, D. (2017). “Green marketing”: an analysis of definitions, strategy steps, and tools through a systematic review of the literature. J. Clean. Prod. 165, 1263–1279. doi: 10.1016/j.jclepro.2017.07.184
de Oliveira, M. G., Routley, M., and Phaal, R. (2022). The digitalisation of roadmapping workshops. Journal of Engineering and Technology Management 65:101694. doi: 10.1016/j.jengtecman.2022.101694
Dieguez, T., Ferreira, L. P., Silva, F. J. G., and Tjahjono, B. (2020). Open innovation and sustainable development through industry-academia collaboration: a case study of automotive sector. Proc. Manufact. 51, 1773–1778. doi: 10.1016/j.promfg.2020.10.246
Duch-Brown, N., and Rossetti, F. (2020). Digital platforms across the European regional energy markets. Energy Policy 144:111612. doi: 10.1016/j.enpol.2020.111612
Eisape, D. A. (2022). Transforming pipelines into digital platforms: an illustrative case study transforming a traditional pipeline business model in the standardization industry into a digital platform. J. Open Innov. Technol. Mark. Complex 8:183. doi: 10.3390/joitmc8040183
FG-AI4EE (2022a). Working group 1: Requirements of AI and other emerging technologies to ensure environmental efficiency. ITU-T focus group on “environmental efficiency for artificial intelligence and other emerging technologies” (FG-AI4EE). Available at: https://www.itu.int:443/en/ITU-T/focusgroups/ai4ee/Pages/WG1deliverables.aspx (Accessed December 23, 2022).
FG-AI4EE (2022b). Working group 2: Assessment and measurement of the environmental efficiency of AI and emerging technologies. ITU-T focus group on “environmental efficiency for artificial intelligence and other emerging technologies” (FG-AI4EE). Available at: https://www.itu.int:443/en/ITU-T/focusgroups/ai4ee/Pages/WG2deliverables.aspx (Accessed December 23, 2022).
FG-AI4EE (2022c). Working group 3: Implementation guidelines of AI and emerging technologies for environmental efficiency. ITU-T focus group on “environmental efficiency for artificial intelligence and other emerging technologies” (FG-AI4EE). Available at: https://www.itu.int:443/en/ITU-T/focusgroups/ai4ee/Pages/WG3deliverables.aspx (Accessed December 23, 2022).
Gay, B. (2020). “Open innovation and entrepreneurship” in Encyclopedia of Creativity, Invention, Innovation and Entrepreneurship. ed. E. G. Carayannis (Cham, Switzerland: Springer), 1783–1790. Available at: doi: 10.1007/978-3-319-15347-6_415 [Accessed June 5, 2022]
Hevner, A. R., March, S. T., Park, J., and Ram, S. (2004). Design science in information systems research. MIS Q. 28, 75–105. doi: 10.2307/25148625
Internet Society of China (2022). Open requests for comments on “carbon peak carbon neutral management and service platform—Part 1: Specification of architecture” association standard. Internet Society of China—announcement. Available at: https://www.isc.org.cn/article/14821409542631424.html (Accessed December 24, 2022).
ITU (2020). Leveraging ICTs to build back greener after COVID-19. ITU News. Available at: https://news.itu.int/leveraging-icts-to-build-back-greener-after-covid-19/ (Accessed August 23, 2021).
ITU-T (2020). Greenhouse gas emissions trajectories for the information and communication technology sector compatible with the UNFCCC Paris agreement. Geneva: ITU-T Study Group 5. Available at: https://handle.itu.int/11.1002/1000/14084 (Accessed December 1, 2022).
ITU-T (2022). L.1480: Enabling the net zero transition: Assessing how the use of information and communication technology solutions impact greenhouse gas emissions of other sectors. Geneva: ITU-T Study Group 5 Available at: https://www.itu.int/rec/T-REC-L.1480-202212-I (Accessed December 1, 2022).
Johnson, M. (2022). ITU at COP27: standards for green digital transformation. International Telecommunication Union (ITU) Hub. Available at: https://www.itu.int/hub/2022/11/itu-cop27-standards-sustainable-digital-transformation/ (Accessed December 1, 2022).
Larosa, F., and Mysiak, J. (2020). Business models for climate services: an analysis. Clim. Serv. 17:100111. doi: 10.1016/j.cliser.2019.100111
Lee, I. (2022). Sustainable marketing vs. greenwashing. Industrial Marketer. Available at: https://industrialmarketer.com/marketing-industrial-business-sustainable-honesty-greenwashing/ (Accessed December 28, 2022).
Lewrick, M., Link, P., and Leifer, L. J. (2018). The Design Thinking Playbook: Mindful Digital Transformation of Teams, Products, Services, Businesses and Ecosystems. Hoboken: Wiley
Liang, H., Sun, L., and Teo, M. (2020). Greenwashing. The Harvard law school forum on corporate governance. Available at: https://corpgov.law.harvard.edu/2020/11/17/greenwashing/ (Accessed December 28, 2022).
Liao, H.-T., and Huang, W.-Y. (2021). “Marketing technologies in the agri-food industry: a scoping review of digital technologies for social and ecological sustainability.” in 2021 IEEE 21st International Conference on Communication Technology. Tianjin, China: IEEE.
Liao, H.-T., Huang, W.-Y., Zhou, X., Pan, C.-L., Zhang, Y., and Liu, H. (2021). “A research and education agenda based on a bibliometric analysis of CSR and ESG reporting” in 2021 IEEE 2nd International Conference on Technology, Engineering, Management for Societal Impact using Marketing, Entrepreneurship and Talent, TEMSMET 2021. Pune, India: IEEE, 1–7.
Liao, H.-T., and Pan, C.-L. (2021). “The role of resilience and human rights in the green and digital transformation of supply chain” in 2021 IEEE 2nd International Conference on Technology, Engineering, Management for Societal Impact using Marketing, Entrepreneurship and Talent, TEMSMET 2021. Pune, India: IEEE, 1–7.
Liu, H., and Liao, H.-T. (2021). “From the word-of-mouth to social impact: a bibliometric analysis of social media marketing.” in 2021 IEEE 2nd International Conference on Technology, Engineering, Management for Societal Impact using Marketing, Entrepreneurship and Talent, TEMSMET 2021. Pune, India: IEEE, 1–6.
Macknick, J. (2011). Energy and CO2 emission data uncertainties. Carbon Manag. 2, 189–205. doi: 10.4155/cmt.11.10
March, S. T., and Smith, G. F. (1995). Design and natural science research on information technology. Decis. Support. Syst. 15, 251–266. doi: 10.1016/0167-9236(94)00041-2
Montero-Navarro, A., González-Torres, T., Rodríguez-Sánchez, J.-L., and Gallego-Losada, R. (2021). A bibliometric analysis of greenwashing research: a closer look at agriculture, food industry and food retail. Br. Food J. 123, 547–560. doi: 10.1108/BFJ-06-2021-0708
Nativi, S., Mazzetti, P., and Craglia, M. (2021). Digital ecosystems for developing digital twins of the earth: the destination earth case. Remote Sens. 13:2119. doi: 10.3390/rs13112119
Parker, G., Van Alstyne, M., and Choudary, S. P. (2016). Platform Revolution: How Networked Markets Are Transforming the Economy and How to Make Them Work for You. 1st Edn. New York: W. W. Norton & Company
Phaal, R. (2019). The role of roadmapping in the futures toolkit—futures, foresight, and horizon scanning. UK Government Office for Science. Available at: https://foresightprojects.blog.gov.uk/2019/10/17/the-role-of-roadmapping-in-the-futures-toolkit/ (Accessed August 4, 2020).
Reza-Gharehbagh, R., Arisian, S., Hafezalkotob, A., and Makui, A. (2022a). Sustainable supply chain finance through digital platforms: a pathway to green entrepreneurship. Ann. Oper. Res. Early Access, 1–35. doi: 10.1007/s10479-022-04623-5
Reza-Gharehbagh, R., Hafezalkotob, A., Makui, A., and Sayadi, M. K. (2022b). Financing green technology development and role of digital platforms: insourcing vs. outsourcing. Technol. Soc. 69:101967. doi: 10.1016/j.techsoc.2022.101967
Riehle, D., Ellenberger, J., Menahem, T., Mikhailovski, B., Natchetoi, Y., Naveh, B., et al. (2009). Open collaboration within corporations using software forges. IEEE Softw. 26, 52–58. doi: 10.1109/MS.2009.44
Şimşek, T., Öner, M. A., Kunday, Ö., and Olcay, G. A. (2022). A journey towards a digital platform business model: a case study in a global tech-company. Technol. Forecast. Soc. Chang. 175:121372. doi: 10.1016/j.techfore.2021.121372
Sirojan, T., Lu, S., Phung, B. T., Zhang, D., and Ambikairajah, E. (2022). Sustainable deep learning at grid edge for real-time high impedance fault detection. IEEE Trans. Sustain. Comput. 7, 346–357. doi: 10.1109/TSUSC.2018.2879960
Temiz, S., and Broo, D. G. (2020). Open innovation initiatives to tackle COVID-19 crises: imposter open innovation and openness in data. IEEE Eng. Manag. Rev. 48, 46–54. doi: 10.1109/EMR.2020.3033991
Whitington, J. (2016). Carbon as a metric of the human. Political Leg. Anthropol. Rev. 39, 46–63. doi: 10.1111/plar.12130
Yu, E. P., Luu, B. V., and Chen, C. H. (2020). Greenwashing in environmental, social and governance disclosures. Res. Int. Bus. Financ. 52:101192. doi: 10.1016/j.ribaf.2020.101192
Keywords: digital economy, carbon neutrality, AI for good, information systems, systems innovation, socio-technical transition, digital platform, open collaboration
Citation: Liao H-T, Pan C-L and Zhang Y (2023) Smart digital platforms for carbon neutral management and services: Business models based on ITU standards for green digital transformation. Front. Ecol. Evol. 11:1134381. doi: 10.3389/fevo.2023.1134381
Edited by:
IMR Fattah, University of Technology Sydney, AustraliaReviewed by:
Babu R. Dawadi, Tribhuvan University (Pulchowk Campus), NepalCong Luo, Hohai University, China
Copyright © 2023 Liao, Pan and Zhang. This is an open-access article distributed under the terms of the Creative Commons Attribution License (CC BY). The use, distribution or reproduction in other forums is permitted, provided the original author(s) and the copyright owner(s) are credited and that the original publication in this journal is cited, in accordance with accepted academic practice. No use, distribution or reproduction is permitted which does not comply with these terms.
*Correspondence: Han-Teng Liao, aC5saWFvQGllZWUub3Jn; Chung-Lien Pan, cGFuemhsQG5mdS5lZHUuY24=