 Paul E. Berry
 Melanie Dammhahn2†
 Niels Blaum
- 1Plant Ecology and Nature Conservation, Institute of Biochemistry and Biology, University of Potsdam, Potsdam, Germany
- 2Behavioural Biology, Institute for Neuro- and Behavioural Biology (INVB), University of Münster, Münster, Germany
Long-lived organisms are likely to respond to a rapidly changing climate with behavioral flexibility. Animals inhabiting the arid parts of southern Africa face a particularly rapid rise in temperature which in combination with food and water scarcity places substantial constraints on the ability of animals to tolerate heat. We investigated how three species of African antelope—springbok Antidorcas marsupialis, kudu Tragelaphus strepsiceros and eland T. oryx—differing in body size, habitat preference and movement ecology, change their activity in response to extreme heat in an arid savanna. Serving as a proxy for activity, dynamic body acceleration data recorded every five minutes were analyzed for seven to eight individuals per species for the three hottest months of the year. Activity responses to heat during the hottest time of day (the afternoons) were investigated and diel activity patterns were compared between hot and cool days. Springbok, which prefer open habitat, are highly mobile and the smallest of the species studied, showed the greatest decrease in activity with rising temperature. Furthermore, springbok showed reduced mean activity over the 24 h cycle on hot days compared to cool days. Large-bodied eland seemed less affected by afternoon heat than springbok. While eland also reduced diurnal activity on hot days compared to cool days, they compensated for this by increasing nocturnal activity, possibly because their predation risk is lower. Kudu, which are comparatively sedentary and typically occupy shady habitat, seemed least affected during the hottest time of day and showed no appreciable difference in diel activity patterns between hot and cool days. The interplay between habitat preference, body size, movement patterns, and other factors seems complex and even sub-lethal levels of heat stress have been shown to impact an animal's long-term survival and reproduction. Thus, differing heat tolerances among species could result in a shift in the composition of African herbivore communities as temperatures continue to rise, with significant implications for economically important wildlife-based land use and conservation.
1. Introduction
Earth's climate is changing to a biologically significant degree within the lifetime of many large mammals (Fuller et al., 2016). While organisms can generally respond to environmental change through phenotypic plasticity, dispersal, and genetic adaption, opportunities for the latter two strategies may often be limited when change is human-induced or rapid (Wong and Candolin, 2015). Dispersal may be hindered due to barriers and habitat fragmentation (Berry, 1997; Caplat et al., 2016; Hering et al., 2022a) while genetic adaptation in long-lived organisms may be too slow. Phenotypic plasticity—which can entail morphological, physiological, and behavioral changes (Piersma and Drent, 2003)—then becomes the remaining option. Behavioral changes in particular can be made quickly and are reversible, and therefore can serve as a crucial phenotypic response to sudden environmental change such as recent rises in global temperature (Van Buschkirk, 2012).
Animals can respond behaviorally to high temperatures by adopting a range of strategies to dissipate body heat and to decrease body heat production. Apart from selecting cooler microclimates (Cain et al., 2006), strategies include shifting activity toward cooler times of day (Bourgoin et al., 2011; Hetem et al., 2012a,b), adopting specific postures (Terrien, 2011), panting (Robertshaw, 2006), decreasing energy intake (Collin et al., 2001), and decreasing physical activity (Shido et al., 1991). Microclimate selection can include moving to cooler habitat types (Marchand et al., 2015), moving to cooler areas within these habitats (Mysterud and Østbye, 1999), and moving to open areas on windy days to facilitate convective cooling (Fortin et al., 2000; Maia et al., 2015). Since behavioral thermoregulation involves costs, knowing the limitations of these strategies will help us to better understand how animals may mitigate global change.
In southern Africa, temperatures are rising more rapidly than elsewhere; they have increased at twice the global rate in recent decades and are projected to further increase by 3–5°C by the end of this century (Engelbrecht et al., 2015). In addition, the food and water scarcity characterizing dry regions places substantial constraints on the ability of animals to tolerate heat (Fuller et al., 2021). Among the large mammals, African antelope are well-adapted to arid conditions not only behaviorally, but also morphologically and physiologically (Estes, 1991). Nonetheless, increased time spent on behavioral thermoregulation to prevent heat stress will likely be associated with costs, such as missed opportunities for foraging and other activities, and have fitness consequences. Therefore, despite being well-adapted, some of these species may soon reach their thermal limits if temperatures continue to rise. Species differences in the ability to cope with extreme heat therefore conceivably could lead to shifts in the composition of herbivore communities which in turn may interact with ecological tipping points of savanna ecosystems (Holdo et al., 2009; Dakos et al., 2019; Koch et al., 2022). To build predictions of such community- and ecosystem-wide effects, we aimed to investigate how different antelope species respond to heat.
Our study focused on how three species of free-ranging antelope—springbok Antidorcas marsupialis, kudu Tragelaphus strepsiceros and eland T. oryx—living in a hot, arid African savanna respond in their activity to heat extremes. The three species differ in body size, habitat preference and movement ecology. Body size and microclimate (which is closely linked to habitat) are important factors influencing heat tolerance (Fuller et al., 2016) and therefore responses to increased temperature may differ on account of these attributes. The three species inhabit areas in which drinking water is scarce during the hot dry season and maintaining water balance (Boyers et al., 2019, 2021) needs to be traded off against other resources. Animals are likely to reduce their activity when it becomes extremely hot and may shift activity from daytime to nighttime (Hetem et al., 2012a). This is the case particularly in large-bodied species, which may be less prone to predation (Owen-Smith and Goodall, 2014), though their reduced surface area to volume ratios possibly make them less sensitive to diel fluctuations in temperature (Mitchell et al., 2018). Furthermore, endogenous factors drive diel patterns in activity (Kronfeld-Schor and Dayan, 2003) and activity peaks in the early morning and late afternoon as well as resting pre-dawn and during midday have been observed for other ungulate species (Owen-Smith and Goodall, 2014). Here, we used tri-axial accelerometer measurements from 22 collared individuals across the three species to calculate dynamic body acceleration (DBA), which is a proxy for activity and energy use (Wilson et al., 2020). The data were recorded over a period of two years at five-minute intervals, resulting in a substantial dataset with a high temporal resolution, and enabling us to investigate the activity responses of animals to extreme heat in detail.
Considering the above, we expected species to differ in their activity response to heat (Hypothesis 1). In addition, we expected activity response to be influenced by time of day (Hypothesis 2), due to endogenous factors and their effect on diel activity patterns. Also, we expected springbok, which prefer open habitat, to decrease their activity in response to heat more strongly than eland and kudu, which occur in diverse or woody habitats (Hypothesis 3). Furthermore, we expected the activity of springbok and eland, both highly mobile, to be more affected by heat than the activity of the relatively sedentary kudu (Hypothesis 4), assuming that springbok and eland will markedly curtail their movement, and hence their activity, when orienting their bodies in relation to the sun or seeking shade. Lastly, we expected the large eland to shift activity into the nighttime more than the comparatively small springbok (Hypothesis 5), given the lowered risk of predation for large species.
2. Methods
2.1. Study area
The study was done at Etosha Heights Private Reserve centered on 19.2° S 15.2° E and bordering Etosha National Park in Namibia (Figure 1). Rainfall occurs from October to April with a mean annual precipitation of ca. 299 ± 30 mm (Irob et al., 2022). The terrain has an elevation ranging from 1,067 to 1,347m and consists of calcrete plains interspersed with limestone and dolomite hills (Nortjé, 2019). The vegetation comprises a mixture of grasses, shrubs and trees, notably mopane, Terminalia and Combretum species. The large herbivore community includes springbok, black-faced impala Aepyceros melampus petersi, gemsbok Oryx gazella, kudu, Burchell's zebra Equus quagga burchellii, Hartmann's mountain zebra Equus zebra hartmannae, eland, giraffe Giraffa giraffa, and elephant Loxodonta africana. The predator guild comprises lion Panthera leo, spotted hyaena Crocuta crocuta, leopard Panthera pardus, and to a lesser extent cheetah Acinonyx jubatus. The Reserve has a number of widespread, artificial water points, which are the only source of surface water during the dry season.
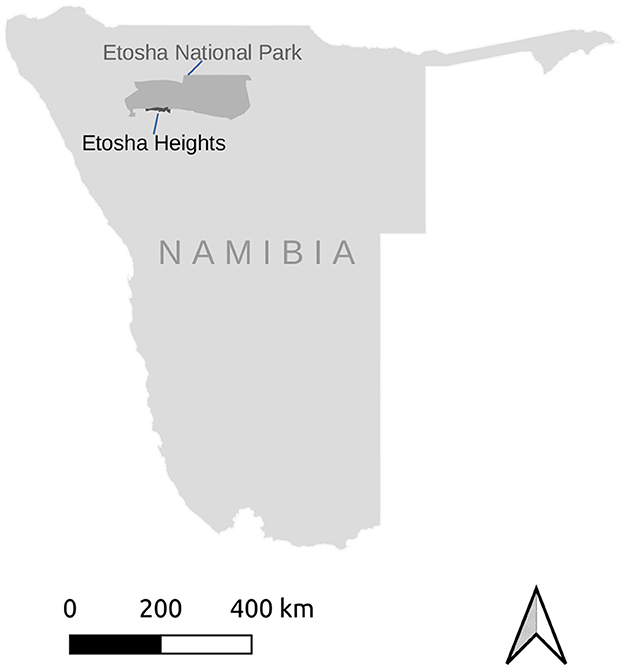
Figure 1. The study area, Etosha Heights Private Reserve, is situated in northern Namibia and borders on Etosha National Park.
2.2. Study species
Springbok are the smallest of the three study species with a mean body mass of 41 kg for males and 37 kg for females (Skinner and Chimimba, 2005). They are distributed across southern Africa, typically occurring in open grasslands. They are mixed feeders and are independent of drinking water if moisture content in food is sufficient (Nagy and Knight, 1994). They are highly mobile, both seasonally, in response to rainfall and vegetation greenness (Skinner, 1993), and within seasons (Hering et al., 2022b). Kudu are intermediate in size, their mean body mass is 287 kg for males and 152 kg for females (Skinner and Chimimba, 2005). They are distributed across southern and eastern Africa, generally occurring in woodlands and thickets and are predominantly browsers (Skinner and Chimimba, 2005). Mean home ranges are small, ranging between 1 and 22 km2 (Du Toit, 1990; Perrin and Allen-Rowlandson, 1993), and kudu show little movement compared to springbok and eland (Hering et al., 2022b). Eland are the largest antelope; their mean body mass is 453 kg for males and 305 kg for females (Skinner and Chimimba, 2005). They are distributed across southern and eastern Africa, similarly to kudu. Being mixed feeders and independent of surface drinking water, they occur in a diverse range of habitats from semi-arid grasslands to montane grasslands and forests, but not in the arid western part of Namibia where mean annual rainfall is less than about 300 mm (Skinner and Chimimba, 2005). Similarly to springbok, eland are highly mobile, both seasonally, moving in response to rainfall and food availability (Knight, 1995; Verlinden, 1998), as well as within seasons (Hering et al., 2022b). Shade-seeking is thought to be an important part of their thermoregulation (Skinner and Chimimba, 2005).
2.3. Data recording
Adult springbok, kudu and eland were fitted with collars equipped with tri-axial accelerometers (e-obs GmbH, Germany, www.e-obs.de). The study animals were all females with the exception of one eland male (Table 1). Acceleration data were recorded between June 2019 and October 2021 for springbok and between July 2020 and October 2021 for kudu and eland. The study was approved by the National Commission on Research, Science and Technology in Namibia.
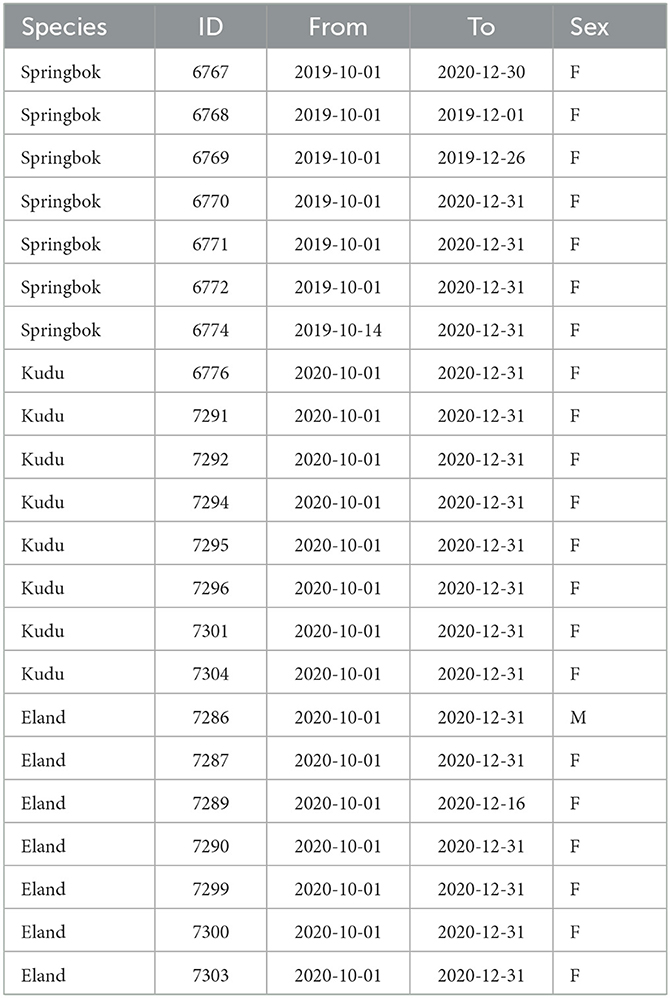
Table 1. Time spans of available acceleration and weather data for each of the study animals.
The accelerometers were able to record acceleration in units ranging from 0 to 4095, corresponding to –4 G to 4 G (G = Earth's gravitational acceleration), for each of three axes. Acceleration was recorded for a period of 3.3 seconds every five minutes. In each 3.3-second-long recording (also referred to as a burst), acceleration was sampled at a frequency of 33 Hz, resulting in 110 samples per axis.
2.4. Weather and climate data
Air temperature, solar radiation and relative humidity were recorded at five-minute intervals at a weather station within the study area (19.24° S 15.19° E) at an elevation of 1195 m (Figure 2). Mean monthly temperatures were highest for October, November and December (Figure 2A). The hottest times of day generally occurred in the afternoons (Figure 2B). To compare temperatures of the study area with those of the coolest and warmest areas of the current species distribution ranges, we inspected mean temperature contours (from climatemaps.romgens.com) across the species distribution areas. Oshakati in northern Namibia was among the warmest and Port Elizabeth in South Africa among the coolest localities within the geographical distributions of the three species, while Okaukuejo was the closest locality to our study area. Simulated temperature data (based on 30 years of hourly weather model simulations with a spatial resolution of 30 km) for these localities were obtained from meteoblue.com (Figure 3).
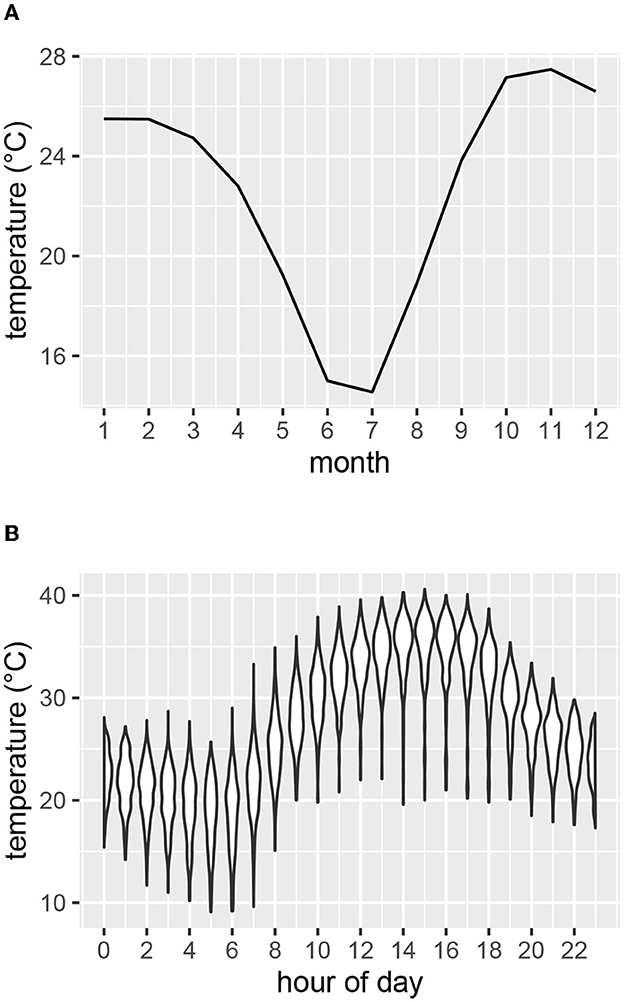
Figure 2. Air temperature as measured at the weather station at Etosha Heights during the study period. (A) Mean monthly temperature. (B) Range of temperatures for each hour of the day for the months of October, November and December.
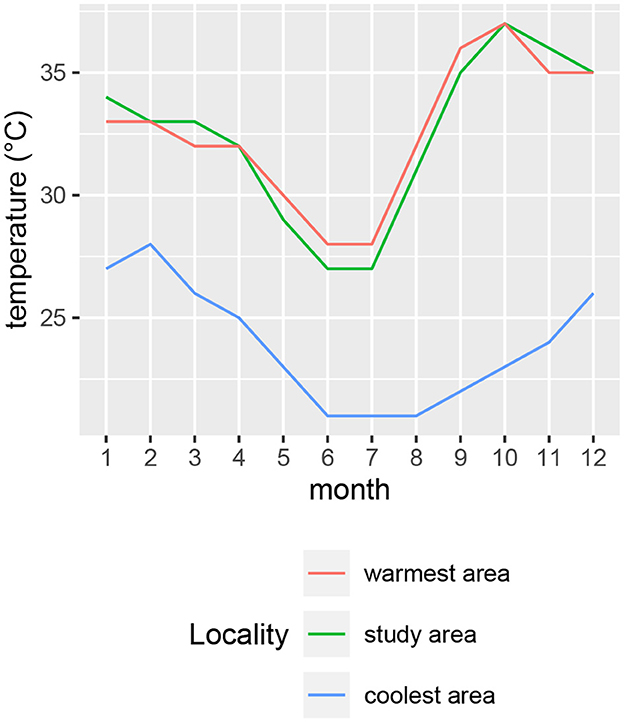
Figure 3. Monthly means of daily maximum temperatures for locations close to the coolest (Eastern Cape) and warmest (northern Namibia) extents of the species distributions. Simulated temperature data (based on 30 years of hourly weather model simulations with a spatial resolution of 30 km) for these localities were obtained from meteoblue.com.
2.5. Data analysis
As the study focused on high temperatures, the hottest months (October through December) of the years 2019–2020 were investigated (Figure 2A). Table 1 shows for each study animal the time periods within these months for which both weather and acceleration data were available.
The acceleration measured contains a static component (due to gravity) and a dynamic component (due to animal body movement) (Shepard et al., 2008). We calculated static acceleration by smoothing the acceleration samples with a low-pass filter (Sato et al., 2003; Simon et al., 2012). For this, we used a Butterworth filter with a period of 55 samples (equaling 1.67 seconds, half the length of a burst). This resulted in 110 smoothed values per axis per burst. For each burst, we subtracted the smoothed values from the corresponding measured values:
with xi,t denoting the total (measured) acceleration, xi,s the static (smoothed) acceleration and xi,d the dynamic acceleration of the ith sample of 110 samples along the x-axis. The dynamic components yi,d and zi,d of the y- and z-axes were calculated correspondingly.
From this, we calculated for each burst the Vectorial DBA (Wilson et al., 2020) as the magnitude of the vector sum of the axis components of dynamic acceleration, averaged over the k = 110 samples per burst:
All statistical analyses were done in the R programming language (version 4.2.3; R Core Team, 2023).
2.5.1. Activity response to afternoon heat
We analyzed the activity response of animals during the afternoons, as temperature generally was highest at this time of the day (Figure 2B). Factors influencing heat stress were accounted for by calculating blackglobe temperature as a function of air temperature, solar radiation and relative humidity (Hajizadeh et al., 2017). Additionally, we considered the effects of time of day and time of year and controlled for repeated measurements of the same animals. We therefore grouped DBA values (as calculated per burst with Equation 2) for each combination of degree Celsius (blackglobe), hour of the day (across several days), month of the year and individual, and calculated the mean DBA for each group. We considered these mean DBA values in the further analysis if they were based on at least 30 bursts (equating to 100 seconds of measurement).
We modeled mean DBA (a proxy for activity) as a function of species and their interaction with blackglobe temperature, hour of the afternoon and month of the year while treating individuals as random effects. Given the potential non-linear relationship between predictors and response, we used Generalized Additive Models (GAMs) which were implemented using the mgcv package (version 1.8-42) in R. The models were checked for concurvity between predictors also using the mgcv package. In addition, simplified versions of the models were generated by variously excluding predictors and interaction and the best fit model was selected using the Akaike Information Criterion (AIC). The level of significance of each parameter in explaining variation in mean DBA was evaluated by p-value with α = 0.05.
2.5.2. The effect of temperature on diel activity
To test for the effect of daily maximum temperature on changes in daytime vs. nighttime activity, we assigned DBA values (as calculated per burst with Equation 2) to daytime or nighttime on the basis of daily times of sunrise and sunset. For each day and individual, we calculated daytime mean activity (DMA), nighttime mean activity (NMA) and mean activity over 24 h (MA). For each species, we then modeled DMA, NMA, and MA as functions of daily maximum temperature, also incorporating Julian day into the models to take into consideration seasonal effects, and treating individuals as random effects to account for repeated measures from the same study animals. We again used GAMs implemented in the mgcv package in R to accommodate non-linear relationships between predictor and response variables.
To further illustrate how the activity rhythm is affected by extreme heat, we compared diel activity for each species between the ten hottest and ten coolest days within hottest months of the year (October through December). For each species data set, we identified these extreme days according to daily maximum air temperature. For the ten coolest days, this averaged 30.2°C (range 26.0–32.4°C) in the case of springbok and 32.6°C (range 29.5–34.3°C) in the case of kudu and eland. For the ten hottest days, daily maximum air temperatures averaged 39.9°C (range 39.5–40.6°C) in the case of springbok and 39.6°C (range 39.1–40.6°C) in the case of kudu and eland. For these extreme days, we calculated hourly mean DBA for each individual. For each of the three species, we used a GAM to estimate hourly mean activity as a function of hour of the day with individuals as random effects, as well as a GAM which additionally included the interaction between hour of day and the factor hot day/cool day. We used AIC to check which of the two models better described the data.
3. Results
3.1. Activity response to afternoon heat
The full model, which included species as well as their interaction with blackglobe temperature, hour of the afternoon, month of the year and individual, best described the data (Table 2). During the heat of the afternoon, activity generally declined with increasing blackglobe temperature for all three species (Figure 4). This effect was most pronounced in springbok, particularly above a blackglobe temperature of approx. 48°C. The effect was intermediate in eland, with activity varying almost linearly with blackglobe temperature throughout the range (37 to 57°C) studied. The effect was least pronounced in kudu, with activity showing a decline only above a blackglobe temperature of approx. 42°C.
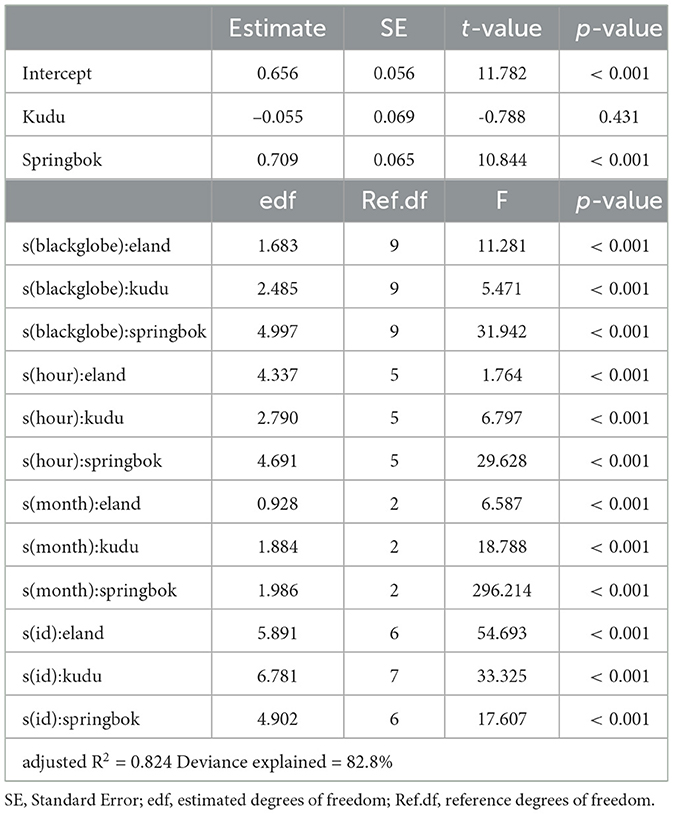
Table 2. Summary of a generalized additive model describing activity for each species as a function of blackglobe temperature, hour of the afternoon and month of the year, with individuals (id) as random effects.
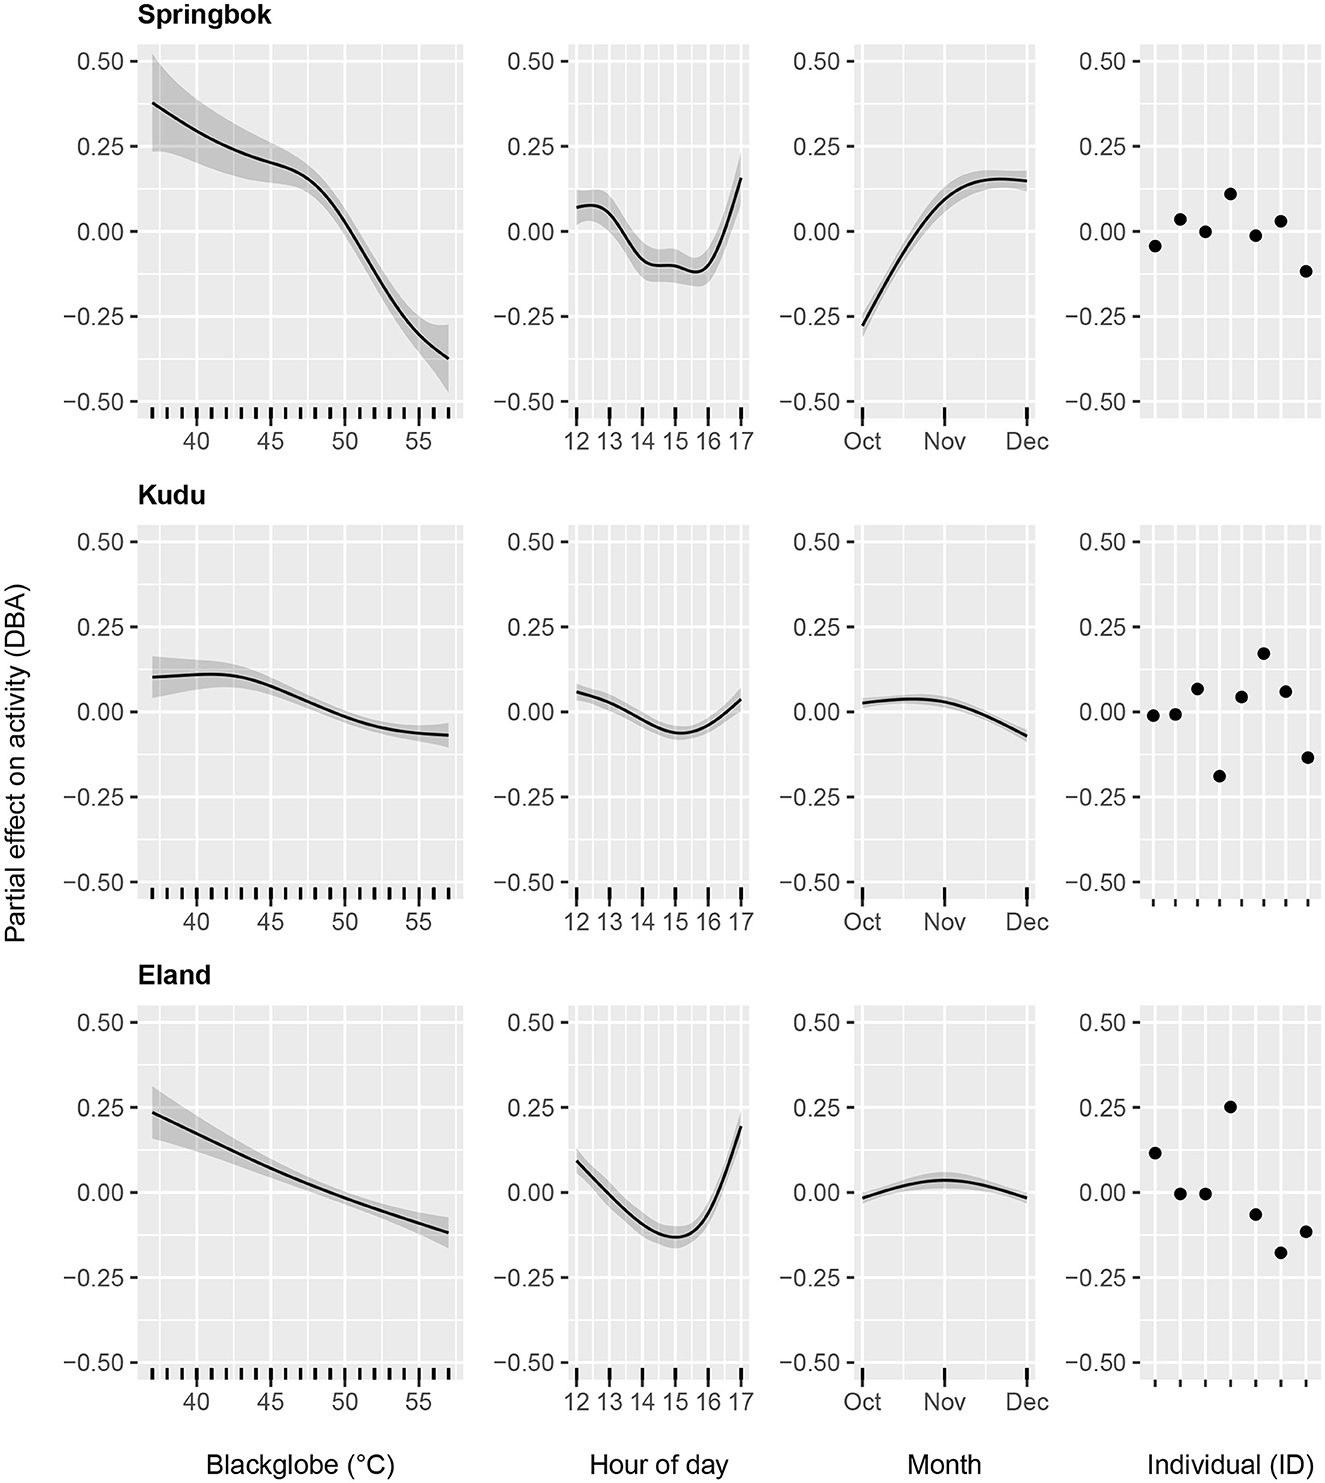
Figure 4. Generalized Additive Models of the partial effects of blackglobe temperature (as calculated from air temperature, solar radiation and relative humidity), hour of the day, month of the year and individual (ID) on the activity of springbok (Top), kudu (Middle), and eland (Bottom).
The other variables controlled for in this study affected afternoon activity to varying degrees. Hour of the afternoon affected the activity of all three species, the activity response showing a U-shaped curve, with an enhancing effect around noon and late afternoon and a dampening effect during the mid-afternoon (14:00 to 16:00). The effect was smaller in kudu than in springbok and eland (Figure 4). The effect of month of year was most pronounced in springbok, with activity markedly elevated during November and December relative to October. In comparison, month of year had only a small effect in both kudu and eland (Figure 4). In all three species, the activity response varied between individuals (Figure 4), though in kudu this was most pronounced in relative terms given their relatively weak responses to temperature, time of day and time of year.
3.2. The effect of heat on diel activity
In springbok, daytime mean activity generally declined with rising daily maximum blackglobe temperature. This decline was particularly pronounced between 51 and 57°C. Nighttime mean activity was less affected in comparison (Figure 5 and Table 3) so that mean activity over 24 h tended to decline with a rise in daily maximum temperature. In kudu, both daytime and nighttime mean activity, as well as mean activity over 24 hours, were virtually unaffected by daily maximum blackglobe temperature (Figure 5 and Table 4). In eland, daytime mean activity tended to decrease, and nighttime mean activity tended to increase, so that mean activity over 24 hours was not affected by daily maximum blackglobe temperature (Figure 5 and Table 5).
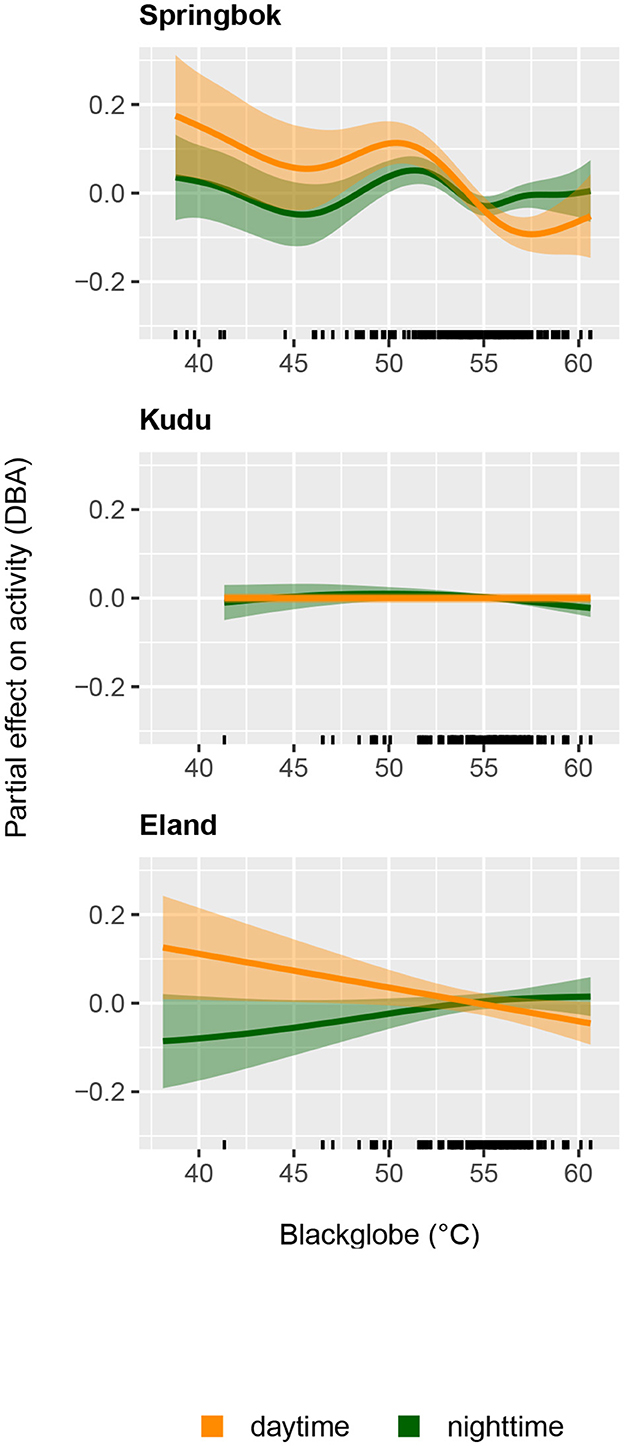
Figure 5. The partial effect of daily maximum blackglobe temperature (calculated from air temperature, solar radiation and relative humidity) on daytime mean activity and nighttime mean activity for springbok (Top), kudu (Middle), and eland (Bottom) as estimated by Generalized Additive Models.
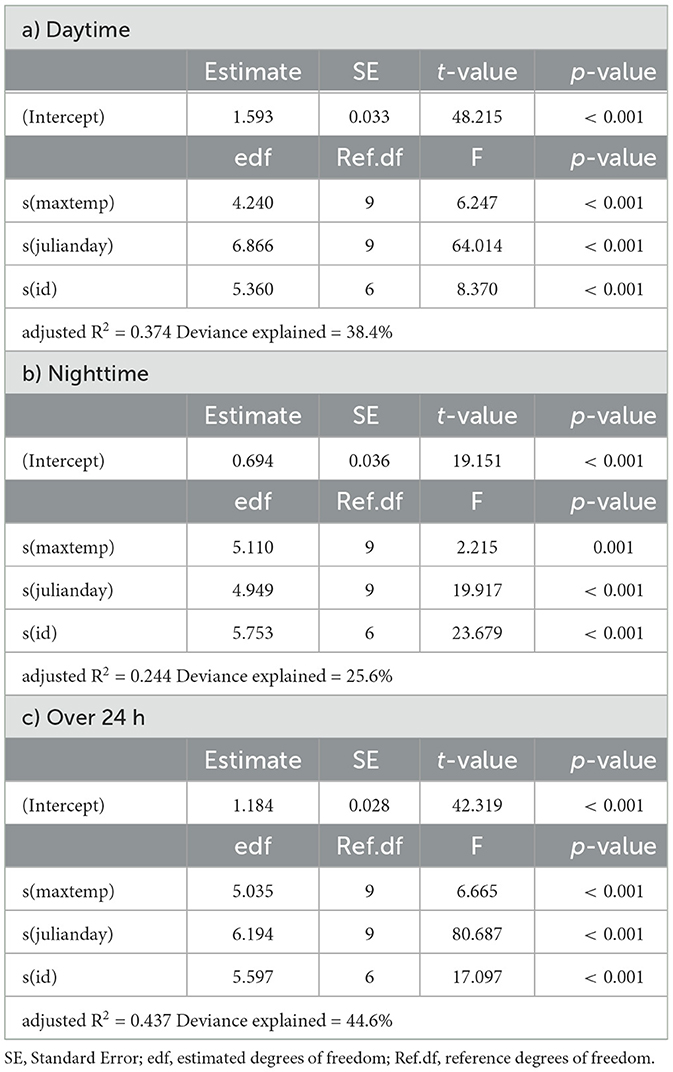
Table 3. Summaries of Generalized Additive Models for mean daily activity of springbok as a function of daily maximum temperature (maxtemp), Julian day (julianday) and individual (id) for a) daytime, b) nighttime and c) over 24 h.
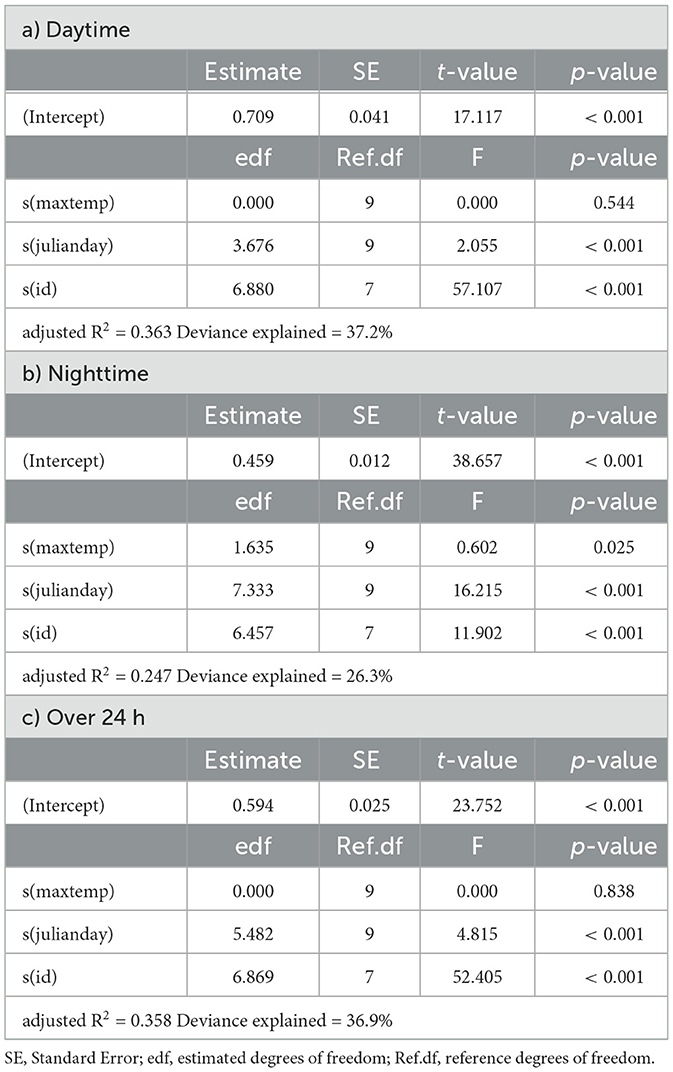
Table 4. Summaries of Generalized Additive Models for mean daily activity of kudu as a function of daily maximum temperature (maxtemp), Julian day (julianday) and individual (id) for a) daytime, b) nighttime and c) over 24 h.
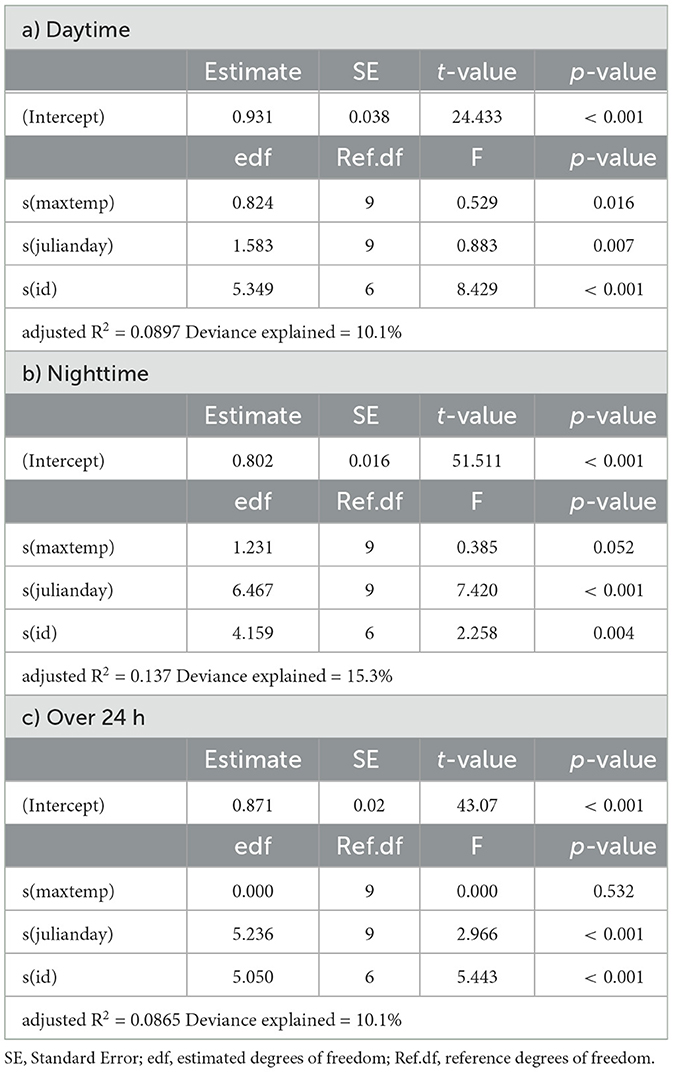
Table 5. Summaries of Generalized Additive Models for mean daily activity of eland as a function of daily maximum temperature (maxtemp), Julian day (julianday) and individual (id) for a) daytime, b) nighttime and c) over 24 h.
The partial effect of Julian day was most pronounced in springbok, followed by eland, followed by kudu. Moreover, it was more pronounced during daytime than nighttime in springbok but less pronounced in kudu and eland. In this analysis also, individuals varied in their activity in all three species (Supplementary Figure 1).
The models showed that all three species differed in their diel activity patterns between hot and cool days (Supplementary Table 1). Figure 6 Top shows that springbok activity was notably reduced in the daytime from 10:00 to 16:00 and in the nighttime from 22:00 to 01:00 on hot days relative to cool days. The springbok seem to have partially compensated for this with increased activity in the hours around sunrise and sunset. Kudu activity, on the other hand, changed comparatively little between hot and cool days except for slight differences in the afternoon (Figure 6 Middle). Eland decreased daytime activity on hot days compared to cool days, and compensated for this with an increase in nighttime activity (Figure 6 Bottom).
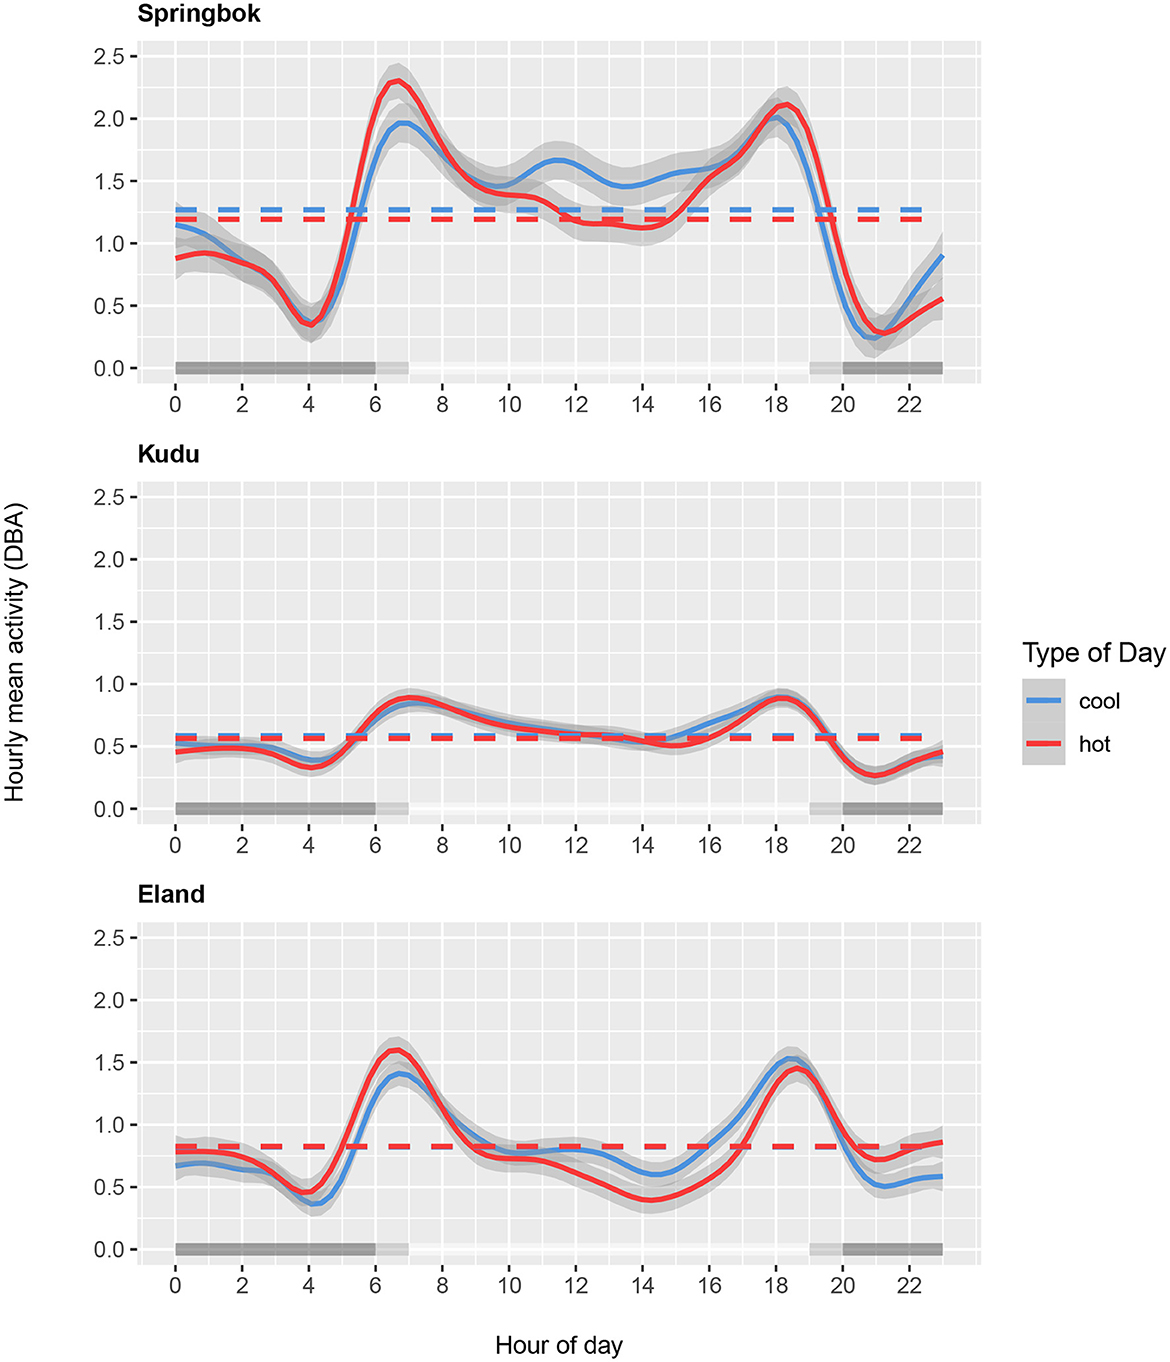
Figure 6. Hourly mean activity (DBA) as a function of time of day for springbok (Top), kudu (Middle), and eland (Bottom) shown for the ten hottest days (in red; average daily maximum air temperature 39.9°C for springbok, 39.6°C for kudu and eland) and the ten coolest days (in blue; average daily maximum temperature 30.2°C for springbok and 32.6°C for kudu and eland) during the study period. Mean DBA over 24 hours for the hottest and coolest days are indicated by the horizontal dashed lines. Gray shading along the x-axis shows daytime, nighttime, and transition periods.
4. Discussion
Temperatures in southern Africa are increasing at twice the rate associated with global climate change (Engelbrecht et al., 2015). In arid regions, the resulting heat stress to which animals are exposed is further compounded by a scarcity of food and water (Fuller et al., 2021). Given that animals with long lifespans are most likely responding to global warming with phenotypic plasticity in the form of reversible behavioral flexibility (Van Buschkirk, 2012), we studied the activity response to heat extremes of three species of antelope in the arid savanna of southern Africa. Our results show that the three species differed in their activity response to high temperatures. We discuss these differences here particularly within the context of habitat, mobility and body size.
The degree to which blackglobe temperature affects activity varies between species and corresponds to the degree of shade provided by their preferred habitat. Springbok, being open area foragers, are probably most exposed to the heat stress of solar radiation. Springbok are known to thermoregulate by orienting the long axis of their bodies parallel to the rays of the sun (Hofmeyr, 1981) or, to a lesser degree, by seeking shade (Hofmeyr, 1981; Stapelberg et al., 2008) which is typically sparse and isolated in open habitat. Being more versatile in habitat selection, eland showed a more moderate decline in activity with increasing temperature than springbok. Eland are known to be shade-seeking but in contrast to springbok, they are not inclined to orient their bodies in relation to the sun (Skinner and Chimimba, 2005). We reason that eland seeking shade under extensive stands of dense, woody vegetation perhaps may be less restricted in activity than springbok seeking sparse, isolated shade in open habitat, or orienting the body to minimize sun exposure. In contrast to springbok and eland, kudu, which typically occupy shady habitat, only mildly reduced activity with increasing temperature. Similarly, Owen-Smith (1998) observed that kudu activity was relatively unaffected by temperature over the midday period, further noting that cloud cover, which influences radiation, did not affect kudu response to temperature. Although the results may suggest that the degree of protection that habitat provides against solar radiation influences activity responses to high temperatures, factors other than heat stress also appear to be at play. In all three species, hour of the afternoon appears to have a partial effect on activity levels, pointing to the circadian rhythm as another factor. In springbok, the differences in activity levels between months point to seasonal variation. The relatively weak activity response to temperature in kudu also emphasizes the importance of among-individual variation in the activity response of kudu. This compares to European roe deer in which individual variation, season and time of day were among the main factors influencing activity patterns, while weather parameters played only a secondary role (Stache et al., 2013).
Our results seem consistent with the idea that degree of mobility may also play a role in the activity response of animals to high temperatures. Activity is closely linked to movement (Owen-Smith and Goodall, 2014) and the relatively strong activity responses of springbok and eland to heat may reflect that the behavioral thermoregulation strategies of orienting the body away from the sun or shade-seeking curtails movement considerably in these highly mobile species. In contrast, the weak activity response in kudu, also observed by Owen-Smith (1998), may reflect that their limited movement is largely unaffected by high temperatures. The extent to which activity is affected by the degree of shade provided by the habitat vs. by the degree of mobility would need further investigation.
Body size is seen as an important factor influencing how animals are affected by heat (Fuller et al., 2021). The large surface area to volume ratio of small bodies facilitates rapid heat transfer between body and environment (Cain et al., 2006). While this is an advantage for heat stressed bodies to offload heat if the environment is cool enough, it is a disadvantage if the environment is so hot that further heat is transferred to an already heat stressed body (Mitchell et al., 2018). Animals exposed to the potentially high heat load of the hot midday sun are therefore likely further disadvantaged if they are relatively small, such as springbok. By comparison, large-bodied eland have substantial thermal capacity to accommodate heat gain. Although the amplitude with which core body temperature fluctuates over the 24 hour cycle is similar across a wide range of body size (Fuller et al., 2016), the thermal capacity of a large animal means it can store more heat per unit rise in body temperature than can a small animal. It follows that a large animal may require less emphasis on behavioral strategies to maintain body temperature within a narrow band. This further may explain the finding that eland activity is less reduced than springbok activity in response to heat.
Large body size generally tends to be associated with reduced predation risk (Sinclair et al., 2003). Predators present in the area and relevant to the three antelope species studied are lion, spotted hyaena, leopard and cheetah. Owen-Smith and Mills (2008) showed that while prey species with a body mass of around 40 kg, such as springbok, make up the majority of kills for all four of these predator species, prey with a body mass of around 160 kg, such as kudu, make up a considerable proportion of kills only for lion and spotted hyaena, and prey with a body mass of around 320 kg and greater make up a considerable proportion of kills only for lion. In the grasslands of neighboring Etosha National Park, springbok have been recorded among the common prey species of lion, cheetah and spotted hyaena (Berry, 1981). Predation risk thus presumably plays a role in springbok selecting open habitat which affords increased visibility (Skinner and Chimimba, 2005). The intermediately sized kudu may compensate for predation risk in dense vegetation by being especially vigilant (Périquet et al., 2010). Though eland were also found to change their activity when lions were present, they did so to a lesser degree than gemsbok and plains zebra (Veldhuis et al., 2020) which have a lower body mass.
Furthermore, body size has been found to mediate the trade-off animals make between thermoregulation and exposure to predation risk (Veldhuis et al., 2020). In our study, large-bodied eland seemed to compensate for reduced diurnal activity with increased nocturnal activity so mean activity over the 24 hour cycle did not differ between hot and cool days (average daily maximum air temperature 39 and 32°C, respectively) during the hottest months of the year. For springbok on the other hand, mean activity over 24 hours was reduced on hot days compared to cool days, owing to lower activity both during daytime and nighttime. While lowered daytime activity on hot days is unsurprising, lowered activity also during part of the night requires further investigation. Nonetheless, reduced activity on hot days was partially compensated for with increased activity in the hours around sunrise and sunset. This could mean that springbok take advantage of the lowered temperatures during these hours while still largely keeping to the relative safety of daylight. Temporal shifts in activity to avoid predation have been shown in other predator-prey systems (Crosmary et al., 2012; Tambling et al., 2015).
While the findings provide insights into the study species themselves, these three species encompass a range of habitat and feeding preferences, body size and degree of mobility and so may be indicative of how other large mammals inhabiting African savannas respond to heat extremes. From our study we conclude that habitat preference may be key to the activity response to heat extremes, as habitats vary in the degree of protection against the heat load imparted by direct solar radiation. Body size may further affect activity responses under heat load and predation pressure while degree of mobility could also play a role. Nonetheless, additional factors, including but not limited to food and water requirements (Boyers et al., 2019, 2021) and endogenous drivers are presumably involved so that the response to heat extremes is likely influenced by complex interaction of multiple factors (Fuller et al., 2021). This complexity make predictions difficult and argues for the need of further long-term studies of mammals in their natural environment (Fuller et al., 2021).
For a global warming level of 3.75°C, heat stress in livestock is projected for up to 180 days a year in parts of southern Africa (Trisos et al., 2022). While such projections were not made for wild ungulates, our study suggests that an increase in temperature can strongly affect activity in indigenous antelope species. For springbok, which are comparatively small-bodied, favor open habitat and exhibit high mobility, the activity response to high temperature was strongest. A strong activity response to temperature need not necessarily mean reduced survivability. However, in cases where mammals live in the warmest area of their geographic distribution, as in this study, it is reasonable to assume that further increases in temperature may push such species to their thermal limits. The need to employ behavioral thermoregulation may mean that foraging time is reduced, which in turn could lead to energetic and nutritional stress. To the extent that species share common food resources, differing sensitivities to heat and resulting changes in foraging behavior could lead to changes in competition for food. In addition, sub-lethal levels of heat stress can have further indirect effects on long-term species survival. For instance, reproductive success has been shown to be reduced in meerkats Suricata suricatta (Van de Ven et al., 2020) and wild dogs Lycaon pictus (Woodroffe et al., 2017) exposed to prolonged heat stress. Different levels of susceptibility to high temperatures and different possibilities in terms of coping strategies therefore conceivably may alter herbivore communities in the face of further predicted warming.
Data availability statement
The datasets presented in this study can be found in online repositories. The names of the repository/repositories and accession number(s) can be found below: https://www.movebank.org, Movebank ID 904829042.
Ethics statement
The animal study was reviewed and approved by National Commission on Research, Science and Technology, Namibia.
Author contributions
PB, MD, and NB contributed to conceptualization, design, and methodology of the study. PB did the statistical analysis and wrote the draft manuscript. MD and NB supervised the study, advised on the statistical analysis, and commented on earlier versions of the manuscript. All authors contributed to manuscript revisions and approved the submitted version.
Funding
This work was part of the ORYCS project within the SPACES II programme supported by the German Federal Ministry of Education and Research (Grant No. FKZ01LL1804A). PB was funded by the SPACES II.2 CaBuDe scholarship programme of the German Academic Exchange Service (Programme No. 57531823). The publication of this work was funded by the Deutsche Forschungsgemeinschaft (DFG, German Research Foundation)—project number 491466077.
Acknowledgments
We thank the management and staff of Etosha Heights Private Reserve for their full support during field research. We are grateful to the project partners at the University of Potsdam, the Namibia University of Science and Technology and the University of Namibia who played crucial roles in making this research possible. We acknowledge the support of the Ministry of Environment, Tourism and Forestry, Namibia and the permission by the Namibian National Commission on Research, Science & Technology to conduct this research (certificate number RCIV00032018 with authorization numbers: 20190602 and 20190808). Further, we thank the reviewers for their valuable contribution in improving the manuscript.
Conflict of interest
The authors declare that the research was conducted in the absence of any commercial or financial relationships that could be construed as a potential conflict of interest.
Publisher's note
All claims expressed in this article are solely those of the authors and do not necessarily represent those of their affiliated organizations, or those of the publisher, the editors and the reviewers. Any product that may be evaluated in this article, or claim that may be made by its manufacturer, is not guaranteed or endorsed by the publisher.
Supplementary material
The Supplementary Material for this article can be found online at: https://www.frontiersin.org/articles/10.3389/fevo.2023.1172303/full#supplementary-material
References
Berry, H. H. (1981). Abnormal levels of disease and predation as limiting factors for wildebeest in the Etosha National Park. Madoqua 12, 242–253.
Berry, H. H. (1997). Aspects of wildebeest Connochaetes taurinus ecology in the Etosha National Park - a synthesis for future management. Madoqua 20, 137–148.
Bourgoin, G., Garel, M., Blanchard, P., Dubray, D., Maillard, D., and Gaillard, J.-M. (2011). Daily responses of mouflon (Ovis gmelini musimon × Ovis sp.) activity to summer climatic conditions. Canadian J. Zool. 89, 765–773. doi: 10.1139/z11-046
Boyers, M., Parrini, F., Owen-Smith, N., Erasmus, B. F. N., and Hetem, R. S. (2019). How free-ranging ungulates with differing water dependencies cope with seasonal variation in temperature and aridity. Conserv. Physiol. 7, coz064. doi: 10.1093/conphys/coz064
Boyers, M., Parrini, F., Owen-Smith, N., Erasmus, B. F. N., and Hetem, R. S. (2021). Contrasting capabilities of two ungulate species to cope with extremes of aridity. Scient. Rep. 11, 4216. doi: 10.1038/s41598-021-83732-w
Cain, J. W., Krausman, P. R., Rosenstock, S. S., and Turner, J. C. (2006). Mechanisms of thermoregulation and water balance in desert ungulates. Wildlife Soc. Bull. 34, 570–581. doi: 10.2193/0091-7648(2006)34[570:MOTAWB]2.0.CO;2
Caplat, P., Edelaar, P., Dudaniec, R. Y., Green, A. J., Okamura, B., Cote, J., et al. (2016). Looking beyond the mountain: Dispersal barriers in a changing world. Front. Ecol. Environ. 14, 261–268. doi: 10.1002/fee.1280
Collin, A., van Milgen, J., Dubois, S., and Noblet, J. (2001). Effect of high temperature on feeding behaviour and heat production in group-housed young pigs. Br. J. Nutr. 86, 63–70. doi: 10.1079/BJN2001356
Crosmary, W.-G., Valeix, M., Fritz, H., Madzikanda, H., and Côté, S. D. (2012). African ungulates and their drinking problems: Hunting and predation risks constrain access to water. Animal Behav. 83, 145–153. doi: 10.1016/j.anbehav.2011.10.019
Dakos, V., Matthews, B., Hendry, A. P., Levine, J., Loeuille, N., Norberg, J., et al. (2019). Ecosystem tipping points in an evolving world. Nat. Ecol. Evol. 3, 355–362. doi: 10.1038/s41559-019-0797-2
Du Toit, J. T. (1990). Home range —body mass relations: A field study on African browsing ruminants. Oecologia 85, 301–303. doi: 10.1007/BF00319416
Engelbrecht, F., Adegoke, J., Bopape, M.-J., Naidoo, M., Garland, R., Thatcher, M., et al. (2015). Projections of rapidly rising surface temperatures over Africa under low mitigation. Environ. Res. Lett. 10, 085004. doi: 10.1088/1748-9326/10/8/085004
Estes, R. D. (1991). The Behavior Guide to African Mammals: Including Hoofed Animals, Carnivores, Primates. South Africa: Russel Friedman Books, Halfway House.
Fortin, D., Larochelle, J., and Gauthier, G. (2000). The effect of wind, radiation and body orientation on the thermal environment of Greater Snow goose goslings. J. Thermal Biol. 25, 227–238. doi: 10.1016/S0306-4565(99)00028-5
Fuller, A., Mitchell, D., Maloney, S. K., and Hetem, R. S. (2016). Towards a mechanistic understanding of the responses of large terrestrial mammals to heat and aridity associated with climate change. Clim. Change Respon. 3, 10. doi: 10.1186/s40665-016-0024-1
Fuller, A., Mitchell, D., Maloney, S. K., Hetem, R. S., Fonsêca, V. F. C., Meyer, L. C. R., et al. (2021). How dryland mammals will respond to climate change: The effects of body size, heat load and a lack of food and water. J. Exper. Biol. 224, jeb238113. doi: 10.1242/jeb.238113
Hajizadeh, R., Farhang Dehghan, S., Golbabaei, F., Jafari, S. M., and Karajizadeh, M. (2017). Offering a model for estimating black globe temperature according to meteorological measurements: A model for estimating black globe temperature. Meteorol. Applic. 24, 303–307. doi: 10.1002/met.1631
Hering, R., Hauptfleisch, M., Jago, M., Smith, T., Kramer-Schadt, S., Stiegler, J., et al. (2022a). Don't stop me now: Managed fence gaps could allow migratory ungulates to track dynamic resources and reduce fence related energy loss. Front. Ecol. Evol. 10:907079. doi: 10.3389/fevo.2022.907079
Hering, R., Hauptfleisch, M., Kramer-Schadt, S., Stiegler, J., and Blaum, N. (2022b). Effects of fences and fence gaps on the movement behavior of three southern African antelope species. Front. Conser. Sci. 3, 959423. doi: 10.3389/fcosc.2022.959423
Hetem, R. S., Strauss, W. M., Fick, L. G., Maloney, S. K., Meyer, L. C., Shobrak, M., et al. (2012a). Activity re-assignment and microclimate selection of free-living Arabian oryx: Responses that could minimise the effects of climate change on homeostasis? Zoology 115, 411–416. doi: 10.1016/j.zool.2012.04.005
Hetem, R. S., Strauss, W. M., Fick, L. G., Maloney, S. K., Meyer, L. C. R., Shobrak, M., et al. (2012b). Does size matter? Comparison of body temperature and activity of free-living Arabian oryx (Oryx leucoryx) and the smaller Arabian sand gazelle (Gazella subgutturosa marica) in the Saudi desert. J. Compar. Physiol. B 182, 437–449. doi: 10.1007/s00360-011-0620-0
Hofmeyr, M. D. (1981). Thermal Physiology of Selected African Ungulates with Emphasis on the Physical Properties of the Pelage. PhD thesis, University of Cape Town.
Holdo, R. M., Holt, R. D., and Fryxell, J. M. (2009). Grazers, browsers, and fire influence the extent and spatial pattern of tree cover in the Serengeti. Ecol. Applic. 19, 95–109. doi: 10.1890/07-1954.1
Irob, K., Blaum, N., Baldauf, S., Kerger, L., Strohbach, B., Kanduvarisa, A., et al. (2022). Browsing herbivores improve the state and functioning of savannas: A model assessment of alternative land-use strategies. Ecol. Evol. 12, 8715. doi: 10.1002/ece3.8715
Knight, M. H. (1995). Drought-related mortality of wildlife in the southern Kalahari and the role of man. Afr. J. Ecol. 33, 377–394. doi: 10.1111/j.1365-2028.1995.tb01047.x
Koch, F., Tietjen, B., Tielbörger, K., and Allhoff, K. T. (2022). Livestock management promotes bush encroachment in savanna systems by altering plant–herbivore feedback. Oikos 2023, e09462. doi: 10.1111/oik.09462
Kronfeld-Schor, N., and Dayan, T. (2003). Partitioning of time as an ecological resource. Ann. Rev. Ecol. Evol. System. 34, 153–181. doi: 10.1146/annurev.ecolsys.34.011802.132435
Maia, A. S. C., da Silva, R. G., Nascimento, S. T., Nascimento, C. C. N., Pedroza, H. P., and Domingos, H. G. T. (2015). Thermoregulatory responses of goats in hot environments. Int. J. Biometeorol. 59, 1025–1033. doi: 10.1007/s00484-014-0916-3
Marchand, P., Garel, M., Bourgoin, G., Dubray, D., Maillard, D., and Loison, A. (2015). Sex-specific adjustments in habitat selection contribute to buffer mouflon against summer conditions. Behav. Ecol. 26, 472–482. doi: 10.1093/beheco/aru212
Mitchell, D., Snelling, E. P., Hetem, R. S., Maloney, S. K., Strauss, W. M., and Fuller, A. (2018). Revisiting concepts of thermal physiology: Predicting responses of mammals to climate change. J. Animal Ecol. 87, 956–973. doi: 10.1111/1365-2656.12818
Mysterud, A., and Ostbye, E. (1999). Cover as a habitat element for temperate ungulates: effects on habitat selection and demography. Wildlife Soc. Bull. 27, 385–394.
Nagy, K. A., and Knight, M. H. (1994). Energy, water, and food use by springbok antelope (Antidorcas marsupialis) in the kalahari desert. J. Mammal. 75, 860–872. doi: 10.2307/1382468
Nortjé, G. (2019). A report prepared for Etosha Heights Game Safaris. Technical report, University of South Africa.
Owen-Smith, N. (1998). How high ambient temperature affects the daily activity and foraging time of a subtropical ungulate, the greater kudu (Tragelaphus strepsiceros). J. Zool. 246, 183–192. doi: 10.1111/j.1469-7998.1998.tb00147.x
Owen-Smith, N., and Goodall, V. (2014). Coping with savanna seasonality: Comparative daily activity patterns of African ungulates as revealed by GPS telemetry: Comparative daily activity patterns of African ungulates. J. Zool. 293, 181–191. doi: 10.1111/jzo.12132
Owen-Smith, N., and Mills, M. G. L. (2008). Predator-prey size relationships in an African large-mammal food web. J. Animal Ecol. 77, 173–183. doi: 10.1111/j.1365-2656.2007.01314.x
Périquet, S., Valeix, M., Loveridge, A. J., Madzikanda, H., Macdonald, D. W., and Fritz, H. (2010). Individual vigilance of African herbivores while drinking: The role of immediate predation risk and context. Animal Behav. 79, 665–671. doi: 10.1016/j.anbehav.2009.12.016
Perrin, M. R., and Allen-Rowlandson, T. S. (1993). Spatial organization of the Greater Kudu Tragelaphus strepsiceros (Mammalia, Ungulata). J. African Zool. 107, 561–570.
Piersma, T., and Drent, J. (2003). Phenotypic flexibility and the evolution of organismal design. Trends Ecol Evol. 18, 228–233. doi: 10.1016/S0169-5347(03)00036-3
Robertshaw, D. (2006). Mechanisms for the control of respiratory evaporative heat loss in panting animals. J. Appl. Physiol. 101, 664–668. doi: 10.1152/japplphysiol.01380.2005
Sato, K., Mitani, Y., Cameron, M. F., Siniff, D. B., and Naito, Y. (2003). Factors affecting stroking patterns and body angle in diving Weddell seals under natural conditions. J. Exper. Biol. 206, 1461–1470. doi: 10.1242/jeb.00265
Shepard, E., Wilson, R., Halsey, L., Quintana, F., Gómez Laich, A., Gleiss, A., et al. (2008). Derivation of body motion via appropriate smoothing of acceleration data. Aquatic Biol. 4:235–241. doi: 10.3354/ab00104
Shido, O., Sakurada, S., and Nagasaka, T. (1991). Effect of heat acclimation on diurnal changes in body temperature and locomotor activity in rats. J. Physiol. 433, 59–71. doi: 10.1113/jphysiol.1991.sp018414
Simon, M., Johnson, M., and Madsen, P. T. (2012). Keeping momentum with a mouthful of water: Behavior and kinematics of humpback whale lunge feeding. J. Exper. Biol. 215, 3786–3798. doi: 10.1242/jeb.071092
Sinclair, A. R. E., Mduma, S., and Brashares, J. S. (2003). Patterns of predation in a diverse predator–prey system. Nature 425, 288–290. doi: 10.1038/nature01934
Skinner, J. D. (1993). Springbok (Antidorcas marsupialis) treks. Trans. R. Soc. South Africa 48, 291–305. doi: 10.1080/00359199309520276
Skinner, J. D., and Chimimba, C. T. (2005). The Mammals of the Southern African Subregion. Third edition. Cambridge, New York, Melbourne, Madrid, Cape Town, Singapore, Sao Paulo: Cambridge University Press.
Stache, A., Heller, E., Hothorn, T., and Heurich, M. (2013). Activity patterns of European roe deer (Capreolus capreolus) are strongly influenced by individual behaviour. Folia Zool. 62, 67–75. doi: 10.25225/fozo.v62.i1.a10.2013
Stapelberg, H., Van Rooyen, M. W., Bothma, J. D. P., Van der Linde, M. J., and Groeneveld, H. T. (2008). Springbok behaviour as affected by environmental conditions in the Kalahari. Koedoe 50, 145–153. doi: 10.4102/koedoe.v50i1.143
Tambling, C. J., Minnie, L., Meyer, J., Freeman, E. W., Santymire, R. M., Adendorff, J., et al. (2015). Temporal shifts in activity of prey following large predator reintroductions. Behav. Ecol. Sociobiol. 69, 1153–1161. doi: 10.1007/s00265-015-1929-6
Terrien, J. (2011). Behavioral thermoregulation in mammals: A review. Front. Biosci. 16, 1428. doi: 10.2741/3797
Trisos, C. H., Adelekan, I. O., Totin, E., Ayanlade, A., Efitre, J., Gemeda, A., et al. (2022). “Nine principles for encouraging a context-driven, inclusive and proactive approach to planning for climate risk in African cities,” in Climate Change 2022: Impacts, Adaptation, and Vulnerability. Contribution of Working Group II to the Sixth Assessment Report of the Intergovernmental Panel on Climate Change, eds. H. O. Pörtner, D. C. Roberts, M. Tignor, E. S. Poloczanska, K. Mintenbeck, A. Alegría (Cambridge, UK and New York, NY, USA: Cambridge University Press) 1285–1455.
Van Buschkirk, J. (2012). “Behavioural plasticity and environmental change,” in Behavioural Responses to a Changing World: Mechanisms and Consequences, eds. U. Candolin, and B. B. M. Wong (Oxford: Oxford University Press).
Van de Ven, T. M. F. N., Fuller, A., and Clutton-Brock, T. H. (2020). Effects of climate change on pup growth and survival in a cooperative mammal, the meerkat. Funct. Ecol. 34, 194–202. doi: 10.1111/1365-2435.13468
Veldhuis, M. P., Hofmeester, T. R., Balme, G., Druce, D. J., Pitman, R. T., and Cromsigt, J. P. (2020). Predation risk constrains herbivores' adaptive capacity to warming. Nat. Ecol. Evolut. 4, 1069–1074. doi: 10.1038/s41559-020-1218-2
Verlinden, A. (1998). Seasonal movement patterns of some ungulates in the Kalahari ecosystem of Botswana between 1990 and 1995. Afr. J. Ecol. 36, 117–128. doi: 10.1046/j.1365-2028.1998.00112.x
Wilson, R. P., Börger, L., Holton, M. D., Scantlebury, D. M., Gómez-Laich, A., Quintana, F., et al. (2020). Estimates for energy expenditure in free-living animals using acceleration proxies: A reappraisal. J. Animal Ecol. 89, 161–172. doi: 10.1111/1365-2656.13040
Wong, B. B. M., and Candolin, U. (2015). Behavioral responses to changing environments. Behav. Ecol. 26, 665–673. doi: 10.1093/beheco/aru183
Keywords: springbok, kudu, eland, dynamic body acceleration, tri-axial accelerometers, behavioral flexibility, climate change, savanna ecology
Citation: Berry PE, Dammhahn M and Blaum N (2023) Keeping cool on hot days: activity responses of African antelope to heat extremes. Front. Ecol. Evol. 11:1172303. doi: 10.3389/fevo.2023.1172303
Received: 23 February 2023; Accepted: 10 May 2023;
Published: 15 June 2023.
Edited by:
Cristiano Bertolucci, University of Ferrara, ItalyReviewed by:
Francesca Brivio, University of Sassari, ItalyNorman Owen-Smith, University of the Witwatersrand, South Africa
Copyright © 2023 Berry, Dammhahn and Blaum. This is an open-access article distributed under the terms of the Creative Commons Attribution License (CC BY). The use, distribution or reproduction in other forums is permitted, provided the original author(s) and the copyright owner(s) are credited and that the original publication in this journal is cited, in accordance with accepted academic practice. No use, distribution or reproduction is permitted which does not comply with these terms.
*Correspondence: Paul E. Berry, UEVCZXJyeUBwcm90b24ubWU=
†ORCID: Paul E. Berry orcid.org/0000-0002-7213-9576
Melanie Dammhahn orcid.org/0000-0003-0557-740X
Niels Blaum orcid.org/0000-0001-6807-5162