 Jesús A. Rivas1*†
 Will Jaremko-Wright2
- 1Department of Ecology and Evolutionary Biology, University of Tennessee, Knoxville, TN, United States
- 2Department of Biology, New Mexico Highlands University, Las Vegas, NM, United States
Introduction: Trophic cascades can produce important effects on a community where some species may have strong effects on other parts of the community up, down the food chain, or both. Top predators are often controlled from the bottom-up by the abundance of their prey base while prey animals are often controlled from the top-down. Studies of trophic interactions in the tropics suggest that the trophic chains are longer because of the high productivity; and because of the high diversity there is abundant intraguild redundancy which results in weak interactions.
Methods: We studied the effect of bottom-up forces affecting the population of green Anaconda (Eunectes murinus) in the Venezuelan llanos; looking at net primary productivity, precipitation, and the abundance of an important prey item, Capybara (Hydrochaeris hydrochaeris).
Results: Our data show a strong interaction of these variables on the percentage of Anacondas that reproduce in a given year (here forth breeding ratio). In particular Capybara abundance has a strong effect. Capybara abundance itself is also under strong bottom-up influence determined by precipitation and Net Primary Productivity.
Discussion: These strong interactions are not what is expected from a tropical ecosystem. We also found an unexpected strong influence of precipitation and primary productivity on Anaconda breeding ratio not related to the abundance of Capybara, likely affecting abundance of other prey or affecting non-trophic variables. This later evidence supports the notion that there is redundancy in tropical food chains and, strong as the effect of Capybara abundance might be, Anacondas do not entirely rely on them.
Introduction
Trophic interactions are critical processes in the dynamics of an ecological community. A particular organism may have a strong effect up or down the trophic chain greatly affecting the status and conditions of other species or the whole community (Terborgh and Estes, 2010; Estes et al., 2011; Kerkhoff, 2011; Coll and Hargadon, 2012). The impact of top predators on the dynamic of the communities increasing species diversity was discovered during the 1960s. Top predators prevent prey species from outcompeting others (Paine, 1966). Since this study, there has been a multitude of studies focused on studying the effect of trophic interactions in the community in a variety of organisms (Estes et al., 2010; Miller et al., 2012; Dobson, 2014; Thingstad, 2020).
Trophic cascades are well documented in temperate regions where the communities are simpler and the trophic chains tend to be shorter (Sinclair et al., 2000; Ripple et al., 2010). Strong interactions occur when an organism has a strong influence on the dynamics of other organisms up or down the trophic chain. For instance, elimination of wolves (Canis lupus) in North America led to the irruption of herbivores (deer, Odocoileus virginianus; and elk, Cervus canadensis) because they were released from predation. This release, in turn, resulted in strong top-down pressure on the producers these herbivores consume (Ripple and Beschta, 2004; Ripple and Beschta, 2005). Equally, hunting pressure on sea otters (Enhydra lutris) released sea urchins (Strongylocentrus spp.) from predation, leading their populations to irrupt and thus transforming kelp forests into urchin barrens (Estes et al., 2010).
Our understanding of trophic interactions in the tropics is less thorough, due to the higher complexity of the food web in tropical areas. Higher productivity leads to longer food chains (Oksanen et al., 1981; Fraser and Grime, 1997), but the trend is not unequivocal (Borer et al., 2005). Furthermore, high diversity leads to redundancy of species in the food web. Having many species using the same guild allows for substitution and functional responses of competing organism when one of them is missing. Thus, it is believed that trophic interactions in the tropics are weaker than they have been documented in temperate zones (McCann et al., 1998; Terborg and Feeley, 2010). However, experimental studies have encountered strong interactions in invertebrate cascades (Letourneau and Dyer, 1998; Dyer and Letourneau, 1999b; Terborgh, 2012) as well as strong top-down effects of herbivores on African savannahs (Holdo et al., 2009). Top-down effects seem to be more likely than bottom-up in tropical invertebrates (Dyer and Letourneau, 1999a). The strength of cascades has been found to vary depending on the species involved, their physiology, and phylogenetic position (Dyer, 2008). Meta-analysis studies show that trophic cascades are stronger when the mean annual temperature and precipitations are higher (Rodríguez-Castañeda, 2013; Butt et al., 2015), contradicting the notion that the tropics have weaker interactions. Field studies investigating this interaction are few and far between, likely because of the difficulty of studying top predators in large complex ecosystems in mega diverse habitats. There are some accounts of strong interactions in the neotropics, where lack of predators of leaf-cutter ants can lead to the decimation of vegetation on islands artificially created by a dam, but data on vertebrates from rainforest or other parts of the neotropics are scarce at best (Terborgh et al., 2001).
Small-scale experimental studies have been done in rainforest systems documenting the top-down impact of arthropod predators on other invertebrates and belowground food webs (Dyer and Letourneau, 1999a; Dyer and Letourneau, 1999b; Milton and Kaspari, 2007; Dyer, 2008; Schuldt et al., 2017) and both bottom-up and top-down effects in “brown” food webs (Milton and Kaspari, 2007). Hyper-seasonal tropical areas in Africa have also shown evidence of strong trophic interactions in some species (Terborg and Feeley, 2010). After Rinderpest was eradicated from the Serengeti region, there was a substantial rebound of herbivores. As herbivores, particularly wildebeest, came back, it was possible to see how they changed the plant and fire dynamic of the whole ecosystem (Sinclair et al., 2007; Holdo et al., 2009; Sinclair et al., 2010), but in general, trophic cascades remain poorly understood in tropical ecosystems.
Furthermore, most studies on vertebrates have been focused on endotherms. Owing to their metabolic needs, endothermic species have high food demands and respond strongly to scarce food supplies (Shurin and Seabloom, 2005; Rossiter et al., 2017). Birds have been reported to help diversity and abundance of plants via control of herbivorous invertebrates (Mäntylä et al., 2011). Studies of tropical ectothermic predators show that they can be important players in terms of predator biomass since they can reach much higher densities than endothermic top predators (de Miranda, 2017). This high density is part of the reason reptiles are able to produce strong cascades in tropical habitats (Dickman et al., 2014). Field studies have shown that higher abundance of prey increases the density of snakes in African savannah and this effect was related to bottom-up forces on the snake population (Mccauley et al., 2006). A similar bottom-up effect was found in mouse-eating snakes in a different study (Luiselli et al., 2014). However, these studies are among the few documenting bottom-up effects in terrestrial vertebrates. Most of the literature about bottom-up control derives from aquatic systems using phyto- and zooplankton (Bartrons et al., 2020). This is likely because predatory vertebrates tend to have longer life cycles and a numerical response from prey abundance likely will take a longer time to show.
Here, we present field data on the trophic interactions affecting green anacondas (Eunectes murinus) in the Venezuelan llanos. We study the effect of prey density, precipitation, and plant productivity on the proportion of female anacondas that reproduce each year. We used data from long-term mark and recapture study of anacondas as well as information available from weather reports, sustainable management of capybaras (Hydrochaeris hydrochaeris) from the Venezuelan game and wildlife service, as well as satellite imagery and remote sensing technology, to build a model determining the biotic and abiotic correlates of population growth in the species. Our results shed light on the trophic interactions of an ectotherm vertebrate that occupies the role of top predator in a tropical hyper-seasonal ecosystem.
Methods
Study site
This study was part of a long-term study on the natural history of green anacondas since 1992 in the Venezuelan llanos at Hato El Cedral, a 54,000-ha cattle ranch located in the Muñoz district (7°30’N and 69°18’W) of Apure State. During March to April, which comprises the driest part of the dry season, we looked for animals in the swamp and other aquatic habitats. The dominant vegetation associated with this region is a hyper-seasonal savanna with few trees (Rivas et al., 2002). Anacondas largely prefer water bodies with stagnant water covered by aquatic vegetation (mostly Eichhornia crassipes, E. azurea, and Salvinia sp.). These water bodies are also used by different animals that either live in, are near, or visit to drink water (Rivas et al., 2007b; Rivas, 2015).
Study animal
Among top ectothermic predators in the tropics, the green anaconda is a strong player. Our understanding of the biology of adult green anacondas has been increasing in recent years. There have been comprehensive studies of its general natural history (Calle et al., 1994; Rivas et al., 2007b; Rivas, 2015; Rivas, 2020), predation (Rivas et al., 1999; Rivas et al., 2001; Valderrama and Thorbjarnarson, 2001), diseases (Calle et al., 1994; Calle et al., 2001), notes on its foraging (Rivas, 1998; Rivas, 2004; Rivas et al., 2008), reproductive biology (Rivas and Burghardt, 2001; Rivas et al., 2007a; Rivas, 2023a), neonate biology (Rivas et al., 2016), allometric growth (Rivas, 2023b), and demography (Rivas and Corey-Rivas, 2008). From their foraging ecology, we know that adult anacondas are ambush hunters that may go for a long time without a meal, but when they do eat, they can take quite large meals. Smaller anacondas prey mostly on birds (Rivas et al., 2016). This is true for both juvenile females and most males throughout their lives, but as soon as females reach reproductive size, they switch to mammals and reptiles (Rivas, 2015; Rivas, 2020). We used data from mark and recapture of green anacondas that allowed us to determine their reproductive condition using morphometric measurements (Rivas, 2023a). This, in turn, allowed us to determine what proportion of the females were breeding at any given year (breeding ratio). We use the breeding ratio as a proxy for population abundance of the anacondas, as high breeding ratio will result in higher population density. Those variables that increase reproductive rate are assumed to produce a positive bottom-up effect on anaconda’s populations. By focusing on the breeding ratio, we address the main variable of the intrinsic rate of increase, r, while avoiding noise produced by high neonate mortality (Rivas et al., 2016), demographic estimations, and the delay of a large vertebrate to show a numeric response.
Breeding ratio
We found female anacondas by searching for them in the swamp, river, and ponds of the ranch during the dry season. We searched for them feeling under the aquatic vegetation and mud with our feet and poles in areas with coverage of aquatic vegetation (Rivas et al., 2007b). We estimated the breeding ratio of the population by collecting data of a sample of the population of adult females every year (mean 38.8). Anacondas are capital breeders that do not reproduce every year (Bonnet, 1998; Rivas, 2023a). Rather, they gather energy through several years, and when they reach a threshold of condition, they engage in a reproductive event (Rivas, 2015; Rivas, 2020; Rivas, 2023a). Pregnancy status was determined using a condition index based on the length and mass of the animal. We divided the cubit root of the mass (in grams) by the snout–vent length (in cm) and multiplied it by 10 for scaling (Rivas, 2023a): a mathematical formula analogous to Fulton’s Index (I = SVL3/mass) (Fulton, 1904; Ricker, 1975). Females with evidence of a recent meal were not included in this analysis unless they were documented breeding (seeing them in a breeding aggregation) independently. Adult females with a condition index equal to or higher than a threshold of 0.875 were ranked as breeding; those with a lower index were ranked as non-breeding. This index provides a reliable way to determine if a given anaconda is breeding in a particular year (Rivas, 2023a). Using this criterion, we ranked all females captured each year and calculated a breeding ratio for that year. This was the dependent variable that our model was trying to predict (Table 1).
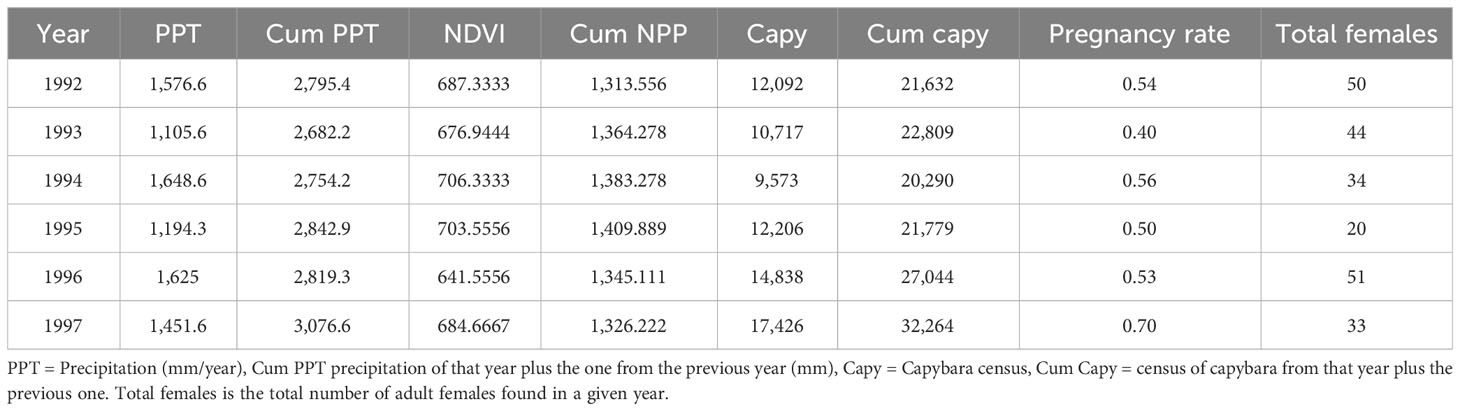
Table 1 Dataset with the precipitation of the cummulative precipitation calculated adding the precipitation of that year plus the previous year, the NDVI obtained from GIS databases, pregnancy rate from a given year obtained from the condition index of adult females, and the total number of adult females captured in a given year.
Precipitation
We obtained weather reports from the closest weather station from the Venezuelan Ministerio del Ambiente located in Mantecal, 25 km from the field station (Coordinates: 7.5628, −69.1475). Early preliminary analysis showed no relationship between yearly precipitation and anaconda pregnancy during that year. Thus, we also created a variable adding the cumulative precipitation of that year and the previous one as regressor to predict anaconda pregnancy each year (Table 1).
Normalized differential vegetation index
To estimate plant productivity, we calculated Normalized Differential Vegetation Index (NDVI) values for a 72-km2 area centered on the Hato El Cedral study area using data derived from the Global Inventory Modeling and Mapping Studies (GIMMS) satellite program (Tucker et al., 2005). GIMMS NDVI data were obtained via the Advanced Very High-Resolution Radiometer (AVHRR) satellite program and is available at the 8-km2 scale for the temporal range of this study. NDVI data were downloaded from 1990–1998 for the month of October to best capture the end of the growing season’s primary production. The satellite obtains images daily and gives an output for the first half and second half of each month (e.g., October 1–15 and October 15–31). The values for each of the 9 pixels in the study area were then averaged to obtain a single NDVI average for each year. NDVI values from the GIMMS program range from 0 to 1,000 (range: 449–929). The resulting NDVI values were used as regressors for the model analyses below. Pixel analyses and data table output were conducted using ArcMap 10.1 (ESRI, 2012).
Capybara density
Capybaras (Hydrochaeris hydrochaeris) are under a management program of the Ministerio del Ambiente (Ojasti, 1991), and they do a yearly census of the population from the ranch. Capybara individuals are counted early in the morning and late in the afternoon patrolling water bodies and areas where they live, from horseback, boats, or off-road vehicles, as needed, early in the dry season, following the procedure developed by Ojasti (1991). We obtained those data from their archives to use them as regressors in our model (Table 1). Because the density of capybara in a given year might not affect the anaconda population in that very year, we calculated the cumulative abundance of capybara by adding the census of a year with the one from the previous year.
Statistical analysis
Because larger vertebrates may take a while to respond to environmental variables, we created two new variables adding the values for 1 year with the previous one. We did this with density of capybara and the precipitation and labeled them cumulative capybara density and cumulative precipitation (Table 1). We built a linear regression model predicting anaconda breeding ratio with cumulative capybara density, precipitation, and NDVI to study their relationships and possible collinearity effect. We also built a linear regression model predicting capybara density with cumulative precipitation and NDVI. In addition, we calculated a Pearson correlation matrix among all variables. With the data from the linear regression model predicting anaconda’s pregnancy rate, we did a path diagram to analyze the relationship among the biotic and abiotic variables using R Studio (v. 2022.02.0) (packages: tidyverse, knitr, kableExtra, lavaan, semPlot, OpenMx, and GGally) (Bihansky, 2017). The path diagram represents an a priori hypothesis about the causal relationship among the variables, and uses partial correlation to analyze how the variables interact in a multivariate system (Sokal and Rohlf, 1995).
Results
Both capybara density and anaconda breeding ratio respond strongly to the cumulative precipitation (Figures 1, 2). Anaconda pregnancy rate can be reliably predicted with NDVI, precipitation, and the cumulative density of capybara. Our model showed high predictive power (F = 44.06, p = 0.022, R2 = 0.99) with very low level of collinearity among the variables (VIF 1.04 to 1.32). All regressors showed an independent effect on anaconda pregnancy. While all variables seem to be important, cumulative capybara abundance seems to be the strongest predictor (Table 2; Figure 3). In addition, it is possible to predict capybara abundance in any year based on forage availability using the cumulative precipitation and NDVI (F = 123.54; p = 0.01; R2 = 0.99). Both of these variables are significant and needed for the predictive power of the model with no collinearity problems (Table 2; Figure 2).
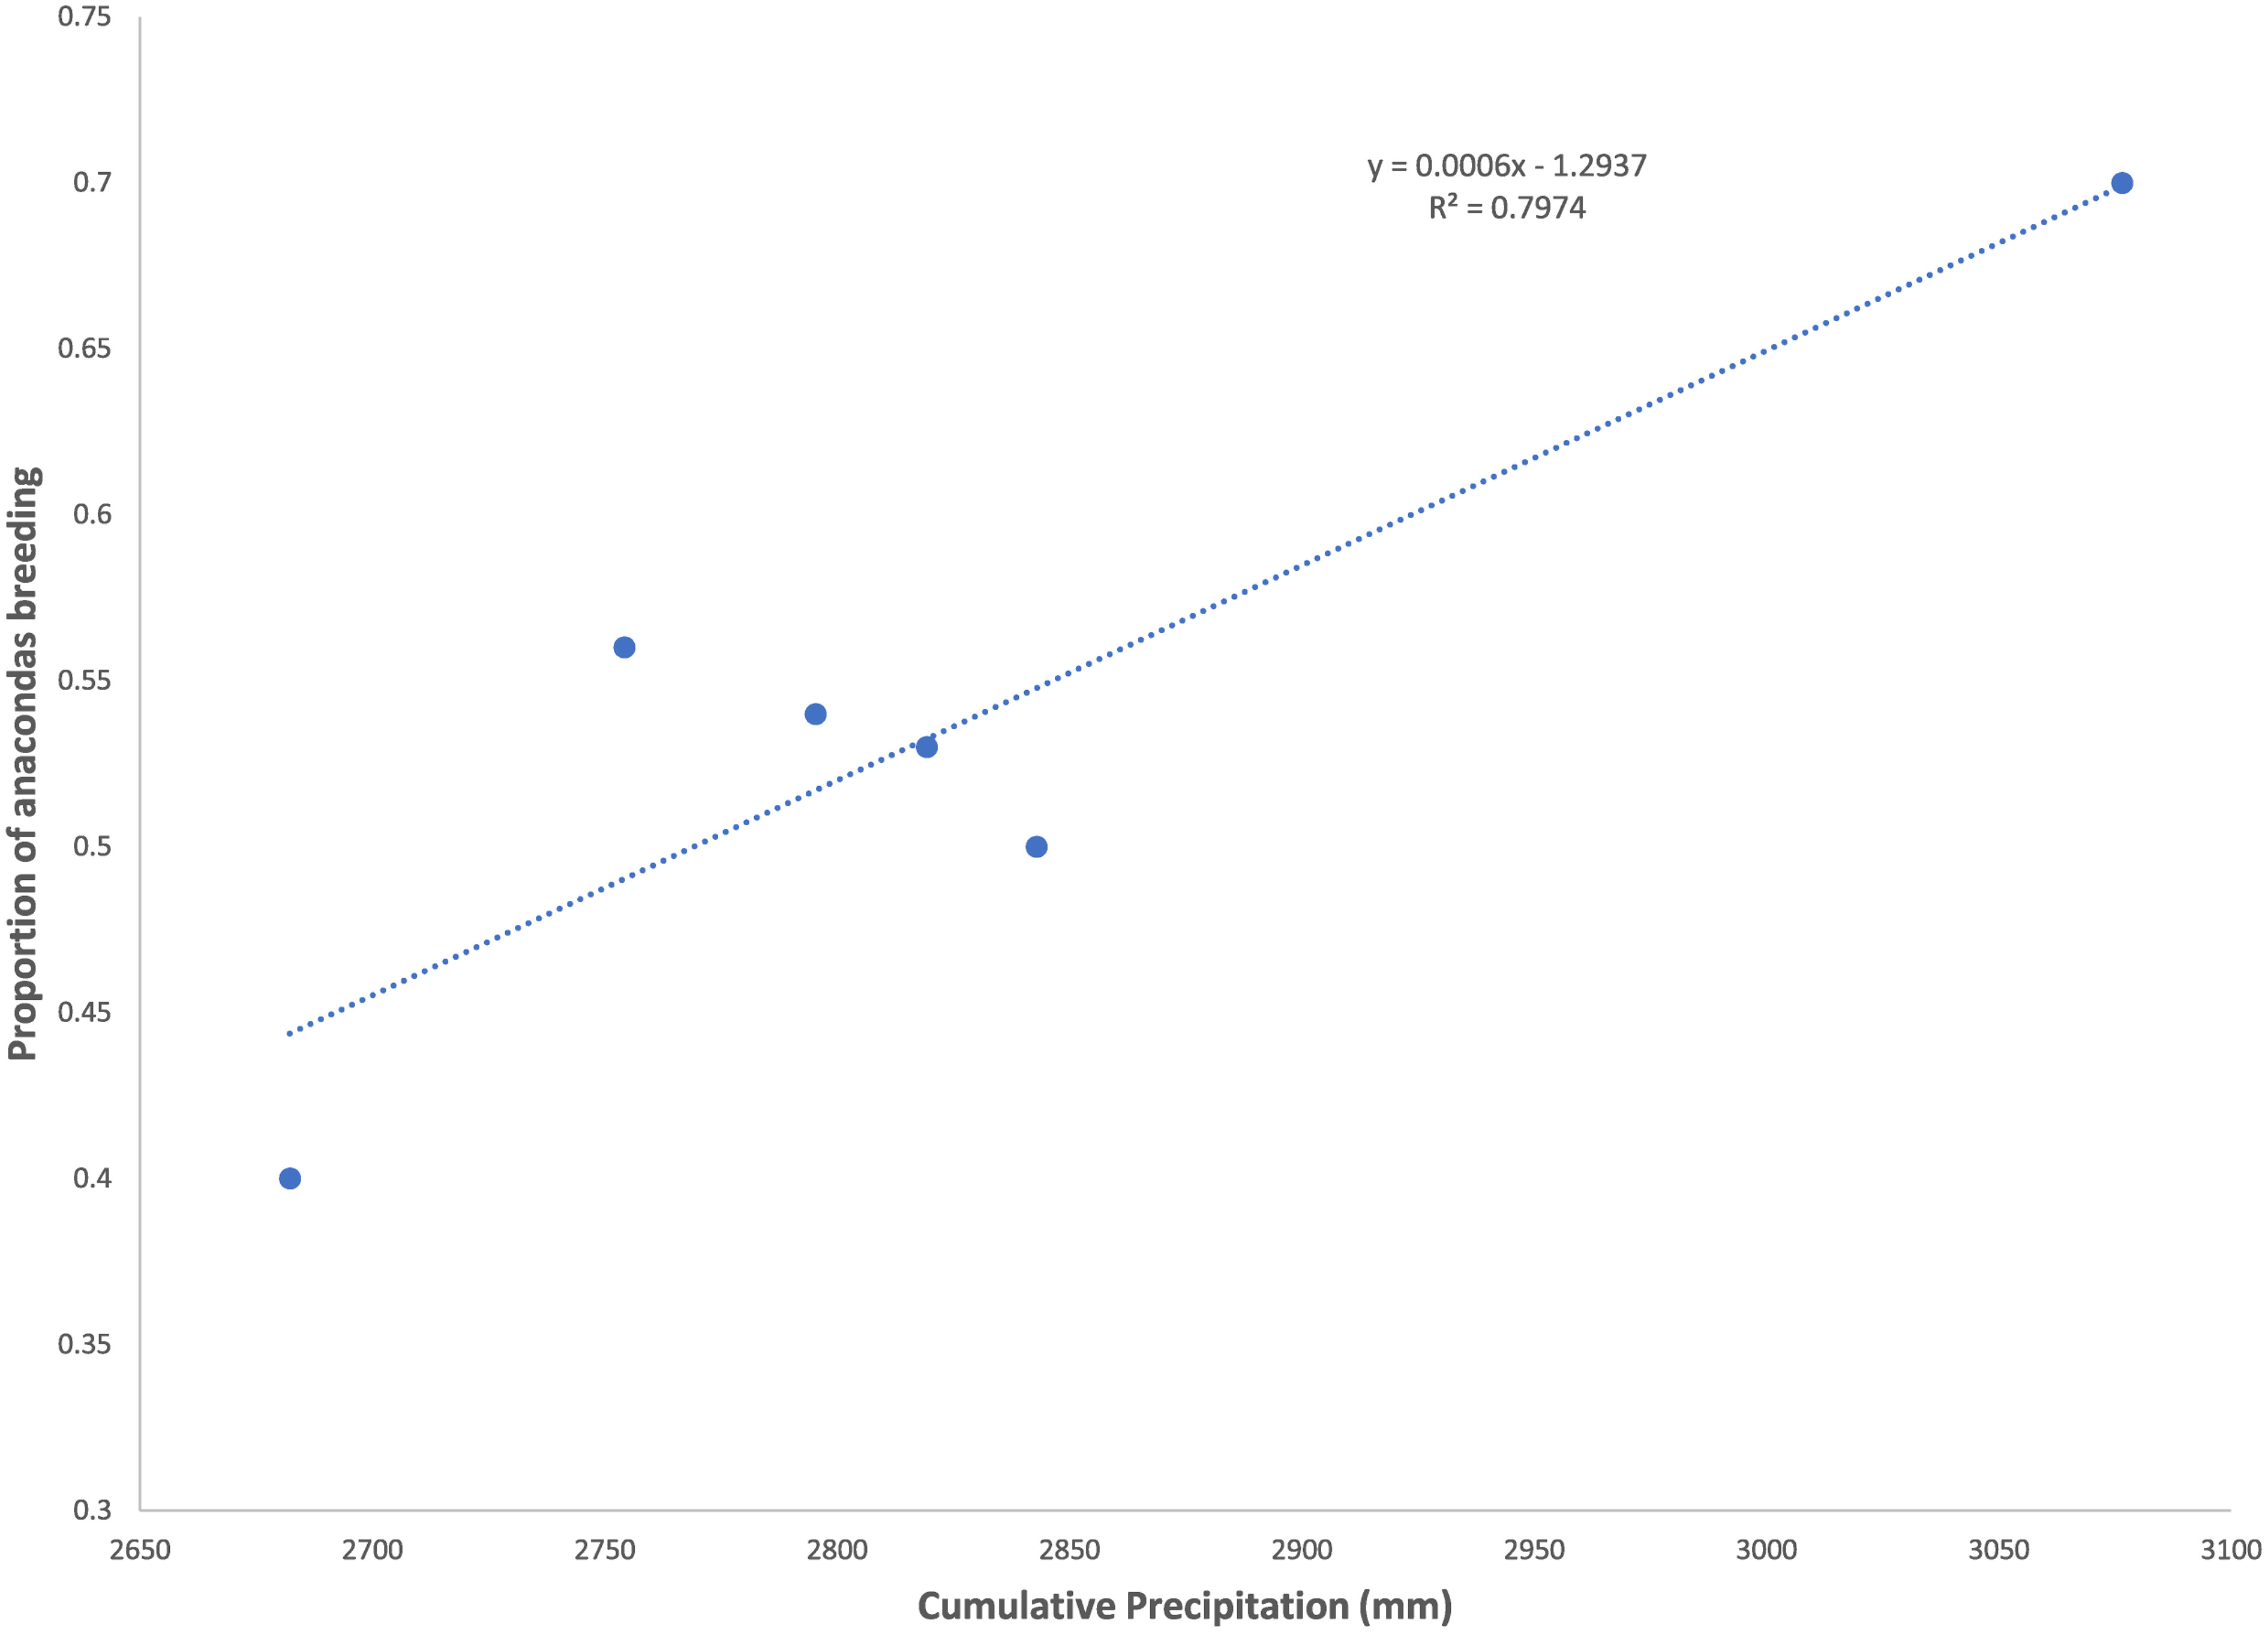
Figure 1 Proportion of anacondas found to be pregnant in a given year as a function of the precipitation in the previous and present year. Data from the llanos of Venezuela, Hato el Cedral between 1992 and 1997.
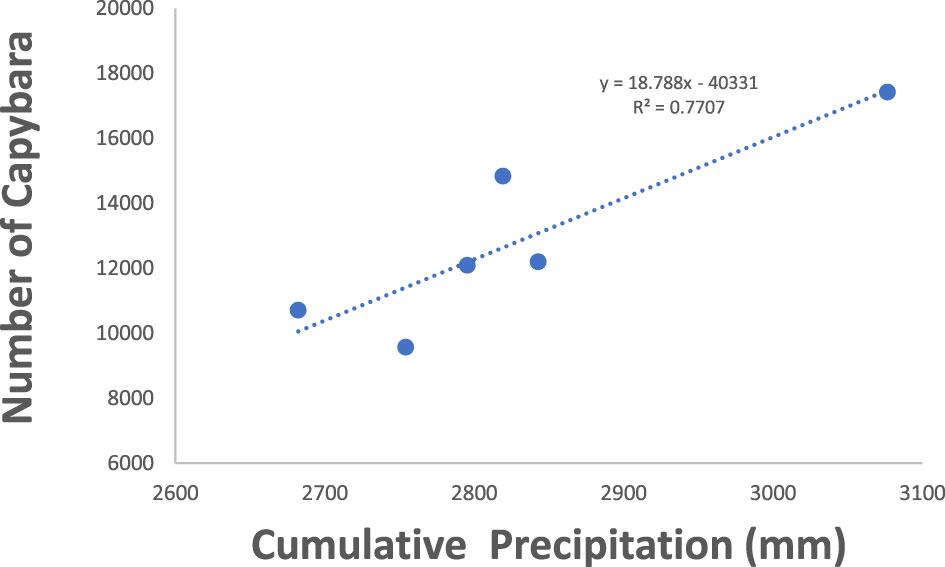
Figure 2 Capybara abudance in Hato el Cedral during 1992 and 1997. Cummulative precipitation is the precipitation of the previous year plus the precipitation from that year.
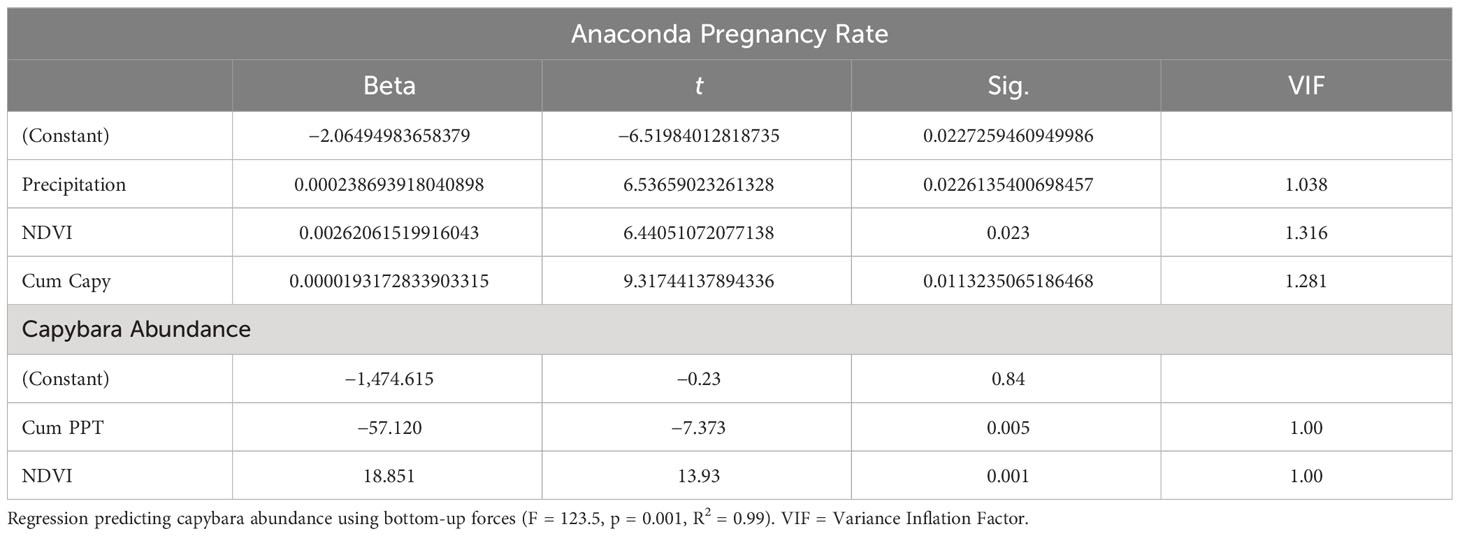
Table 2 Regression predicting pregnancy rate using capybara cummulative abundance, precipitation, and Net Primary Productivity (F = 44.1, p = 0.022, R2 = 0.99).
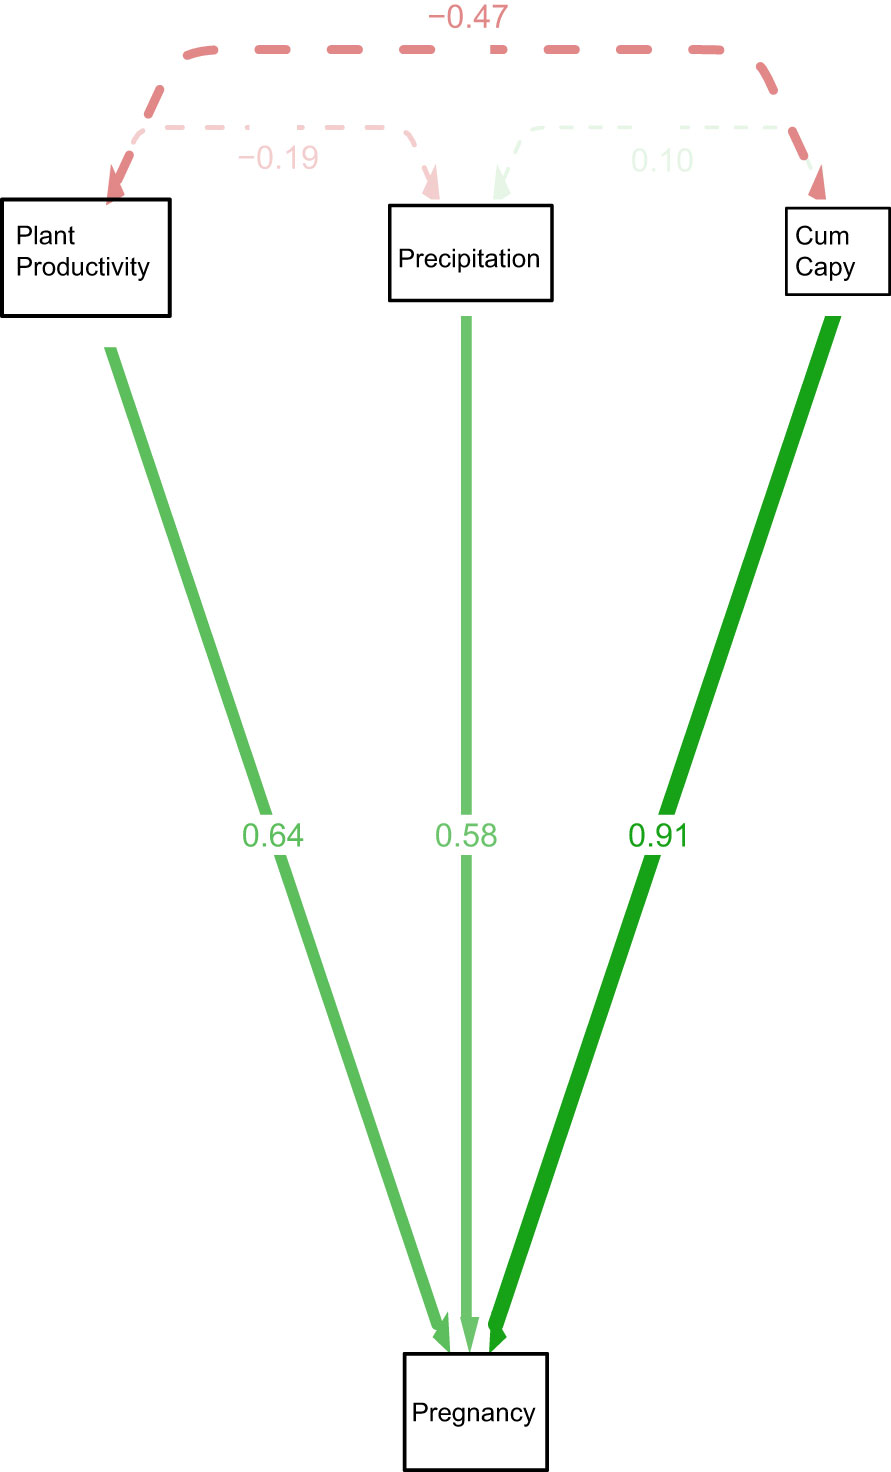
Figure 3 Path diagram representing the model Pregnancy = NDVI +precipitation + Cumcapy+ B predicting pregnancy of anacondas in the Venezuela llanos, Hato El Cedral. Pregnancy is the proportion of pregnant anacondas in a given year. Cum capy is the cummulative number of capybaras from that year plus the previous one.
Figure 3 shows a path diagram dissecting the relationships among the variables. The strongest interaction affecting anaconda pregnancy appears to be with cumulative capybara abundance, but the other two are also significant predictors. Similarly, capybara abundance seems to also be determined by bottom-up forces. Figure 4 shows a paired Pearson correlation test among the variables where the influence of capybara density, and cumulative precipitation, on anaconda breeding ratio is evident. It also shows cumulative precipitation having a strong effect on capybara density, as well as top-down effect of capybara abundance on plant productivity. In addition, it is possible to see a negative relationship between the number of females caught at any given year and the precipitation.
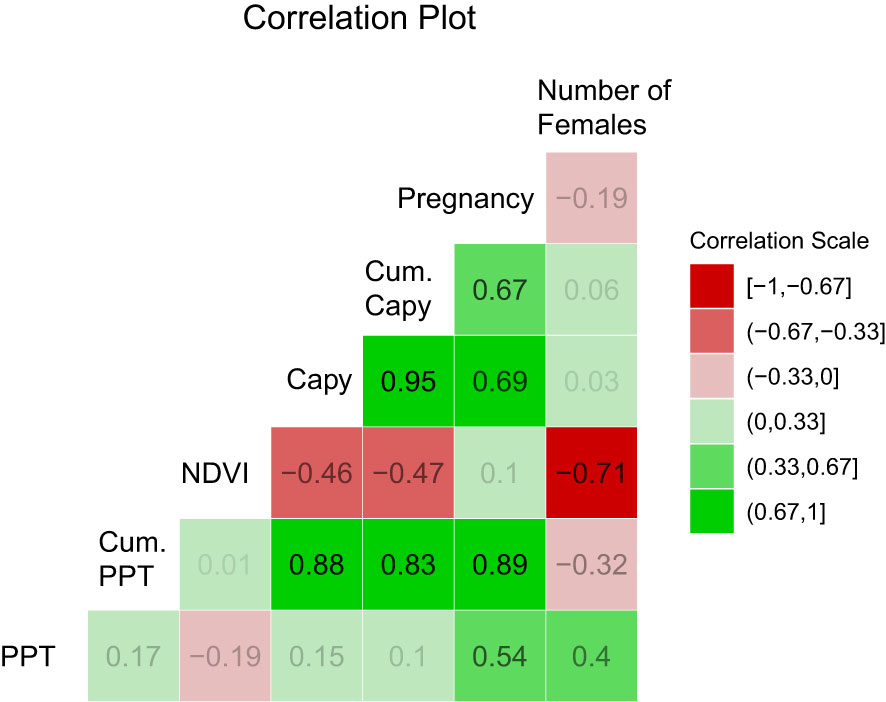
Figure 4 Pearson correlation among the variables. Capy = Capybara abundance from population censi, PPT = precipitation, Cum. Capy = abundance of capybara in a year plus the previous one. Cum PPT = precipitation of a year plus the previous one. NPP stands for Net Primary Productivity and refers to the NDVI data. Number of females is the total number of adult females found in a given year. Values above 0.67 are significant at 0.05. Values above 0.79 are significant at 0.01.
Discussion
Our data show a strong bottom-up effect on the percentage of breeding anacondas. There is a particularly strong interaction caused by capybara density. Originally, we expected to see an interaction between precipitation and NDVI, and between NDVI and capybara density, which, in turn, would affect anaconda pregnancy rate. Water limits plant growth in the hyper-seasonal habitat, and capybara are herbivores that depend strongly on availability of forage. These, we expected, would result in an increase in capybara density that would result in a strong interaction with anaconda pregnancy rate since capybaras are a common item in the anaconda’s diet (Rivas, 2004; Rivas, 2015; Rivas, 2020). However, our data show that both precipitation and NDVI have an independent effect on anaconda breeding ratio that is not related to capybara density, since the contribution of capybara abundance has already been accounted for in the model and there is very little collinearity among the variables.
This model deals with larger vertebrates that likely take some time to respond to environmental changes, thus the use of cumulative precipitation and capybara density in the models. As capital breeders, anacondas do not rely on food availability during pregnancy to supply the energetic needs of their developing clutch. Instead, they wait until they have enough stored reserves to start reproducing, which is a common reproductive strategy in boas, pythons, and other heavy bodied snakes (Madsen and Shine, 1996; Bonnet, 1998; Madsen and Shine, 1999; Lourdais et al., 2002; Bertona et al., 2003; Shine, 2003; Aubret et al., 2006). The number of capybaras in a given year is likely not enough to produce a response in anacondas’ breeding ratio in that year. In fact, a large anaconda likely eats only a few times per year (Rivas, 2020). Thus, in order to see a numeric response to the abundance of capybara, it takes some time for the animals to accumulate the energy needed for reproduction. A similar situation might be present in capybara abundance that responds to cumulative precipitation, rather than to the precipitation of a single year.
The delay in the predator population response to the increase in prey density may be the reason that studies documenting bottom-up regulation of terrestrial vertebrates are so rare because the longer time it takes the response to occur allows for other variables, such an unusual year, to mask the trend. By using pregnancy rate as a proxy for anaconda density, we were able to detect the effect of capybara abundance on anaconda demography isolating it from other variables such as low neonate survival, and problems measuring density of a cryptic animal among others.
We were surprised to see that net primary productivity also affects anaconda reproduction via another pathway other than capybaras. How does NPP net primary productivity affect anaconda reproduction that is not via capybara density? Because we have a good idea of the diet of anacondas in the area, we are prepared to make an informed guess of how this effect takes place; there is one other herbivore that constitutes an important prey item for anacondas: white-tailed deer (Odocoileus virginianus). While anacondas also prey on other herbivores like green iguana (Iguana iguana), their abundance in anaconda diet is far more limited. Plus, our data on NDVI is targeted to C4 plants that are a small component of the iguana’s diet (Rivas and Cordero, 1990). Thus, we conclude that the contribution of NDVI to anaconda breeding ratio is via modulating the abundance of O. virginianus. Unfortunately, we have no data on O. viginianus density to test this hypothesis.
Other items of anaconda diet that may also benefit from higher plant productivity are side-necked turtles (Podocnemis vogli) and spectacled caimans (Caiman crocodilus). Higher net primary productivity may benefit them via increase of their prey base. However, being long-lived reptiles themselves, with a relatively slow growth rate, it is not likely that their density can increase enough to produce an effect on anaconda pregnancy rate within a year or two. Even more puzzling was the independent contribution of precipitation on anaconda pregnancy rate, considering that the model statistically removed the contribution of capybara abundance and NDVI. It is possible that the increase in precipitation is associated to non-trophic effects such as more habitat, deeper water bodies, or increasing mobility of potential prey that increases the odds of anaconda preying on them.
The negative association between capybara density and NDVI was unexpected. We expected that more productivity (more food) would result in higher abundance of capybara. A possible explanation for this finding is the result of top-down pressure of herbivores on the plants. Capybara, as rodents, have a quick life cycle (Ojasti, 1991) and their increase in abundance may produce a top-down effect on their prey base relatively quickly. The higher density of capybara will result in more predation of grasses and decreased plant productivity, detected by the NDVI. The impact of herbivores affecting plant biomass is well documented in other species such as elk in North America (Ripple and Beschta, 2004; Ripple and Beschta, 2005) and wildebeest and other ungulates in Africa after the eradication of rinderpest (Sinclair et al., 2007; Sinclair et al., 2010). Thus, this finding of capybaras depressing plan biomass is not uncommon.
Since we do not have data on other capybara predators and the pregnancy rate of anacondas will not result in an increase of their population until a few years down the road, we cannot assess the influence of top-down forces of anaconda density on capybara abundance. However, our data also show a strong bottom-up effect of precipitation on capybara density. While this seems reasonable, previous studies show that herbivore abundance is controlled from the top-down effects (Krebs et al., 2001; Vidal and Murphy, 2018). Having a herbivore showing this kind of bottom-up regulation was unexpected.
Our data question the conventional wisdom that trophic interactions in the tropics are weak. Years after the data from this study were collected, one of the local ranch workers noticed that there were not many anaconda breeding aggregations that he had often showed to tourists. There was a string of years in which the administration of the ranch had changed and there had been an increase in poaching pressure on the capybara population. It is likely that the low abundance of capybara led to the drop of anaconda breeding aggregations noticed by the worker. Unfortunately, because the population was so low, there was no formal census and there are no hard data to confirm this. Cursory observations that we made of the capybara population that year showed many individual young and juvenile capybaras alone (not in groups) that were extremely skittish to human presence. These observations are consistent with changes in behavior due to high levels of poaching. Three years later, after the ranch’s new administration had restored guarding to prevent poaching, anaconda breeding aggregations were easily found again, supporting the hypothesis of a strong interaction between these two species. Being an ectotherm, they might have been able to get by with low energetic income for a few years, more than could have been seen in endotherm prey. Cuban boas (Epicrates angulifer), the largest snake of its habitat, also seems to have strong reliance on large rodent prey, Capromys pilorides (Roberto Ramos, personal communication). Top-down control of top predators on herbivores is what we expect from our knowledge of trophic cascades in temperate zones (Terborgh and Estes, 2010); our study shows the herbivores controlling the predators from the bottom-up.
It was puzzling to find the negative association of number of females captured with NDVI (Figure 4). This is likely explained because of ease of detection. When there is more vegetative coverage producing photosynthesis (high NDVI), visual detection of anacondas is more difficult because of their cryptic coloration and visual obstructions. We have noticed in the past that wet years result in lower detection of anacondas in the following year (Rivas et al., 2007b).
The fact that NDVI and precipitation have a strong effect on anaconda breeding rate suggests that there is redundancy in the system and that anacondas do not rely uniquely on capybaras. This supports the conventional wisdom that, in the tropics, there are redundant roles in the trophic chain, making their interactions weaker than they would be otherwise, and presumably gives resilience to the ecosystem as a whole. The breeding ratio of anaconda seems highly reliant on capybara density, but the population likely will be able to survive in the absence of capybara, partially thanks to its ectothermic nature that allows them to survive with low energetic income for extended periods, and by relying on other prey items like white-tailed deer, spectacled caiman, turtles, peccaries (Tayassus spp.), and a wide variety of birds, with waterfowl being important contributors (Valderrama and Thorbjarnarson, 2001; Rivas, 2020).
Anaconda density is strongly determined by bottom-up forces as it is expected in top predators. Our data contradict the hypothesis that trophic interactions in the tropics are always weak, while also supporting the thesis that tropical systems have redundant interactions that provide resilience in response to environmental variability and disturbances.
Data availability statement
The original contributions presented in the study are included in the article/supplementary material. Further inquiries can be directed to the corresponding author.
Ethics statement
The animal study was approved by New Mexico Highlands University and University of Tennessee. The study was conducted in accordance with the local legislation and institutional requirements.
Author contributions
Data collection, writing the manuscript: JR. GIS analysis: WJ-W. Both authors contributed to the article and approved the submitted version.
Acknowledgments
We thank the Wildlife Conservation Society, the National Geographic Society, the Doue de le Fountain Zoological Park, and Miami Metro Zoo for logistic support. We also thank COVEGAN, Estación Biologica Hato El Frío, for logistic assistance and for permission to perform this study on their property. We thank Carmen Torin for help with the weather data and Red Agrometeorológica del INIA (RAI), Instituto Nacional de Investigaciones Agrícolas (INIA). We are in debt to M. Quero and P. Azuaje for their advice and cooperation in the development of this research as well as assistance during the field work. We thank Victor Musiú Delgado for information on anaconda pregnancy and poaching. We thank NMHU’s ORSP for publication funding. We thank B. Miller for editorial comments in this manuscript and M. Muñoz for assistance during extensive field work. We are in special debt to the late J. Thorbjarnarson for all his help and mentorship in this study and over the years, and dedicate this paper to his memory.
Conflict of interest
The authors declare that the research was conducted in the absence of any commercial or financial relationships that could be construed as a potential conflict of interest.
Publisher’s note
All claims expressed in this article are solely those of the authors and do not necessarily represent those of their affiliated organizations, or those of the publisher, the editors and the reviewers. Any product that may be evaluated in this article, or claim that may be made by its manufacturer, is not guaranteed or endorsed by the publisher.
References
Aubret F., Bonnet X., Shine R., Lourdais O. (2006). Fat is sexy for females but not males : the influence of body reserves on reproduction in snakes (Vipera aspis). Horm. Behav. 147, 135–147. doi: 10.1006/hbeh.2002.1793
Bartrons M., Mehner T., Argillier C., Beklioglu M., Blabolil P., Hesthagen T., et al. (2020). Energy-based top-down and bottom-up relationships between fish community energy demand or production and phytoplankton across lakes at a continental scale. Limnol. Oceanogr. 65, 892–902. doi: 10.1002/lno.11434
Bertona M., Chiaraviglio M., Animal D., Exactas C., Constrictor A. B. (2003). Reproductive biology, mating aggregations, and sexual dimorphism of the Argentine Boa Constrictor (Boa constrictor occidentalis). J. Herpetol. 37, 510–516. doi: 10.1670/122-02A
Bihansky T. (2017) Introduction to Path Analysis in R (Rpubs by Rstudio). Available at: https://rpubs.com/tbihansk/302732 (Accessed October 3, 2023).
Bonnet X. (1998). Capital versus income breeding: an ectothermic perspective. Oikos 83, 333–. doi: 10.2307/3546846
Borer E. T., Seabloom E. W., Shurin J. B., Anderson K. E., Blanchette C. A., Cooper B. S. D., et al. (2005). What Determines the strength of a trophic cascade? Ecology 86, 528–537. doi: 10.1890/03-0816
Butt N., Seabrook L., Maron M., Law B. S., Dawson T. P., Syktus J., et al. (2015). Cascading effects of climate extremes on vertebrate fauna through changes to low-latitude tree flowering and fruiting phenology. Glob. Change Biol. 21, 3267–3277. doi: 10.1111/gcb.12869
Calle P. P., Rivas J. A., Munoz M., del C., Thorbjarnarson J., Dierenfeld E. S., et al. (1994). Health Assessment of Free Ranging anacondas (Eunectes murinus) in Venezuela. J. Zoo Wildl. Med. 25, 53–61.
Calle P. P. P., Rivas J. A., Muñoz M., Thorbjarnarson J. B., Holmstrom W., Karesh W. B. (2001). Infectious Disease serologic survey in free-ranging Venezuelan anacondas (Eunectes murinus). J. Zoo Wildl. Med. 32, 320–323. doi: 10.1638/1042-7260(2001)032[0320:IDSSIF]2.0.CO;2
Coll M., Hargadon K. (2012). Trophic and functional cascades in tropical versus temperate aquatic microcosms. Aquat. Ecol. 46, 55–71. doi: 10.1007/s10452-011-9381-9
de Miranda E. B. P. (2017). The plight of reptiles as ecological actors in the tropicss. Front. Ecol. Evol. 5. doi: 10.3389/fevo.2017.00159
Dickman C. R., Glen A. S., Jones M. E., Soulé M. E., Ritchie E. G., Wallach A. D. (2014). “Strongly interactive carnivore species: maintaining and restoring ecosystem function BT - Carnivores of Australia: past, present and future,” Carnivores of Australia: past, present and future. Eds. Glen A., Dickman C. (Collingwood: CSIRO Publishing).
Dobson A. P. (2014). Yellowstone wolves and the forces that structure natural systems. PloS Biol. 12, 9–12. doi: 10.1371/journal.pbio.1002025
Dyer L. (2008). Tropical tritrophic interactions: Nasty hosts and ubiquitous cascades. Trop. For. Community Ecol., 275–293.
Dyer L. A., Letourneau D. K. (1999a). Relative strengths of top-down and bottom-up forces in a tropical forest community. Oecologia 119, 265–274. doi: 10.1007/s004420050785
Dyer L. A., Letourneau D. K. (1999b). Trophic cascades in a complex terrestrial community. Proc. Natl. Acad. Sci. U. S. A. 96, 5072–5076. doi: 10.1073/pnas.96.9.5072
Estes J. A., Petersonm C. H., Steneck R. S. (2010). “Some effects of apex predators in higher-latitude coastal oceans,” in Trophic Cascades: Predators, Prey, and the Changing Dynamics of Nature. Eds. Terborgh J., Estes J. A. (Washington, DC: Island Press), 37–53.
Estes J. A., Terborgh J., Brashares J. S., Power M. E., Berger J., Bond W. J., et al. (2011). Trophic downgrading of planet earth. Sci. (80-) 333, 301–306. doi: 10.1126/science.1205106
Fraser L. H., Grime J. P. (1997). Primary productivity and trophic dynamics investigated in a North Derbyshire, UK, dale. Oikos 80, 499. doi: 10.2307/3546623
Holdo R. M., Sinclair A. R. E., Dobson A. P., Metzger K. L., Bolker B. M., Ritchie M. E., et al. (2009). A disease-mediated trophic cascade in the Serengeti and its implications for ecosystem C. PloS Biol. 7, e1000210. doi: 10.1371/journal.pbio.1000210
Kerkhoff A. (2011). Even parasites play by the rules. Bioscience 61, 940–941. doi: 10.0.5.245/bio.2011.61.12.3
Krebs C. J., Boonstra R., Boutin S., Sinclair A. R. E. (2001). What drives the 10-year cycle of snowshoe hares? Bioscience 51, 25–35. doi: 10.1641/0006-3568(2001)051[0025:WDTYCO]2.0.CO;2
Letourneau D. K., Dyer L. A. (1998). Experimental test in lowland tropical forest shows top-down effects through four trophic levels. Ecology 79, 1678. doi: 10.2307/176787
Lourdais O., Bonnet X., Shine R., Denardo D., Naulleau G. U. Y., Guillon M. (2002). Capital-breeding and reproductive effort in a variable environment : a longitudinal study of a viviparous snake. J. Anim. Ecol. 71, 470–479. doi: 10.1046/j.1365-2656.2002.00612.x
Luiselli L., Migliazza R., Rotondo C., Amori G. (2014). Macro-ecological patterns of a prey-predator system: Rodents and snakes in west and central Africa. Trop. Zool. 27, 1–8. doi: 10.1080/03946975.2014.894399
Madsen T., Shine R. G. (1996). Determinants of reproductive output in female water pythons (Liasis fuscus: Pythonidae). Herpetologica 52, 146–159.
Madsen T., Shine R. (1999). The adjustment of reproductive threshold to prey abundance in a capital breeder. J. Anim. Ecol. 68, 571–580. doi: 10.1046/j.1365-2656.1999.00306.x
Mäntylä E., Klemola T., Laaksonen T. (2011). Birds help plants: A meta-analysis of top-down trophic cascades caused by avian predators. Oecologia 165, 143–151. doi: 10.1007/s00442-010-1774-2
McCann K., Hastings A. G., Huxel G. R. (1998). Weak interactions. Nature 395, 794–798. doi: 10.1038/27427
Mccauley D. J., Keesing F., Young T. P., Allan B. F., Pringle R. M. (2006). Indirect effects of large herbivores on snakes in an African savanna. Ecology 87, 2657–2663. doi: 10.1890/0012-9658(2006)87[2657:IEOLHO]2.0.CO;2
Miller B. J., Harlow H. J., Harlow T. S., Biggins D., Ripple W. J. (2012). Trophic cascades linking wolves (Canis lupus), coyotes (Canis latrans), and small mammals. Can. J. Zool. 90, 70–78. doi: 10.1139/Z11-115
Milton Y., Kaspari M. (2007). Bottom-up and top-down regulation of decomposition in a tropical forest. Oecologia 153, 163–172. doi: 10.1007/s00442-007-0710-6
Ojasti J. (1991). “Human explotaition of capybaras,” in Tropical Wildlife Use and Conservation. Eds. Robinson J. G., Redford K. H. (Chicago: University of Chicago Press), 236–252.
Oksanen L., Ferwell S. D., Arruda J., Niemela P. (1981). Exploitation ecosystems in gradients of primary productivity. Am. Nat. 118, 240–261. doi: 10.1086/283817
Paine R. T. (1966). Food web complexity and species diversity. Am. Nat. 100, 65–75. doi: 10.1086/282400
Ricker W. E. (1975). Computation and interpretation of biological statistics of fish populations. Bull. Fish. Res. Board Canada 191, 1–382.
Ripple W. J., Beschta R. L. (2004). Wolves and the ecology of fear: Can predation risk structure ecosystems? Bioscience 54, 755–766. doi: 10.1641/0006-3568(2004)054[0755:WATEOF]2.0.CO;2
Ripple W. J., Beschta R. L. (2005). Linking wolves and plants: aldo leopold on trophic cascades. Bioscience 55, 613. doi: 10.1641/0006-3568(2005)055[0613:LWAPAL]2.0.CO;2
Ripple W., Rooney T., Beschta R. (2010). “Large predators, deer, and trophic cascades in boreal and temperate ecosystems,” in Trophic Cascades: Predators, Prey and the Changing Dynamics of Nature, eds. Terborgh J., Estes J. A. (Washington, DC: Island Press), 141–162. Available at: http://www.cof.orst.edu/leopold/class-reading/Ripple et al in press.pdf.
Rivas J. A. (1998). Predatory attacks of Green Anacondas (Eunectes murinus) on Adult Human Beings. Herpetol. Nat. Hist. 6, 157–159.
Rivas J. A. (2015). Natural History of the Green Anaconda: with emphasis on its reproductive biology (South Carolina: CreateSpace Independent Publishing Platform).
Rivas J. A. (2020). Anaconda: The Secret Life of the Wolrd’s Largest Snake (Oxford: Oxford University Press).
Rivas J. A. (2023a). Determining Breeding Status of Green Anacondas (Eunectes murinus, Linnaeus 1758): A condition Index Assuming Isometry. South Am. J. Herpetol. 28, 1–7. doi: 10.2994/SAJH-D-22-00022.1
Rivas J. A. (2023b). What can studying anacondas tell us about Titanoboa cerrejonensis? Exploring the life of an extinct giant snake using an extant pretty big snake. Herpetol. J. 33, 68–75. doi: 10.33256/33.3.6875
Rivas J., Ascanio R. E., Muñoz M. D. C. (2008). What is the length of a snake? Contemp. Herpetol. 2008, 1–3. doi: 10.17161/ch.vi1.11941
Rivas J. A., Burghardt G. M. (2001). Understanding sexual size dimorphism in snake’s: wearing the snake’s shoes. Anim. Behav. 62, F1–F6. doi: 10.1006/anbe.2001.1755
Rivas J. A., Cordero G. (1990). Dieta de la iguana verde (Iguana iguana) en los llanos centrales de Venezuela durante la estación seca. Dep. Biol. Licenciatu.
Rivas J. A., Corey-Rivas S. (2008). Eunectes murinus (green anaconda). Longevity. Herpetol. Rev. 39, 469.
Rivas J. A., Molina C. R., Corey-Rivas S. J., Burghardt G. M. (2016). Natural history of neonatal green anacondas ( Eunectes murinus ): A chip off the old block. Copeia. 104, 402–410. doi: 10.1643/CE-15-238
Rivas J. A., Muñoz M., del C., Burghardt G. M., Thorbjarnarson J. B. (2007a). “Sexual size dimorphism and the mating system of the green anaconda (Eunectes murinus),” in Biology of Boas, Pythons, and Related Taxa. Eds. Henderson R. W., Powell R. (Eagle Mountain, UT: Eagle Mountain Publishing Company), 313–325.
Rivas J. A., Muñoz M., del C., Thorbjarnarson J. B., Burghardt G. M., Holmstrom W., et al. (2007b). “Natural History of the green anacondas in the Venezuelan llanos,” in Biology of Boas, Pythons, and Related Taxa. Eds. Henderson R. W., Powell R. (Eagle Mountain, UT: Eagle Mountain Publishing Company), 128–138.
Rivas J. A., Owens R. Y., Calle P. P. (2001). Eunectes murinus: Juvenile predation. Herpetol. Rev. 32, 107–108.
Rivas J. A., Rodriguez J. V., Mittermeier C. G. (2002). “The llanos,” in Wilderness: Earth’s last wildl Places. Eds. Mittermeier R., Mittermeier C. G., Gil P.R., Pilgrim J., Konstant W. R., Fonseca G. A. B., et al (Mexico: Cemex), 1689–1699.
Rivas J. A., Thorbjarnarson J. B., Owens R. Y., Muñoz M. C. (1999). Eunectes murinus: caiman predation. Herpetol. Rev. 30, 101.
Rodríguez-Castañeda G. (2013). The world and its shades of green: A meta-analysis on trophic cascades across temperature and precipitation gradients. Glob. Ecol. Biogeogr. 22, 118–130. doi: 10.1111/j.1466-8238.2012.00795.x
Rossiter W., King G., Johnson B. (2017). Revisiting the energetic efficiency hypothesis: body mass, metabolism, and food chain length. Am. Midl. Nat. 177, 1–14. doi: 10.1674/0003-0031-177.1.1
Schuldt A., Bruelheide H., Buscot F., Assmann T., Erfmeier A., Klein A. M., et al. (2017). Belowground top-down and aboveground bottom-up effects structure multitrophic community relationships in a biodiverse forest. Sci. Rep. 7, 1–10. doi: 10.1038/s41598-017-04619-3
Shine R. (2003). Reproductive strategies in snakes. Proc. R. Soc B Biol. Sci. 270, 995–1004. doi: 10.1098/rspb.2002.2307
Shurin J. B., Seabloom E. W. (2005). The strength of trophic cascades across ecosystems: predictions from allometry and energetics. J. Anim. Ecol. 74, 1029–1038. doi: 10.1111/j.1365-2656.2005.00999.x
Sinclair A. R. E., Krebs C. J., Fryxell J. M., Turkington R., Boutin S., Rudy Boonstra P., et al. (2000). Testing hypotheses of trophic level interactions: a boreal forest ecosystem. Oikos 89 (2), 313–328. doi: 10.1034/j.1600-0706.2000.890213.x
Sinclair A. R. E., Mduma S. A. R., Hopcraft J. G. C., Fryxell J. M., Hilborn R., Thirgood S. (2007). Long-term ecosystem dynamics in the serengeti: Lessons for conservation. Conserv. Biol. 21, 580–590. doi: 10.1111/j.1523-1739.2007.00699.x
Sinclair A. R., Metzger K. L., Brashares J. S., Nkwabi A. J. K., Sharam G. (2010). “Trophic cascades in African Savanna: Serengeti as a case study,” in Trophic Cascades: Predators, Prey, and the changing dynamics of Nature Eds. Terborgh J., Estes J. (Washington, DC: Island Press).
Terborgh J., Estes J. A. (2010). Trophic Cascades: Predators, Prey, and the Changing Dynamics of Nature. (Washington, DC: Island Press). doi: 10.1177/1757913910379198
Terborg J., Feeley K. (2010). “Propagation of trophic cascades via multiple pathways in a tropical forest,” in Trophic Cascades: Predators, Prey and the Changng Dynamics of Nature (Washington, DC: Island Press), 125–140.
Terborgh J. (2012). Enemies maintain hyperdiverse tropical forests. Am. Nat. 179, 303–314. doi: 10.1086/664183
Terborgh J., Lopez L., Nunez P., Madhu R., Shahabuddin G., Orihuela G., et al. (2001). Ecological Meltdown in Predator-free forest fragments. Sci. (80-. ) 294, 1923–1926. doi: 10.1126/science.1064397
Thingstad T. F. (2020). How trophic cascades and photic zone nutrient content interact to generate basin-scale differences in the microbial food web. ICES J. Mar. Sci. 77, 1639–1647. doi: 10.1093/icesjms/fsaa028
Tucker C. J., Pinzon J. E., Brown M. E., Slayback D. A., Pak E. W., Mahoney R., et al. (2005). An extended AVHRR 8-km NDVI dataset compatible with MODIS and SPOT vegetation NDVI data. Int. J. Remote Sens. 26, 4485–4498. doi: 10.1080/01431160500168686
Keywords: weak interactions, redundancy, bottom-up effect, top-down effect, ectothermic vertebrates, tropical trophic cascades, vertebrate ecology, South America
Citation: Rivas JA and Jaremko-Wright W (2023) What determines demographic growth in green anacondas? Strong interactions among vertebrates in a neotropical ecosystem. Front. Ecol. Evol. 11:1184192. doi: 10.3389/fevo.2023.1184192
Received: 11 March 2023; Accepted: 09 August 2023;
Published: 12 September 2023.
Edited by:
Gisele Winck, Oswaldo Cruz Foundation (Fiocruz), BrazilReviewed by:
Zaal Kikvidze, Ilia State University, GeorgiaDavid Tarkhnishvili, Ilia State University, Georgia
Copyright © 2023 Rivas and Jaremko-Wright. This is an open-access article distributed under the terms of the Creative Commons Attribution License (CC BY). The use, distribution or reproduction in other forums is permitted, provided the original author(s) and the copyright owner(s) are credited and that the original publication in this journal is cited, in accordance with accepted academic practice. No use, distribution or reproduction is permitted which does not comply with these terms.
*Correspondence: Jesús A. Rivas, cml2YXNAbm1odS5lZHU=
†Present addresses: Jesús A. Rivas, Department of Biology, New Mexico Highlands University, Las Vegas, NM, United States