 Mitzy F. Porras1*
 Carlos A. Navas2
 Gustavo A. Agudelo-Cantero2
 Michel Geovanni Santiago-Martínez3
 Volker Loeschcke4
 Jesper Givskov Sørensen4
 Sharifa G. Crandall5David Biddinger1
 Edwin G. Rajotte1
- 1Department of Entomology, The Pennsylvania State University, University Park, PA, United States
- 2Department of Physiology, Institute of Biosciences, University of São Paulo, São Paulo, Brazil
- 3Department of Molecular and Cell Biology, The University of Connecticut, Storrs, CT, United States
- 4Department of Biology–Genetics, Ecology and Evolution, Aarhus University, Aarhus, Denmark
- 5Department of Plant Pathology and Environmental Microbiology, The Pennsylvania State University, University Park, PA, United States
The frequency and intensity of extreme heat in the environment have increased in the last decade. Extreme heating events (EHE) have wide-ranging impacts on biological systems from the molecular to the community level. However, the impacts of EHE have been poorly studied in pathogen–host systems. Here, we explore how EHE affects the interaction among the insect hosts, Osmia cornifrons and Osmia lignaria, and a protozoan pathogen, Crithidia mellificae. We compared changes in the upper limit for locomotion of hosts (Ctmax), thermal boldness (voluntary exposure to Extreme Temperature Zones – ETZ) between healthy and infected host exposed to EHE, and the effect of host Ctmax on pathogen growth rate. Our results showed that 1-day EHE significantly reduced the upper limit for locomotion of hosts by an average of 4 °C in healthy and 7 °C in infected hosts. Further, EHE significantly reduced the protozoan pathogen growth rate. EHE also reduced the hosts’ voluntary exposure to (or transit across) extreme (hot or cold) temperature zones (ETZ). Our results show that EHE reduces both hosts’ heat tolerance and pathogen fitness, and shed light on the implications of EHE on host–pathogen dynamics under warmer world.
Introduction
Anthropogenically-induced global warming is increasing the frequency, magnitude, and duration of different kinds of extreme heating events (EHE) globally, posing high risks to biodiversity (Masson-Delmotte et al., 2021). EHE can have profound effects on organisms’ development and behavior as well as species’ phenology, community structure and ecosystem function (Buckley and Huey, 2016; Williams et al., 2016; Przybyla et al., 2021; Breedveld et al., 2023). In addition, EHE can potentially modify species’ interactions, including how extreme heat alters the interactions between hosts and pathogens (Adamo and Lovett, 2011; Burge and Hershberger, 2020). This is particularly important in ectothermic host-pathogen systems where the thermal performance of microbial parasites or pathogens is entirely dependent on the host body temperature (Thomas and Blanford, 2003). In turn, pathogens have the ability to alter hosts’ thermoregulatory strategies (Elliot et al., 2002). Thus, understanding whether and how EHE may affect physiology, behavior, or fitness of hosts and pathogens is critical to better describe interspecific interactions. For example, there may be mismatches between the thermal tolerance of insect hosts and their pathogens, which may change the relationship, including overall infection and disease dynamics. Understanding how an EHE affects relevant traits of hosts and pathogens is critical to better describe interspecific interactions.
In general, the thermal tolerance of a species results from a complex suite of factors, including cellular, metabolic, hormonal, neuronal, abiotic, and biotic factors (Hutchison, 1976; Nowakowski et al., 2016) and affects both insect hosts and their pathogens. Tolerance to heat can be altered by environmental temperature variation (Brochu et al., 2004), drought (Von Bülow and Beitz, 2015; Beetge and Krüger, 2019), pollution (Cairns Lanza and Parker, 1972; Echavez and Leal, 2021; González-Tokman et al., 2021), diet (Krebs and Loeschcke, 1994; Adamo et al., 2012; Hamad, 2012), as well as symbiotic interactions (Dunbar et al., 2007; Xu et al., 2008; Padfield et al., 2020; Porras et al., 2020), and parasitism (Porras et al., 2021; Sánchez et al., 2021). The degree of heat tolerance can vary among populations of both hosts and pathogens (Sinclair et al., 2012; Paudel et al., 2020). While severe EHE are generally predicted to reduce the performance of any given species, understanding whether pathogens and insect hosts might be differentially affected will help to predict the effects of current and future EHE on host–pathogen interactions (Nowakowski et al., 2016; Sinclair et al., 2016).
Exploring how host–pathogen systems differ in their response to EHE poses an experimental challenge since each organism should be studied separately and while interacting (Elliot et al., 2002; Adamo et al., 2012; Poulin and Randhawa, 2015). For instance, ectothermic hosts presumably have a narrower thermal range and lower thermotolerance than their pathogens (Nowakowski et al., 2016; Rohr et al., 2018; Dudney et al., 2021). Therefore, at least in some systems, hosts are more susceptible to disease at temperatures further away from their optimum temperature. While numerous studies have explored the impacts of stressors such as temperature, drought, and pH, on the species’ thermal tolerance, individually characterizing impacts of multiple stressors remains elusive (Hector et al., 2023). Furthermore, the effect of hosts’ thermal tolerance limits on pathogens has rarely been studied. A potential approach to studying feedback within the environment–host–pathogen system may come from integrating parameters from physiology and behavior, such as the upper thermal limit for locomotion, voluntary exploration of extreme temperatures, and population growth rate. Measuring key host and pathogen traits while they are alone or within their interaction may provide insights into thermal tolerance changes. The upper thermal limit for locomotion (Ctmax) is the temperature at which an organism’s neuromuscular junctions break down, resulting in loss of neuromuscular coordination (Hochachka and Somero, 2002). Another parameter of interest is voluntary exposure to zones with extreme temperatures (ETZ) or thermal boldness, which is the tendency to voluntarily enter and cross zones of critical (hot or cold) temperatures. Characterizing thermal boldness can provide insights into the role of behavioral decisions on physiology (Hutchison and Maness, 1979). Both, Ctmax and voluntary exposure to ETZ can help better understand the plasticity of thermal biology (Rodrigues and Beldade, 2020) and the adaptive processes of species in variable thermal environments (Mayr, 1983; Huey et al., 2003).
In this study, we asked about the effect of extreme heat on the performance of insect hosts, a pathogen, and their interaction. Our question arises from the lack of knowledge about the links between the effects of extreme heat and infection in host–pathogen system and the feedback mechanisms within their interactions. To address this question, we conducted laboratory experiments with two solitary mason bee species, Osmia cornifrons and Osmia lignaria (Hymenoptera: Megachilidae), hosts of a protozoan pathogen, Crithidia mellificae (Trypanosomatida). Both solitary bees are cavity-nesting and univoltine emerging in early spring. However, O. cornifrons is an introduced Asian species, while O. lignaria is native to North America. Both species are susceptible to C. mellificae (Strobl et al., 2019; Ngor et al., 2020), a unicellular, eukaryotic flagellate that attaches to the host’s hindgut cells using its flagellum (Langridge and McGhee, 1967; Schwarz et al., 2015). The pathogen forms hemidesmosomes causing lesions in the intestinal cells (Hubert et al., 2017), which reduce both survival and fecundity (Strobl et al., 2019; Gómez-Moracho et al., 2020). We hypothesize that EHE reduces heat tolerance and inhibits thermal boldness in the hosts, as well as reduces pathogen population growth rate. We predict that EHE will reduce host and pathogen performance in ways that could induce a mismatch in the host-pathogen interaction. To answer this question and test these hypotheses, we assessed the effects of EHE, pathogen infection, and the combination of both factors on the hosts’ heat tolerance and voluntary exploration of cold and hot ETZ. Next, we explored how the changes induced by extreme heat on host thermal tolerance altered the pathogen growth rate.
Materials and methods
EHE
Overwintering adults of O. cornifrons and O. lignaria in cocoons were obtained from Watts Bees (Bothell, WA) and stored at 5°C before the experiment (1,200 cocoons total). In March 2022, groups of 100 cocoons of each species were transferred daily to plastic cups (50 cocoons/cup, 5 cm DI × 15 cm length) with a napkin introduced inside the cup to aid eclosion and provide a substrate for chewing, which reduced mason bee stress. Two plastic cups with cocoons were placed inside an insect cage (BugDorm MegaView Science Co., Ltd., Taichung, Taiwan) with a 10 mL feeder containing 50% sucrose solution, and held for 4 days to ensure mating at 23°C with 70% RH and photoperiod 10 L (low intensity): 14 D. Groups of 12 females were transferred from the mating cages to plastic cups with a 4 mL feeder containing 50% sucrose solution and napkin (3 cm × 10 cm) simulating the setting of the insect cage. These groups of females were exposed to increasing temperatures at a rate 0.5°C/3 min from 23°C to 30 ± 1°C, and held at this constant temperature for 25 h in a climate-controlled chamber. We chose this temperature based on heat wave temperature records for spring in Washington and California in 2021 recorded by NOAA and AccuWeather platforms (Glahn and Ruth, 2003), and by comparison with the expected average temperature during spring (McEvoy and Hatchett, 2023) given that our experiments were conducted using specimens from the west coast of USA. The main methods are described in Supplementary Figure 1.
Pathogen inoculations (Crithidia mellificae)
Females of O. cornifrons and O. lignaria were fed with 50% (w/v) sucrose solution prepared with a final concentration of approximately 100,000 living C. mellificae cells/bee following a protocol modified from Schwarz and Evans (2013) and Williams et al. (2019). Each group of females (12 individuals) was caged with 1 mL of the C. mellificae sucrose solution or only with sucrose (controls) and allowed to feed for 6 h. Food consumption was checked every 2 h, and when the bees consumed the entire volume, an uncontaminated 50% (w/v) sucrose solution was provided ad libitum until the end of the experiment.
Host upper temperature limit for locomotion (Ctmax) of healthy and infected solitary bees
To determine Ctmax of healthy and infected individuals of each species, we employed a protocol modified from Ribeiro et al. (2012), using a hotplate with a programmable heating rate controlled by a computer interface (Sable Systems, North Las Vegas, NV, USA). The temperature was monitored by independent type K thermocouples connected to a HOBO® Onset® UX 120-014 M 4-channel data logger (Bourne, MA, USA). One thermocouple was attached to the surface of the hotplate, another sensor was attached inside a glass tube plugged by a cotton ball in which we placed an individual insect; this tube was placed in a water bath on the hot plate. This equipment was located inside an automated thermal chamber kept at 23°C (interior dimensions: width 40.5 cm × 35 cm length × 40 cm height). Each bee was transferred into the glass tube and exposed to gradual heating at a rate of 0.3°C min–1 until its locomotion stopped. Ctmax was recorded when the insect turned upside down. Bee behavior was constantly monitored, and when the insect turned upside down and could no longer return to the upright position within 5 s we removed it from the experiment and recorded the temperature at which righting response was lost as its Ctmax (Ribeiro et al., 2012). The insect was returned to a 15 mL Eppendorf with sucrose solution in cotton for recovery (n = 20 individuals per treatment). Data were only considered valid if the insect displayed normal activity 2 h after a Ctmax test.
Voluntary exposure by solitary bees to extreme thermal zones
To examine how voluntary exposure to ETZ was affected by EHE, pathogen infection, and the combination of both factors, we transferred 10 females from the mating cages to a black plastic bottle, then attached the bottle to a choice test arena following a modified protocol from Navas et al. (2022). This experimental arena allowed insects to freely move across zones with extreme temperatures (hot and cold) after which they have access to sterilized pollen moistened with sugar water (50%) (Navas et al., 2022). To reach the pollen, individuals had to cross either a hot or cold ETZ. The hot and cold extreme temperatures for each species were determined during preliminary Ctmax and lower limit of locomotion experiments for each species. The location of each insect was observed after 60 min and was classified as: “exploration” for individuals that left the initial black bottle but did not cross ETZs, and hot or cold ETZ “crossings.” The experiment was replicated ten times for each species and treatment condition (O. cornifrons: healthy, infected; O. lignaria: healthy, infected).
Pathogen growth and sub-culturing
Crithidia mellificae RS 3212 was cultured from frozen stock provided by Dr. Ryan Schwarz, and was maintained in Brain Heart Infusion (BHI) medium (37 g/L), supplemented with 0.3 g/L KCl, 3.5 μg/mL hemin and 2% (v/v) anti-contamination cocktail (Maser et al., 2002; Ravoet et al., 2015) pH 6.5 (Runckel et al., 2011) at 27°C (Engel and Parodi, 1985; Runckel et al., 2011). Parasites were maintained by subculture passage every 4 days (Runckel et al., 2011). The contents of the tubes were thawed and then centrifuged at 1,000 rpm for 10 min. After discarding the supernatant, the pellet was washed with 500 mL of fresh medium, centrifuged at 1,000 rpm for 10 min, and the supernatant was discarded. Each pellet was then re-suspended in a small amount of fresh medium and eventually transferred into a culture flask containing 5 mL of medium (Runckel et al., 2011).
Growth parameter determination after heat stress
To determine the growth rates of C. mellificae, pathogen inoculums were cultured at an initial concentration of 0.8 × 10⁶ parasites/mL and incubated at 27°C for 96 h, this temperature was identified as optimal based on preliminary results. Next, to assess pathogen ability to recover after thermal treatments, we exposed a subculture to heat stress by giving them three shocks with the Ctmax (heat shocks Ctmax/min–1 three times) of healthy solitary bees [O. cornifrons – O.c. = 43°C (n = 4 replicates), O. lignaria – O.l. = 39°C (n = 8 replicates)], Ctmax of solitary bees exposed to EHE [O.c. = 37°C (n = 4), O.l = 36°C (n = 8)], and Ctmax of infected solitary bees [O.c. = 35°C (n = 4), O.l = 32.5°C (n = 8)]. We did not assess the pathogen growth rate at the solitary bees’ Ctmax that corresponds to the combination of infection + EHE because Ctmax of both species was nearly the same (O.c. = 33.5°C and O.l = 32.03°C). To measure the effects of EHE we exposed the pathogen inoculums to the same thermal regime to which bees were exposed, increasing temperature at a rate 0.15°C min–1 until reaching 30 ± 1°C, constant temperature for 25 h (n = 8). As a control we measured the pathogen growth at the optimum temperature of 27°C (n = 4). Each treatment was replicated four times (n = 4) or eight times (n = 8). We then recorded the parasite density immediately after the heat shock (time zero) and every 24 h, parasite density was determined by absorbance at 600 nm. The growth rates (r) were calculated using the 24 h measurements and the equation , where r represents relative growth rate (h–1), OD t0 represents initial net OC of pathogen, OD t1 represents OD at the time of measurement (24 h), and △t is the time between the t0 and the measurement (Palmer-Young et al., 2018).
Data analysis
All data were tested for statistical test assumptions using a qqplot, Levene’s homogeneity test and the Shapiro–Wilk normality test at alpha = 0.05 significance level. For critical thermal limits (Ctmax) experiments, we conducted ANOVAs followed by post-hoc parametric multiple comparisons. For voluntary exposure to ETZs, we used a generalized linear model with treatment (healthy, infected, infected + EHE, and EHE) with Poisson distribution, followed by comparisons within each treatment group. For healthy insects, we used a t-test to compare crosses between hot or cold ETZs; for infected insects, we conducted ANOVAs for comparisons among 23°C, hot or cold ETZs. For the effects of temperature on C. mellificae growth rates, we conducted a general linear mixed model using package lme4 (Bates et al., 2009, 2014) with experiment round as a random effect. F-tests were used to evaluate significance of model terms (Bates et al., 2014), followed by pairwise comparisons “lsmeans” (Lenth and Lenth, 2018). Analyses were performed in the R programming environment (v. 3.4.3., CRAN project) (R Core Team, 2013).
Results
Upper temperature limit for locomotion (Ctmax)
Prior exposure to 1-day EHE reduced tolerance of O. cornifrons and O. lignaria by an average 5 and 3°C, respectively. The post-treatment average Ctmax of O. cornifrons was 42.5°C and O. lignaria was 38°C. Pathogen infection reduced heat tolerance of both solitary bee species by 8 and 6.5°C, and the combination of both stressors reduced heat tolerance by an average of 10 and 7°C, respectively (O. cornifrons: F = 113.95, DF: 3.74, P < 0.001; O. lignaria: F = 84.54, DF: 3.74, P ≤ 0.001: Figure 1). The Ctmax were similar in females exposed to infection or the combination of EHE + infection in both species.
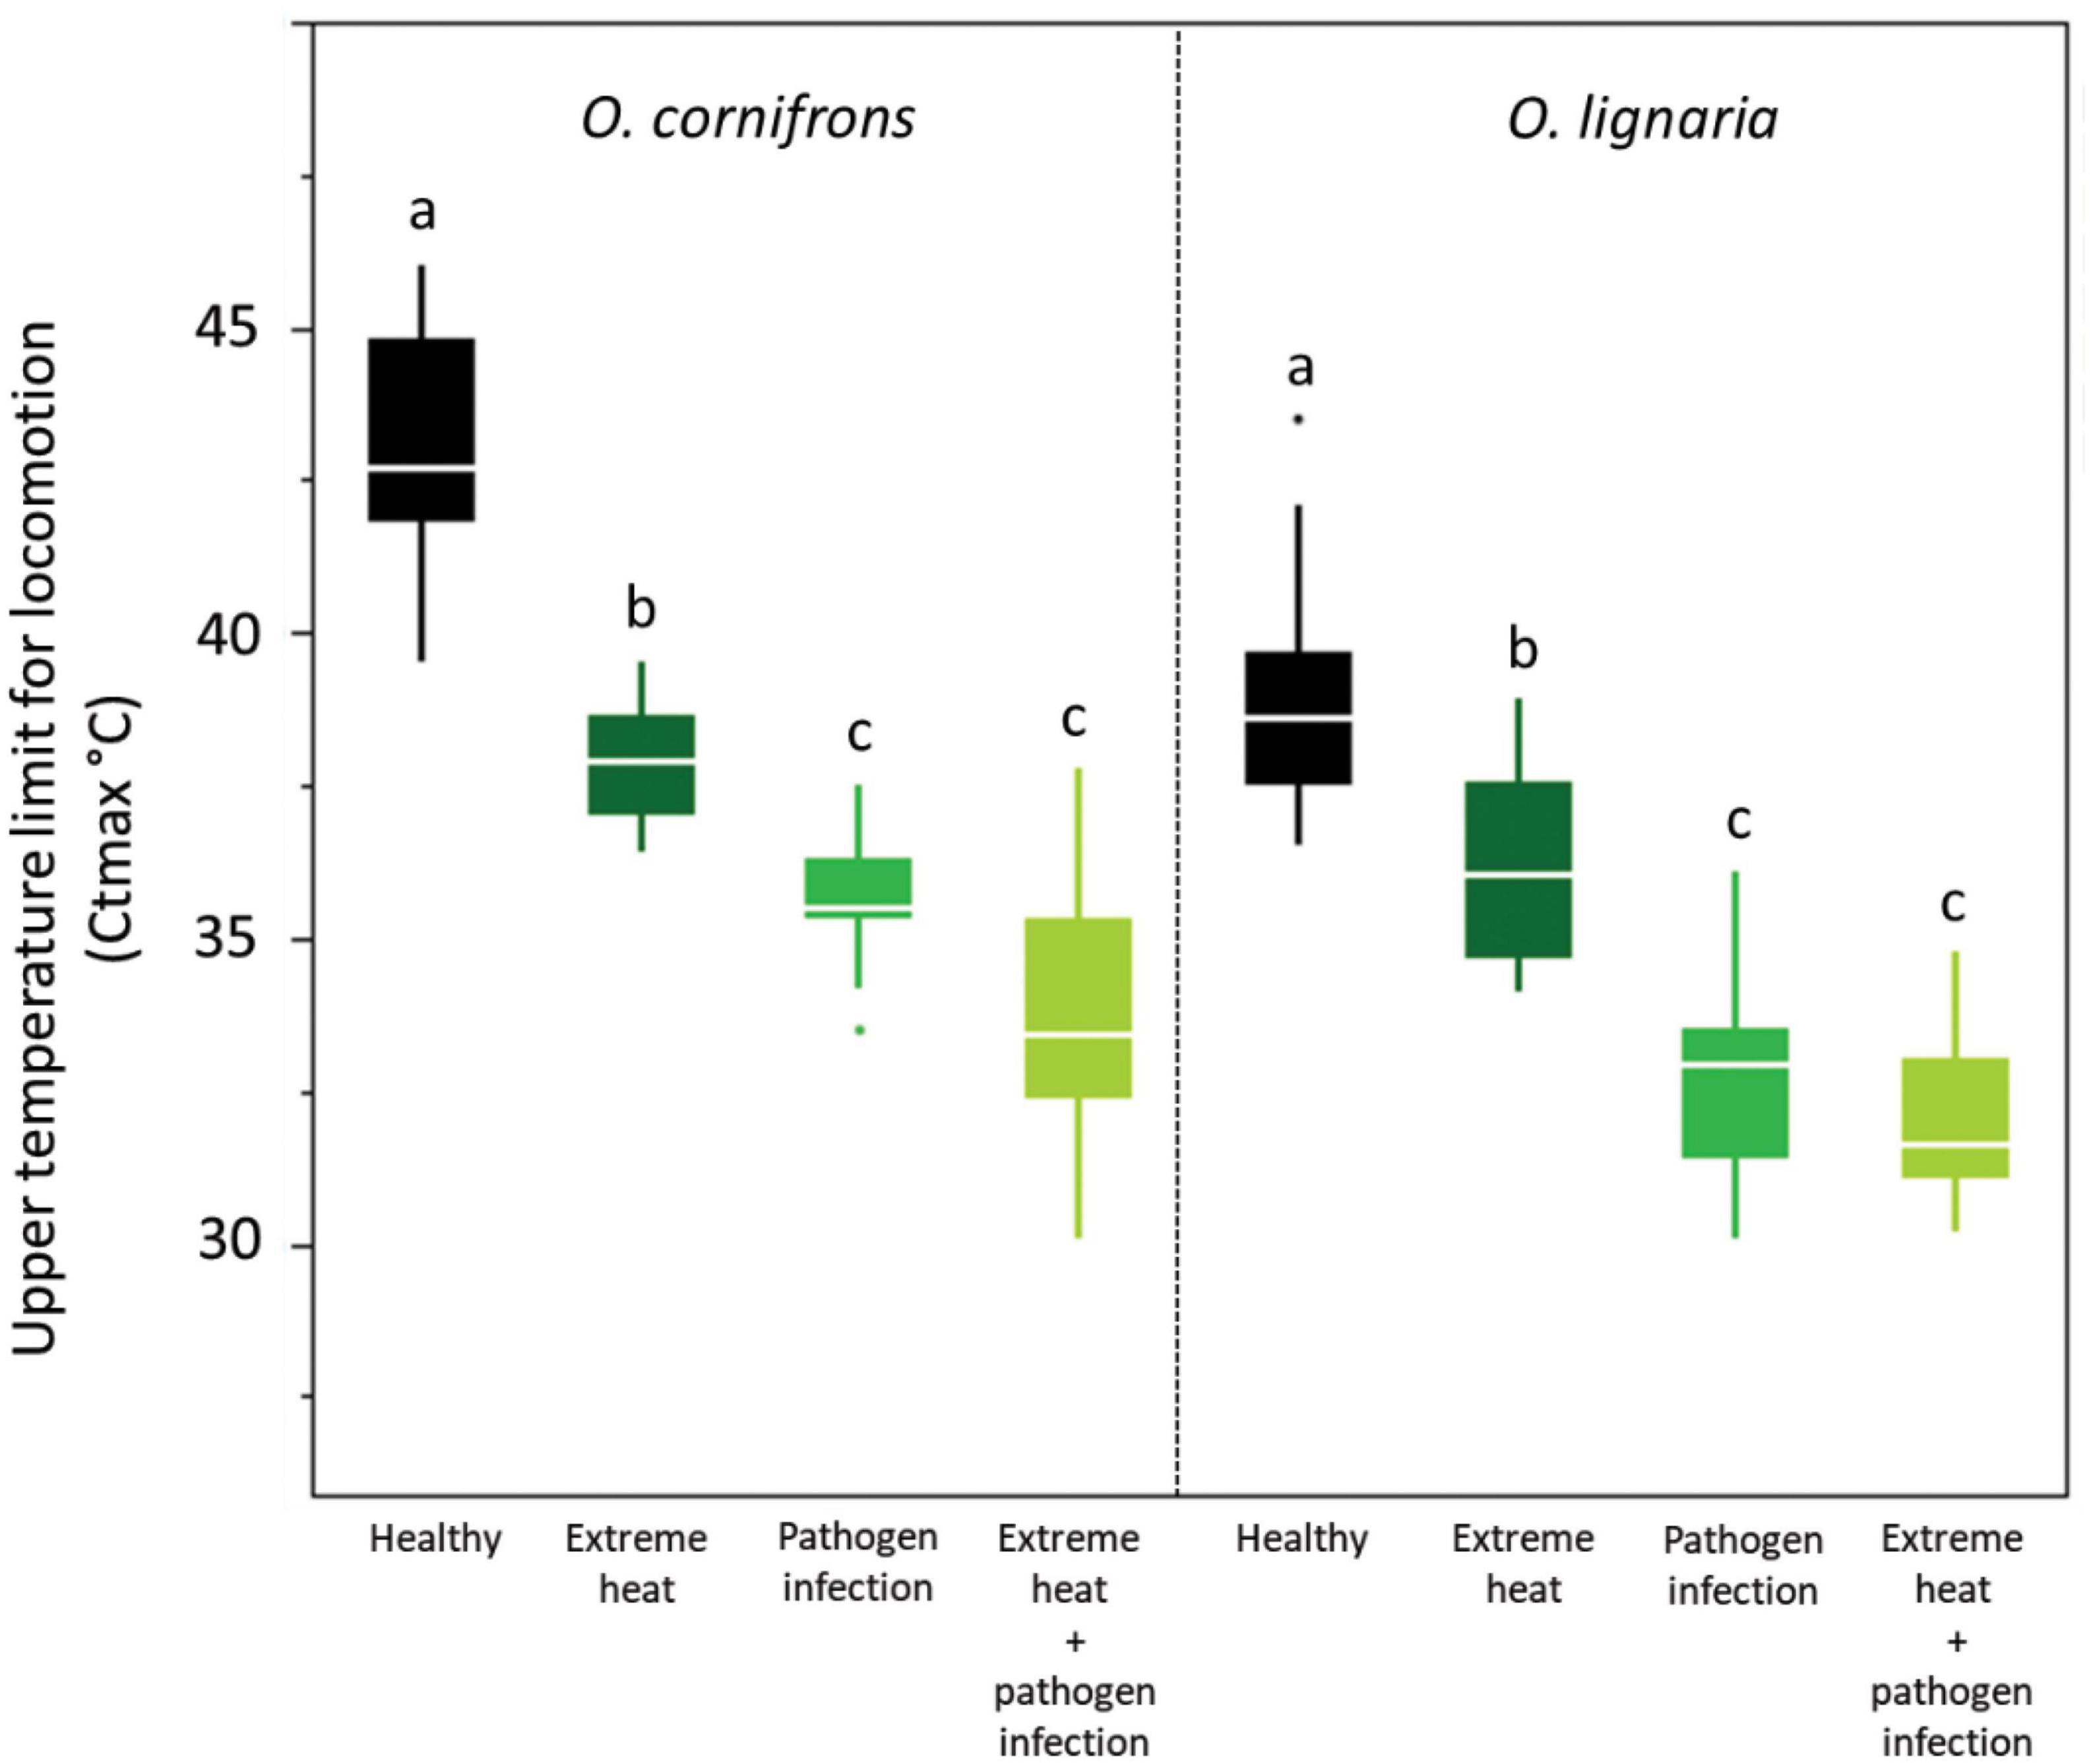
Figure 1. Upper temperature limit for locomotion [critical thermal maximum (Ctmax)] for Osmia cornifrons and O. lignaria exposed to extreme heat, pathogen infection, and the combination of extreme heat and pathogen infection. ANOVA [boxplots display median line, interquartile range (IQR) boxes, 1.5 × IQR whiskers; n = 20 females per treatment]. Lowercase letters represent pairwise comparisons among treatment.
Impacts of infection on voluntary transit across extreme thermal zones
Voluntary exposure to zones with extreme temperatures (ETZ), or thermal boldness, in both species was reduced by EHE, pathogen infection and the combination of both factors (Figures 2A, B). In healthy O. cornifrons, 67% of females crossed the hot ETZ. After 1-day EHE, the percentage of O. cornifrons females that crossed hot ETZ was reduced by 24 points, while the percentage of females that did not cross ETZ increased by 13 percentage points (from 26 to 39%). Pathogen infection reduced the percentage of crosses to hot ETZ by 28 percentage points (from 67 to 39%), and the crosses through cold ETZ increased by 7%. The combination of both factors reduced the percentage of individuals that crossed hot ETZ by 31 percentage points (from 67 to 36%); under this condition, we recorded the highest percentage of individuals that did not cross ETZs, which was equivalent to 52% (χ2 = 35.29, DF = 11.108; P ≤ 0.0001; Figure 2A; Table 1).
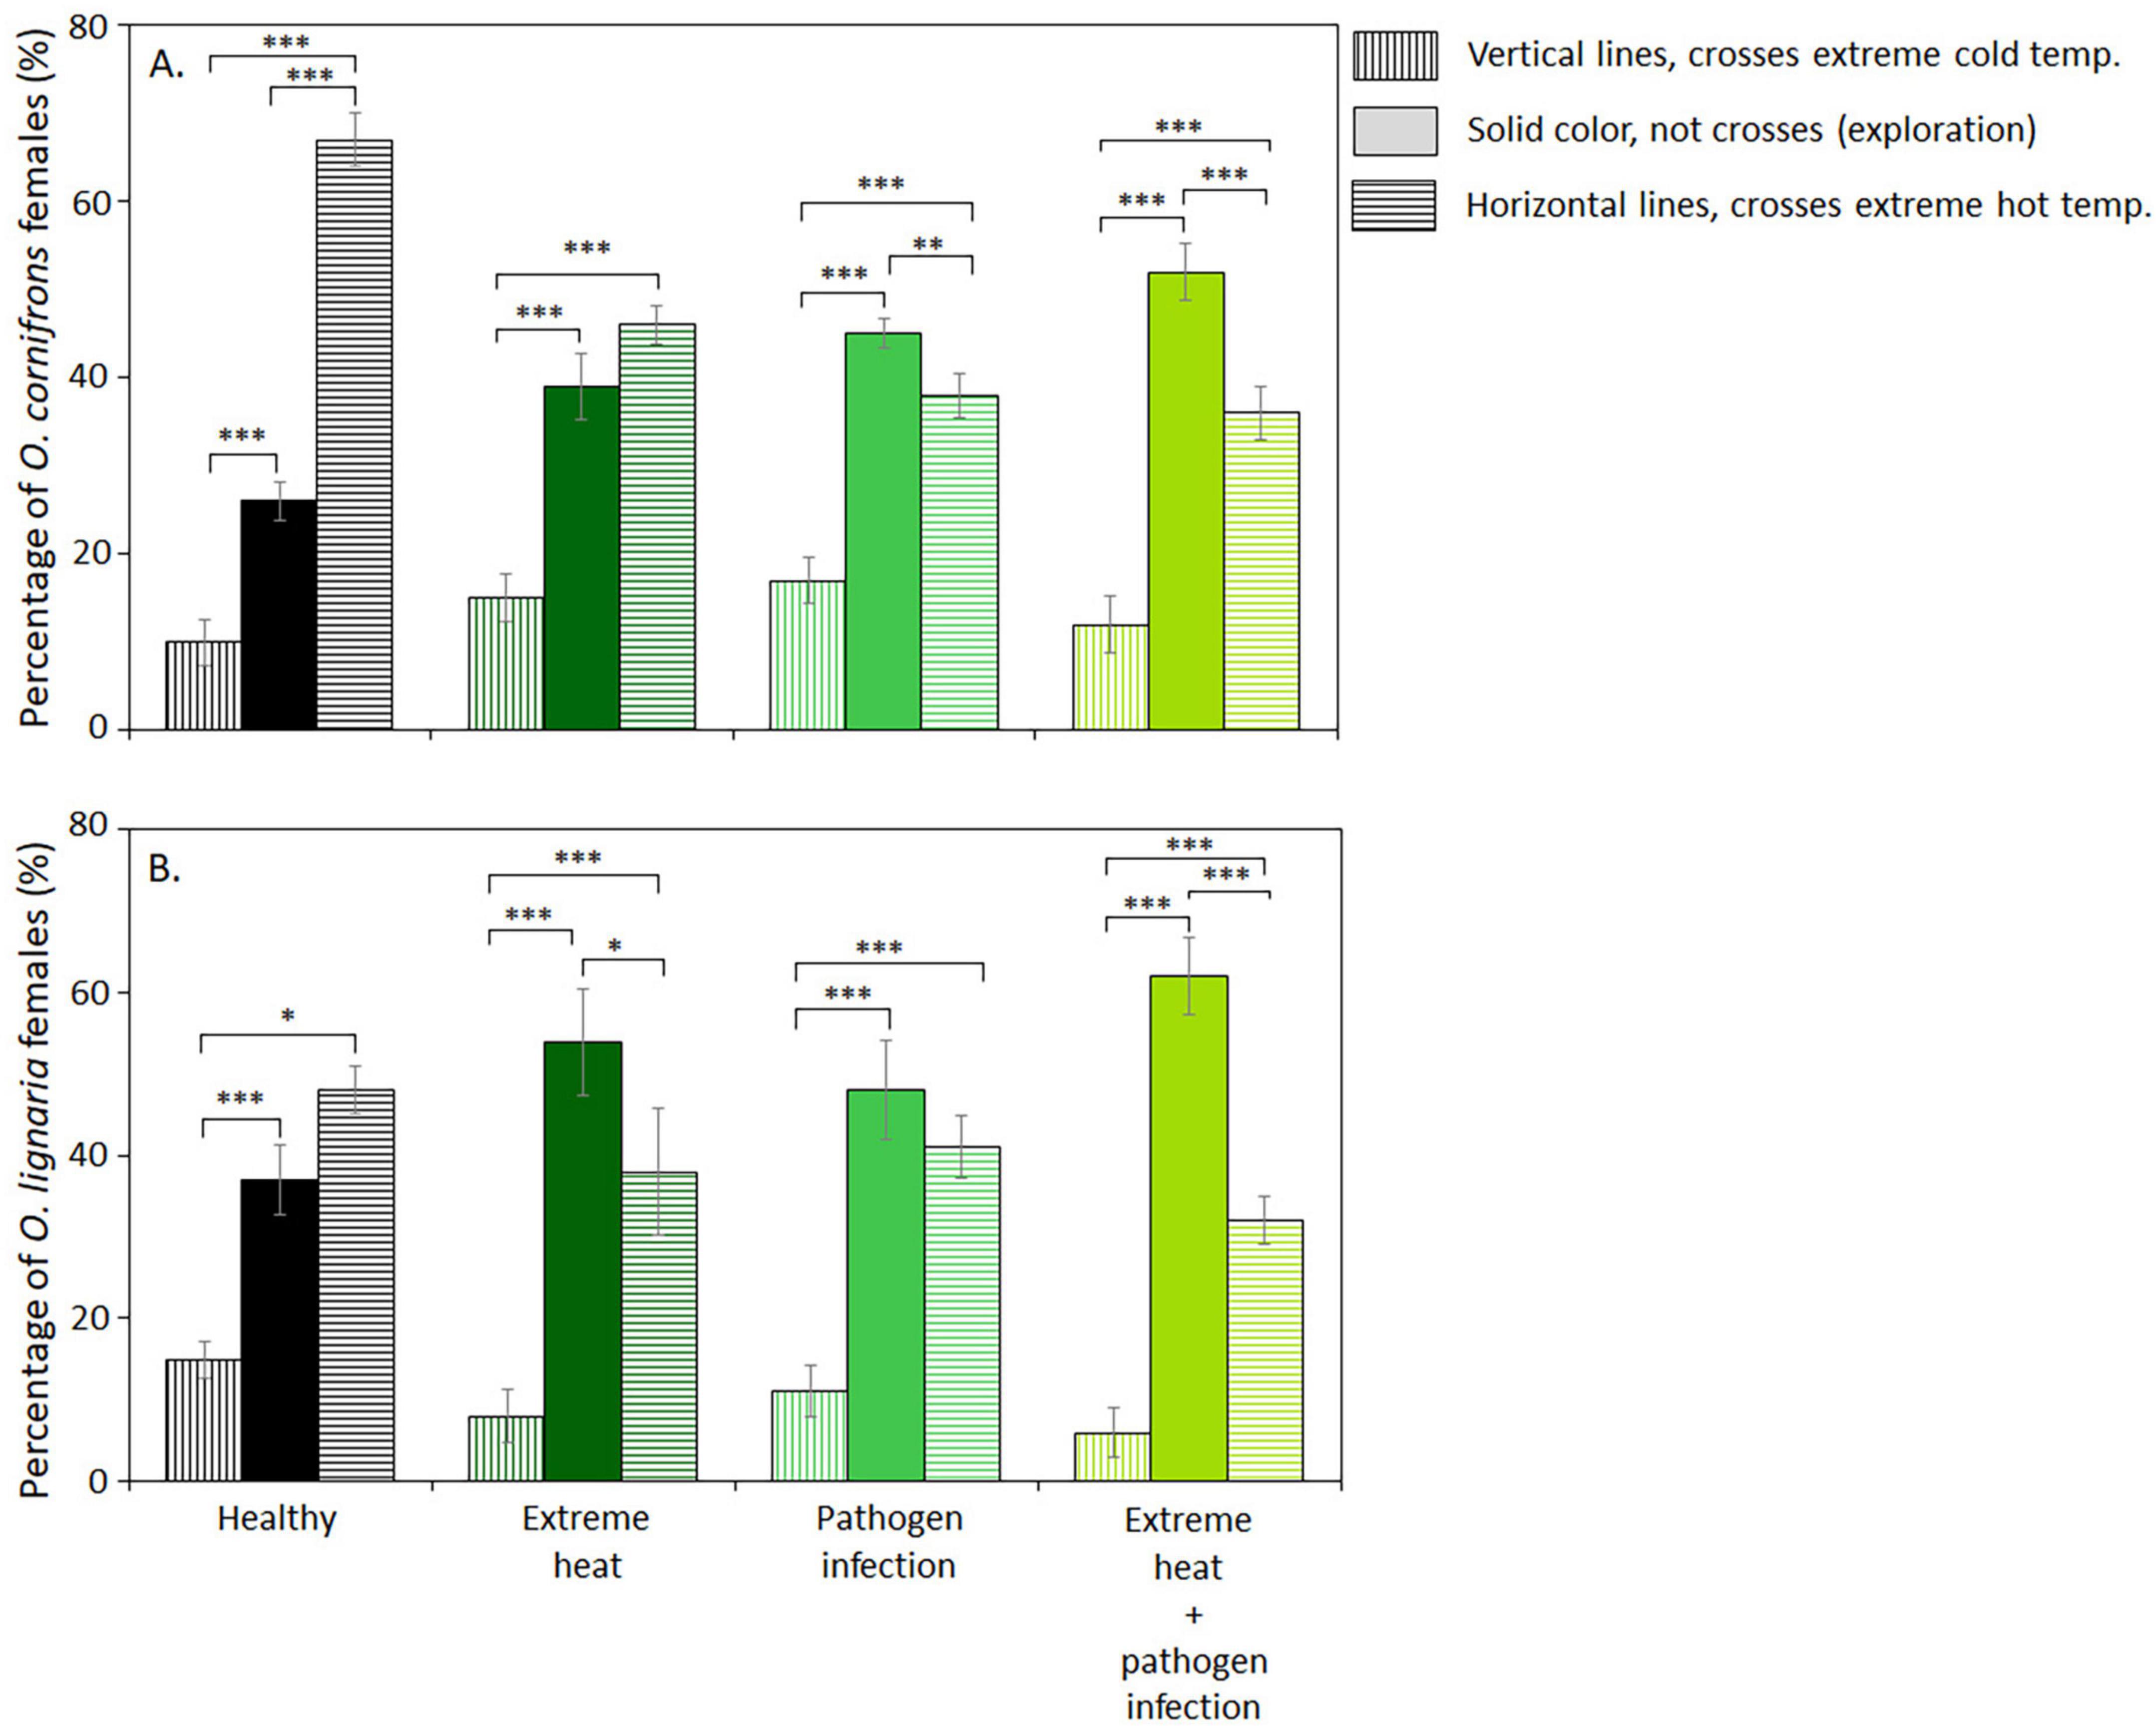
Figure 2. Thermal boldness of Osmia species exposed to extreme heat, pathogen infection, and the combination of both factors. The behavior was measured as the percentage of individuals in a sample that voluntarily crossed extreme thermal zones (ETZs, cold, or hot). (A) O. cornifrons. (B) O. lignaria. Warm and cold ETZs were set at 54°C and 13°C. Bars represent mean ± SE, *P ≤ 0.05, **P ≤ 0.001, ***P < 0.0001 differences within treatments (n = 10, 10 individuals per replicate, 100 individuals in total per treatment).
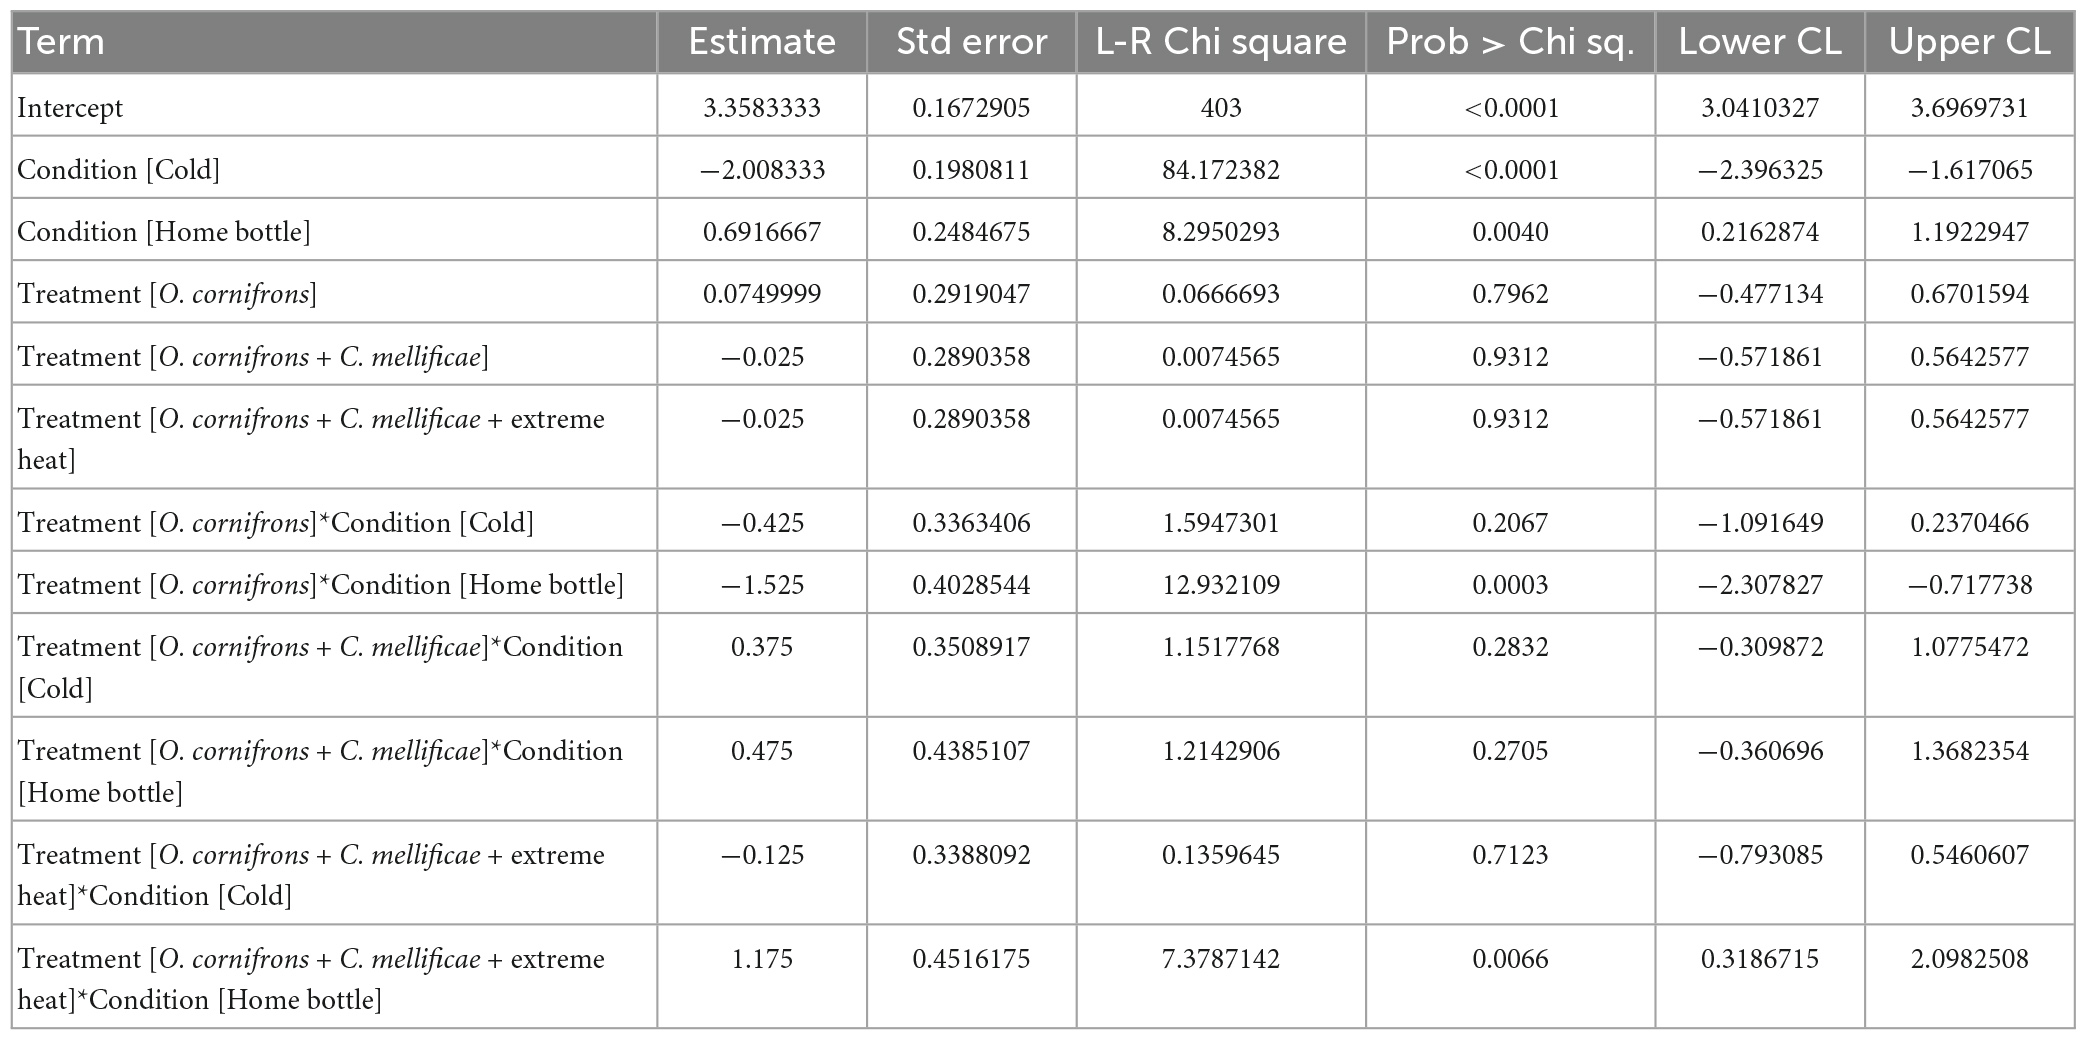
Table 1. Parameter estimates of analysis of deviance (type II) of an unbalanced model from experiments testing the effect EHE and infections on Osmia cornifrons voluntary exposure to hot or cold ETZ (Acc: 409.91).
In healthy O. lignaria, only 45% of females crossed hot ETZ. Extreme heat reduced crosses through hot ETZ by 10 percentage points (from 48 to 38%), and the individuals that did not cross either ETZ increased by 17%. Pathogen infection slightly reduced the crosses through hot and cold ETZ by 7 and 4%, respectively. The combination of extreme heat and pathogen infection increased the number of individuals that remain in the home bottle by 25 percentage points, and the crosses to hot and cold ETZ were reduced 9 percentage points (from 15 to 6%) and 16 percentage points (from 48 to 32 %), respectively (χ2 = 80.45, DF = 3.2; P ≤ 0.0001; Figure 2B; Table 2).
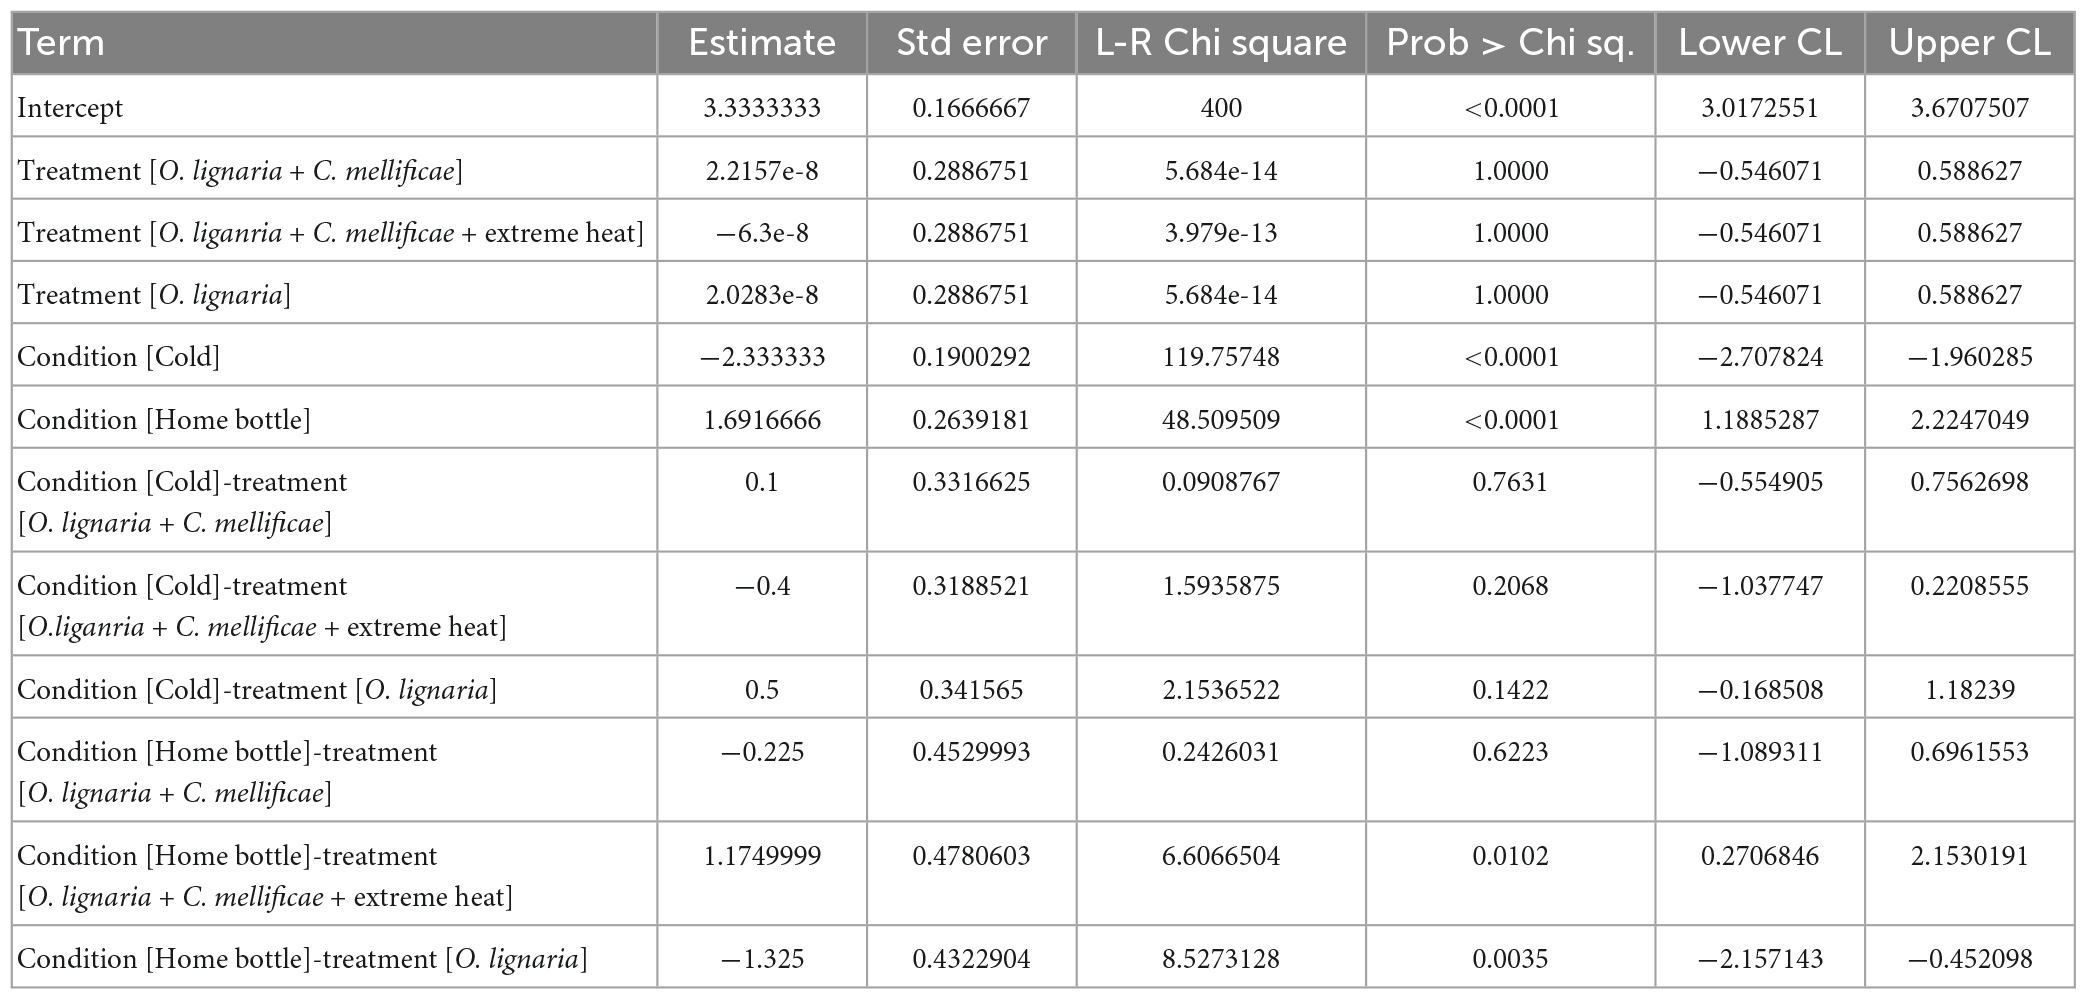
Table 2. Parameter estimates of analysis of deviance (type II) of an unbalanced model from experiments testing the effect EHE and infections on Osmia lignaria voluntary exposure to hot or cold ETZ (Acc: 436.66).
Pathogen growth rates
To examine whether thermal shocks altered pathogen growth rate, we conducted an unbalanced experiment with C. mellificae cells maintained inside temperature-controlled incubators. EHE induced the lowest growth rate for C. mellificae, followed by exposures at 43°C (Ctmax healthy O. cornifrons) and 39°C (Ctmax healthy O. lignaria). Pathogens exposed to the constant regime at 27°C had the highest growth rate as expected (χ2 = 44.245, DF = 55; P ≤ 0.0001; Table 3; Figure 3). Exposure to heat shock increased the lag phase and slowed the growth rate of stressed pathogens.
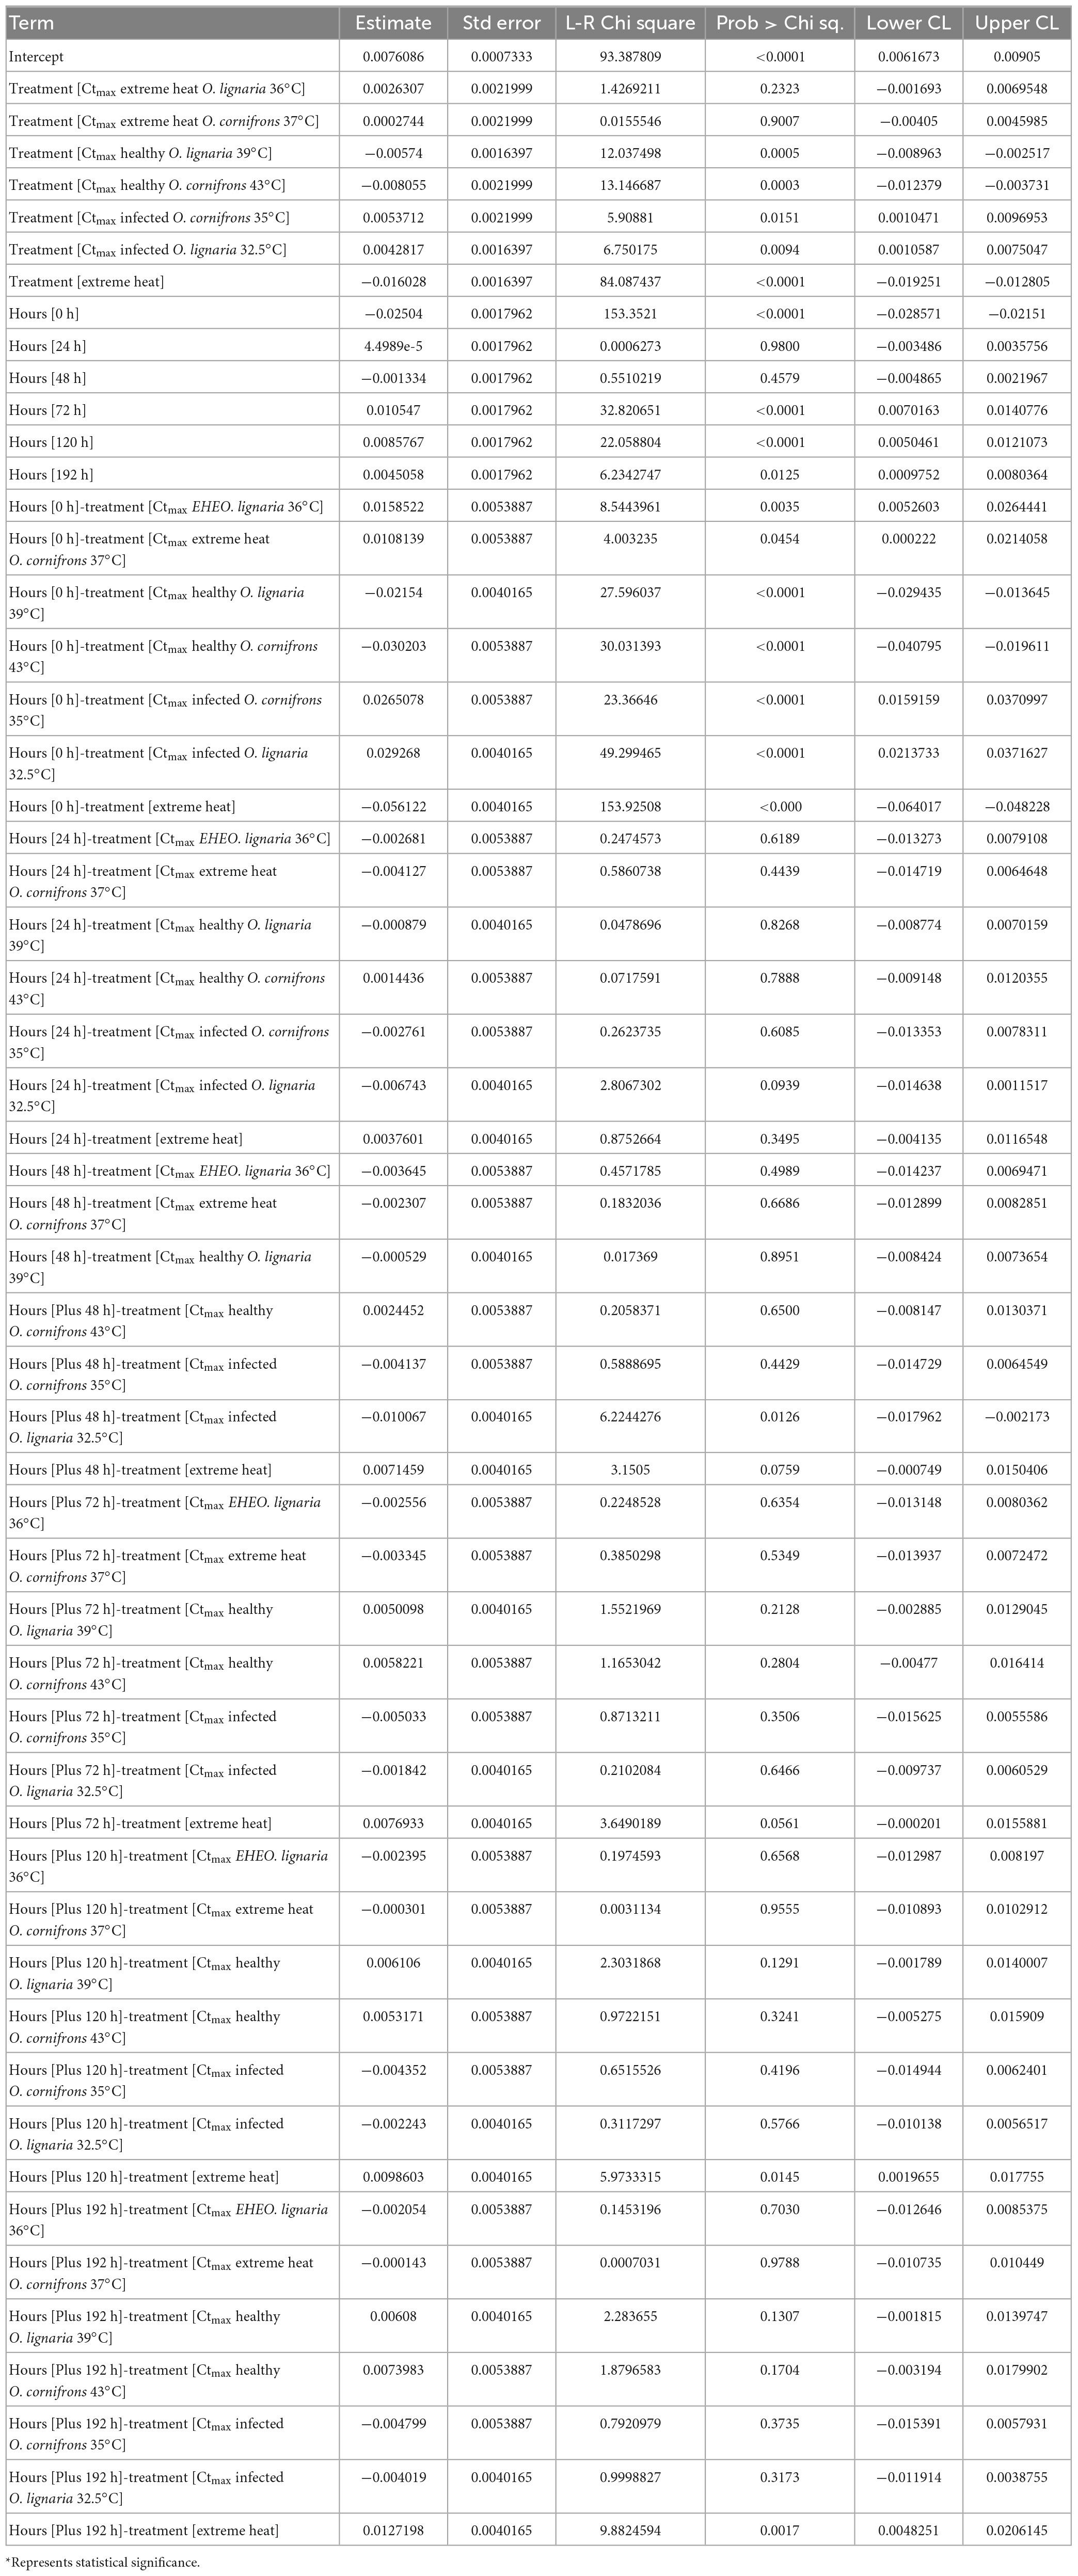
Table 3. Parameter estimates of analysis of deviance (type II) tables of unbalanced model from experiments testing the effect EHE and infections on Crithidia mellificae growth rate (Acc: 1844.17).
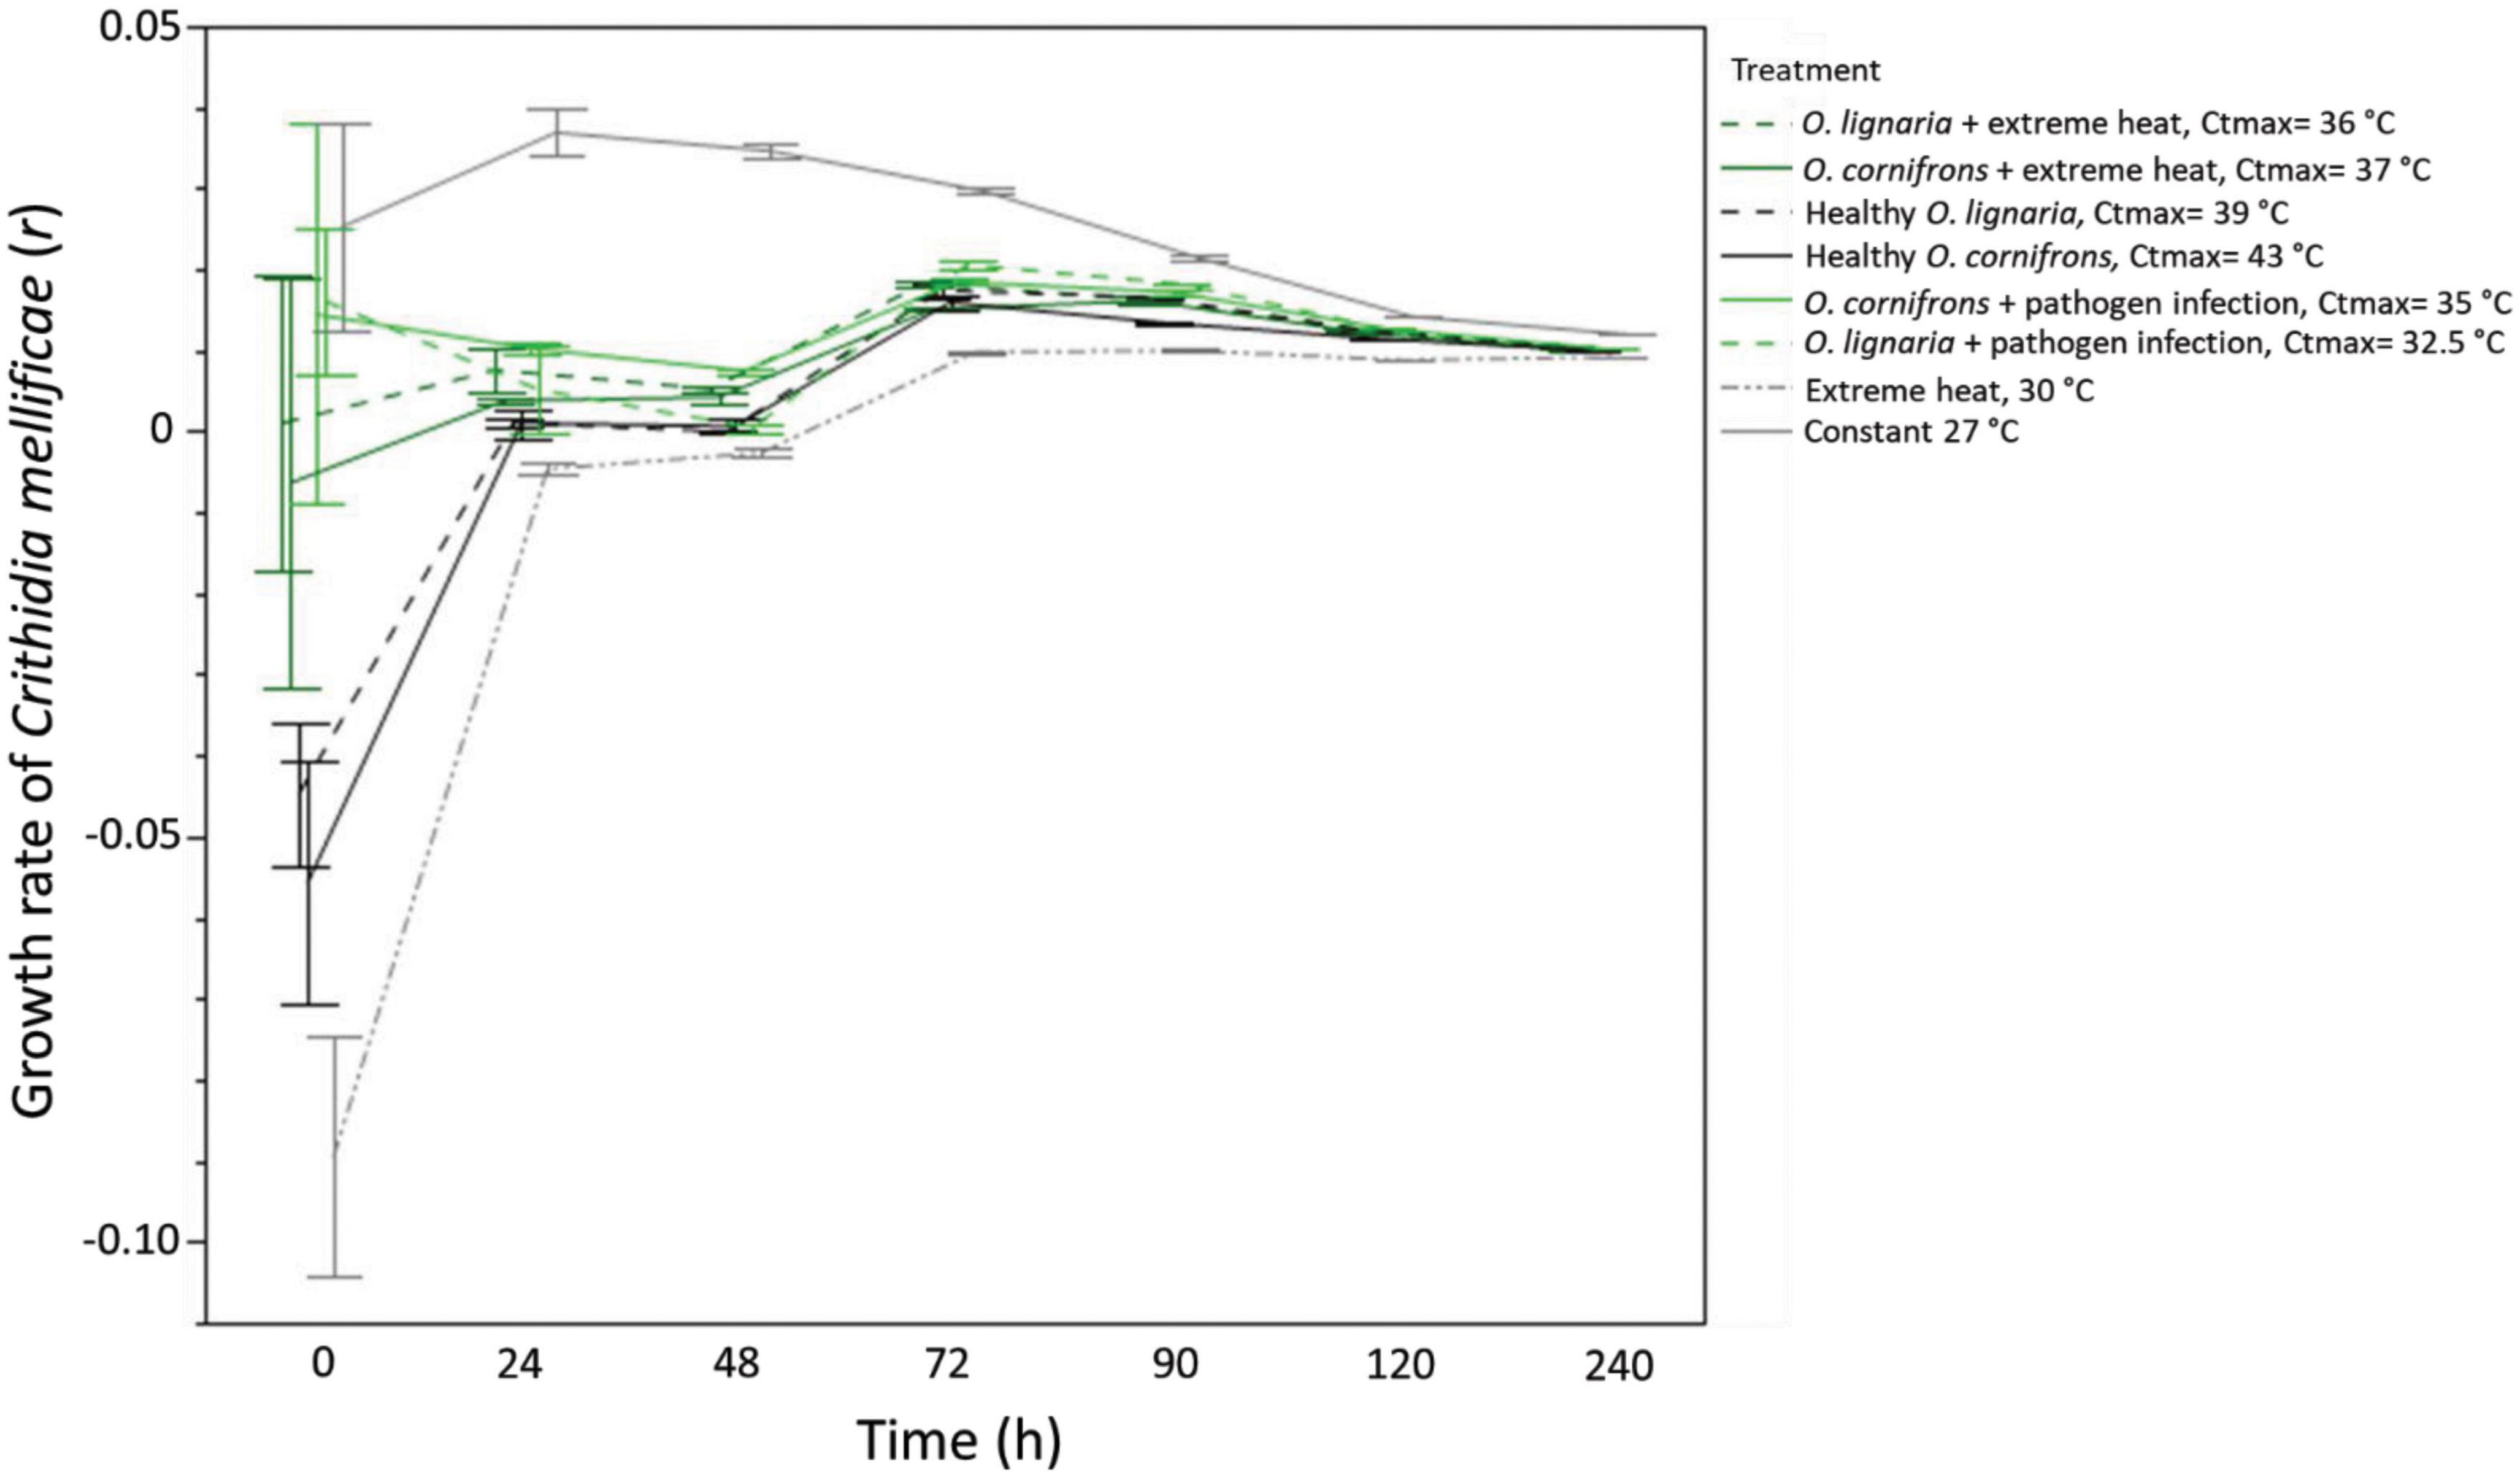
Figure 3. Crithidia mellificae growth rates after heat stress by Ctmax of Osmia species exposed to extreme heat, pathogen infection, the combination of both factors, as well as grown under extreme heat and optimal temperature (27°C). Growth rate was reduced after stress with Ctmax of healthy and exposed individual to extreme heat (mean ± SE per treatment per temperature; n = 8 replicates for O. lignaria Ctmax and n = 3 replicates for O. cornifrons per treatment).
Discussion
Exposure to a EHE reduces the heat tolerance of two solitary bee host species, Osmia cornifrons and O. lignaria, with analogous effects on its protozoan pathogen, C. mellificae. We also documented changes in the voluntary exposure to ET of both solitary bee species by EHE and infection, prior exposure to extreme heat and infection, as well as the combination. Moreover, C. mellificae mortality was also affected by the extreme heat at temperatures corresponding to the upper thermal limits for locomotion (Ctmax) of healthy bee hosts. Overall, these results suggest that EHE alters heat tolerance of both hosts and pathogen, resulting in shifts in physiological and behavioral responses.
Here we consider whether EHE and pathogen infection may drive changes in thermal tolerance and behavior of two pollinator species. We estimated that EHE could reduce tolerance (as measured by Ctmax) to heat by an average of 5°C in females of O. cornifrons and 3°C in O. lignaria. Pathogen infection further reduced the heat tolerance in both Osmia species. For instance, temperatures between 37 and 45°C are detrimental to O. cornifrons (White et al., 2009; McKinney et al., 2017) and O. lignaria development (Kemp and Bosch, 2005; Sgolastra et al., 2011; Kral, 2019). In Osmia species, warming has been shown to reduce fat content, body mass, and survival, while also altering phenology (CaraDonna et al., 2018). Complex physiological mechanisms underlie heat tolerance in both insects and protozoan pathogens, including heat shock protein synthesis and metabolic compensation. Across other host–pathogen systems, similar responses might be observed in different traits than heat tolerance (McClure et al., 2014; Porras et al., 2021; Breedveld et al., 2023), but such changes may be promoted by ecological rather than evolutionary processes. Exposure to stress can increase tolerance to a second stressor. For example, fungal infection increased fruit fly (Drosophila melanogaster) longevity (McClure et al., 2014). Heat tolerance can also be context dependent and vary locally among solitary bee populations, possibly affecting host–pathogen interactions.
Voluntary exposure to ETZ, thermal boldness, may result in physiological and behavioral adjustments that confer ecological advantages, such as increasing the opportunity to exploit food resources, escape from a predator, or increase survival (Dillon et al., 2012). The tendency to explore an ET results from thermal sensitivity of performance (via kinetic effects), thermal sensation and integration, and molecular and neural pathways being activated by such stimuli (Johnston and Bennett, 2008). Our results indicate that, despite being closely related, both bee species displayed species-specific thermal boldness behavior, where O. cornifrons was in general bolder than O. lignaria. These results agree with observations in other ectothermic animals (Myles-Gonzalez et al., 2015; Short and Lucky, 2018; Bensky and Bell, 2022). However, O. cornifrons was more sensitive to both EHE and infection than O. lignaria, which indicates that new thermal regimes and pathogens may limit its invasive success out of the native range. Thermal boldness of both species was compromised by protozoan infection as observed in another case where insects were infected by a fungal pathogen (Porras et al., 2021), and this effect was exacerbated by EHE. Thus, infectious diseases are predicted to become more severe for insects under climate warming.
Moreover, prior extreme heat exposure reduced the boldness in both solitary bees. Pathogen infection further reduced exploration behavior to cross the ETZ in both hosts species. This suggests that infection amplifies the sensitivity to heat in hosts. Similarly, in other ectotherm host–pathogen systems, infection and environmental temperature modify seasonality and prevalence of hosts (Estrada-Peña et al., 2012). Consequently, interactive stressors might drive ecological processes such a pathogen dispersal. But, the implications of these changes on either hosts or pathogens remain to be explored.
Heat exposures had adverse effects on the stationary and exponential phases of pathogen growth. The increased temperatures we evaluated reduced the C. mellificae growth rate for 48 h, which could be a result of energy depletion associated with the high energy demands during and after heat stress (Ketola et al., 2004). We observed an increased population growth rate of about 20% at 72 h after heat exposure (hosts’ Ctmax), but control cells had a 50% higher growth rate than heat stressed cells. EHE might affect disease severity through different mechanisms, such as altering pathogen physiology, development, and growth rate or some immune response on the part of the host. These changes will also be context dependent, given the new selective pressure that EHE may exert on host’s thermal tolerance. Future work could measure the impact of extreme heat on other traits, such as spore induction and survival of pathogens under host thermal constraints.
Overall, we conclude that EHE can reduce heat tolerance, thermal boldness of hosts, as well as pathogen growth rate. Further, EHE exacerbated the adverse effects of infection on hosts’ thermal physiology and behavior. At the same time, EHE had harmful effects on the pathogen growth rate, which also proved sensitive to brief exposures to hosts’ critical temperatures. Pathogen-induced thermal sensitivity of hosts has been considered a result of several factors, including temperature-dependent susceptibility of individuals, ultimately affecting feedback between host–pathogen interaction (Cohen et al., 2020). Our findings complement prior research showing climate change can alter host–pathogen systems and may influence the evolution and maintenance of species function within the ecosystems like plant pollination. The consequences of EHE may result in phenological asynchrony of host emergence, along with reductions in body mass and fat content and disruption of pathogen development (Bosch et al., 2008). Finally, we suggest that heat tolerance and thermal boldness of hosts may limit pathogen growth, but the ultimate consequences for disease dynamics shall depend on EHE effects on both hosts and pathogens. Thus, host–pathogen interactions may be very sensitive to climate warming, but more studies are necessary to predict disease outcomes and their effects on ecosystem functioning and services such as pollination.
Data availability statement
The original contributions presented in this study are included in the article/Supplementary material, further inquiries can be directed to the corresponding author.
Author contributions
MFP and CAN conceived the study. MFP and MGS-M conducted the experiments. MFP, EGR, CAN, and GAA-C wrote the first version of the manuscript. MFP, EGR, CAN, GAA-C, SGC, JGS, VL, and DB discussed the results and commented on the manuscript. All authors contributed to the article and approved the submitted version.
Acknowledgments
We thank Jay Evans for providing the pathogen inoculum, FLIR for providing an infra-red thermal camera. We are grateful for access to incubators, a walking growth chamber, and other equipment to Jason Rasgon, Kelli Hoover, Rayn Golas, and J. Gregory Ferry. We also thank Alexander Chautá, Tomás López, and reviewers for their valuable comments.
Conflict of interest
The authors declare that the research was conducted in the absence of any commercial or financial relationships that could be construed as a potential conflict of interest.
Publisher’s note
All claims expressed in this article are solely those of the authors and do not necessarily represent those of their affiliated organizations, or those of the publisher, the editors and the reviewers. Any product that may be evaluated in this article, or claim that may be made by its manufacturer, is not guaranteed or endorsed by the publisher.
Supplementary material
The Supplementary Material for this article can be found online at: https://www.frontiersin.org/articles/10.3389/fevo.2023.1186452/full#supplementary-material
Supplementary Figure 1 | Protozoan pathogens were grown under optimal conditions (27°C), harvested, and used to determine Ctmax by exposing them to different temperatures. The same cells were then used to assess recovery after heat stress by following the growth. Healthy and infected hosts were used to evaluate heat stress and behavior.
References
Adamo, S. A., and Lovett, M. M. (2011). Some like it hot: the effects of climate change on reproduction, immune function and disease resistance in the cricket Gryllus texensis. J. Exp. Biol. 214, 1997–2004. doi: 10.1242/jeb.056531
Adamo, S. A., Baker, J. L., Lovett, M. M., and Wilson, G. (2012). Climate change and temperate zone insects: the tyranny of thermodynamics meets the world of limited resources. Environ. Entomol. 41, 1644–1652. doi: 10.1603/EN11188
Bates, D., Mächler, M., Bolker, B., and Walker, S. (2014). Fitting linear mixed-effects models using lme4. arXiv [preprint] arXiv:1406.5823 doi: 10.18637/jss.v067.i01
Bates, D., Maechler, M., Bolker, B., Walker, S., Christensen, R. H. B., Singmann, H., et al. (2009). Package ‘lme4’. Available online at: http://lme4.r-forge.r-project.org (accessed February 2023).
Beetge, L., and Krüger, K. (2019). Drought and heat waves associated with climate change affect performance of the potato aphid Macrosiphum euphorbiae. Sci. Rep. 9:3645. doi: 10.1038/s41598-018-37493-8
Bensky, M. K., and Bell, A. M. (2022). A behavioral syndrome linking boldness and flexibility facilitates invasion success in sticklebacks. Am. Nat. 200, 846–856. doi: 10.1086/721765
Bosch, J., Sgolastra, F., and Kemp, W. P. (2008). “Life cycle ecophysiology of Osmia mason bees used as crop pollinators,” in Bee pollination in agricultural ecosystems, eds R. R. James and T. L. Pitts-Singer (Oxford, NY: Oxford University Press), 83–104. doi: 10.1093/acprof:oso/9780195316957.003.0006
Breedveld, M. C., Devigili, A., Borgheresi, O., and Gasparini, C. (2023). Reproducing in hot water: experimental heatwaves deteriorate multiple reproductive traits in a freshwater ectotherm. Funct. Ecol. 37, 989–1004. doi: 10.1111/1365-2435.14279
Brochu, C., Haimeur, A., and Ouellette, M. (2004). The heat shock protein HSP70 and heat shock cognate protein HSC70 contribute to antimony tolerance in the protozoan parasite Leishmania. Cell Stress Chaperones 9:294. doi: 10.1379/CSC-15R1.1
Buckley, L. B., and Huey, R. B. (2016). Temperature extremes: geographic patterns, recent changes, and implications for organismal vulnerabilities. Glob. Change Biol. 22, 3829–3842. doi: 10.1111/gcb.13313
Burge, C. A., and Hershberger, P. K. (2020). “Climate change can drive marine diseases,” in Marine disease ecology, eds D. C. Behringer, B. R. Sillman, and K. D. Lafferty (Oxford: Oxford University Press), 83–94. doi: 10.1093/oso/9780198821632.003.0005
Cairns, J. Jr., Lanza, G. R., and Parker, B. C. (1972). Pollution related structural and functional changes in aquatic communities with emphasis on freshwater algae and protozoa. Proc. Acad. Natl. Sci. Philadelphia 124, 79–127.
CaraDonna, P. J., Cunningham, J. L., and Iler, A. M. (2018). Experimental warming in the field delays phenology and reduces body mass, fat content and survival: Implications for the persistence of a pollinator under climate change. Funct. Ecol. 32, 2345–2356. doi: 10.1111/1365-2435.13151
Cohen, H., McFrederick, Q. S., and Philpott, S. M. (2020). Environment shapes the microbiome of the blue orchard bee, Osmia lignaria. Microb. Ecol. 80, 897–907. doi: 10.1007/s00248-020-01549-y
Dillon, M. E., Liu, R., Wang, G., and Huey, R. B. (2012). Disentangling thermal preference and the thermal dependence of movement in ectotherms. J. Therm. Biol. 37, 631–639. doi: 10.1016/j.jtherbio.2012.07.004
Dudney, J., Willing, C. E., Das, A. J., Latimer, A. M., Nesmith, J. C., and Battles, J. J. (2021). Nonlinear shifts in infectious rust disease due to climate change. Nat. Commun. 12:5102. doi: 10.1038/s41467-021-25182-6
Dunbar, H. E., Wilson, A. C., Ferguson, N. R., and Moran, N. A. (2007). Aphid thermal tolerance is governed by a point mutation in bacterial symbionts. PLoS Biol. 5:e96. doi: 10.1371/journal.pbio.0050096
Echavez, F. L. C., and Leal, J. C. M. (2021). Ecotoxicological effect of heavy metals in free-living ciliate protozoa of Lake Maracaibo, Venezuela. J. Water Land Dev. 51, 102–116.
Elliot, S. L., Blanford, S., and Thomas, M. B. (2002). Host–pathogen interactions in a varying environment: temperature, behavioural fever and fitness. Proc. R. Soc. Lond. Ser. B Biol. Sci. 269, 1599–1607. doi: 10.1098/rspb.2002.2067
Engel, J. C., and Parodi, A. J. (1985). Trypanosoma cruzi cells undergo an alteration in protein N-glycosylation upon differentiation. J. Biol. Chem. 260, 10105–10110. doi: 10.1016/S0021-9258(17)39219-0
Estrada-Peña, A., Ayllón, N., and De La Fuente, J. (2012). Impact of climate trends on tick-borne pathogen transmission. Front. Physiol. 3:64. doi: 10.3389/fphys.2012.00064
Glahn, H. R., and Ruth, D. P. (2003). The new digital forecast database of the National Weather Service. Bull. Am. Meteorol. Soc. 84, 195–202. doi: 10.1175/BAMS-84-2-195
Gómez-Moracho, T., Buendía-Abad, M., Benito, M., García-Palencia, P., Barrios, L., Bartolomé, C., et al. (2020). Experimental evidence of harmful effects of Crithidia mellificae and Lotmaria passim on honey bees. Int. J. Parasitol. 50, 1117–1124. doi: 10.1016/j.ijpara.2020.06.009
González-Tokman, D., Gil-Pérez, Y., Servín-Pastor, M., Alvarado, F., Escobar, F., Baena-Díaz, F., et al. (2021). Effect of chemical pollution and parasitism on heat tolerance in dung beetles (Coleoptera: Scarabaeinae). J. Econ. Entomol. 114, 462–467. doi: 10.1093/jee/toaa216
Hamad, S. H. (2012). “Factors affecting the growth of microorganisms in food,” in Progress in food preservation, eds R. Bhat, A. K. Alias, and G. Paliyath (Hoboken, NJ: Wiley-Blackwell), 405–427. doi: 10.1002/9781119962045.ch20
Hector, T., Gehman, A.-L., and King, K. (2023). Infection burdens and virulence under heat stress: ecological and evolutionary considerations. Philos. Trans. R. Soc. B 378:20220018. doi: 10.1098/rstb.2022.0018
Hochachka, P. W., and Somero, G. N. (2002). Biochemical adaptation: Mechanism and process in physiological evolution. New York, NY: Oxford University Press.
Hubert, J., Bicianova, M., Ledvinka, O., Kamler, M., Lester, P. J., Nesvorna, M., et al. (2017). Changes in the bacteriome of honey bees associated with the parasite Varroa destructor, and pathogens Nosema and Lotmaria passim. Microb. Ecol. 73, 685–698. doi: 10.1007/s00248-016-0869-7
Huey, R. B., Hertz, P. E., and Sinervo, B. (2003). Behavioral drive versus behavioral inertia in evolution: A null model approach. Am. Nat. 161, 357–366. doi: 10.1086/346135
Hutchison, V. (1976). Factors influencing thermal tolerances of individual organisms. Proc. Therm. Ecol. 8, 10–26.
Hutchison, V. H., and Maness, J. D. (1979). The role of behavior in temperature acclimation and tolerance in ectotherms. Am. zool. 19, 367–384.
Johnston, I. A., and Bennett, A. F. (2008). Animals and temperature: phenotypic and evolutionary adaptation. Cambridge: Cambridge University Press.
Kemp, W., and Bosch, J. (2005). Effect of temperature on Osmia lignaria (Hymenoptera: Megachilidae) prepupa–adult development, survival, and emergence. J. Econ. Entomol. 98, 1917–1923. doi: 10.1093/jee/98.6.1917
Ketola, T., Laakso, J., Kaitala, V., and Airaksinen, S. (2004). Evolution of Hsp90 expression in Tetrahymena thermophila (Protozoa, Ciliata) populations exposed to thermally variable environments. Evolution 58, 741–748. doi: 10.1111/j.0014-3820.2004.tb00407.x
Kral, L. (2019). Cold tolerance, temperature mediated discontinuous gas exchange, and emergence of the blue orchard mason bee (Osmia lignaria). Master’s theses. Ellensburg, WA: Central Washington University.
Krebs, R., and Loeschcke, V. (1994). Costs and benefits of activation of the heat-shock response in Drosophila melanogaster. Funct. Ecol. 8, 730–737. doi: 10.2307/2390232
Langridge, D., and McGhee, R. B. (1967). Crithidia mellificae n. sp. an acidophilic trypanosomatid of the honey bee Apis mellifera. J. Protozool. 14, 485–487. doi: 10.1111/j.1550-7408.1967.tb02033.x
Maser, P., Grether-Buhler, Y., Kaminsky, R., and Brun, R. (2002). An anti-contamination cocktail for the in vitro isolation and cultivation of parasitic protozoa. Parasitol. Res. 88, 172–174. doi: 10.1007/s00436-001-0511-5
Masson-Delmotte, V., Zhai, P., Pirani, A., Connors, S. L., Péan, C., Berger, S., et al. (2021). Climate change 2021: The physical science basis. Contribution of working group I to the sixth assessment report of the intergovernmental panel on climate change. Cambridge: Cambridge University Press, p. 2391. doi: 10.1017/9781009157896.014
McClure, C. D., Zhong, W., Hunt, V. L., Chapman, F. M., Hill, F. V., and Priest, N. K. (2014). Hormesis results in trade-offs with immunity. Evolution 68, 2225–2233. doi: 10.1111/evo.12453
McEvoy, D. J., and Hatchett, B. J. (2023). Spring heat waves drive record western United States snow melt in 2021. Environ. Res. Lett. 18:014007. doi: 10.1088/1748-9326/aca8bd
McKinney, M., Ahn, J. J., and Park, Y.-L. (2017). Thermal biology of Osmia cornifrons (Hymenoptera: Megachilidae) eggs and larvae. J. Apic. Res. 56, 421–429. doi: 10.1080/00218839.2017.1327935
Myles-Gonzalez, E., Burness, G., Yavno, S., Rooke, A., and Fox, M. G. (2015). To boldly go where no goby has gone before: boldness, dispersal tendency, and metabolism at the invasion front. Behav. Ecol. 26, 1083–1090. doi: 10.1093/beheco/arv050
Navas, C. A., Agudelo-Cantero, G. A., and Loeschcke, V. (2022). Thermal boldness: Volunteer exploration of extreme temperatures in fruit flies. J. Insect Physiol. 136:104330. doi: 10.1016/j.jinsphys.2021.104330
Ngor, L., Palmer-Young, E. C., Nevarez, R. B., Russell, K. A., Leger, L., Giacomini, S. J., et al. (2020). Cross-infectivity of honey and bumble bee-associated parasites across three bee families. Parasitology 147, 1290–1304. doi: 10.1017/S0031182020001018
Nowakowski, A. J., Whitfield, S. M., Eskew, E. A., Thompson, M. E., Rose, J. P., Caraballo, B. L., et al. (2016). Infection risk decreases with increasing mismatch in host and pathogen environmental tolerances. Ecol. Lett. 19, 1051–1061. doi: 10.1111/ele.12641
Padfield, D., Castledine, M., and Buckling, A. (2020). Temperature-dependent changes to host–parasite interactions alter the thermal performance of a bacterial host. ISME J. 14, 389–398. doi: 10.1038/s41396-019-0526-5
Palmer-Young, E. C., Raffel, T. R., and McFrederick, Q. S. (2018). Temperature-mediated inhibition of a bumblebee parasite by an intestinal symbiont. Proc. R. Soc. B 285:20182041. doi: 10.1098/rspb.2018.2041
Paudel, S., Lin, P.-A., Hoover, K., Felton, G. W., and Rajotte, E. G. (2020). Asymmetric responses to climate change: temperature differentially alters herbivore salivary elicitor and host plant responses to herbivory. J. Chem. Ecol. 46, 891–905. doi: 10.1007/s10886-020-01201-6
Porras, M. F., Agudelo-Cantero, G. A., Santiago, G., Navas, C. A., Loeschcke, V., Sørensen, J. G., et al. (2021). Fungal infections lead to shifts in thermal tolerance and voluntary exposure to extreme temperatures in both prey and predator insects. Sci. Rep. 11:21710. doi: 10.1038/s41598-021-00248-z
Porras, M. F., Navas, C. A., Marden, J. H., Mescher, M. C., De Moraes, C. M., Pincebourde, S., et al. (2020). Enhanced heat tolerance of viral-infected aphids leads to niche expansion and reduced interspecific competition. Nat. Commun. 11:1184. doi: 10.1038/s41467-020-14953-2
Poulin, R., and Randhawa, H. S. (2015). Evolution of parasitism along convergent lines: from ecology to genomics. Parasitology 142, S6–S15. doi: 10.1017/S0031182013001674
Przybyla, K., Michez, D., Zambra, E., Anselmo, A., Hennebert, E., Rasmont, P., et al. (2021). Effects of heat stress on mating behavior and colony development in Bombus terrestris (Hymenoptera: Apidae). Front. Ecol. Evol. 9:748405. doi: 10.3389/fevo.2021.748405
R Core Team (2013). R: A language and environment for statistical computing. Vienna: R Foundation for Statistical Computing.
Ravoet, J., Schwarz, R. S., Descamps, T., Yañez, O., Tozkar, C. O., Martin-Hernandez, R., et al. (2015). Differential diagnosis of the honey bee trypanosomatids Crithidia mellificae and Lotmaria passim. J. Invertebr. Pathol. 130, 21–27. doi: 10.1016/j.jip.2015.06.007
Ribeiro, P. L., Camacho, A., and Navas, C. A. (2012). Considerations for assessing maximum critical temperatures in small ectothermic animals: insights from leaf-cutting ants. PLoS One 7:e32083. doi: 10.1371/journal.pone.0032083
Rodrigues, Y. K., and Beldade, P. (2020). Thermal plasticity in insects’ response to climate change and to multifactorial environments. Front. Ecol. Evol. 8:271. doi: 10.3389/fevo.2020.00271
Rohr, J. R., Civitello, D. J., Cohen, J. M., Roznik, E. A., Sinervo, B., and Dell, A. I. (2018). The complex drivers of thermal acclimation and breadth in ectotherms. Ecol. Lett. 21, 1425–1439. doi: 10.1111/ele.13107
Runckel, C., Flenniken, M. L., Engel, J. C., Ruby, J. G., Ganem, D., Andino, R., et al. (2011). Temporal analysis of the honey bee microbiome reveals four novel viruses and seasonal prevalence of known viruses, Nosema, and Crithidia. PLoS One 6:e20656. doi: 10.1371/journal.pone.0020656
Sánchez, C. A. I, Ragonese, G., de Roode, J. C., and Altizer, S. (2021). Thermal tolerance and environmental persistence of a protozoan parasite in monarch butterflies. J. Invertebr. Pathol. 183, 107544. doi: 10.1016/j.jip.2021.107544
Schwarz, R. S., Bauchan, G. R., Murphy, C. A., Ravoet, J., de Graaf, D. C., and Evans, J. D. (2015). Characterization of two species of trypanosomatidae from the honey bee Apis mellifera: Crithidia mellificae Langridge and McGhee, and Lotmaria passim n. gen., n. sp. J. Eukaryot. Microbiol. 62, 567–583. doi: 10.1111/jeu.12209
Schwarz, R. S., and Evans, J. D. (2013). Single and mixed-species trypanosome and microsporidia infections elicit distinct, ephemeral cellular and humoral immune responses in honey bees. Dev. Com. Immunol. 40, 300–310. doi: 10.1016/j.dci.2013.03.010
Sgolastra, F., Kemp, W. P., Buckner, J. S., Pitts-Singer, T. L., Maini, S., and Bosch, J. (2011). The long summer: pre-wintering temperatures affect metabolic expenditure and winter survival in a solitary bee. J. Insect Physiol. 57, 1651–1659. doi: 10.1016/j.jinsphys.2011.08.017
Short, C. A., and Lucky, A. (2018). Pure gold-green sweat bee Augochlora pura (Say 1837) (Insecta: Hymenoptera: Halictidae: Halictinae): EENY715/IN1225, 9/2018. EDIS 2018. Available online at: https://journals.flvc.org/edis/article/view/106863 (accessed May 23, 2023). doi: 10.32473/edis-in1225-2018
Sinclair, B. J., Marshall, K. E., Sewell, M. A., Levesque, D. L., Willett, C. S., Slotsbo, S., et al. (2016). Can we predict ectotherm responses to climate change using thermal performance curves and body temperatures? Ecol. Lett. 19, 1372–1385. doi: 10.1111/ele.12686
Sinclair, B. J., Williams, C. M., and Terblanche, J. S. (2012). Variation in thermal performance among insect populations. Physiol. Biochem. Zool. 85, 594–606. doi: 10.1086/665388
Strobl, V., Yañez, O., Straub, L., Albrecht, M., and Neumann, P. (2019). Trypanosomatid parasites infecting managed honeybees and wild solitary bees. Int. J. Parasitol. 49, 605–613. doi: 10.1016/j.ijpara.2019.03.006
Thomas, M. B., and Blanford, S. (2003). Thermal biology in insect-parasite interactions. Trends Ecol. Evol. 18, 344–350. doi: 10.1016/S0169-5347(03)00069-7
Von Bülow, J., and Beitz, E. (2015). Number and regulation of protozoan aquaporins reflect environmental complexity. Biol. Bull. 229, 38–46. doi: 10.1086/BBLv229n1p38
White, J., Son, Y., and Park, Y.-L. (2009). Temperature-dependent emergence of Osmia cornifrons (Hymenoptera: Megachilidae) adults. J. Econ. Entomol. 102, 2026–2032. doi: 10.1603/029.102.0602
Williams, C. M., Buckley, L. B., Sheldon, K. S., Vickers, M., Pörtner, H.-O., Dowd, W. W., et al. (2016). Biological impacts of thermal extremes: mechanisms and costs of functional responses matter. Integr. Comp. Biol. 56, 73–84. doi: 10.1093/icb/icw013
Williams, M. K. F., Tripodi, A. D., and Szalanski, A. L. (2019). Molecular survey for the honey bee (Apis mellifera L.) trypanosome parasites Crithidia mellificae and Lotmaria passim. J. Apic. Res. 58, 553–558. doi: 10.1080/00218839.2019.1568956
Keywords: extreme environments, pollinators, stress response, heat tolerance, infection, thermal stress, protozoan infection
Citation: Porras MF, Navas CA, Agudelo-Cantero GA, Santiago-Martínez MG, Loeschcke V, Sørensen JG, Crandall SG, Biddinger D and Rajotte EG (2023) Extreme heat alters the performance of hosts and pathogen. Front. Ecol. Evol. 11:1186452. doi: 10.3389/fevo.2023.1186452
Received: 14 March 2023; Accepted: 22 May 2023;
Published: 09 June 2023.
Edited by:
Adrienne M. S. Correa, Rice University, United StatesReviewed by:
Francesco Ricci, The University of Melbourne, AustraliaGang Ma, Chinese Academy of Agricultural Sciences, China
Copyright © 2023 Porras, Navas, Agudelo-Cantero, Santiago-Martínez, Loeschcke, Sørensen, Crandall, Biddinger and Rajotte. This is an open-access article distributed under the terms of the Creative Commons Attribution License (CC BY). The use, distribution or reproduction in other forums is permitted, provided the original author(s) and the copyright owner(s) are credited and that the original publication in this journal is cited, in accordance with accepted academic practice. No use, distribution or reproduction is permitted which does not comply with these terms.
*Correspondence: Mitzy F. Porras, bWl0enkucG9ycmFzQGdtYWlsLmNvbQ==