 Amira Sharief1,2,3
 Vineet Kumar1,2
 Bheem Dutt Joshi1Hemant Singh1
 Saurav Bhattacharjee1
 Ritam Dutta1Shahid Ahmad Dar1Chinnasamy Ramesh2Catherine H. Graham3
 Mukesh Thakur1
 Lalit Kumar Sharma1*
- 1Wildlife and Conservation Section, Zoological Survey of India, Kolkata, West Bengal, India
- 2Population Management, Capture & Rehabilitation, Wildlife Institute of India, Dehradun, Uttarakhand, India
- 3Spatial Evolutionary Ecology, WSL Swiss Federal Research Institute, Zurich, Switzerland
Human expansion and anthropogenic activities are causing the conversion of forests to other land uses in the Himalayas, which is threatening species with extinction. To address this issue, we used an ensemble model to simulate the future landscape and assess its impact on the Kashmir Musk Deer (KMD) distribution in the context of land use change. Our simulation suggests a decline in croplands and shrublands and increase of mixed forests in the future scenario. Evergreen broad-leaf and needle-leaf forests are likely to convert to mixed forests, while croplands and barren areas transform into savannas. Precipitation, elevation, and mixed forests were found to be the most significant factors influencing KMD distribution. Only 20,690 km2 out of the total area of 324,666 km2 is currently suitable for KMD, but this is projected to increase to 22,701.47 km2 in the future. We predict a habitat gain of about 2,722 km2 in new areas and a loss of 711 km2 in existing habitats for KMD by 2030, with Uttarakhand state losing much of the suitable habitat. However, new habitats in future will become available for the species in Jammu and Kashmir. Our landscape configuration investigation indicates a decline in the number of patches and aggregation index in the future scenario. Most of the suitable KMD habitats are outside the current protected areas (PA), making the current PA network insufficient for long-term conservation. Therefore, we suggest forest managers to rationalize the boundary of the PAs to include suitable habitats that are currently not protected for the long-term survival of the KMD.
1 Introduction
Even though the Himalayan ecosystem is identified as a global biodiversity hotspot, it is indubitable that this region is undergoing tremendous degradation because of growing anthropogenic pressure and climate change (Mukherjee et al., 2021; Penjor, 2022). Scientists have recently become more interested in the intriguing issues of the combined effect of land use and climate change on species distribution and the related environmental predictors of the species (Singh et al., 2020: Bagaria et al., 2020; Rathore et al., 2022). Global warming is threatening the biological integrity of the Himalayan region by altering the climatic isotherms (Lamsal et al., 2018; Mukherjee et al., 2020; Bagaria et al., 2020; Dutta et al., 2022). However, conversion of forested habitats to other land-use forms, along with anthropogenic disturbances, has significantly altered the landscape configuration of the fragile Himalayan ecosystem, thereby increasing the extinction risk to the species (Pandit et al., 2007; Flynn et al., 2009). Besides this, the growing anthropogenic activities, including agriculture expansion, growing urban sprawl, increasing linear projects (road, rails), and overexploitation of ecosystem products are detrimental to the local biological diversity (Pandit et al., 2007; Chandra et al., 2020; Chatterjee et al., 2022). To deal with these degradation drivers, it is imperative to recognise and project the impacts on the species habitat in the future scenario. We hypothesise increase in mixed forest or conifer forests will result in increase in suitable habitats for Kashmir musk deer.
The Himalayan mountain ecosystem is considered the water tower region of Asia. It provides habitat for diverse flora and fauna, including ecologically specialist ungulates such as Kashmir musk deer (Moschus cupreus, hereafter = KMD), a conservation-dependent species throughout its range (Sharief et al., 2023). The KMD is distributed in high-elevation mountain ranges of Afghanistan, Pakistan, India and Nepal in continuous-to-fragmented habitat patches (Grubb, 2005; Green 1986; Ostrowski et al., 2016; Wangdi et al., 2019; Singh et al., 2020). In India, it is distributed in the Western Himalayan region (Jammu and Kashmir, Himachal Pradesh and Uttarakhand) (Sharief et al., 2023). KMD is a shy and solitary species which is mostly crepuscular and nocturnal in activity (Harris and Cai, 1993). It plays an essential role as a herbivore by influencing the mountain ecosystem’s vegetation composition and nutrient recycling (Green 1987a; Green 1987b; Bagchi and Ritchie, 2010). However, climatic and land use changes in recent years have impacted many species, including KMD (Singh et al., 2020; Dutta et al., 2022) and the impacts may lead alternation of species composition as well as the habitat (Laws, 2017; Bagaria et al., 2020). Since KMD already occupies higher elevation areas between 2,200–4,300 m, much of the area won’t be available for this species in future climate change and land use change scenario, making it most vulnerable to such changes Schaller, 1977; Singh et al., 2020).
Furthermore, the musk deer population in its entire range is dwindling because of the illegal killing for its pods, habitat fragmentation, and habitat loss as a result of land use change (Aryal and Subedi, 2011; Aryal et al. 2014; Aryal et al. 2016; Khadka et al., 2017). The over-exploitation and habitat destruction are significant factors for the population decline of KMD throughout its entire distribution range. Considering the hastened declines in its population, the species is listed as an endangered species by the International Union for Conservation of Nature and Natural resources (IUCN), (Timmins and Duckworth, 2015) and an Appendix-I species by the Convention on International Trade in Endangered Species of Wild Fauna and Flora (CITES, 2015), and the Indian Wildlife Protection Act (1972) thereby provided it highest protection by listed musk deer under the Schedule-I species. Hence due to increasing threats and its endangered status, it becomes crucial to evaluate the current suitable habitat of KMD as well as predict the anticipated changes of the landscape in the future for developing a long term conservation strategy in the North-western Himalayas.
The rising transformation of forest to non-forest land use and increasing temperature in the Himalayan region are accelerating biodiversity loss (Brodie, 2016; Penjor, 2022). Although the cumulative impact of global warming and land use change on all species is little explored (Chatterjee et al., 2022; Rathore et al., 2022); however, future simulated landuse change is also under-explored (Mukherjee et al., 2020; Chatterjee et al., 2022). Hence, understanding how land use change can affect species distribution is imperative for creating data-driven conservation and management decisions. Therefore, we attempted to evaluate the change in suitable habitat of KMD in the face of land use land cover change and its impact on the distribution of KMD using the ensemble modelling approach across its distribution range in the North-western Himalayas. We also predicted the future simulated impact of land-use change on the distribution of the species and attempted to identify the current and future suitable regions in the face of land-use change for conservation and management planning. Finally, we quantified the proportion of suitable habitats of KMD inside and outside the Protected Areas (PA) network. The landscape configuration indices for the current and future scenario were evaluated to understand the landscape dynamics in the North-western Himalayas.
2 Materials and methods
2.1 Study area
The present study was conducted in the Western region of the Indian Himalayas, which includes two states (Himachal Pradesh & Uttarakhand) and one union territory Jammu and Kashmir (Figure 1). The area coverage of the landscape is 327,996 km2 which contains distinct vegetation regimes providing a home to several unique flora and fauna species. The vegetation is represented by Himalayan Temperate Forests, Sub-alpine and Alpine Forests, Tropical and Sub-tropical Broad-leaved Forests, Tropical Coniferous Forests, and Dry and Moist Deciduous Forests, with an elevation ranging from 177 m to 8,569 m (Champion and Seth, 1968). The climatic conditions are harsh, varying temperatures between 32.5°C in summers and −24.1°C in severe cold winters (Joshi et al., 2019).
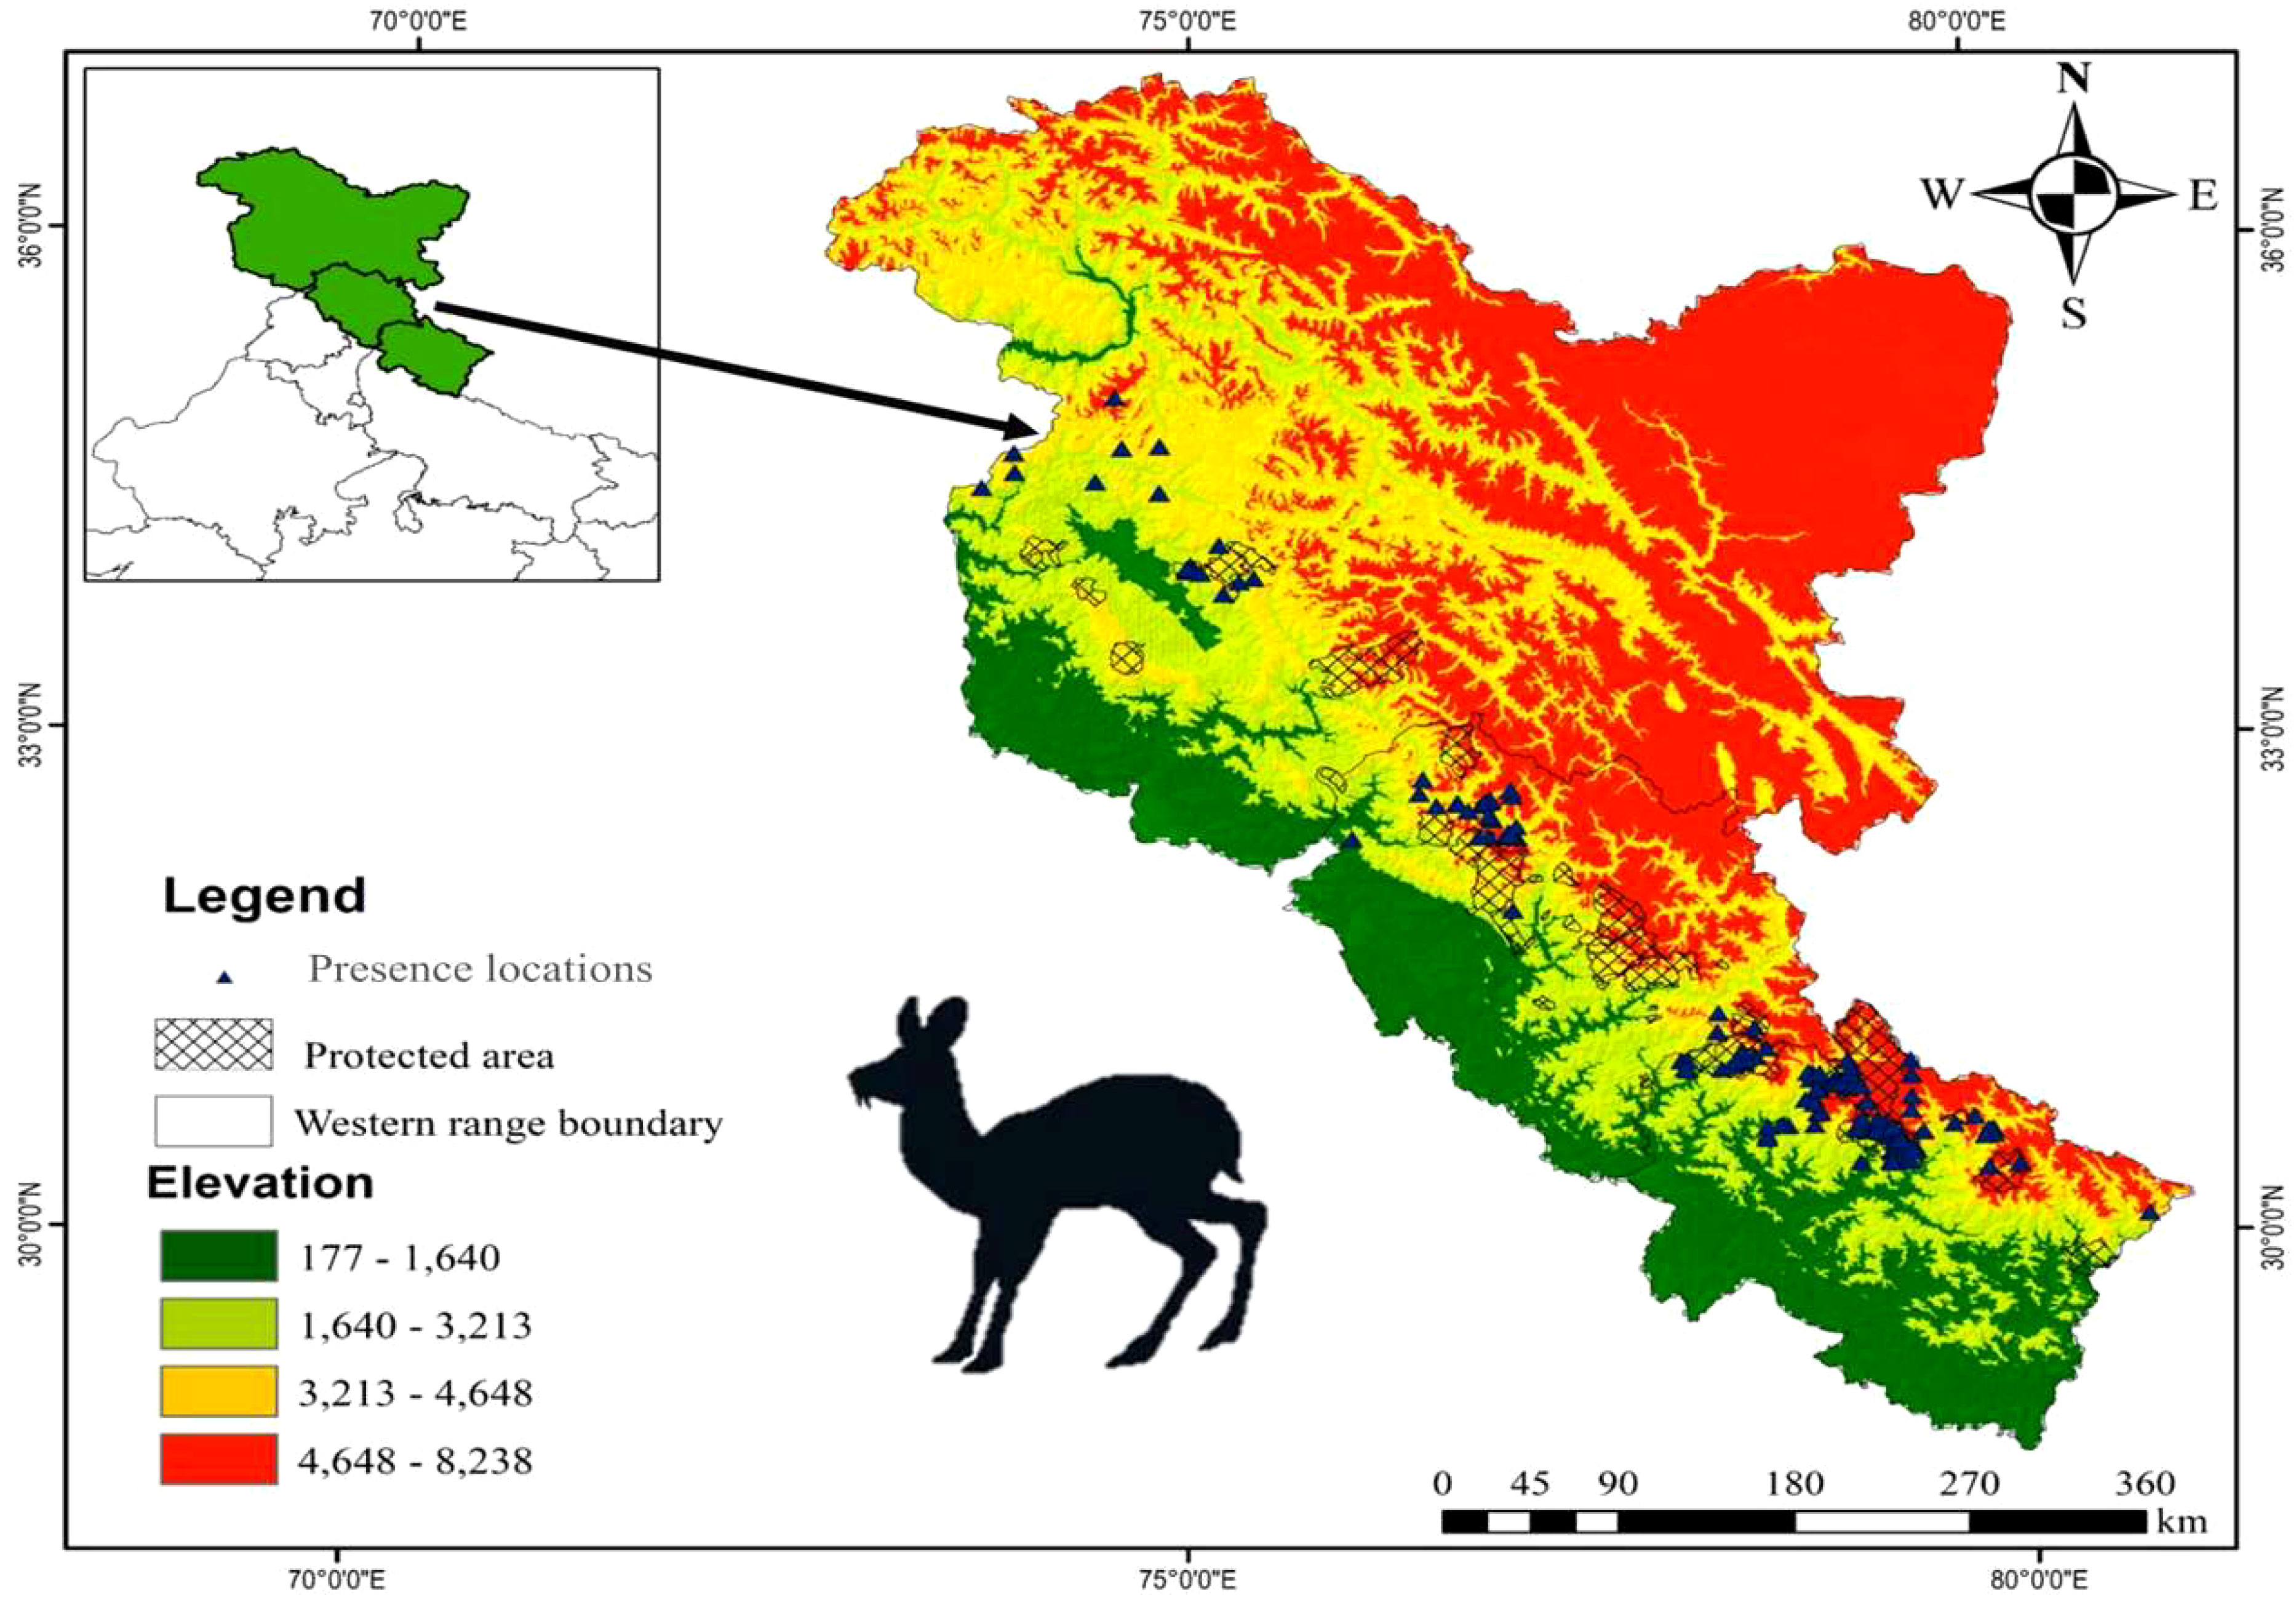
Figure 1 Study area map with presence locations of Kashmir musk deer.
2.2 Species distribution modelling
2.2.1 Kashmir musk deer presence location data
The occurrence GPS locations of KMD were collected from both the primary as well as secondary data sources. The species occurrence surveys were conducted during 2018–2020 in the range districts of Uttarakhand and Himachal Pradesh (Figure 1), and the secondary data were collected from published studies for the KMD distribution range. From Jammu and Kashmir we didn’t have any primary data hence only secondary locations extracted from published sources were used for modelling (Ali, 2014; Singh et al., 2020). Therefore, a total of n = 279 presence locations were obtained by combining primary as well as secondary sources, i.e., published articles (Syed and Ilyas, 2012; Ali, 2014; Shukla et al., 2018; Nandy et al., 2020; Pal et al., 2021; Kumar et al., 2022). Out of the total presence locations, only n = 220 spatially independent occurrence records of KMD were used in performing distribution modelling of the KMD in the Western Himalayas. We have used 1×1 km grid size (home range) as criteria for retaining the spatially independent occurrence records of musk deer (Singh et al., 2018). The SDM toolbox in ArcGIS 10.9 was used for testing special autocorrelation among the locations.
2.2.2 Data preparation
We used habitat variables considering the ecological needs and behaviour of the species. These variables were classified into four categories (bioclimatic, topographic, LULC and anthropogenic) for mapping the suitable habitats of the KMD (Sharief et al., 2023). We extracted 19 bioclimatic variables from World Clim Ver. 2 (www.worldclim.org) with ~1 km spatial resolution (Hijmans et al., 2005). The LULC for 2010 and 2020 was classified using the MODIS (Moderate Resolution Imaging Spectroradiometer) Land Cover Type Product (MCD12Q1) version 6 with a 500-m resolution (https://earthexplorer.usgs.gov). After reclassifying the MODIS data, we classified the landscape into 11 different land use and land covers. The raster images were generated for all the landuse landcover classes available for the study extent using ArcGIS 10.9. The topographic predictors (elevation, slope and aspect) were generated by using the Shuttle Radar Topographic Mission image downloaded from Earth Explorer (https://earthexplorer.usgs.gov). The study species is susceptible to anthropogenic disturbances hence to understand the impact of we used the global human footprint data (downloaded from SEDAC, NASA; https://sedac.ciesin.columbia.edu). Similarly we used the linear features, such as road and water, downloaded from DivaGis (www.diva.gis.org). We rescaled all the predictors at 30 arcsecs spatial resolution using the spatial-analyst tool of ArcGIS 10.9. The collinearity among the predictor variables was removed using the Pearson correlation test, and the variables with a value higher than 0.8 (rs>0.8) were not dropped from the analysis (Supplementary Figure 1; Warren et al., 2010). Finally, only 18 spatially independent variables were retained for modelling the habitat suitability of the KMD (Supplementary Table 1).
2.2.3 Landuse future simulation
The future LULC was simulated using the MOLUSCE plugin of QGIS (ver: 2.8.9) by following the cellular automata (CA) model (NEXTGIS, 2017). The acquired LULC data for 2010 and 2020 was used for simulating the future landscape for 2030 using the spatial transition matrix (Liping et al., 2018; Chatterjee et al., 2022). We used the transition probability matrix and the variables responsible for the transition to simulate the LULC of 2030 based on past patterns of LULC changes. (Ullah et al., 2019; Chatterjee et al., 2022). The transition probability matrix was calculated using the artificial neural network analysis of LULC data from 2010 and 2020 (Chatterjee et al., 2022). Further, we considered elevation, aspect, distance to road, topographic roughness index, topographic wetness index, surface temperature and human footprint as dependent variables for computing the transition matrix (Chatterjee et al., 2022). The sampling mode was random, and the neighbourhood pixels for the analysis were kept at nine cells with 1,000 iterations. The accuracy of the model was tested using Cohen’s kappa (k) following our previous study by Chatterjee et al. (2022).
2.2.4 Model building
The SDMs are commonly used to model species–environment relationships and forecast species spatial distributions (Guisan and Zimmermann, 2000; Gusian and Thuiller, 2005; Hijmans et al., 2005; Elith et al., 2006; Hijmans and Elith, 2014; Bagaria et al., 2020; Dutta et al., 2022). However, current progress in advanced computing algorithms with varying ensemble procedures producing more reliable habitat suitability maps (Araújo and New, 2007; Buisson et al., 2010; Kindt, 2018). Hence, we implemented ensemble modelling in the R package (‘biomod2’) (Thuiller et al., 2009; Thuiller et al., 2016) for the distribution modelling of KMD in the Western Himalayas. All eight modelling algorithms for performing species distribution modelling in ‘biomode2’ of the R package were used for selecting the best model. We split the presence location data into 80% as training and the remaining 20% for testing the model with ten repetitions. In addition, we followed Zuo et al. (2021) for better distribution output and to minimise spatial deviation. We randomly selected 1000 pseudoabsence points, and this process was repeated twice for model building. The Receivers Operating Curve (ROC) and True Skill Statistic (TSS) scores were used to understand the model performance and used the best-performing models for ensemble model building (Elith and Leathwick, 2009; Mukherjee et al., 2020; Chatterjee et al., 2022; Dutta et al., 2022). The variable importance scores of the models were obtained in-built function of the ‘biomod2’ package. The mean values of variable importance scores produced by the best model for the final ensemble model based on a TSS threshold were calculated (Allouche et al., 2006). The probability distribution surfaces were later converted into a binary where 0 value was ‘absence’ and 1 was ‘presence’ and considered the cut-off value as a threshold. We classified the probabilities above the threshold value as suitable habitat; otherwise non-suitable, and the same was used for the future scenario of species distribution (Bagaria et al., 2020).
2.2.5 Landscape dynamics and habitat configuration analysis
Studies have brought out that habitat fragmentation can lead to a decline in abundance as well fitness of species in an impacted area (Kruess and Tscharntke, 1994). Therefore, the predicted probability surfaces were used for evaluating the fragmentation intensity and habitat patch placement in the mapped suitable habitats of KMD in the Western Himalayas. To understand the landscape configuration, we calculated the landscape metric and assessed the changes over study decades using FRAGSTATS version 4.2.1 (McGarigal, 2015). We calculated the total area (TA), number of patches (NP), Patch density (PD), largest patch index (LPI) and aggregation index (AI), which are used to understand the fragmentation intensity temporally (Bagaria et al., 2020; Mukherjee et al., 2021; Chatterjee et al., 2022). Further, the zonal statistics was calculated to quantify the available proportion of the KMD habitat distributed within the Protected Areas (PA) boundaries using ArcGIS 10.9 software. The KMD habitat falling under the PA boundaries was assessed using the percentage coverage of the KMD habitat area under each PA of the Western Himalayas to understand the PA representativeness in the present and future.
3 Results
3.1 Future simulated landscape
The simulated future LULC for 2030 has 82% overall accuracy (kappa = 0.82) in the training model and the projected model with 93% accuracy (kappa = 0.93). The multi-temporal scenarios comparison revealed the highest decline between 2010 and 2020 in the croplands (−5,501.7 km2), followed by barren areas (−4,037.51 km2), grasslands (−180.31 km2) and shrublands (−44.22 km2). In contrast, the highest gain was found in savannas (5,148.16 km2), followed by snow (2,430.15 km2) and mixed forest (1,456.89 km2) (Table 1). However, between 2020 and 2030 all the land use classes except savanna (6,822.71 km2), mixed forest (162 km2) and barren area (1.29 km2) declined in the future scenario. We found the highest decrease in evergreen needle forests (−2,328.2 km2), followed by grasslands (−2,188.9 km2) and croplands (−1,448.3 km2) (Table 1). The transition probability matrix suggests the highest conversion of shrubland (SLND) into grassland (GLND) (0.41), cropland (CLND) to Savana (SA) (0.21) and evergreen needle leaf (ENF) and broad leaf forests (BF) to mixed forests (MF) (0.11). However, in 2030 built-up (BU), ENF and BF will get converted into SA with values equal to 0.62, 0.39 and 0.16, respectively (Supplementary Table 2).
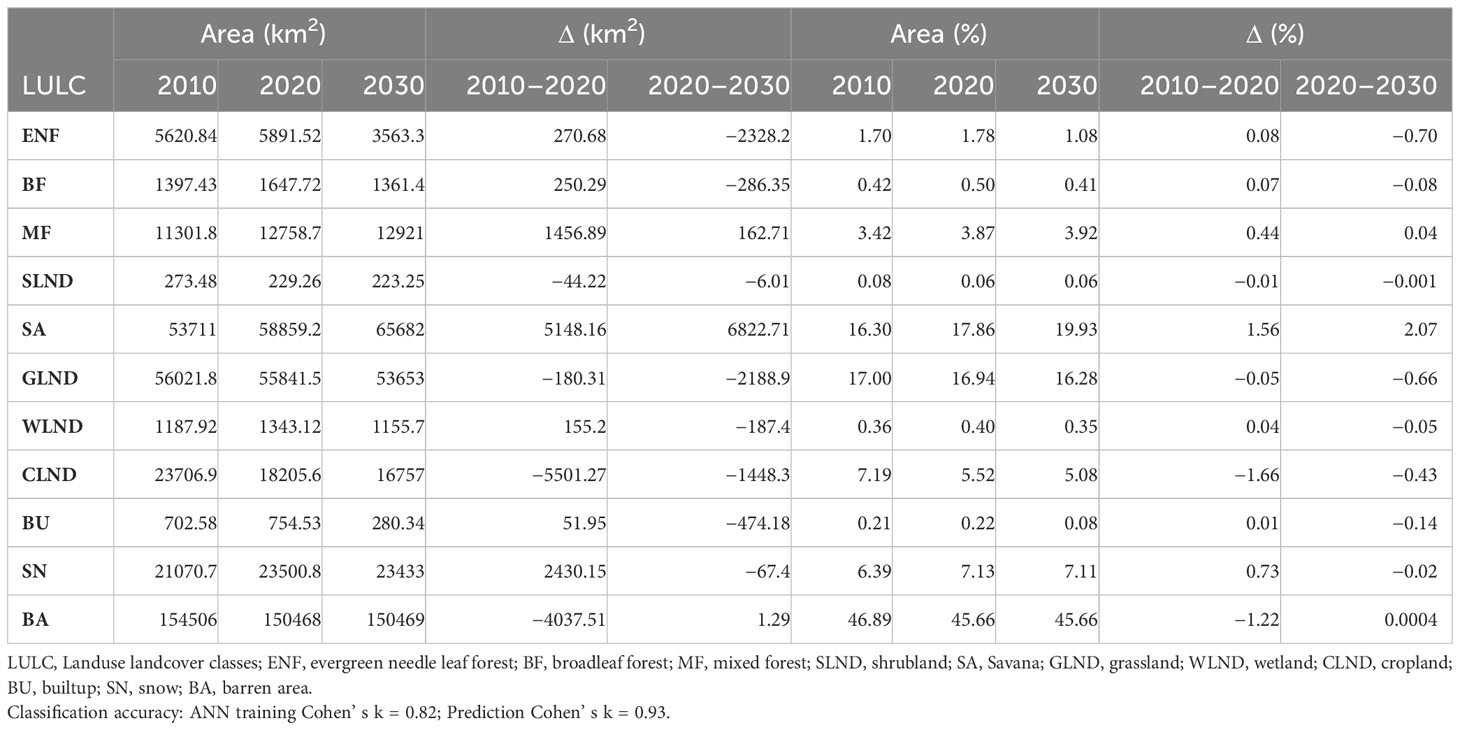
Table 1 Land use pattern over the past, present and future scenarios.
3.2 Species distribution modelling
3.2.1 Model performance
The ensemble model of the KMD was selected using the TSS values greater than 0.80 (Supplementary Figure 2). Out of eight modelling algorithms used for building ensemble models, the best-performing models were RF, MARS, GBM, and GAM, respectively. The TSS value (0.86) was the highest for the RF model among all the modelling algorithms (Supplementary Figure 2). The TSS weighted mean value of the ensemble model was equal to 0.83, which depicts the best performance of all the participating models used for mapping the suitable habitats of KMD. The response curves of all the models used for developing the ensemble model are provided in Supplementary Figures 3–6. The variable importance values depict that bio19 and elevation are the top contributing factors governing the distribution of KMD.
3.2.2 Present and future suitable habitat of KMD
The KMD is predicted to occupy a narrow belt of high-altitude ranges of the Western Himalayas (Figure 2). The present study revealed that out of 324,666 km2, only 20,690 km2 (6.97%) is the suitable habitat (Table 2). Our results revealed that out of the total suitable habitat (20,690 km2), 9,921 km2 is low suitable, 6,118 km2 medium suitable and 4,650 high suitable area for KMD (Table 2, Figure 2). However, in a future scenario, 22,701.47 km2 is the suitable habitat of KMD in the western Himalayas covering 10,503 km2 as low suitable areas, 7,104 km2 medium suitable area and 5,094 km2 high suitable area (Table 2, Figure 2). Approximately 2,722 km2 will become available for the species in 2030 (Table 2, Figure 3). Furthermore 711 km2 will be lost in 2030, out of which 77 km2 falls inside the protected areas and 634 km2 outside the protected areas (Table 2, Figure 3). Two variables were found to be the most significant among all 18 participatory variables for the distribution of KMD: the precipitation of the coldest quarter (bio19) and elevation, with variable importance of 0.26 and 0.11, respectively (Figure 4). These variables were identified as the most critical factors positively influencing the distribution of KMD in the Western Himalayas. Furthermore, mixed forests and snow were the most significant contributors among the land cover type predictors for determining the distribution of KMD (Figure 4).
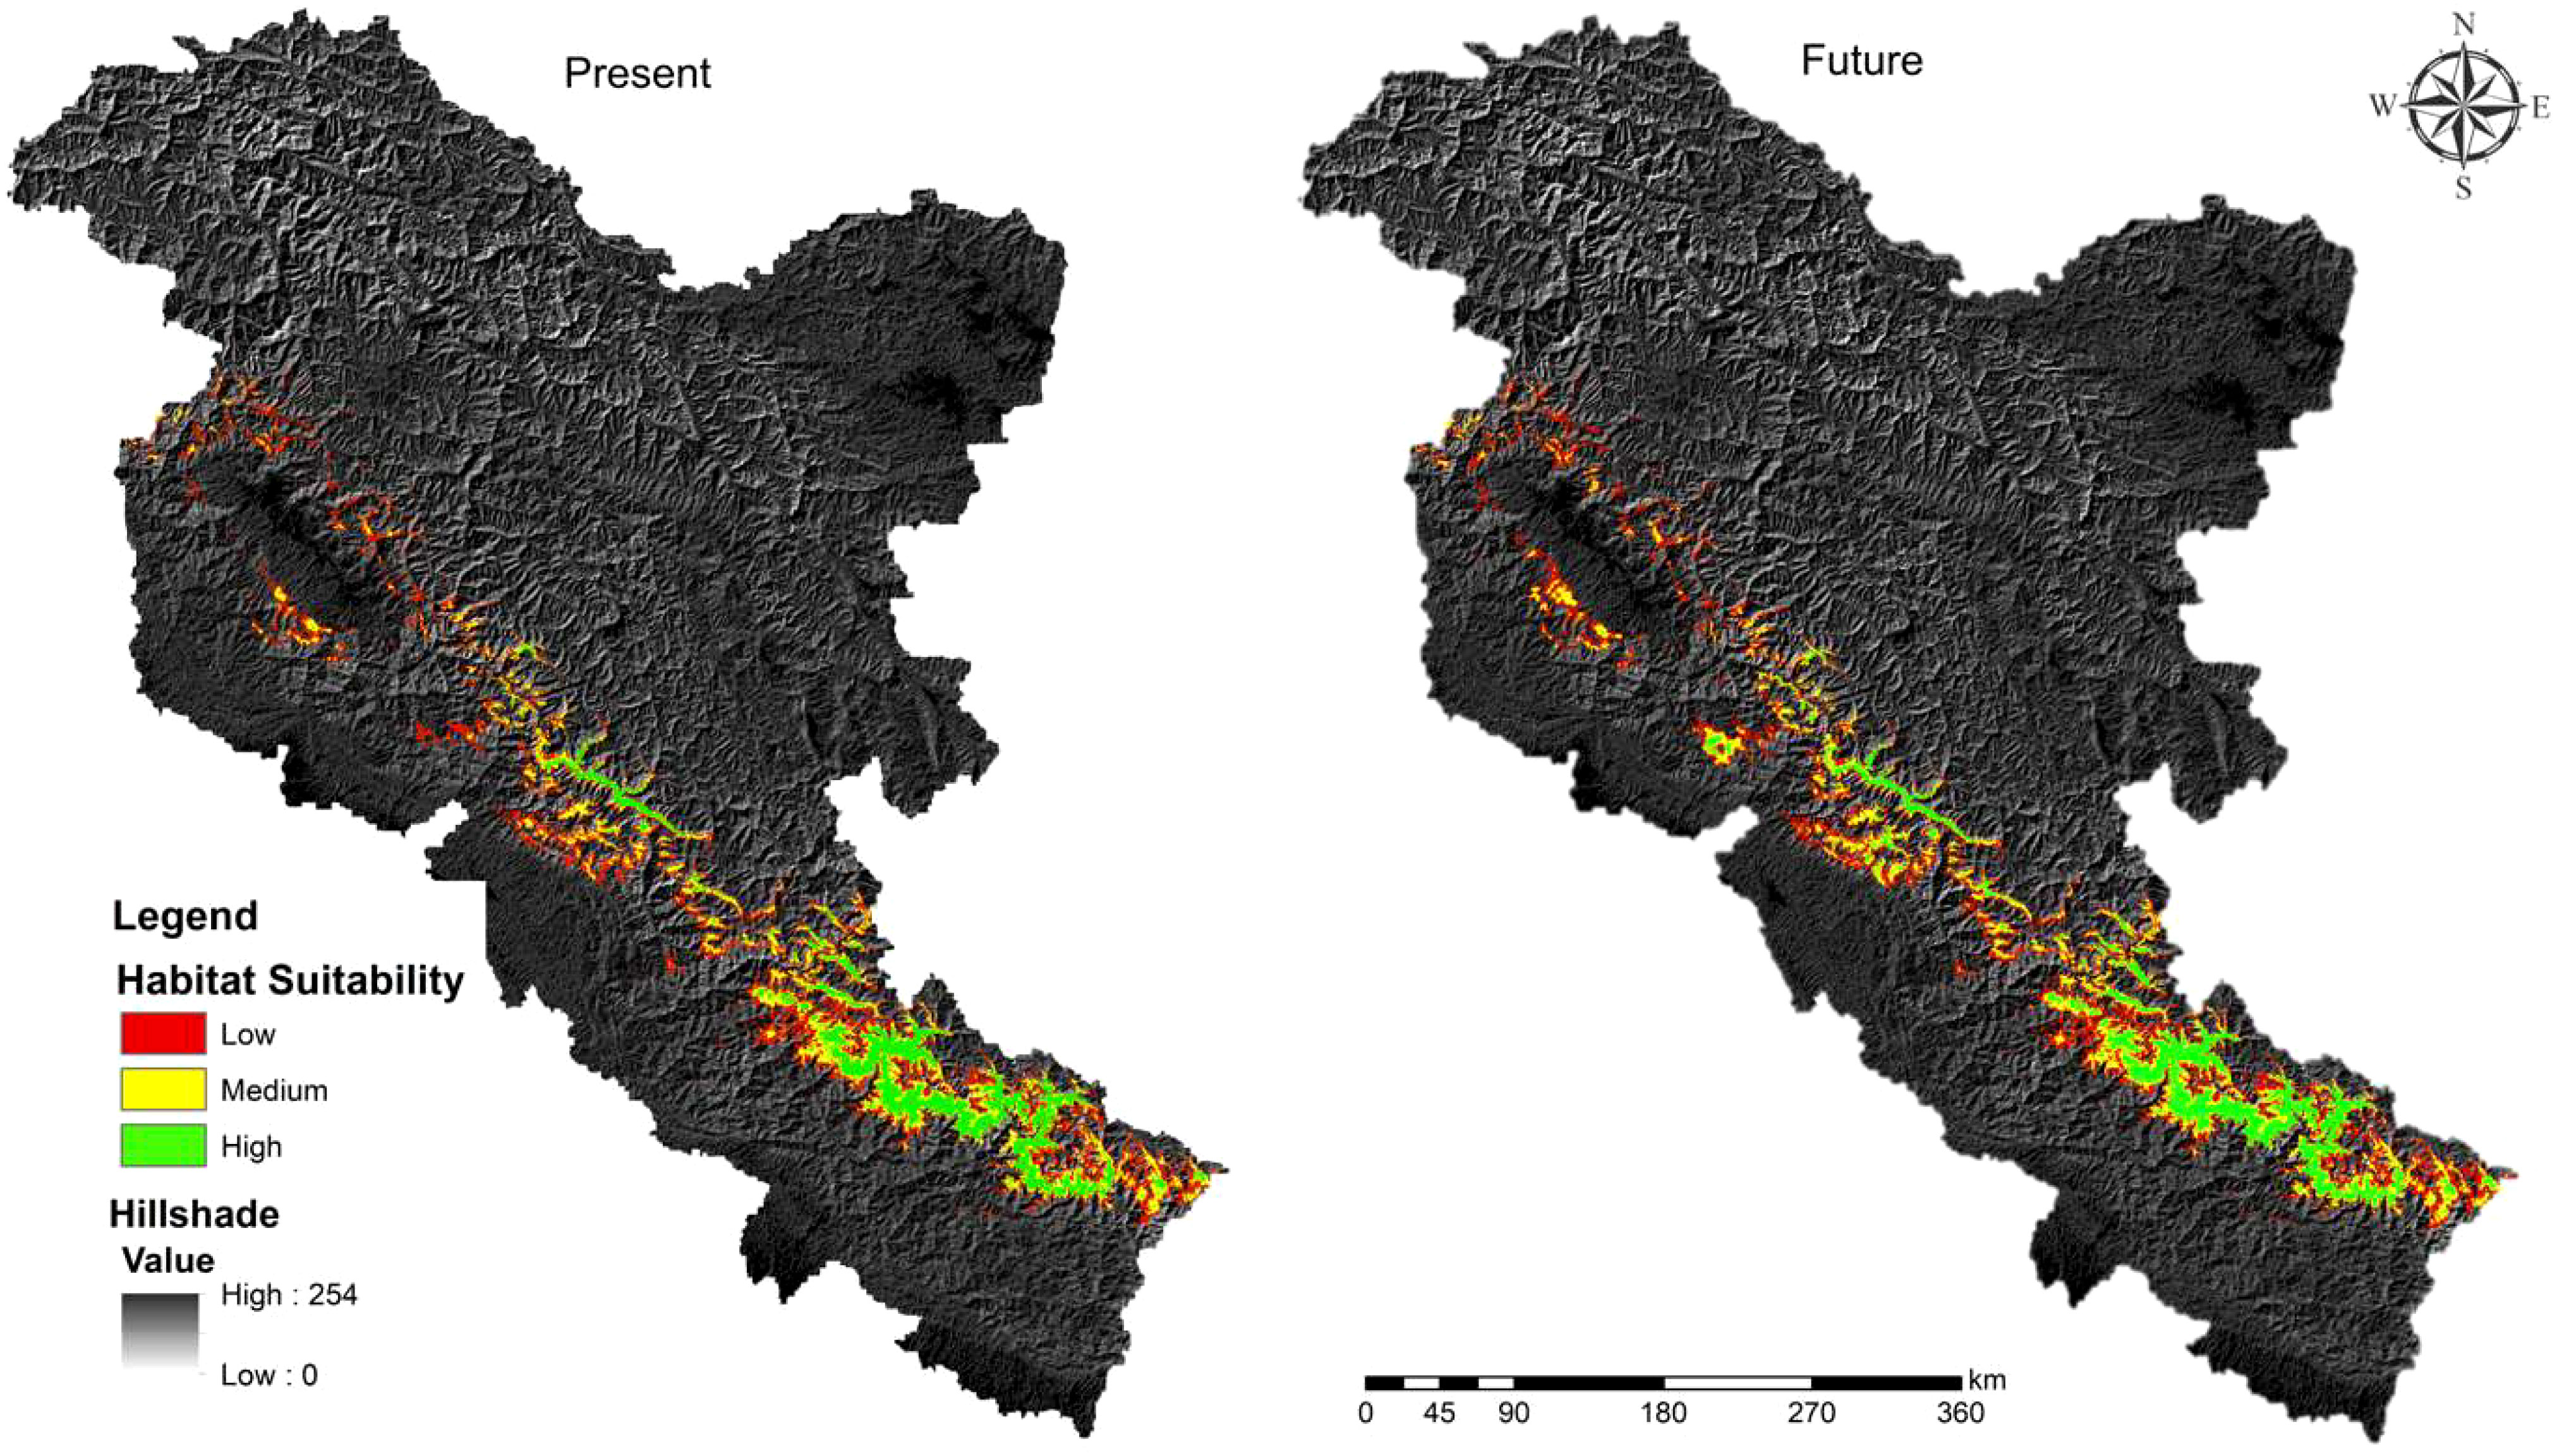
Figure 2 Predicted suitable habitat of Kashmir musk deer at present and in future scenario 2030.
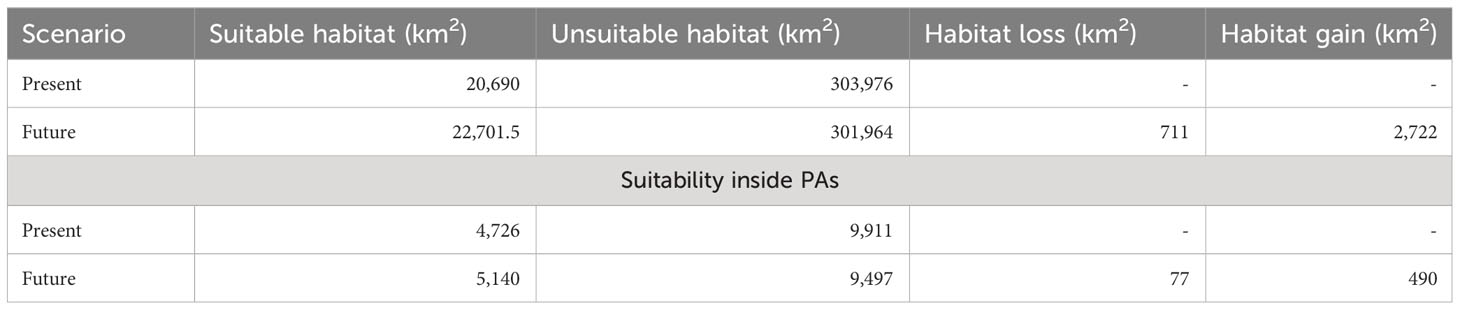
Table 2 Suitable habitat of KMD in present and future scenario and estimated habitat change in and outside protected areas (estimations are in km2).
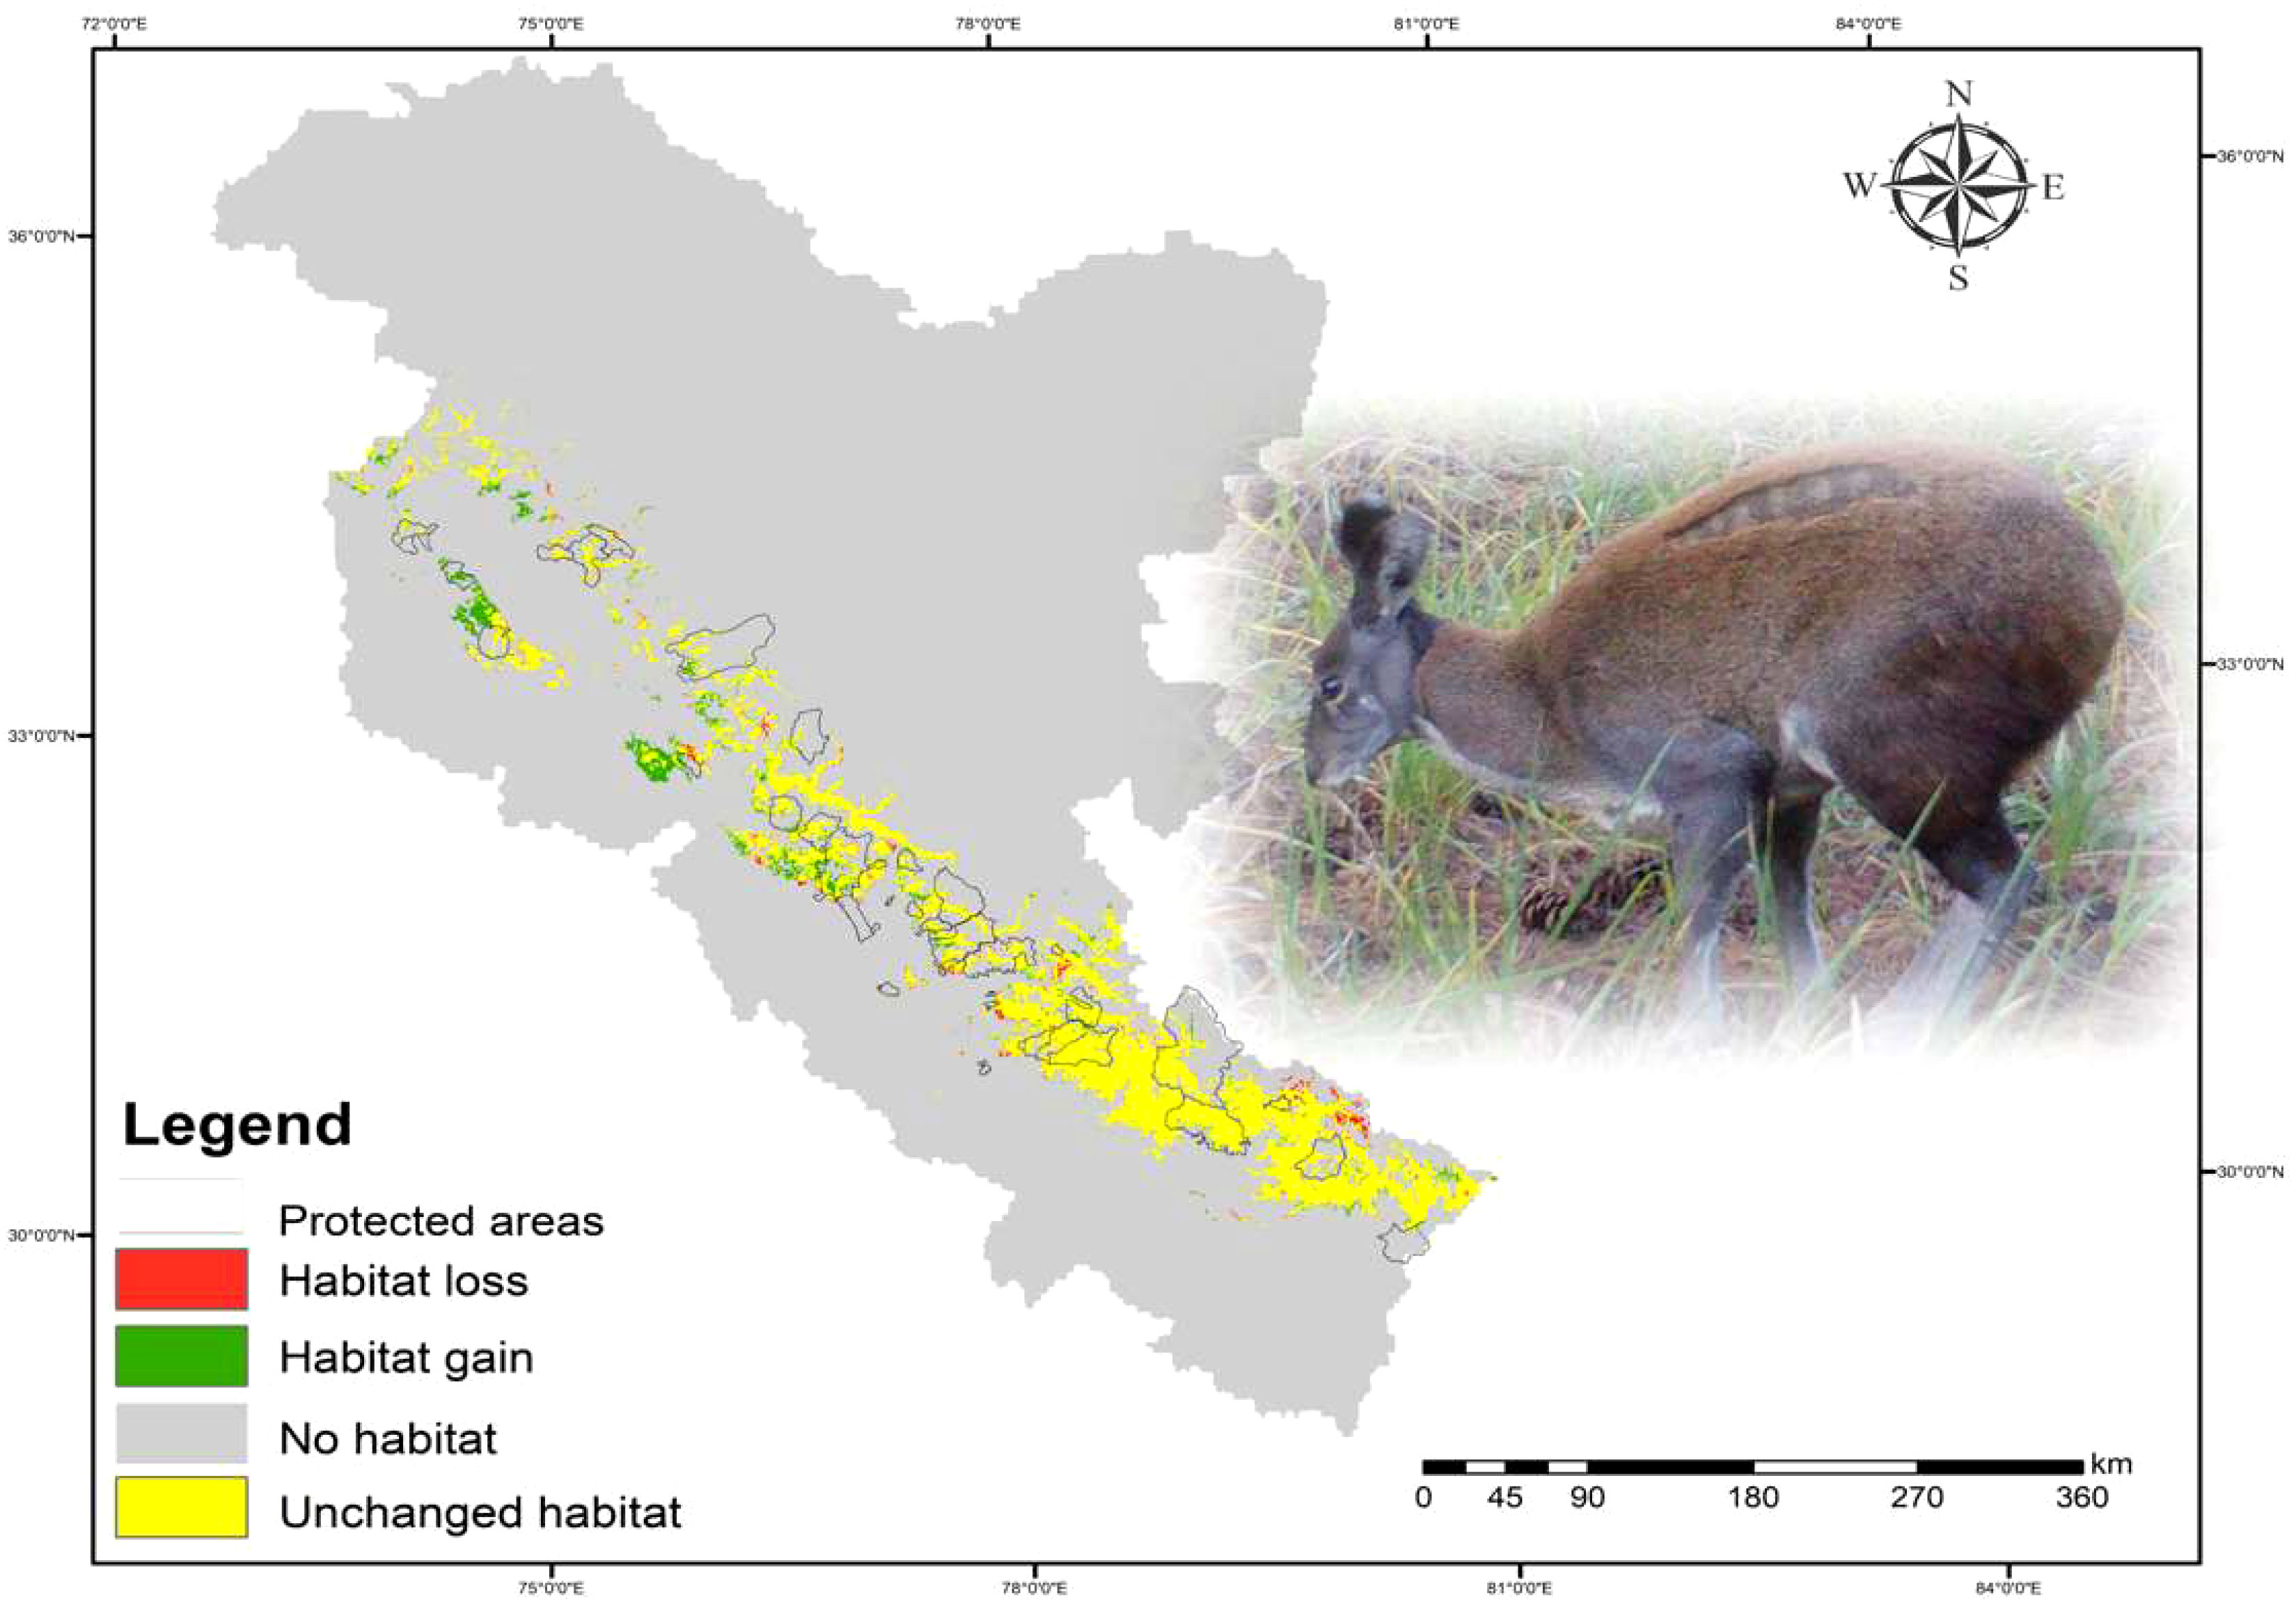
Figure 3 Predicted habitat change of Kashmir musk deer in and outside the protected areas.
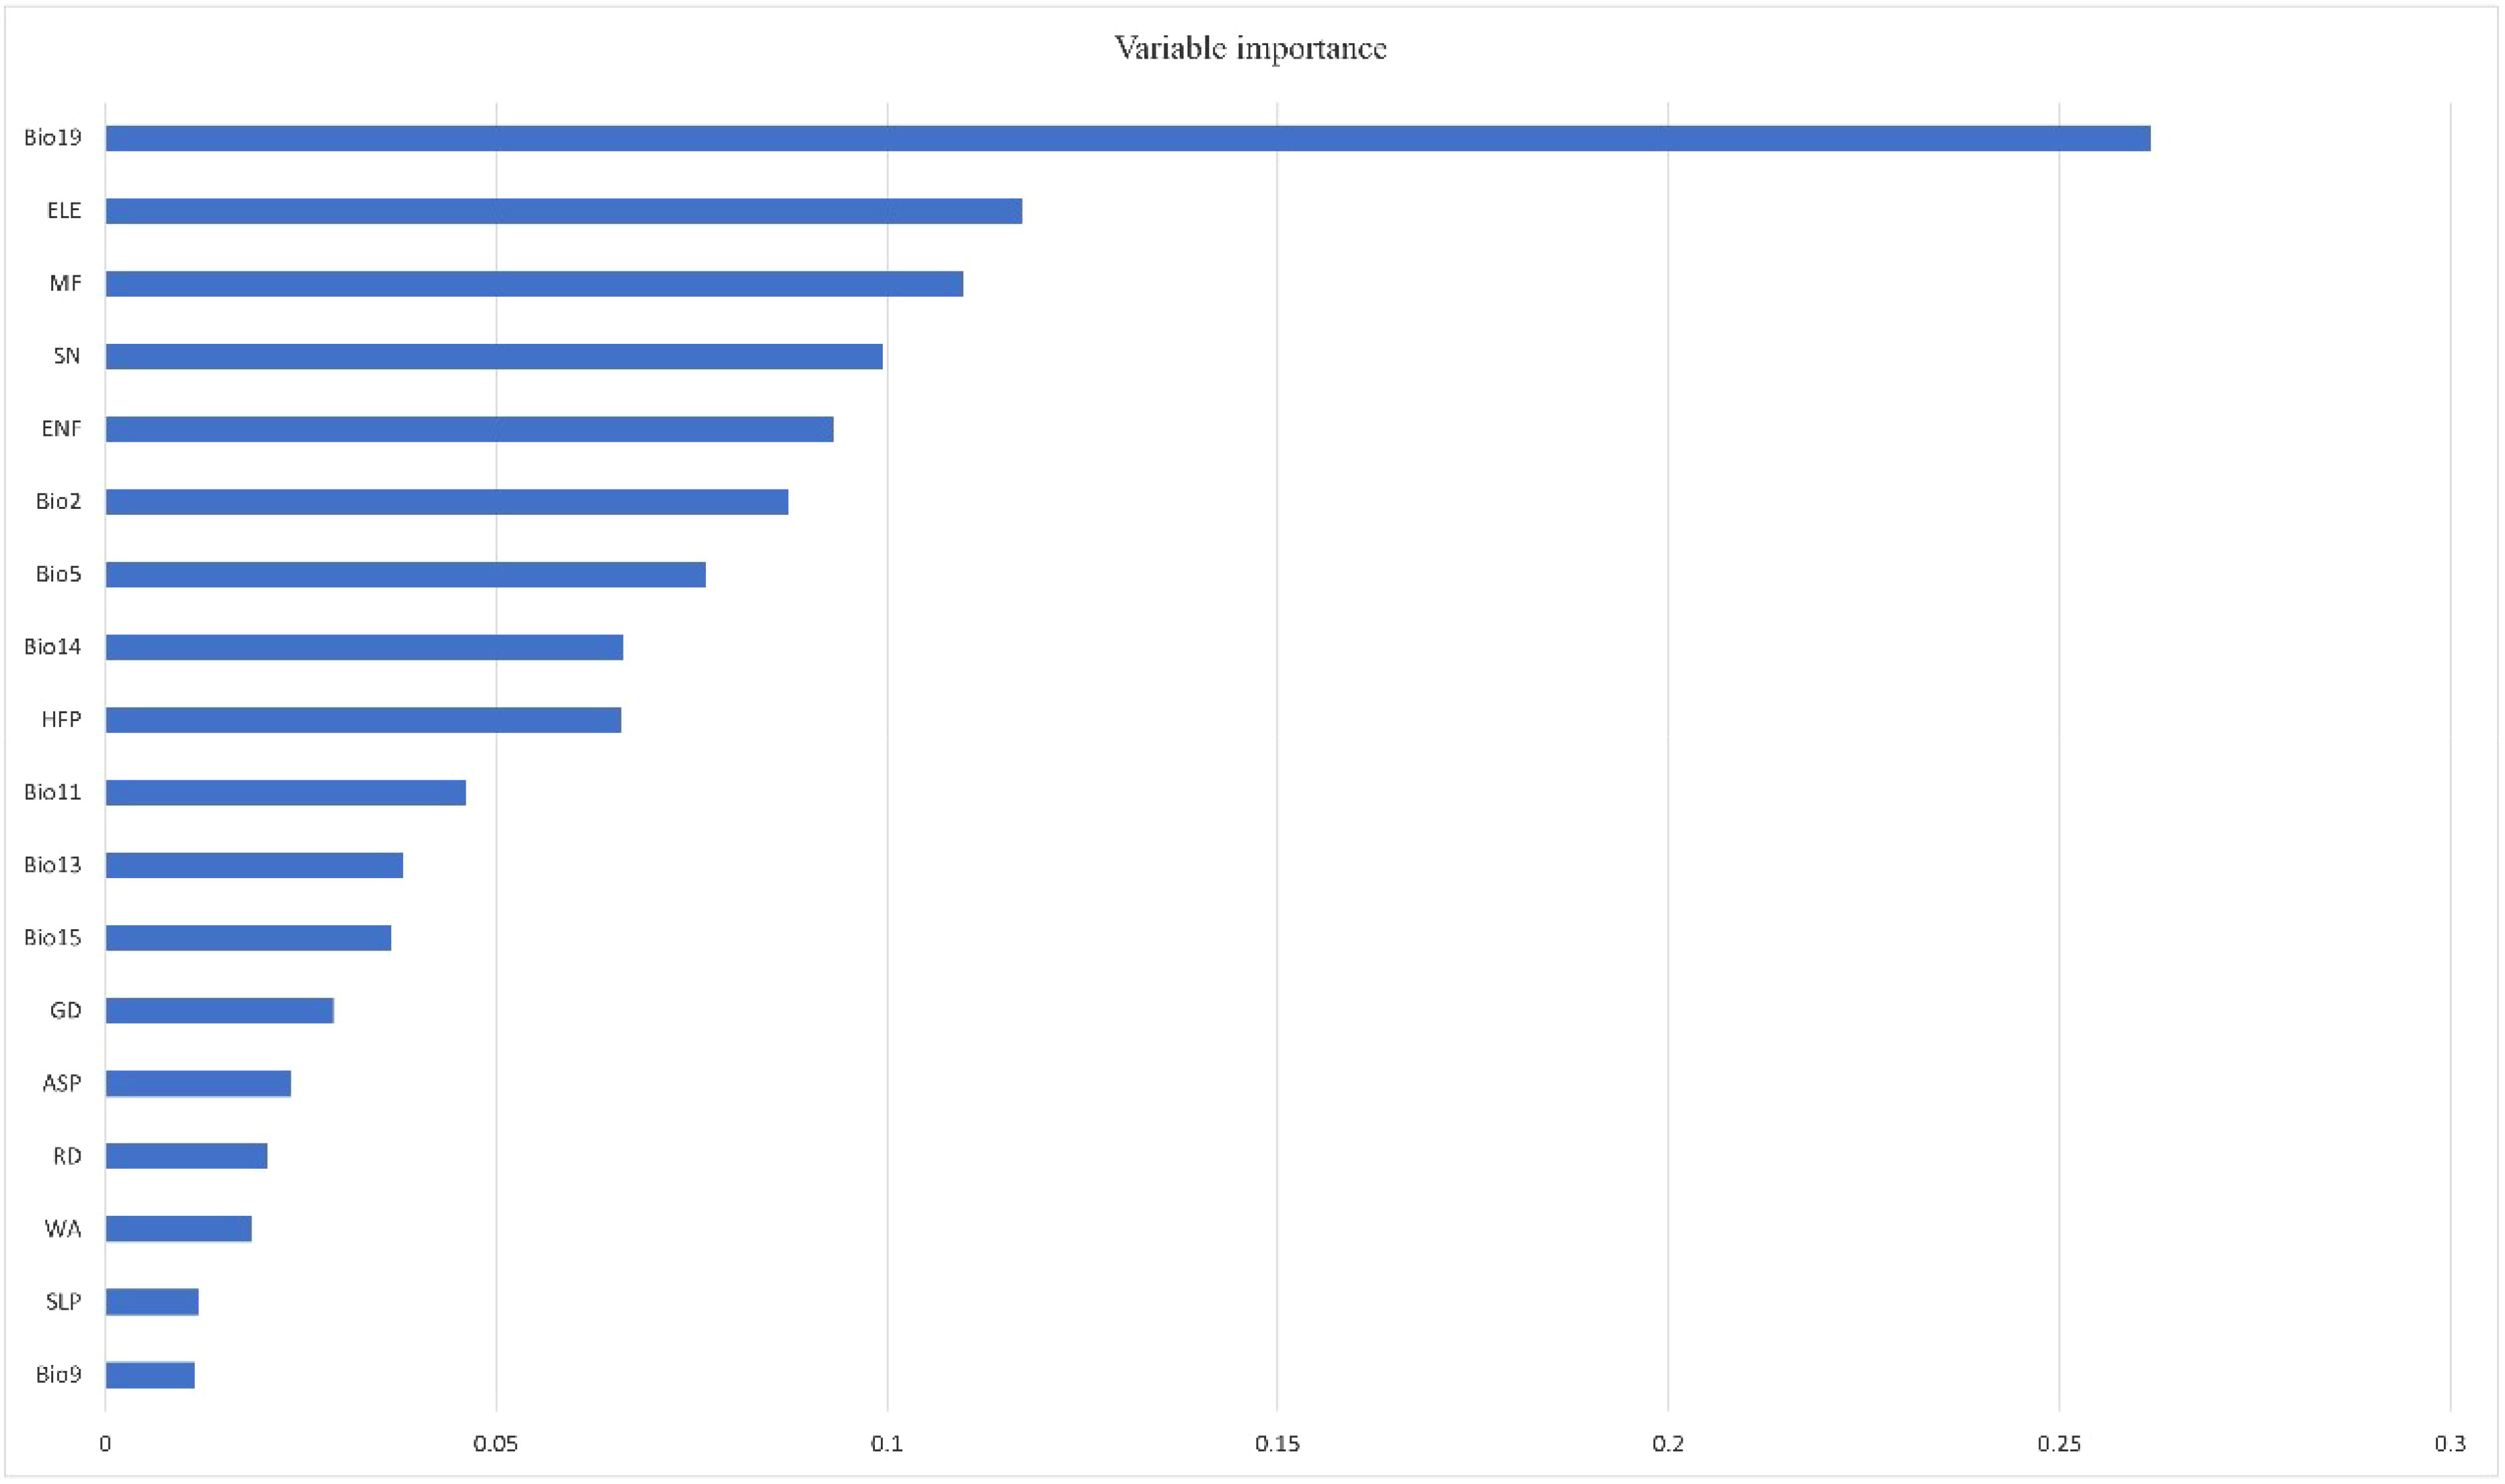
Figure 4 Variable importance of predictors used in predicting the habitat suitability of Kashmir musk deer.
3.2.3 Protected area representation
Only around 22.6% of the total KMD habitat is distributed within the PA network, which is projected to decrease to 10.8% by 2030 in the future scenario (Table 2). Additionally, the future simulated habitat loss for KMD is expected to occur mainly outside the PA network. Our results also indicate that, in the present scenario, the Valley of Flowers Wildlife Sanctuary (WLS) (μ = 0.82) and Govind Pashu Vihar (μ = 0.76) have the highest mean suitability, while Askot Musk Deer Wildlife Sanctuary (WLS) (μ = 0.01) has the lowest mean suitability. However, in the future scenario, the Valley of Flowers WLS (μ = 0.84) is expected to have the highest proportion of its habitat, followed by Kedarnath WLS (μ = 0.79) and Nargu WLS (μ = 0.005), which exhibited the lowest mean suitability (Figure 5).
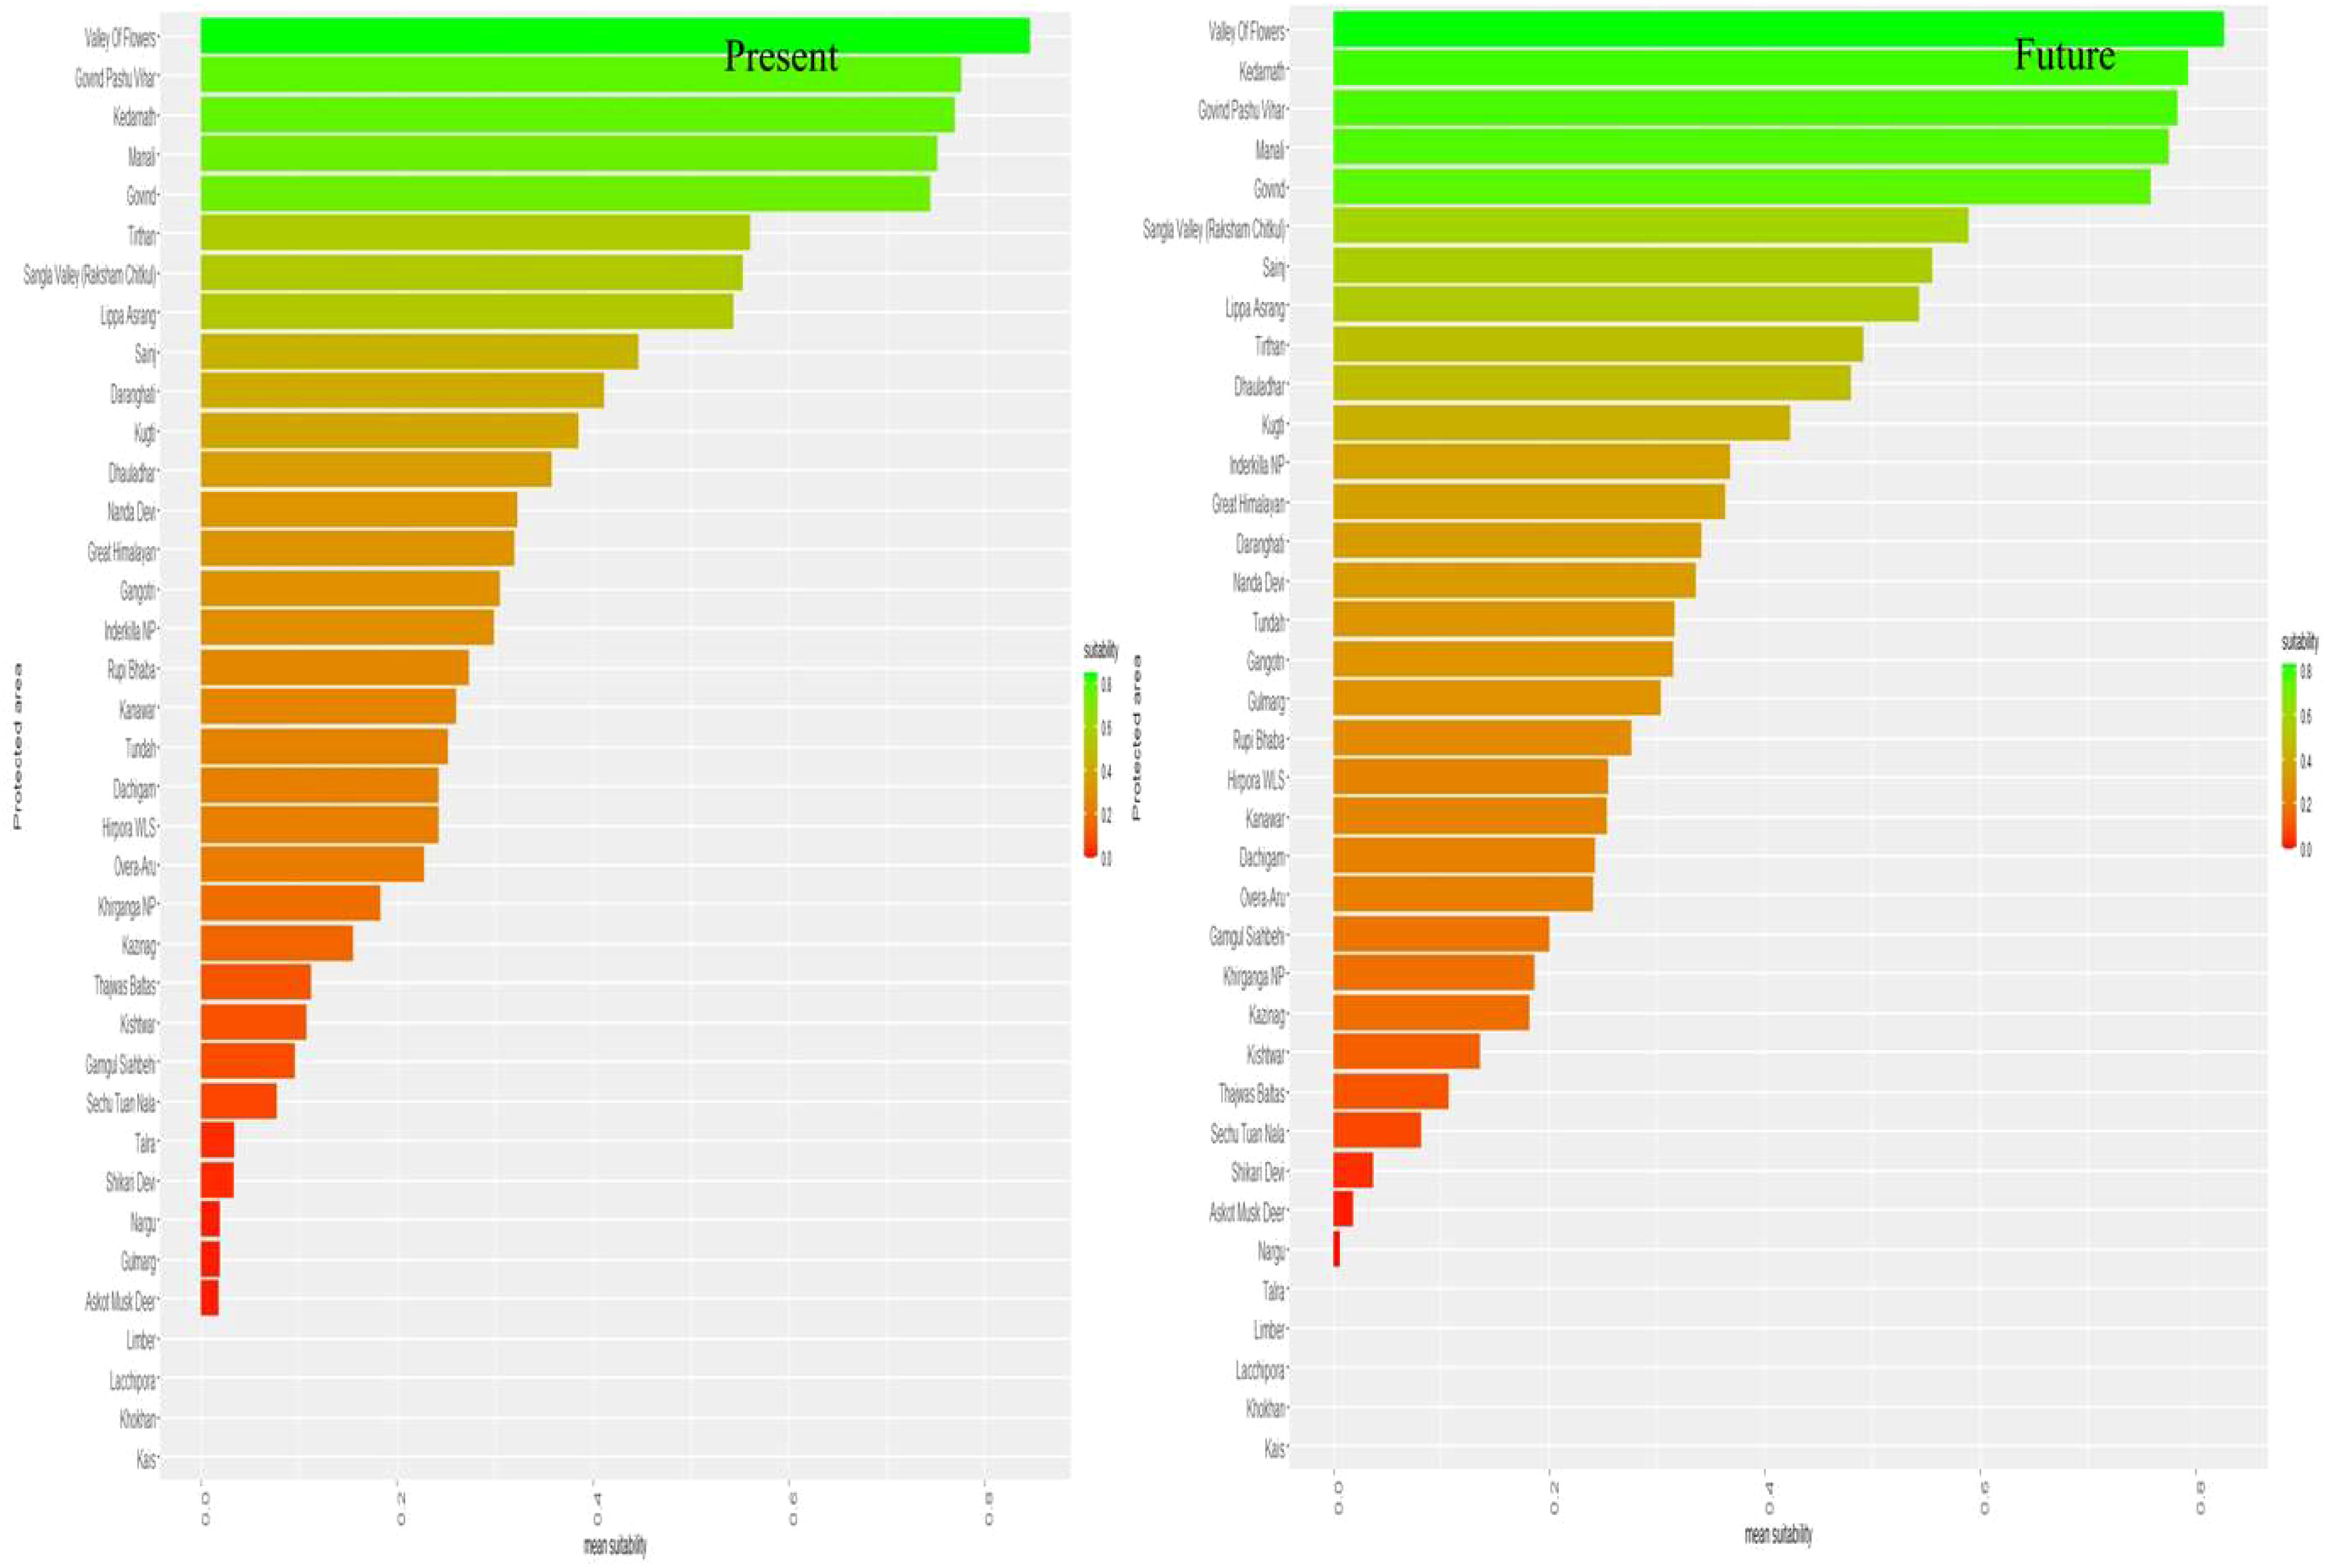
Figure 5 Mean suitability of protected areas in the present and future land use land cover change scenarios.
3.2.4 Landscape configuration
We observed changes in the landscape dynamics over three decades with decreased levels of fragmentation in the suitable habitat of the KMD. The decline in the suitable patch numbers indicates reduced fragmentation in the habitat of the species in the study landscape by 2030 (Table 3; Figure 6). Moreover, an increase in the aggregation index and the largest patch index was also observed in the future scenario (Figure 6). The landscape configuration matrices of the suitable habitat of KMD show an increasing trend in the future scenario (Table 3, Figure 6).

Table 3 Landscape configuration metrics of suitable habitats in the present and future scenario.
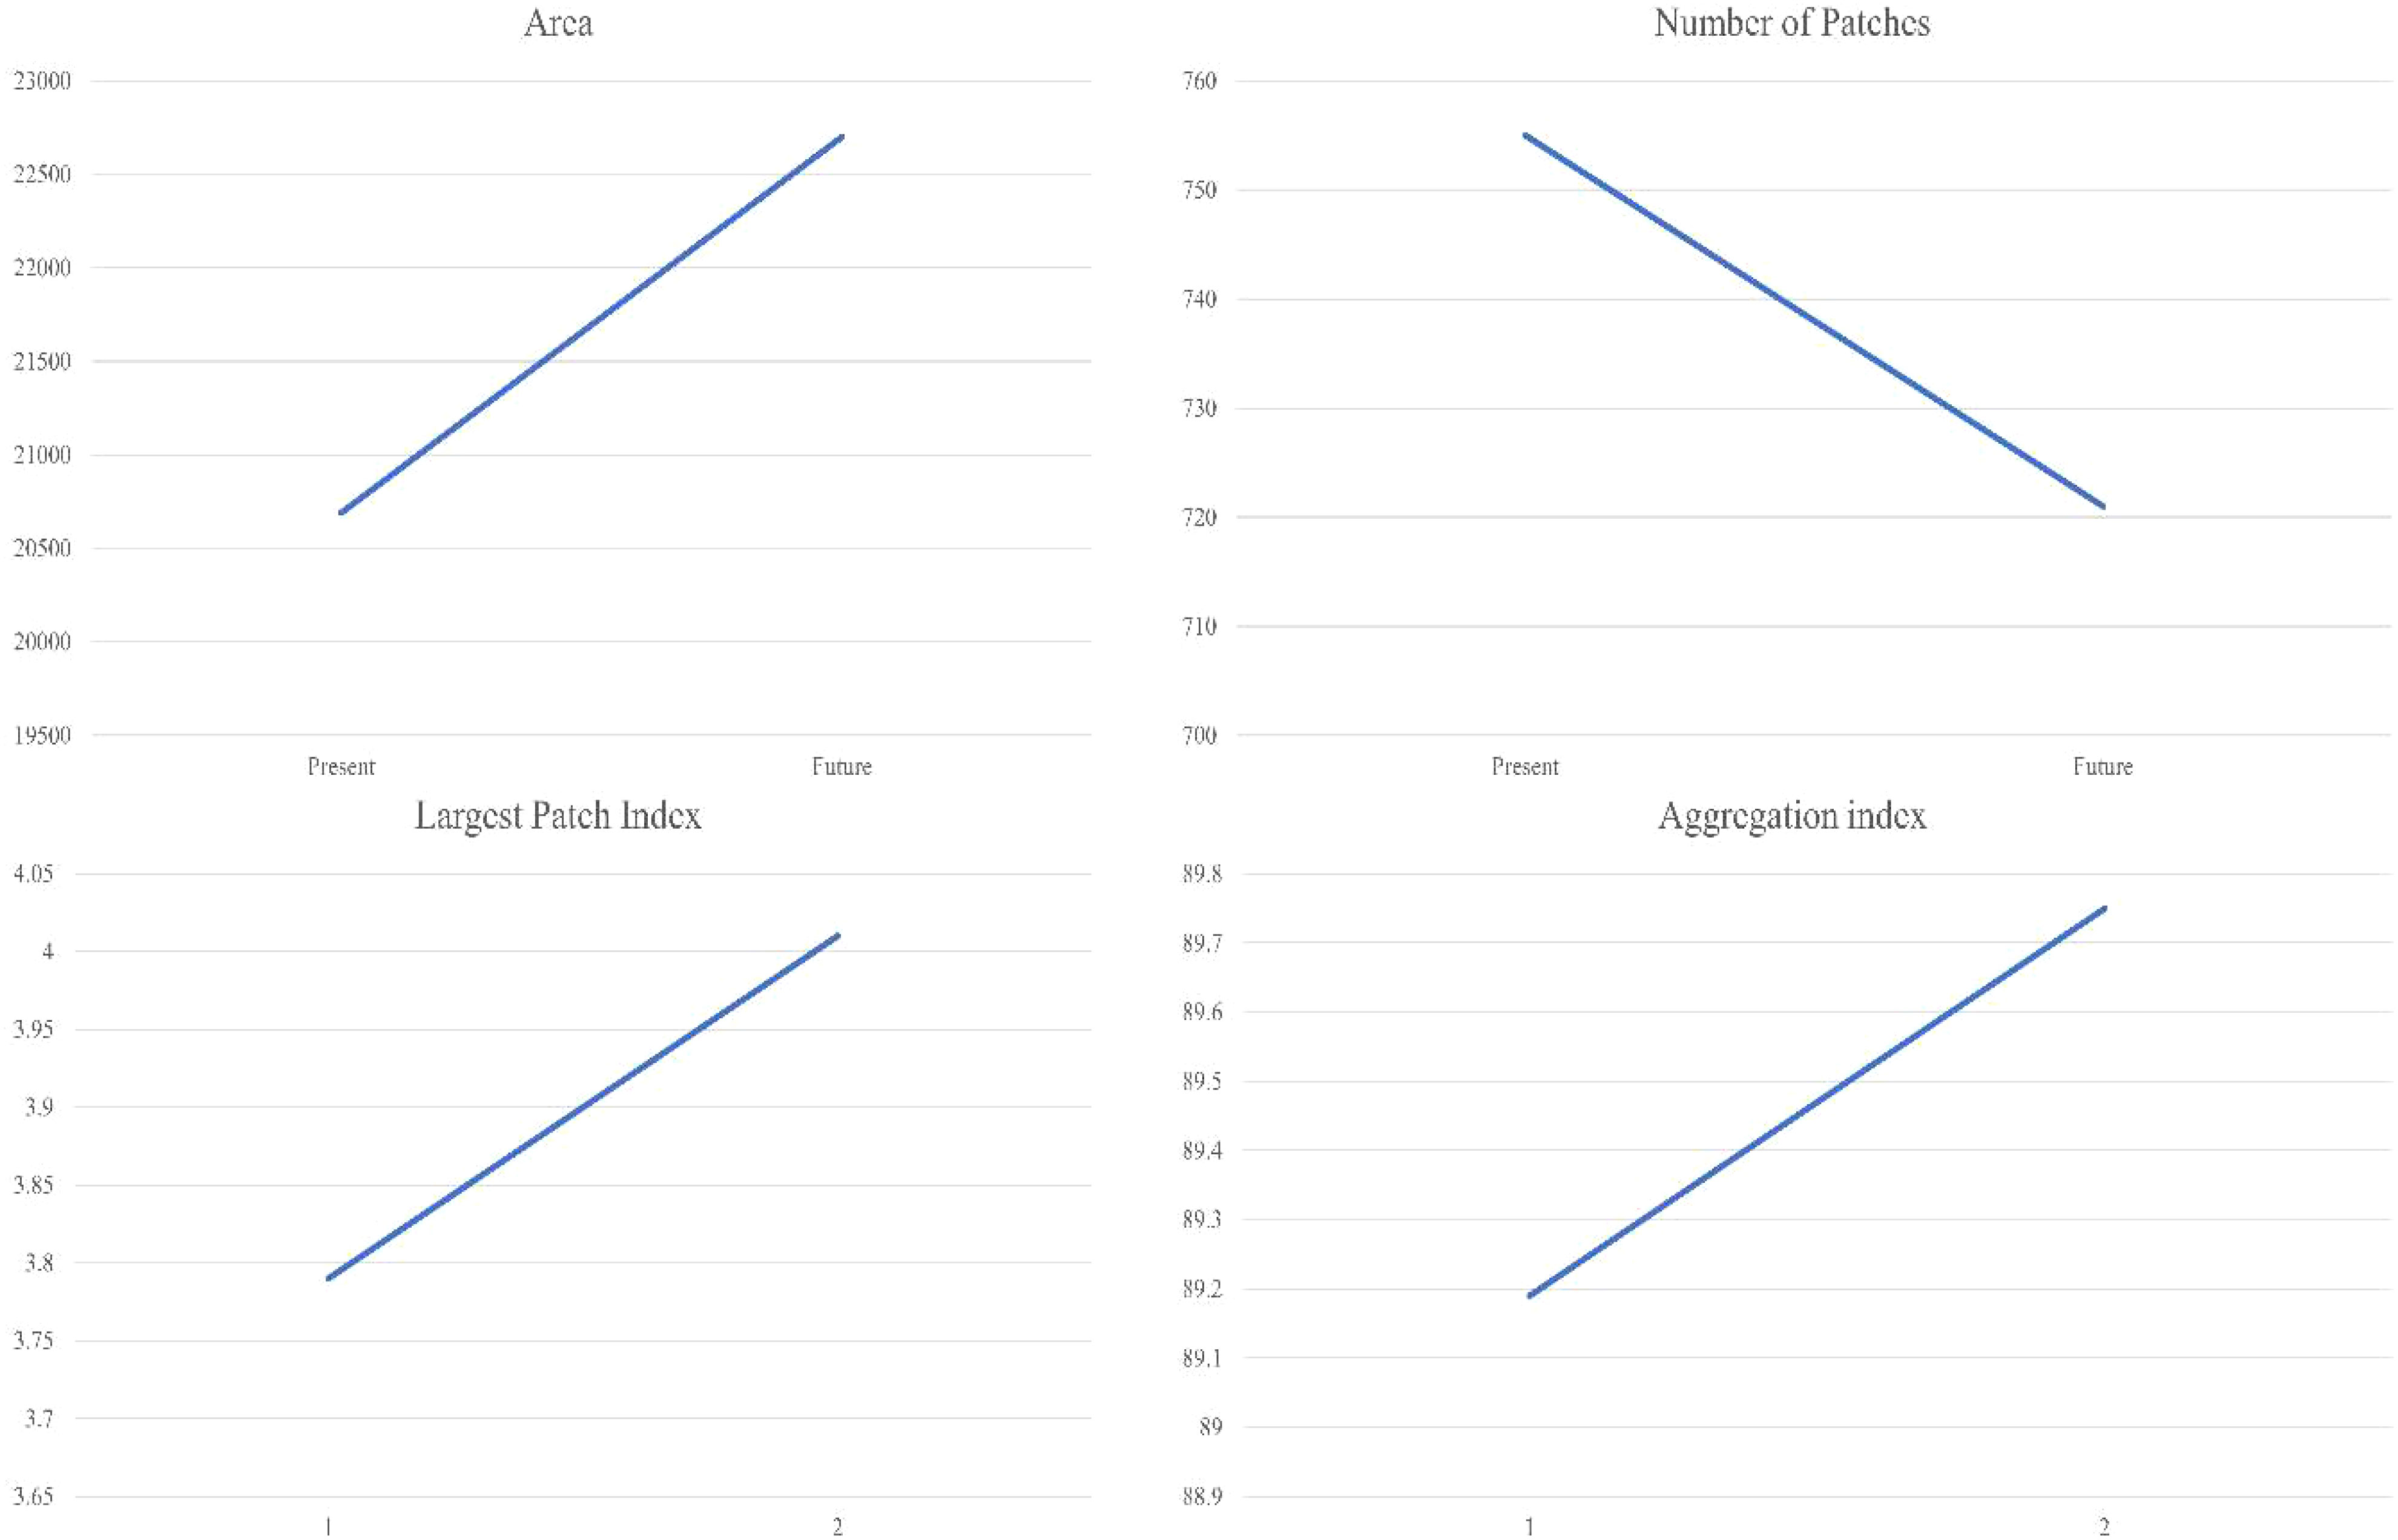
Figure 6 Graphs depicting landscape configuration matrices of KMD in the western Himalayas.
4 Discussion
Land use change has altered the landscape configuration of all the ecosystems, which has resulted in a wholesale replacement and fragmentation of habitats in the Himalayas (Penjor, 2022). In the Himalayan region, habitat fragmentation and degradation because of LULC change, agriculture expansion, industrialisation, and untenable utilisation of natural resources are the primary threats biodiversity faces (Pandit et al., 2007; Chandra et al., 2020; Dutta et al., 2022). The habitat utilisation patterns of a species can hint about the environment they are best adapted for; hence, it is pertinent to evaluate the LULC changes and examine the species’ habitat requirements to make relevant conservation strategies. Therefore, we simulated the future landscape and predicted the present as well as the future distribution ranges of KMD through ensemble modelling for identifying the ecological requirements of the species and its responses to LULC change. The future simulated LULC scrutiny revealed that the croplands (5,501.7 km2) followed by barren areas (4,037.51 km2) had shown a significant decline, whereas the mixed forests have increased (1,456.89 km2).
The results of this study are consistent with previous research conducted by Singh et al. (2018, 2020), indicating that KMD prefers mixed forests dominated by Himalayan birch, Himalayan fir, and blue pine tree species. At present, only 20,690 km2 (6.97%) of the western Himalayas is deemed suitable for KMD, with a marginal increase of 2,722 km2 projected by 2030 (Table 2). The majority of the suitable habitats will be located in Jammu and Kashmir, with only a few patches in Himachal Pradesh (Figure 3). However, suitable habitats in Uttarakhand will remain unchanged in the future scenario (Figure 3). Additionally, the ensemble modelling predicts a loss of 711 km2 in 2030, with 77 km2 falling inside the PAs and 634 km2 outside the PAs. Future LULC simulations support the results of the ensemble modelling, indicating an increase in mixed forests in the future scenario.
Additionally, the transition probability matrix indicates that SLND was converted to grassland while ENF & BF were converted to MF, as presented in Supplementary Table 2. These results suggest that an increase in grasslands and mixed forests within the landscape could provide more feeding habitats and suitable areas for the species in future scenarios. This finding is consistent with the study of Shrestha and Meng (2014), which identified mixed forests as the preferred habitat for musk deer. This is likely due to the territorial nature of musk deer, which leads them to occupy forests that provide shelter, canopy cover to avoid predation and space for latrine sites.
In addition, the mountain ecosystem’s vegetation composition is largely influenced by precipitation and altitude, as demonstrated in studies by Salick et al. (2014) and Zuo et al. (2021). The present study found that precipitation of the coldest quarter (bio19) and elevation were the primary variables positively influencing the distribution of KMD in the Western Himalayas (Figure 4). This positive association with precipitation is consistent with the limiting factor for vegetation growth, which is the availability of moisture during the pre-monsoon season (Singh et al., 2020). Moreover, the predicted KMD distribution range of 2,500–4,500 m suggests that KMD prefers to inhabit higher elevations. This preference may be due to the species’ sensitivity to anthropogenic disturbances, as KMD may seek to avoid human activity by inhabiting areas less accessible to humans. Previous studies have also reported a distribution range for musk deer between 2,500 and 4,200 m (Sathyakumar, 1994; Vinod & Sathyakumar, 1999; Subedi et al., 2012; Ilyas, 2014).
Of the land cover variables, mixed forests were found to be the most influential factor positively determining the distribution of KMD. This finding is in agreement with observations by Singh et al. (2018), who suggest that the canopy cover of mixed forests provides shade and allows the faecal pungency to remain intact for longer, enhancing effective territorial marking and chemical communication. Snow was also found to be a significant factor governing the distribution of KMD in the study area. KMD is well adapted to high-altitude environments, which typically have low temperatures, and this may be due to the species’ pneumatic hair, which acts as insulation against the cold (Green, 1985; Futuyma & Moreno, 1988; Kattel, 1993).
In the current scenario, Valley of Flowers, Govind Pashu Vihar, and Kedarnath WLS offer much of the suitable habitats for KMD among the 34 protected areas. However, Kedarnath WLS is expected to become the most suitable after Valley of Flowers WLS in the future (Figure 5). This is because these protected areas are already under protection and offer more suitable areas for the species hence are important for KMD population viability in the Himalayas.
Habitat configuration analysis indicates decline in the number of patches in the simulated future land use change scenario. Furthermore, we also noticed an increase in the aggregation index by 2030 which suggests that the small patches are aggregating to form larger patches, ultimately resulting in the decline of patch number (Table 2, Figure 6). Our results are supported by the observations of Mukherjee et al. (2021), which suggests the Western Himalayas may show a decline in the patches density as well as fragmentation in the future scenario. Furthermore, the landscape configuration of the suitable habitats within protected areas remained unchanged in the future land use change scenario suggesting better management of suitable habitats within protected areas. Notably, the KMD populations decline is largely attributed to illegal hunting, anthropogenic pressure such as Non-Timber Forest Produce collection, habitat degradation and climate change (Khadka et al., 2017; Singh et al., 2018; Singh et al., 2020). Therefore, the conservation of KMD is critical since it plays a vital role in regulating the vegetation composition and sustaining ecosystem integrity (Green et al., 1987a; Green et al.,1987b). The suitable habitats of KMD in the current and future scenarios may aid managers and other stakeholders in taking informed management actions. This will be valuable in identifying and prioritising areas which can meet their ecological needs of the KMD in the future land use change scenario.
5 Conclusion
Our findings insinuate that the KMD suitable habitats may get reduced and shifted to new areas. The predicted suitable habitat gain is more than the loss of suitable areas in 2030 (Table 1, Figure 3). In the future land use change scenario, a significant portion of the KMD’s suitable habitats in Uttarakhand is predicted to be lost, while new suitable habitats are expected to emerge in Jammu and Kashmir, followed by Himachal Pradesh states (Figure 3). The shift to new areas may negatively affect the population viability of KMD, especially given that the majority of suitable habitats are not protected, and the existing protected areas in the Western Himalayas are insufficient for protecting the endangered species. Thus, it is imperative to bring suitable habitats located in close vicinity to the existing PAs into the protected area network for effective protection and conservation planning. The findings of our study on the anticipated impacts of land use change on KMD can inform decision-making related to the implementation of habitat management activities
Although KMD is a conservation-dependent species, very little is known about its ecological aspects, such as population, habitat and behavioural ecology, which is vital for its long term conservation. Therefore, further research is urgently needed to estimate the population of KMD in its entire distribution range and determine its current status. Furthermore, the population of KMD is threatened due to poaching for musk pods, unsustainable livestock grazing, habitat destruction and climate change (Hu and Jiang, 2011; Nandy et al., 2020; Singh et al., 2020). Hence, for KMD’s long-term viability species conservation action plan for its entire distribution range should be the top priority. Finally, it is noteworthy that most of the threats to KMD are anthropogenic; an integrated conservation program comprising awareness among local people through capacity-building programmes, involvement of local communities, and habitat management seems to be an exigency.
Data availability statement
The original contributions presented in the study are included in the article/Supplementary Material. Further inquiries can be directed to the corresponding author.
Ethics statement
The animal study was approved by MT, Scientist-D & Head, Mammal Section, Zoological Survey of India, Kolkata-700053, India. The study was conducted in accordance with the local legislation and institutional requirements.
Author contributions
AS, LS, and BJ conceived the idea with inputs from AS. VK, HS, and BDJ conducted field survey to collect data on musk deer. AS, BDJ, and LS performed the geospatial analysis and wrote the manuscript. LS, BJ, MT, CG, and CR edited the manuscript. CR, LS, MT, and CG supervised the study. LS led the study and provided the logistic support. All authors contributed to the article and approved the submitted version.
Acknowledgments
We are thankful to the PCCF and Chief Wildlife Wardens of the Governments of Himachal Pradesh, Uttarakhand, and Jammu & Kashmir states for research permits. We acknowledge the support the DFO and other forest officials of the region provided during the field surveys. The authors are thankful to the National Mission for Himalayan Studies (NMHS), the Ministry of Environment, Forest and Climate Change (MoEF&CC), Government of India for the funding support under Grant No. NMHS/2017-18/LG09/02. Authors are grateful to the Director zoological survey of India and the Officer In-charge, Technical Section for providing all necessary support.
Conflict of interest
The authors declare that the research was conducted in the absence of any commercial or financial relationships that could be construed as a potential conflict of interest.
Publisher’s note
All claims expressed in this article are solely those of the authors and do not necessarily represent those of their affiliated organizations, or those of the publisher, the editors and the reviewers. Any product that may be evaluated in this article, or claim that may be made by its manufacturer, is not guaranteed or endorsed by the publisher.
Supplementary material
The Supplementary Material for this article can be found online at: https://www.frontiersin.org/articles/10.3389/fevo.2023.1239905/full#supplementary-material
References
Ali M. (2014). Habitat suitability modelling for exploration of the spatial distribution of Kashmir musk deer in Dachigam National Park. Am. J. Environ. Sci. 10 (5), 446–457. doi: 10.3844/ajessp.2014.446.457
Allouche O., Tsoar A., Kadmon R. (2006). Assessing the accuracy of species distribution models: prevalence, kappa and the true skill statistic (TSS). J. Appl. Ecol. 43 (6), 1223–1232. doi: 10.1111/j.1365-2664.2006.01214.x
Araújo M. B., New M. (2007). Ensemble forecasting of species distributions. Trends Ecol. Evol. 22, 42e47. doi: 10.1016/j.tree.2006.09.010
Aryal A., Brunton D., Raubenheimer D. (2014). Impact of climate change on human-wildlife-ecosystem interactions in the Trans Himalayan region of Nepal. Theor. Appl. Climatol. 115, 517–529. doi: 10.1007/s00704-013-0902-4
Aryal A., Shrestha U. B., Ji W., Ale S. B., Shrestha S., Ingty T. (2016). Predicting the distributions of predator (snow leopard) and prey (blue sheep) under climate change in the Himalaya. Ecol. Evol. 6, 4065–4075. doi: 10.1002/ece3.2196
Aryal A., Subedi A. (2011). The conservation and potential habitat of the himalayan musk deer, Moschus Chrysogaster, in the protected areas of Nepal. Int. J. Conserv. Sci. 2 (2), 127–141.
Bagaria P., Sharma L. K., Joshi B. D., Kumar H., Mukherjee T., Thakur M., et al. (2020). West to east shift in range predicted for Himalayan Langur in climate change scenario. Glob. Ecol. Conserv. 22, e00926. doi: 10.1016/j.gecco.2020.e00926
Bagchi S., Ritchie M. E. (2010). Herbivore effects on above- and belowground plant production and soil nitrogen availability in the Trans-Himalayan shrub-steppes. Oecologia. 164, 1075–1082. doi: 10.1007/s00442-010-1690-5
Brodie J. F. (2016). Synergistic effects of climate change and agricultural land use on mammals. Front. Ecol. Environ. 14, 20–26. doi: 10.1002/16-0110.1
Buisson L., Thuiller W., Casajus N., Lek S., Grenouillet G. (2010). Uncertainty in ensemble forecasting of species distribution. Glob. Change Biol. 16, 1145e1157. doi: 10.1111/j.1365-2486.2009.02000.x
Champion H. G., Seth S. K. (1968). A revised survey of the forest types of India. New Delhi: Government of India Press.
Chandra K., Joshi B. D., Singh A., Bharadwaj M., Thakur M., Sharma L. K. (2020). Current status and distribution of Threatened Vertebrates in Indian Himalayan Region: Focus on conservation and Management Planning (Kolkata, India: Zoological Survey of India), 276.
Chatterjee P., Mukherjee T., Dutta R., Sharief A., Kumar V., Joshi B. D., et al. (2022). Future simulated landscape predicts habitat loss for the Golden Langur (Trachypithecus geei): A range level analysis for an endangered primate. Sci. Total Environ. 826, 154081. doi: 10.1016/j.scitotenv.2022.154081
CITES. (2015) Official documents appendices I, II and III. Convention on international trade in endangered species of wild fauna and flora. Available at: www.cites.org/eng/append/latest_appendices.shtml.
Dutta R., Mukherjee T., Sharief A., Singh H., Kumar V., Joshi B. D., et al. (2022). Climate change may plunder the facultative top predator Yellow-throated Martin from the Hindu-Kush Himalayan Region. Ecol. Inform. 69, 101622. doi: 10.1016/j.ecoinf.2022.101622
Elith J., Graham C. H., Anderson R. P., Dudik M., Ferrier S., Guisan A., et al. (2006). Novel methods improve prediction of species’ distributions from occurrence data. Ecography. 29, 129–151. doi: 10.1111/j.2006.0906-7590.04596.x
Elith J., Leathwick J. R. (2009). Species distribution models: ecological explanation and prediction across space and time. Annu. Rev. Ecol. Evol. Syst. 40, 677e697. doi: 10.1146/annurev.ecolsys.110308.120159
Flynn D. F. B., Gogol-Prokurat M., Nogeire T., Molinari N., Richers B. T., Lin B. B., et al. (2009). Loss of functional diversity under land use intensification across multiple taxa. Ecol. Lett. 12, 22–33. doi: 10.1111/j.1461-0248.2008.01255.x
Futuyma D. J., Moreno G. (1988). The evolution of ecological specialization. Annu. Rev. Ecol. Evol. Syst. 19, 207–233. doi: 10.1146/annurev.es.19.110188.001231
Green M. J. B. (1985). Aspects of the ecology of the Himalayan musk deer. PhD thesis (Cambridge, UK: University of Cambridge), 280pp.
Green M. J. B. (1986). The distribution, status and conservation of the Himalayan musk deer Moschus chrysogaster. Biol. Conserv. 35, 347–375. doi: 10.1016/0006-3207(86)90094-7
Green M. J. B. (1987a). Scent-marking in the Himalayan musk deer (Moschus chrysogaster). J. Zool 1 (4), 721–737. doi: 10.1111/j.1096-3642.1987.tb00752.x
Green M. J. B. (1987b). Diet composition and quality in Himalayan Musk Deer based on fecal analysis. J. Wildlife Manage. 51 (4), 880–892. doi: 10.2307/3801755
Grubb P. (2005). “Artiodactyla,” in Mammal species of the world. A taxonomic and geographic reference, 3rd. Eds. Wilson D. E., Reeder D. M. (Baltimore, USA: Johns Hopkins University Press), 637–722.
Gusian A., Thuiller W. (2005). Predicting species distribution: Offering more than simple habitat models. Ecol. Lett. 8 (9), 993–1009. doi: 10.1111/j.1461-0248.2005.00792.x
Guisan A., Zimmermann N. E. (2000). Predictive habitat distribution models in ecology. Ecol. Model. 135, 147e186. doi: 10.1016/S0304-3800(00)00354-9
Harris R. B., Cai G. Q. (1993). Autumn home range of musk deer in Baizha Forest, Tibetan plateau. J. Bombay Natural History Soc. 90, 430–436.
Hijmans R. J., Cameron S. E., Parra J. L., Jones P. G., Jarvis A. (2005). Very high resolution interpolated climate surfaces for global land areas. Int. J. Climatol. 25, 1965–1978. doi: 10.1002/joc.1276
Hijmans R. J., Elith J. (2014). Species distribution modeling with R. R package version 08-11. Available at: https://rspatial.org/raster/sdm/.
Hu J., Jiang Z. (2011). Climate change hastens the conservation urgency of an endangered ungulate. PloS One 6, e22873. doi: 10.1371/journal.pone.0022873
Ilyas O. (2014). Status, habitat use and conservation of Alpine musk deer (Moschus chrysogaster) in Uttarakhand Himalayas. J. Appl. Anim. Res. 43 (1), 1–9. doi: 10.1080/09712119.2014.899495
Joshi B. D., Sharief A., Kumar V., Kumar M., Dutta R., Devi R., et al. (2019). Field testing of different methods for monitoring mammals in Trans-Himalayas: A case study from Lahaul and Spiti. Glob Ecol. Conserv. 21, e00824. doi: 10.1016/j.gecco.2019.e00824
Kattel B. (1993). Ecology of the Himalayan musk deer in Sagarmatha National Park, Nepal. PhD thesis (USA: Colorado State University), 87pp.
Khadka K. K., Kannan R., Ilyus O., Abbas F., James D. A. (2017). Where are they? Where they will be? In persuit of current and future whereabouts of endangered Himalayan musk deer. Mamm. Biol. 85, 30–36. doi: 10.1016/j.mambio.2017.02.007
Kindt R. (2018). Ensemble species distribution modelling with transformed suitability values. Environ. Model. Software 100, 136e145. doi: 10.1016/j.envsoft.2017.11.009
Kruess A., Tscharntke T. (1994). Habitat fragmentation, species loss, and biological control. Science. 264 (5165), 1581e1584. doi: 10.1126/science.264.5165.1581
Kumar A., Singh B., Sahoo S., Gautam K. B., Gupta S. K. (2022). Genetic evidence indicates new distribution record of endangered Kashmir musk deer (Moschus cupreus) with range expansion in Uttarakhand, India. Oryx. 56 (3), 1–6. doi: 10.1017/S0030605321000417
Lamsal P., Kumar L., Aryal A., Atreya K. (2018). Future climate and habitat distribution of Himalayan Musk Deer (Moschus chrysogaster). Ecol. Inform 44, 101–108. doi: 10.1016/j.ecoinf.2018.02.004
Laws A. N. (2017). Climate change effects on predator–prey interactions. Curr. Opin. Insect Sci. 23, 28–34. doi: 10.1016/j.cois.2017.06.010
Liping C., Yujun S., Saeed S. (2018). Monitoring and predicting land use and land coverchanges using remote sensing and GIS techniques - a case study of a hilly area, Jiangle, China. PloS One 13 (7), e0200493. doi: 10.1371/journal.pone.0200493
McGarigal K. (2015). Fragstats help version 4.2. (Amherst, USA: University of Massachusetts), 1–182.
Mukherjee T., Sharma L. K., Kumar V., Sharief A., Dutta R., Kumar M., et al. (2021). Adaptive spatial planning of protected area network for conserving the Himalayan brown bear. Sci. Total. Environ. 754, 142416. doi: 10.1016/j.scitotenv.2020.142416
Mukherjee T., Sharma L. K., Saha G. K., Thakur M., Chandra K. (2020). Past, Present and Future: Combining habitat suitability and future landcover simulation for long-term conservation management of Indian rhino. Sci.Rep. 10 (1). doi: 10.1038/s41598-020-57547-0
Nandy S., Lakshmi M., Kushwaha S. P. S. (2020). Habitat suitability analysis of himalayan musk deer (Moschus leucogaster) in part of Western Himalaya, India. J. Indian Soc. Remote Sens 48 (11), 1523–1533. doi: 10.1007/s12524-020-01175-8
NEXTGIS. (2017) in Accessed 5 April 2022 (Estonia). Available at: https://nextgis.com/blog/molusce/.
Ostrowski S., Rahmani H., Ali J. M., Ali R., Zahler P. (2016). Musk deer Moschus cupreus persist in the eastern forests of Afghanistan. Oryx. 50, 323–328. doi: 10.1017/S0030605314000611
Pal R., Bhattacharya T., Qureshi Q., Buckland S. T., Sathyakumar S. (2021). Using distance sampling with camera traps to estimate the density of group-living and solitary mountain ungulates. Oryx. 55 (5), 668–676. doi: 10.1017/S003060532000071X
Pandit M. K., Sodhi N. S., Koh L. P., Bhaskar A., Brook B. W. (2007). Unreported yet massive deforestation driving loss of endemic biodiversity in Indian Himalaya. Biod. Cons. 16, 153–163. doi: 10.1007/s10531-006-9038-5
Penjor U. (2022). Biodiversity and global land-use change in Bhutan: a model for the Himalayas [PhD thesis]. (Oxford, England: University of Oxford). 447Pp.
Rathore P., Roy A., Karnatak H. (2022). Predicting the future of species assemblages under climate and land use land cover changes in Himalaya: A geospatial modelling approach. Clim. Change Ecol. 3, 100048. doi: 10.1016/j.ecochg.2022.100048
Salick J., Ghimire S. K., Fang Z., Dema S., Konchar K. M. (2014). Himalayan alpine vegetation, climate change and mitigation. J. Ethnobiol. 34 (3), 276–293. doi: 10.2993/0278-0771-34.3.276
Sathyakumar S. (1994). Habitat ecology of ungulates in Kedarnath musk deer sanctuary. PhD Dissertation. Saurashtra University Rajkot p, 244.
Schaller G. B. (1977). Mountain monarchs: wild sheep and goats of the himalayas (Chicago: University of Chicago Press).
Sharief A., Joshi B. D., Kumar V., Singh H., Singh V. K., Dar S. A., et al. (2023). Empirical data suggest that the kashmir musk deer (Moschus cupreus, grubb 1982) is the one musk deer distributed in the Western Himalayas: an integration of ecology, genetics and geospatial modelling approaches. Biology 12, 786. doi: 10.3390/biology12060786
Shrestha B. B., Meng X. (2014). Spring habitat preference, association and threats of Himalayan musk deer (Moschus leucogaster) in Gaurishankar Conservation Area, Nepal. Int. J. Conserv. Sci. 5, 535–546.
Shukla M., Joshi B. D., Kumar V. P., Thakur M., Mehta A. K., Sathyakumar S., et al. (2018). Species dilemma of musk deer (Moschus spp) in India: molecular data on cytochrome c oxidase I suggests distinct genetic lineage in Uttarakhand compared to other Moschus species. Anim. Biotechnol. 30 (4), 1–9. doi: 10.1080/10495398.2018.1521822
Singh P. B., Mainali K., Jiang Z., Thapa A., Subedi N., Awan M. N., et al. (2020). Projected distribution and climate refugia of endangered Kashmir musk deer Moschus cupreus in greater Himalaya, South Asia. Sci. Rep. 10 (1). doi: 10.1038/s41598-020-58111-6
Singh P. B., Saud P., Cram D., Mainali K., Thapa A., Chhetri N. B., et al. (2018). Ecological correlates of Himalayan musk deer Moschus leucogaster. Ecol. Evol. 9 (1), 4–18. doi: 10.1002/ece3.4435
Subedi A., Aryal A., Koirala R. K., Timilsina Y. P., Meng X., McKenzie F. (2012). Habitat ecology of Himalayan Himalayan Musk Deer (Moschus chrysogaster) in Manaslu Conservation Area, Nepal. Int. J. Zool. Res. 8 (2), 81–89. doi: 10.3923/ijzr.2012.81.89
Syed Z., Ilyas O. (2012). Status, distribution and aspects of ecology of Alpine Musk Deer (Moschus chrysogaster) in Uttarakhand Himalayas India. DSG Newsletter, N 24 (3), 4–12.
Thuiller W., Georges D., Engler R., Breiner F. (2016). biomod2: ensemble platform for species distribution modeling. R Package version 3, 3e7.
Thuiller W., Lafourcade B., Engler R., Araújo M. B. (2009). BIOMOD platform for ensemble forecasting of species distributions. Ecography. 32, 369e373. doi: 10.1111/j.1600-0587.2008.05742.x
Timmins R. J., Duckworth J. W. (2015) Moschus cupreus. The IUCN Red List of Treatened Species 2015: e.T13901A61977764. Available at: http://www.iucnredlist.org/details/13901/0.
Ullah S., Ahmad K., Sajjad R. U., Abbasi A. M., Nazeer A., Tahir A. A. (2019). Analysis and simulation of land cover changes and their impacts on land surface temperature in a lower Himalayan region. J. Environ. Manage. 24 (5), 34 8–34357. doi: 10.1016/j.jenvman.2019.05.063
Vinod T. R., Sathyakumar S. (1999). “Ecology and conservation of mountain ungulates in Great Himalayan National Park, Western Himalaya,” in An ecological study of the conservation of biodiversity and biotic pressures in the Great Himalayan National Park Conservation Area – An ecodevelopment approach. (Dehradun, India: Willdife Institute of India), 1–92. FREEP-GHNP 03.
Wangdi T., Tobgay S., Dorjee K., Dorji K., Wangyel S. (2019). The distribution status and conservation of the Himalayan Musk Deer Moschus chrysogaster in Sakteng Wildlife Sanctuary. Glob Ecol. Conserv. 17, e00466. doi: 10.1016/j.gecco.2018.e00466
Warren D. L., Glor R. E., Turelli M. (2010). Enmtools: a toolbox for comparative studies of environmental niche models, evaluation. Ecography 31, 161–175. doi: 10.1111/j.1600-0587.2009.06142.x
Keywords: land use simulation, habitat suitability, fragmentation, Kashmir musk deer, Western Himalayas
Citation: Sharief A, Kumar V, Joshi BD, Singh H, Bhattacharjee S, Dutta R, Dar SA, Ramesh C, Graham CH, Thakur M and Sharma LK (2023) Towards effective conservation planning: integrating landscape modelling to safeguard the future of the endangered Kashmir musk deer in the face of land use change. Front. Ecol. Evol. 11:1239905. doi: 10.3389/fevo.2023.1239905
Received: 19 June 2023; Accepted: 22 September 2023;
Published: 16 October 2023.
Edited by:
Sandeep Kumar Gupta, Wildlife Institute of India, IndiaReviewed by:
Vishnupriya Kolipakam, Wildlife Institute of India, IndiaRandeep Singh, Amity University, India
Copyright © 2023 Sharief, Kumar, Joshi, Singh, Bhattacharjee, Dutta, Dar, Ramesh, Graham, Thakur and Sharma. This is an open-access article distributed under the terms of the Creative Commons Attribution License (CC BY). The use, distribution or reproduction in other forums is permitted, provided the original author(s) and the copyright owner(s) are credited and that the original publication in this journal is cited, in accordance with accepted academic practice. No use, distribution or reproduction is permitted which does not comply with these terms.
*Correspondence: Lalit Kumar Sharma, bGFsaXRnYW5nYUBnbWFpbC5jb20=