- Resource Environment and Regional Economic Research Center, Xi’an University of Finance and Economics, Xi’an, China
Accurately grasping the correlation of digital economy between cities is an important foundation for scientifically formulating regional coordinated development strategies, and also an important entry point for achieving the goal of “carbon peaking and carbon neutrality”. Using data for 248 cities in China from 2011 to 2019, social network analysis is conducted to examine the overall and individual characteristics of the digital economy network (DEN), and the effects of the DEN’s central characteristics on carbon emissions are empirically assessed. Research conclusions include the following: first, the digital economy of these 248 cities in China exhibits a clear spatial network structure, but the overall network structure is relatively loose, with fewer connections between cities, representative of the initial form of the network. Second, the Yangtze River Delta Urban Agglomeration, as represented by Wuxi, Suzhou, and Nanjing, occupies a core position in the network. Only 35 cities fulfil an intermediary role, influencing the connections between other cities. More than 40% of cities are strongly connected with nondirect partners. Third, the improvement in the central position of the DEN significantly increases carbon emissions, but the direction and intensity exhibit high heterogeneity with differences in resource endowment and population size. Fourth, the central characteristics of the DEN indirectly promote carbon emissions by increasing energy consumption. These research findings complement the existing research on the relationship between DEN and carbon emissions, providing valuable policy implications for governments and scholars.
1 Introduction
The negative effects of climate change, such as the frequent occurrence of extreme weather and glacier melting events, have become increasingly apparent on a global scale. Carbon emissions are considered the main culprit driving climate change, and the continuous increase in carbon emissions in recent years has raised concerns worldwide (Song et al., 2023). Therefore, reducing carbon emissions, building a low-carbon society, and promoting sustainable economic development have become a consensus among global governments (Chen et al., 2023). Based on the data in the “BP World Energy Statistics Yearbook”, China’s carbon emissions accounted for approximately 33% of global emissions in 2021, ranking first in the world (BP, 2022). Therefore, the Chinese government has proposed to strive to achieve a carbon peak in 2030 and carbon neutrality by 2060 (Yang et al., 2022). This is an inevitable choice for China to address its prominent resource and environmental constraints and achieve sustainable economic development. Ecological priority and green low-carbon strategies comprise the foundation for China’s future high-quality development.
Meanwhile, China’s digital economy is rapidly growing. As a new type of economy, the digital economy relies heavily on information networks and data resources, which can improve the economic efficiency and optimize the economic structure (Ozturk and Ullah, 2022; Guo et al., 2023). Based on the research of the Chinese Academy of Information and Communications Technology (China), the scale of China’s digital economy reached 39.2 trillion yuan in 2020, accounting for 38.6% of its GDP. As a new engine of national economic prosperity, China’s digital economy has emerged as a key driving force for its economic development, which has attracted unprecedented attention (Han and Jiang, 2022; Wang et al., 2022). At present, the integration of the digital economy and the real economy is accelerating, and new-generation digital technologies such as big data, artificial intelligence and blockchain continue to promote all-round transformation of China’s economy into new production, new management and new lifestyle patterns such as digital industrialization and digital governance. Of course, traditional physical enterprises can also use digital technology to optimize their industrial layout and make more accurate investment decisions (Dong et al., 2023).
With deep integration and application innovation of digitalization in the fields of resource and tenvironment, digital technology has gained a great deal of attention as a means of achieving carbon neutrality (Yu et al., 2022; Wang et al., 2023). There has been a controversy in academia regarding how the digital economy impacts carbon emissions. On the one hand, the digital economy has significantly restrained carbon emissions. Digitalization could facilitate enterprise management transformation, realize accurate monitoring, measurement and prediction of carbon emissions, help to scientifically plan the energy consumption structure and improve the energy efficiency to directly reduce carbon emissions (Wang and Shao, 2023). The digital economy promotes the sharing of innovative technology and knowledge between enterprises, thereby reducing search costs (Tang et al., 2022). As part of the digital economy, innovative resources and factors are directed towards high-productivity industries, and the resource allocations are optimized (Ren et al., 2021). By effectively integrating various resources, a whole digital industry chain can be constructed to reduce carbon emissions in all links (Amuso et al., 2020). Therefore, the innovation and technological progress in the digital economy can reduce carbon emissions (Cheng et al., 2023). On the institutional side, corruption can be combated and tax compliance can be strengthened through digitalization for low-carbon economic development (Fanea-Ivanovici et al., 2019). On the other hand, carbon emissions may increase as a result of the digital economy. For instance, when the digital economy is in its infancy, the large-scale construction of digital infrastructure and rapid growth in internet penetration will inevitably increase power and energy consumption levels, thus increasing carbon emissions (Salahuddin and Alam, 2016; Li et al., 2020; Hao Y. et al., 2022). The increase in the demand and supply of information and technology-intensive products is usually positively correlated with energy consumption, leading to an increase in carbon emissions. Internet development has increased energy consumption through economic growth (Ren et al., 2021). The upgrading and adoption of digital technology and the construction of data centers can result in the consumption of more resources and increase carbon emissions (Dong K.Y. et al., 2022). Expanding investment in digital equipment and infrastructure, as well as digitizing traditional industries, will promote pollutant emissions and energy consumption (Wang et al., 2022). In China, the rapid increase in transportation demand due to online shopping and delivery industries has exacerbated carbon emissions (Chen et al., 2020). China’s bitcoin blockchain generates 13.05 billion tons (MT) of CO2 each year (Jiang et al., 2021). There are also end-user devices, such as smartphones, whose power emissions are the most important contributors (Ruiz et al., 2022). In summary, the digital economy cannot be greenized, and its development should slow down. Other scholars believe that the development of China’s digital economy is still at the stage of transition from the embryonic stage to the early stage, and the impacts of the different stages of development of digital technology on carbon emissions vary (Hao Y. et al., 2022). Therefore, there exists an inverted U-shaped relationship between the two (Zhang W. et al., 2022).
Recently, social network analysis (SNA) method has been widely used in population mobility, urban spatial structure, international trade, technological innovation and other fields (Norbutas and Corten, 2018; Hamilton et al., 2019; Yu and Ma, 2020; Zhang et al., 2020; Leng et al., 2021; Meng et al., 2021). In addition, the SNA method has been applied in the fields of environment and energy to reveal the spatial correlation characteristics of environmental change, such as carbon emissions (Bai et al., 2020; Shen et al., 2020), pollution control (Su and Yu, 2019), energy consumption (Liu et al., 2020; Wang and Liu, 2023), natural gas consumption (Bu et al., 2020; Li and Li, 2022), weather and market information networks (Simon et al., 2021), tourism economy (Gan et al., 2021), and so on. Among them, research on carbon emission network in a certain region is relatively common, such as OECD countries, as well as provinces, cities, and urban agglomerations in China. Moreover, scholars have further analyzed the technology spillover effects of environmental regulation on carbon emission network based on the characteristics of network structure (Jiang and Ma, 2021). At the same time, some scholars have also used SNA method for research on the digital economy. For example, Chen and Zhu (2021) used data from China’s top 500 new economy enterprises to study the impact of China’s digital economy on urban network structure. Tang et al. (2021) used data from 2004 to 2019 to study the network structure characteristics of the digital economy at the provincial level in China. Zhong et al. (2022) used data from 30 provinces in China from 2010 to 2019 to study the relationship between digital economy and its network structure characteristics, as well as carbon emissions decoupling. However, in general, SNA is seldom used in the field of digital economy, and there is no research on digital economy network (DEN) of prefecture-level city and urban agglomerations in China.
As mentioned earlier, existing literatures have examined the relationship between the digital economy and carbon emissions through different methods, laying the foundation for subsequent research. However, most literature currently does not consider the impact of the network structure characteristics of the digital economy on carbon emissions. The SNA method has unique advantages, as it can not only directly reflect association features, but also intuitively and concisely reveal association features by constructing spatial association network (Jiang and Ma, 2021). The application of this method in environmental economics is still relatively small, which provides an opportunity for this study. In summary, there is no unified opinion about how the digital economy affects carbon emissions in academia. In addition, due to the large-scale construction of digital infrastructure and rapid development of the digital economy, interconnection between different regions is becoming increasingly frequent and pronounced, so a spatial network of the digital economy has been formed nationwide. Therefore, what are the specific characteristics of this DEN? What is the relationship between DEN and carbon emissions? Few researchers have addressed these issues. This paper aims to sort out and answer the above two core questions, which can not only clarify the structural characteristics of the digital economy network, but also help us to comprehensively understand the impact of DEN on carbon emissions from a spatial perspective, thereby helping cities to develop the digital economy in a targeted manner and formulate collaborative emission reduction policies. Carbon emissions and energy consumption are largely attributed to cities, which form the backbone of the digital economy strategy (Dong and Li, 2022). Compared to those at the provincial level, the characteristics of the DEN and its relationship with carbon emissions can be explored more carefully at the city level, which is more conducive to realizing regional collaborative carbon emission reduction (Wang et al., 2022). Therefore, in this paper, SNA is used to explore the DEN and its impact on carbon emissions in 248 cities in China. Here are the main contributions:
1. Based on relational data and the network perspective, a corrected gravity model is adopted to construct a DEN of 248 cities in China, and the structural morphology of the DEN is more comprehensively revealed from the perspective of cities, thus enriching the quantitative analysis of the DEN. This helps to have a clear understanding of the evolution process of the digital economy network and provides a new research perspective for future research.
2. Through the three indicators of the degree centrality, betweenness centrality and eigenvector centrality, the status and role of cities in the DEN are determined, and the above three indicators are adopted as explanatory variables to examine the impact of the DEN’s central characteristics on carbon emissions. This helps to accurately identify the impact mechanism of DEN’s central characteristics on carbon emissions, reveal their long-term dynamic relationship.
3. According to the differences in natural resource endowment and urban scale between the sample cities, the heterogeneity of the effect of the DEN’s central characteristics on carbon emissions is examined, and the impact mechanism is investigated with energy consumption as an intermediary variable. This helps to develop carbon reduction policies tailored to local conditions and characteristics.
The rest of this paper is organized as follows. Section 2 introduces the methods and materials, and the results and discussion are presented in Section 3. Section 4 provides a discussion. The conclusions and policy implications are outlined in Section 5.
2 Materials and methods
2.1 Study area
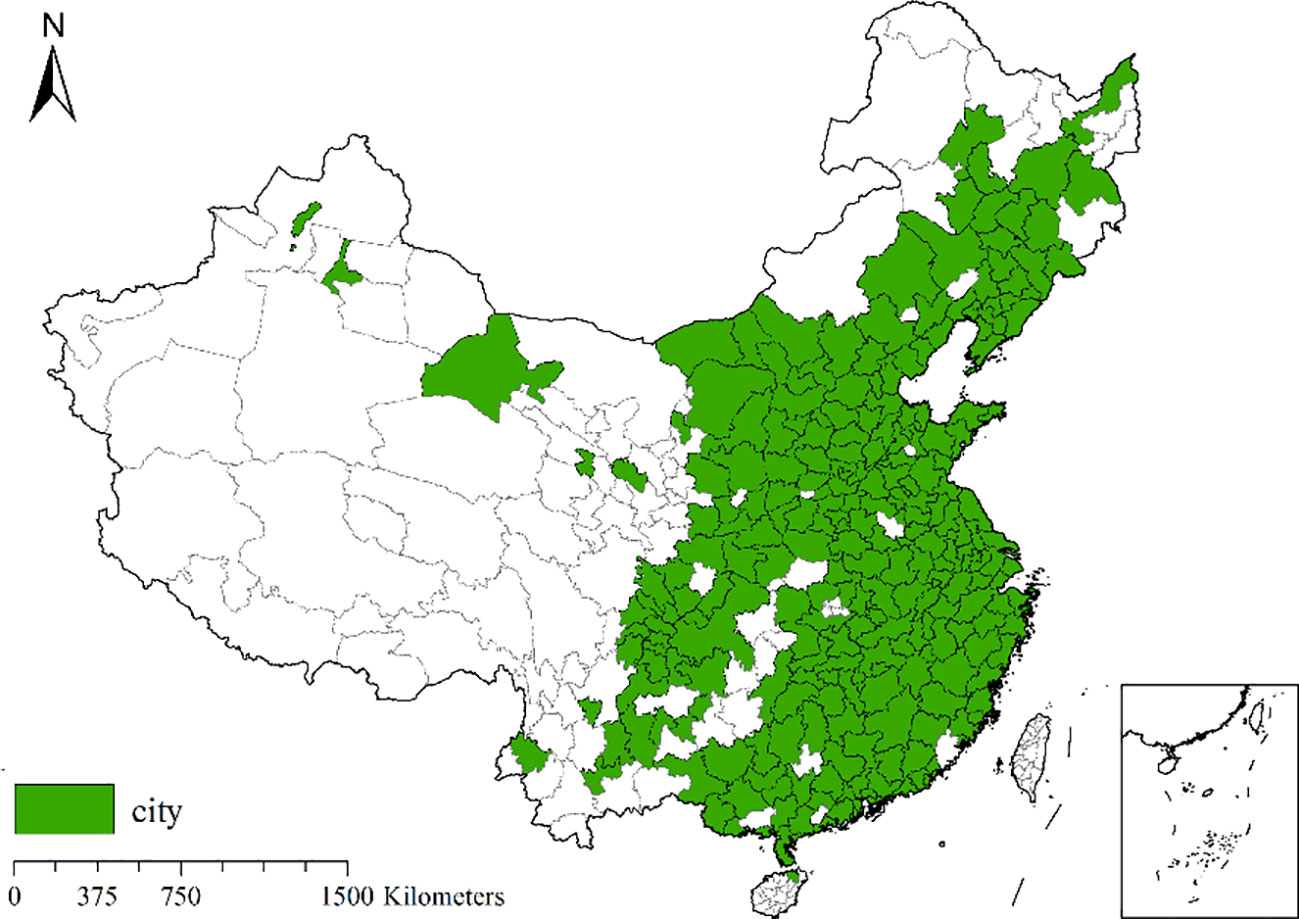
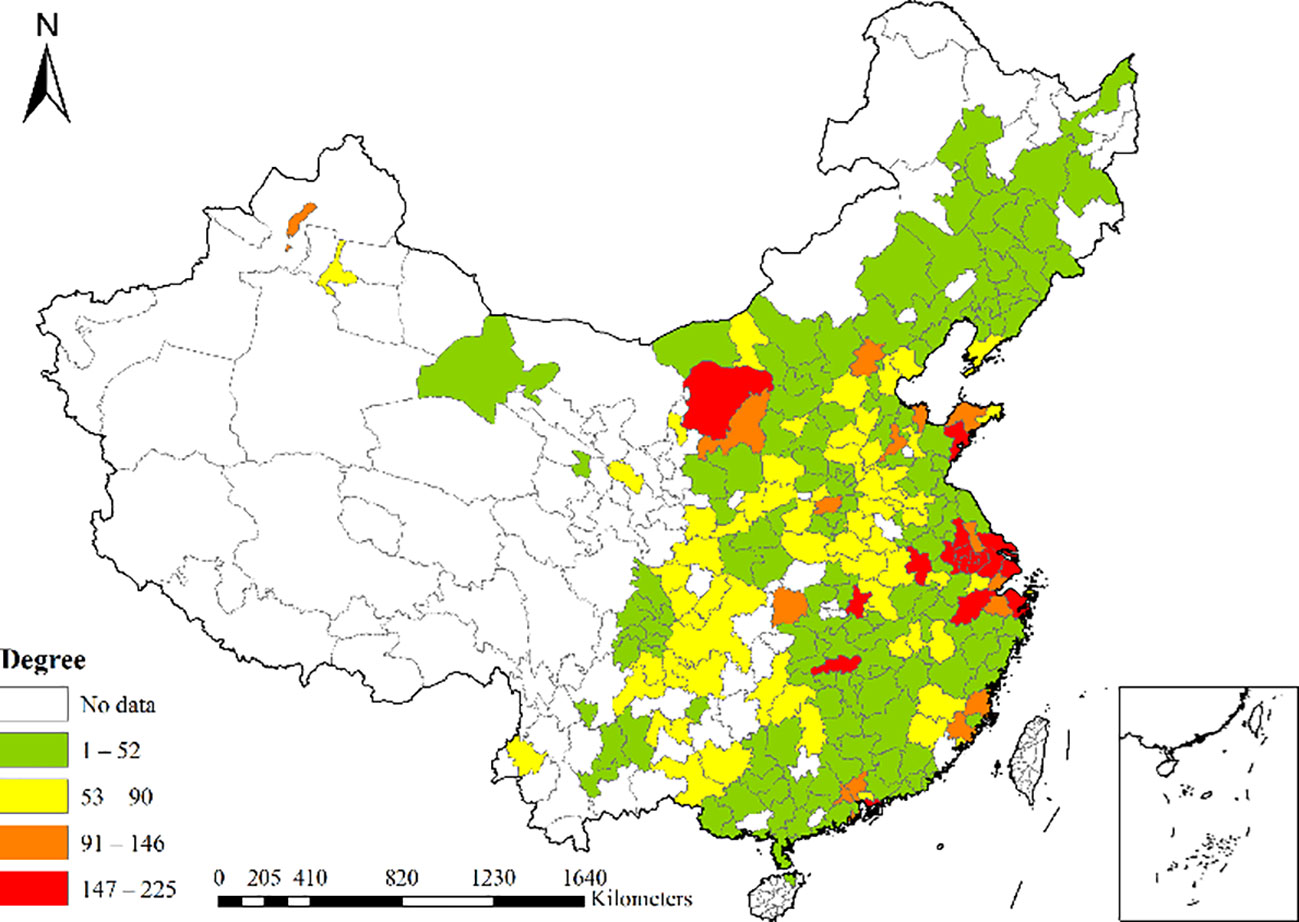
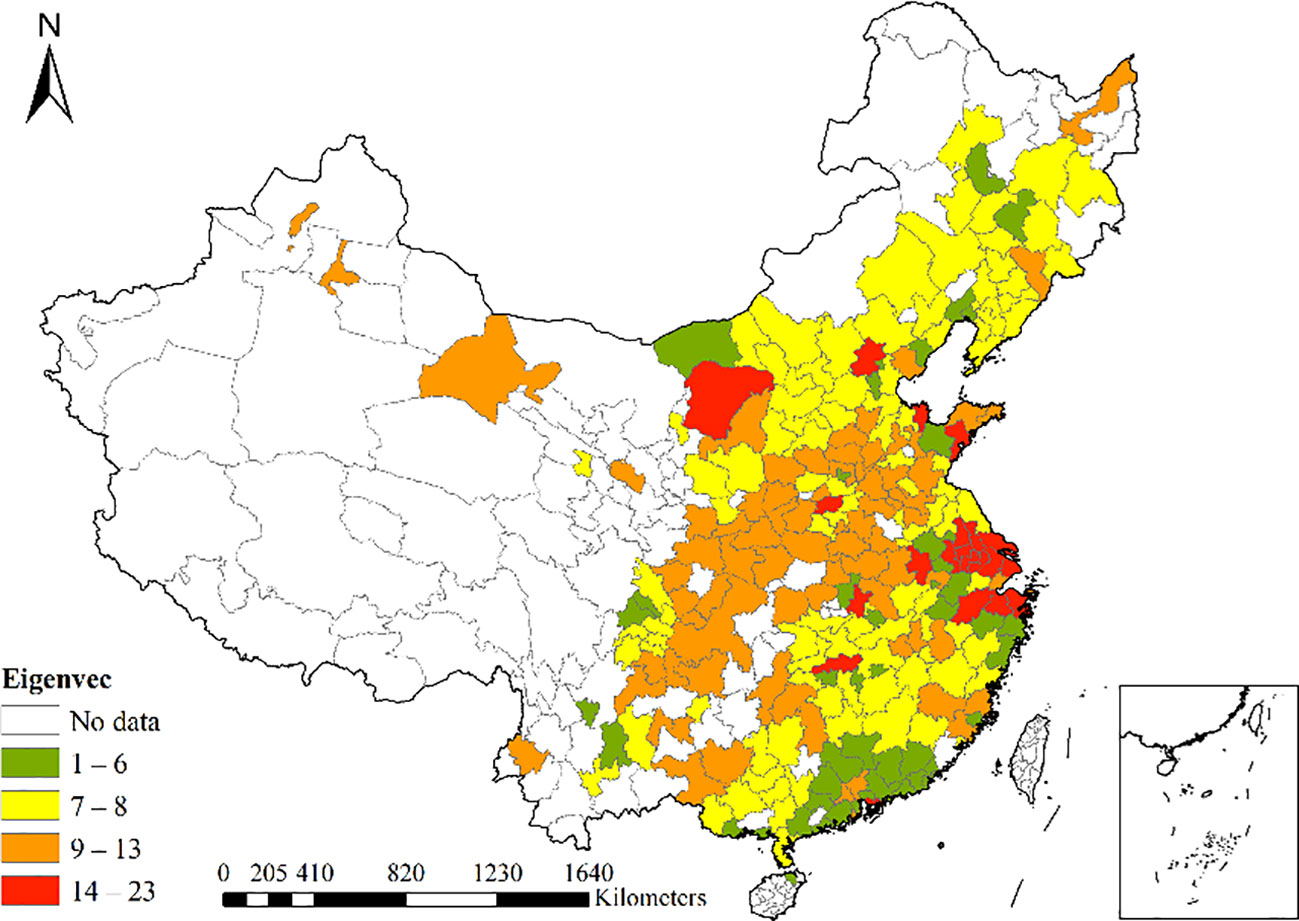
Cities with an average regional GDP in the top 90% of China from 2011 to 2019 are chosen in this study. As shown in Figure 1, color denotes the study area, and white denotes the nonstudy area. Most of the cities selected are located to the east of the Hu Line, where the population accounts for more than 90% of the total population of China, with excellent infrastructure construction, convenient transportation, a more developed economy and a favorable foundation for digital economy development.
2.2 Gravity model
The traditional gravity model calculates gravity based on the mass and distance between two objects, but does not consider the correlation between research objects and the bidirectional and asymmetric nature of regional economic factors, and needs to be improved (Dong and Li, 2022). The revised gravity model utilizes cross-sectional data to describe spatial correlation evolution, and combines factors such as geographic distance, economic development, and population to describe regional connection strength. Choosing a gravity model to create a spatial correlation network has advantages in describing inter regional relationships and spatial dynamic evolution trends (Kuik et al., 2019; Hao Y. et al., 2022). This paper draws inspiration from the research ideas of Fan and Xiao (2021) and modifies the gravity model as follows:
where Yij is the digital economic gravity between cities i and j, Pi and Pj are the populations of cities i and j, respectively. Gi and Gj are the regional GDPs of cities i and j, respectively. Ti and Tj are the digital economic indicators of cities i and j, respectively. Dij is the geographical distance between cities i and j. pgdpi and pgdpj are the per capita GDPs of cities i and j, respectively. Moreover, kij is the weighted proportion coefficient of the digital economy index between cities i and j.
According to the revised gravity matrix, the correlation matrix between cities can be calculated. To facilitate description, the correlation matrix is binarized to form a new matrix I. As expressed in equation (2), Ai is the average value of each row in the matrix Yij.
2.3 Network characteristic indicators
2.3.1 Overall network characteristics indicator
We use the network density to describe the overall characteristics of the DEN. The higher the network density, the closer the relationship of the digital economy between cities is. Network density can be obtained as follows:
where n is the number of nodes, and d(ki, kj) is the number of relationships between nodes ki and kj.
2.3.2 Individual network characteristic indicator
The degree centrality refers to the degree of direct correlation between a city and other cities. A higher value suggests that city i is more connected to other cities in the DEN, i.e., the city is at the center of the network. This index can be calculated with equation (4), where n is the number of cities directly associated with a given city and N is the number of cities.
Betweenness centrality is a measure of a city’s control over other cities. The higher the value, the more city i is located at a controlling position within the network and plays a bridging or intermediary role. As expressed in equation (5), gjk(i) is the number of shortest correlation paths between cities i and j, and gjk is the number of all shortest correlation paths between cities j and k, with k ≠ j ≠ i and j < k.
The eigenvector centrality reflects the ability of city i to indirectly affect other cities. The higher the value, the greater the ability of city i to indirectly affect other cities. As expressed in equation (6), g = [gij] is the adjacency matrix of the network, and is the largest characteristic value of the matrix g module, which is the unit root.
2.4 Econometric model
To explore how the DEN’s central characteristics affect carbon emissions, the following econometrical model is constructed:
where i denotes the city, t denotes the time, CEit denotes the carbon emissions, and Cenit denotes the central characteristics of the DEN, including the degree centrality (Deg), betweenness centrality (Bet) and eigenvector centrality (Eig). Conit denotes the control variables, and ϵit is the random disturbance term.
Additional to the total effect expressed in equation (7), the DEN’s central characteristics may indirectly impact carbon emissions through intermediary mechanisms. According to literature analysis, energy consumption may play an intermediary role, and the following intermediary effect model can be established:
where ECit is energy consumption, and the other variables are defined the same as those in equation (7).
2.5 Variable description
Digital economy (DE): Scholars at home and abroad have proposed different statistical indicators and measurement methods for the digital economy. However, there is currently no unified evaluation index system (Zhang et al., 2023). In this paper, the method of Zhang W. et al. (2022) is used to calculate the digital economy index. The specific indicators include the number of internet broadband access users, computer services and software industry practitioners, the total telecommunications business per capita, the number of mobile phone users, and the digital inclusive financial index. The composite index value can be obtained by principal component analysis.
Carbon emissions (CE): At present, there are two main methods to measure carbon emissions: one is the departmental accounting method, and the other is the apparent emission accounting method. The carbon emission data in this paper are retrieved from the Carbon Emission Accounts and Databases (CEADs) of Tsinghua University in China, which has been widely used in existing research because of its importance.
The IPAT model measures the impacts of socioeconomic factors on the environment from demographic, economic and technological perspectives. Therefore, to avoid deviation in the empirical test results caused by the omission of important explanatory variables, referring to relevant research, the industrial structure, population, government intervention, openness and environmental regulation are chosen as control variables in this study. The specific indicators are as follows: the industrial structure (IS) is expressed by the proportion of the added value of the tertiary industry in the GDP. The energy consumption of tertiary industry is relatively low, so increasing the proportion of tertiary industry is considered to be an important way to reduce carbon emissions (Xue et al., 2022). The population (Por) is expressed in terms of the population per square kilometre. Generally speaking, the denser the population, the more economic activities, and the greater the carbon emissions. Government intervention (Gov) is measured by the share of the general public budget expenditure in the GDP. Achieving economic growth is an important task for local governments, which may lead to local governments sacrificing some environmental benefits for economic benefits, thereby increasing carbon emissions (Lan et al., 2021). Openness (Open) is expressed as the proportion of the total import and export trade to the GDP. Due to environmental policy restrictions in developed countries, multinational corporations tend to shift high energy consuming and polluting industries to developing countries, resulting in a “pollution paradise” effect and increasing carbon emissions in developing countries (Zhao et al., 2022). Environmental regulation (ER) is expressed by the sulfur dioxide removal rate. Environmental regulation is considered one of the important ways to reduce carbon dioxide (Wang and Zhang, 2022). The energy consumption (EC) is expressed by the proportion of the total electricity consumption of each city to the household registration population. The rise of the early digital economy industry, such as online shopping, e-commerce live streaming, and virtual games, led to an increase in energy consumption, thereby exacerbating carbon emissions (Hao X. et al., 2022).
2.6 Data sources
To ensure the continuity and availability of the sample data, combined with the adjustment of administrative divisions and missing data, as well as the computing power constraints of UCINET software, 248 cities in China are selected as samples. The index data mainly comes from the China Urban Statistical Yearbook and the urban statistical yearbook, and any missing values are supplemented by linear imputation. The distance between cities is expressed in terms of the geographic distance.
3 Results and discussion
3.1 Overall network characteristics of the DEN
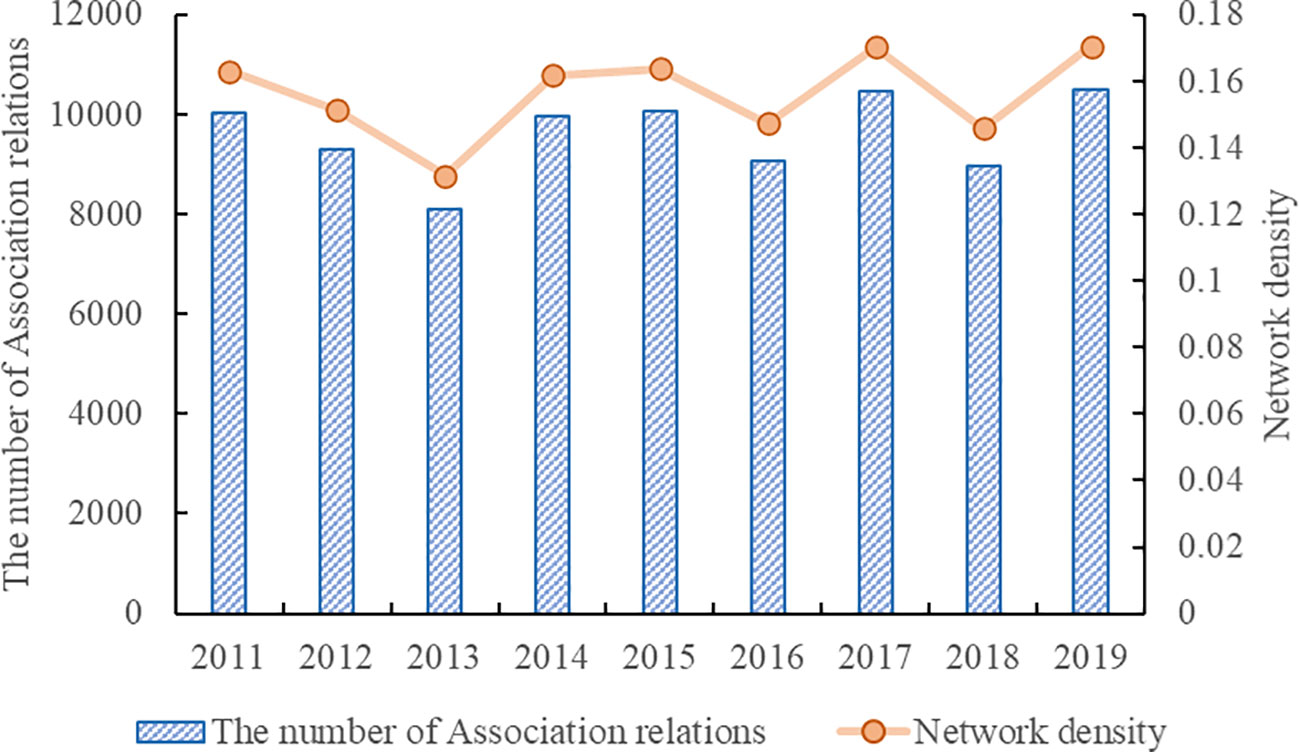
The network density is adopted to describe the overall characteristics of the DEN to reveal the closeness between cities within the network. Because the sample comprises 248 cities in China, the maximum number of associations is 248 × (248 − 1) = 61,256. The network density is calculated in UCINET, and the results are shown in Figure 2. In the network, the number of links over time is higher than 8,000. Except for 2013 and 2018, the network density varied between 0.14 and 0.17. Among them, the network density in 2013 was the lowest, at only 0.1317. The possible reason is that global industrial production and trade were weak in 2013, international financial markets continued to fluctuate, and the links of the digital economy between Chinese cities were hampered by the continued downturn in the overall economy. However, since 2014, big data was incorporated into the central government work report, so the network density rebounded to 0.1618. From 2014 to 2019, the network density showed a spiral upward trend, reaching the highest value of 0.1706 in 2019. Generally, in addition to the downward trend from 2011 to 2013, the network density showed an upward trend from 2013 to 2019. In short, the number of digital associations between Chinese cities was relatively sparse, and the network structure was relatively loose.
3.2 Individual characteristics of the DEN
3.2.1 Dynamic distribution characteristics
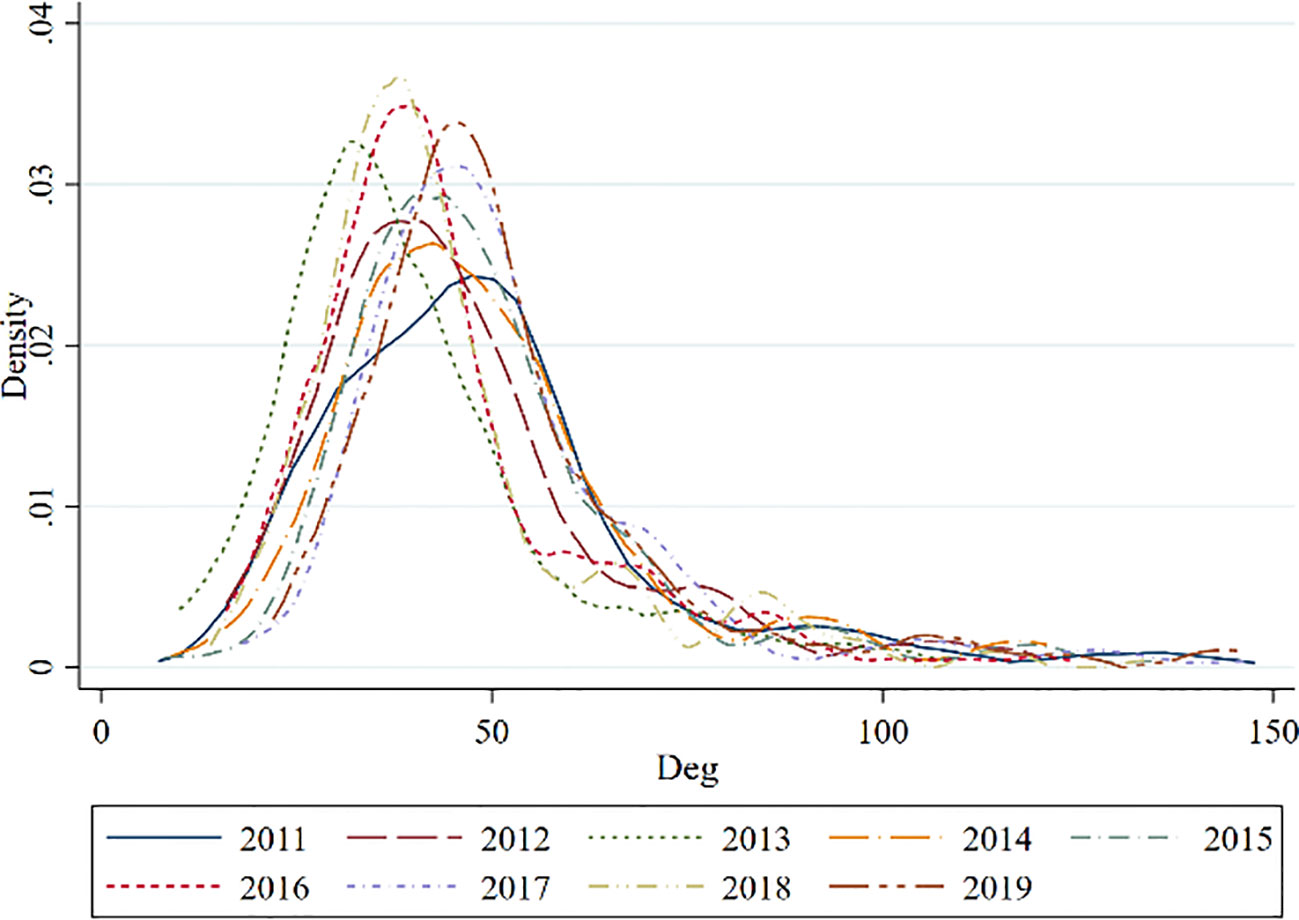
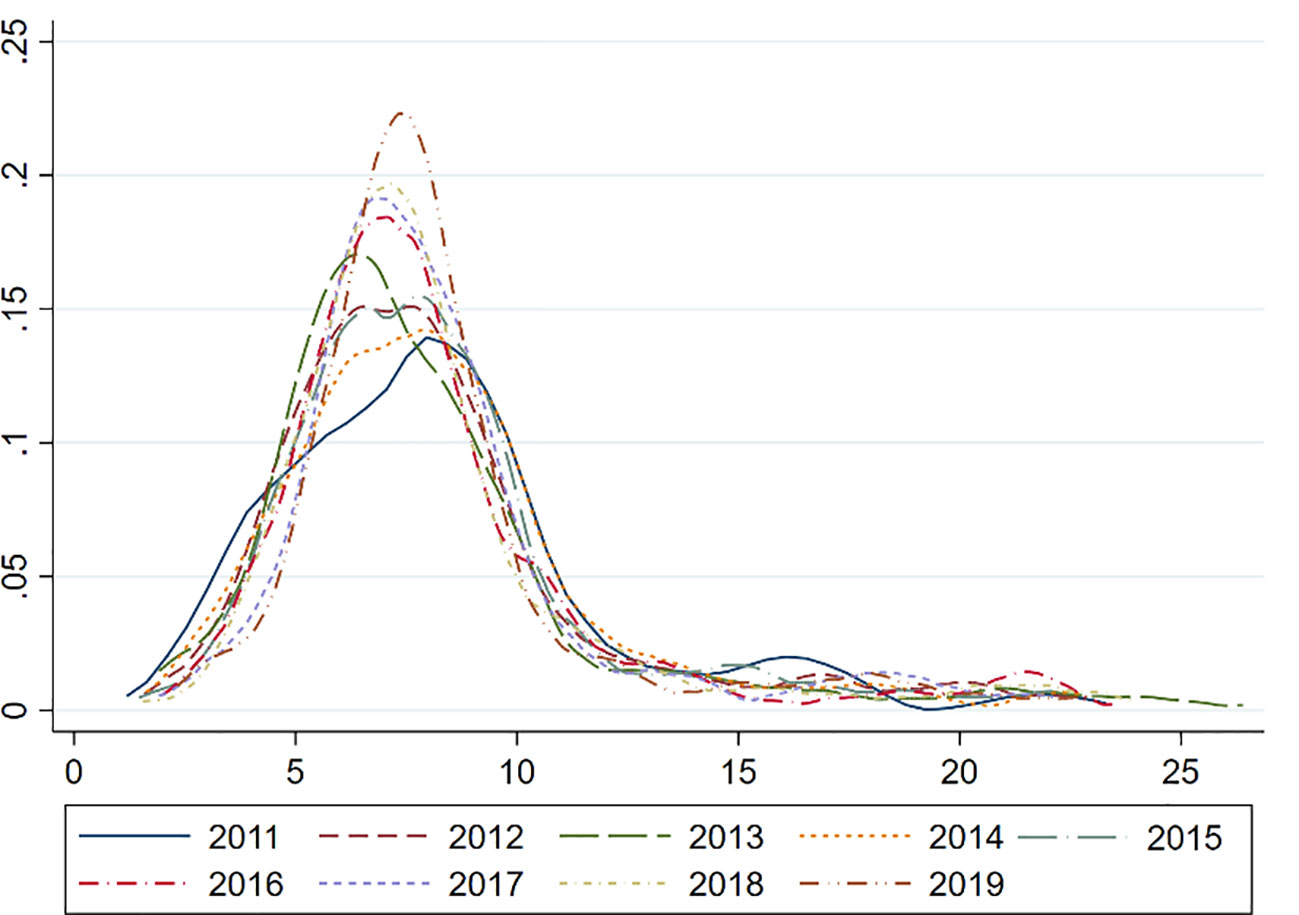
According to equations (4), (5) and (6), the three indicators of the degree centrality, betweenness centrality and eigenvector centrality of the DEN in each city are calculated. Figure 3 shows the kernel density of the degree centrality from 2011 to 2019, with the abscissa representing the degree centrality and the ordinate representing the kernel density. The kernel density of the degree centrality showed a right-sided distribution. This suggests that the cities involved in the digital economy were mainly concentrated in a few cities, while most cities possessed fewer partners to connect with. From 2011 to 2019, the distribution of the degree centrality did not significantly change.
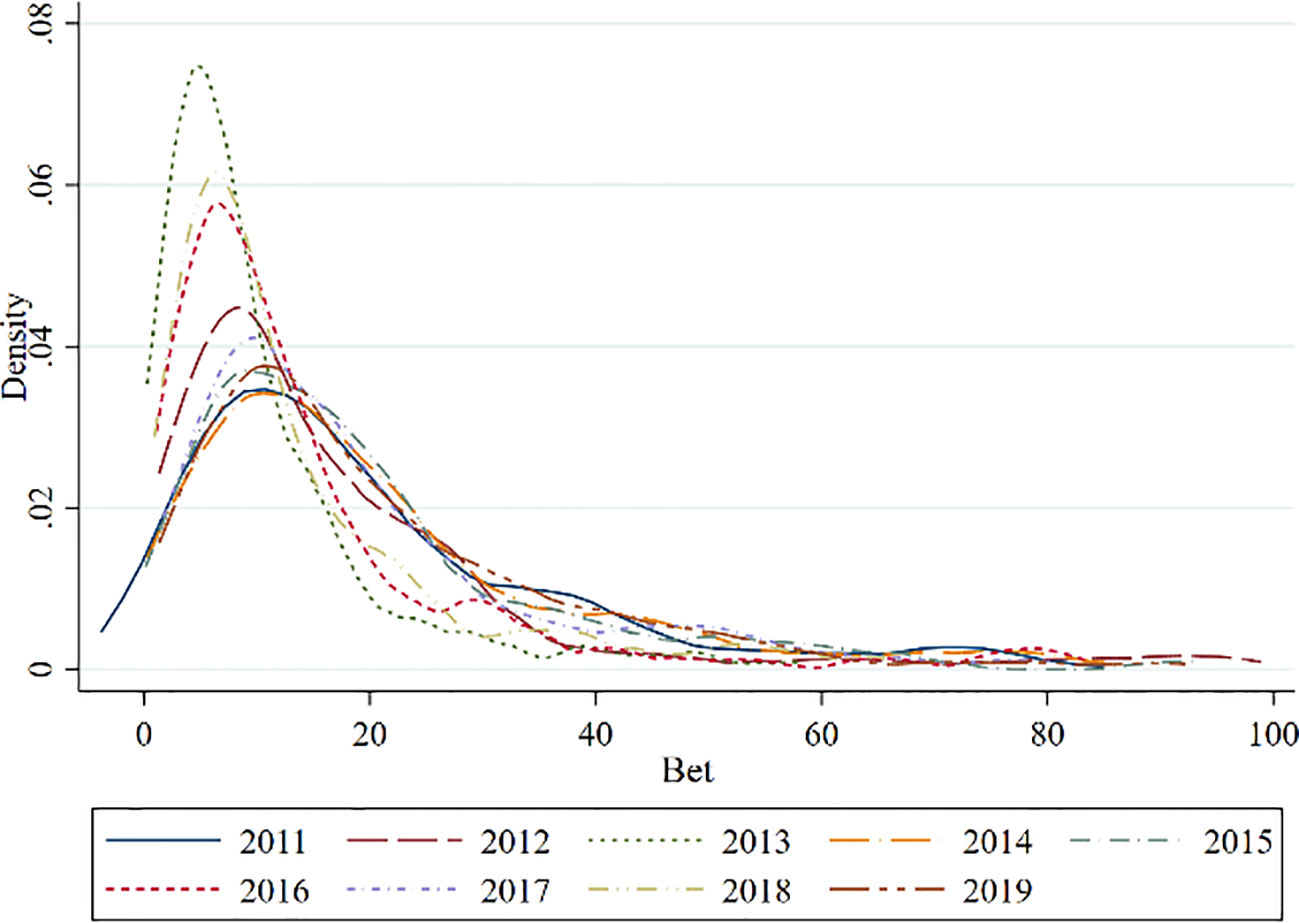
Figure 4 shows the kernel density of the betweenness centrality from 2011 to 2019. The kernel density of the betweenness centrality revealed a right-sided distribution. This shows that in the DEN, betweenness centrality of most cities was very low, and only a few cities exhibited very high values. Over time, the peak kernel density declined, indicating that the number of cities with a low degree centrality decreased, suggesting that the number of cities with mediating effects increased. From 2011 to 2019, the distribution of betweenness centrality did not significantly change.
Figure 5 shows the kernel density of the eigenvector centrality during 2011–2019. The kernel density of the eigenvector centrality shows a right-sided distribution. This indicates that most cities in the network attained notable indirect impact capabilities, while only a small number of cities attained relatively low indirect impact capabilities. Moreover, over time, the kernel density increased, indicating that cities tended to enhance their indirect influence.
3.2.2 Spatial distribution characteristics
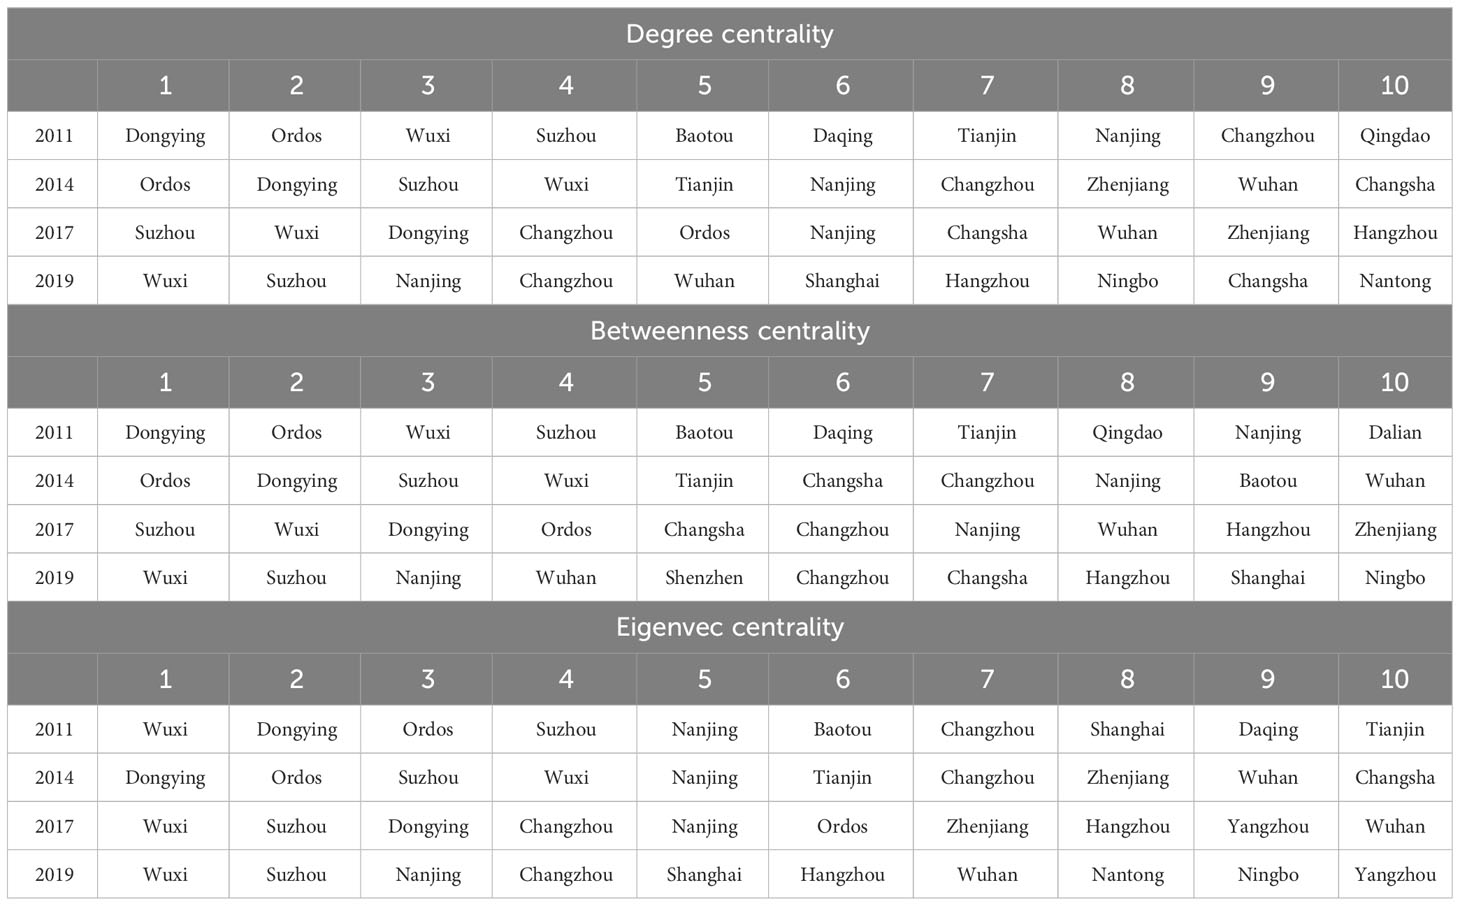
Table 1 reports the ranking of the top ten individual network indicators of the various cities in 2011, 2014, 2017 and 2019. From the perspective of the degree centrality, there was a slight change in the top ten cities from 2011 to 2019, with Wuxi, Suzhou, Dongying, and Ordos mostly ranking in the top five. From a geographical perspective, over the past four years, eastern cities accounted for 70% or more of the top ten cities, with only Ordos and Baotou occurring four times in the west and Daqing occurring only once in the northeast. From the ranking of the betweenness centrality, the situation was relatively similar to the ranking of the degree centrality, with southern cities, as represented by Wuxi and Suzhou, gradually becoming the main cities of the correlation. From the perspective of the geographical location, the proportion of cities in the eastern region in the top ten showed a steady upward trend, from 6 in 2011 to 8 in 2019, indicating an absolute leading position. The number of cities in the central region remained at 2 per year, while that in the western region still showed a decreasing trend year by year, with only 2 cities in the northeast emerging in 2011. From the ranking of the eigenvector centrality, Wuxi ranked first for 3 years, while Suzhou and Nanjing ranked in the top 5 for 4 years, indicating that these three cities attained strong indirect connections with other cities within the association network. From the perspective of the geographical location, the eastern cities still showed an increasing trend year by year, and the proportion of the top ten cities reached 90% in 2019, while the number of top-ranked cities in the other three major regions still showed a decreasing trend year by year. Overall, eastern cities occupied an unshakable leading position in the network.
In addition, the spatial distribution characteristics of the degree centrality, betweenness centrality, and eigenvector centrality in 2019 are shown in Figures 1, 6, and 7, respectively. In Figure 1, the degree centrality is divided into four levels, from low to high, namely, green, yellow, orange, and red. In this network, most cities in the Yangtze River Delta region were red, rendering it the region with the highest degree centrality. The overall color gradually changed from red to green from east to west, indicating a decrease in the degree centrality. The inland region, represented by Ordos, was marked in red. The average degree centrality of the 248 cities was 62.08, with 64 cities attaining values greater than the average. The sum of these values accounted for 46.60% of the total value of the 248 cities. Among the cities above the average, there were 36, 16, and 12 cities in the eastern, central, and western regions, accounting for 42.86%, 20.78%, and 19.67% of all cities in each region, respectively. The number of cities in Northeast China was 26, and their degree centrality was less than the average, indicating that the northeastern cities occurred less frequently in the top and attained lower participation rates in the DEN. At the same time, 54 cities attained a degree centrality of less than 40, accounting for only 11.3% of their total value. Among them, there were 9, 26, 13, and 5 cities in the northeastern, eastern, central, and western regions, respectively. The sum of the degree centrality of the top ten cities accounted for 13.2% of the total value, while the sum of the degree centrality of the last ten cities accounted for 1.9% of the total value, indicating a more severe division between the two levels. This also indicates that the digital economy industry must be further strengthened, and the connections between cities must be further deepened.
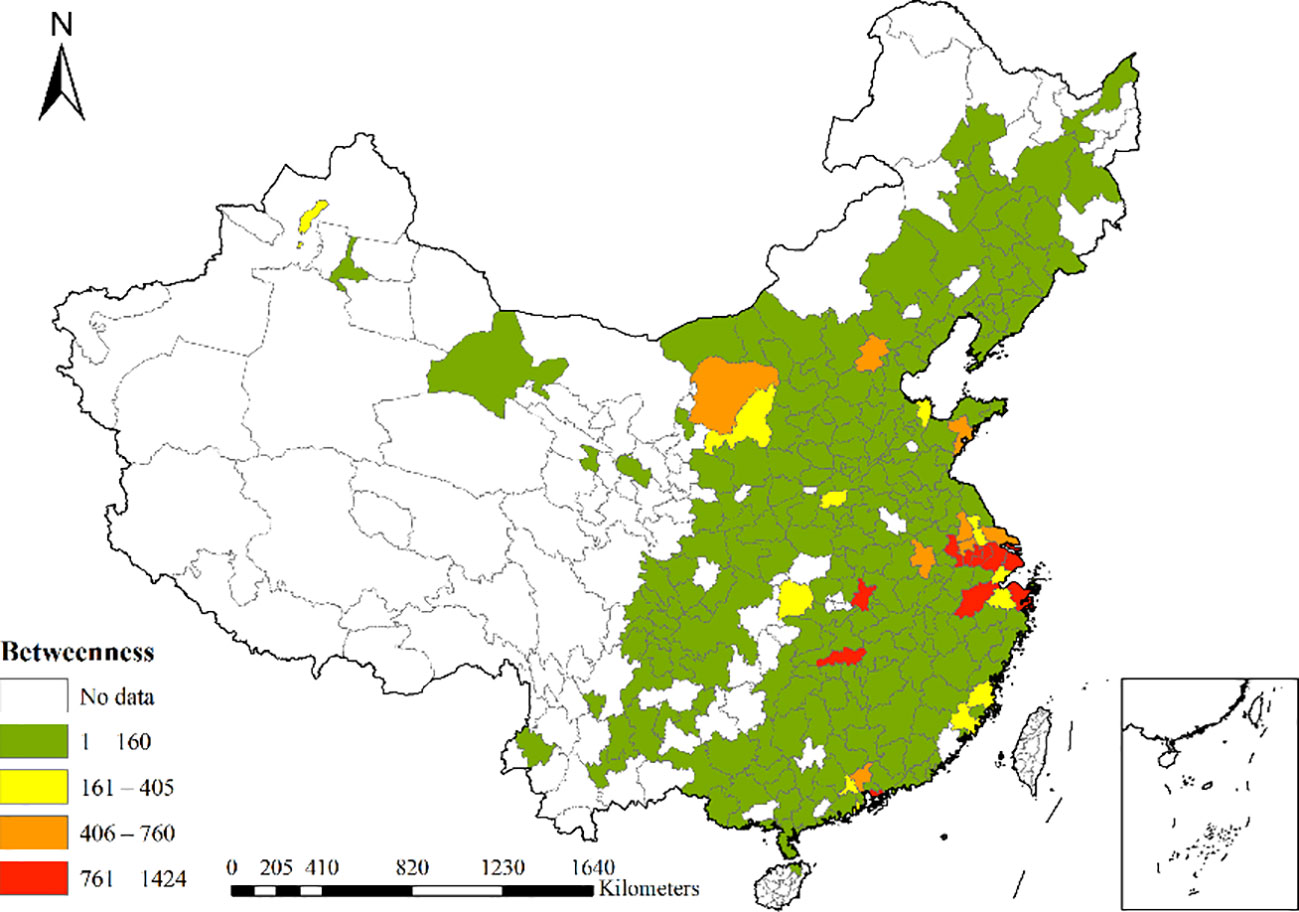
As shown in Figure 6, the betweenness centrality could also be divided into four levels, namely, green, yellow, orange, and red, from low to high. In the network, most cities in the Yangtze River Delta region were still red, indicating the area with the highest values of the betweenness centrality. Overall, except for the Yangtze River Delta region and some inland cities, most areas in the figure were green. Compared to those depicted in Figure 1, the green areas increased. Inland regions, as represented by Changsha and Wuhan, were shown in red in the figure. The average value of the betweenness centrality among the 248 cities was 94.03, and 35 cities attained values above the average, accounting for 79.22% of the total value of the 248 cities. This indicates that in the network, 35 cities occupied an intermediary or bridge position. Among the cities with values above the average, the numbers of cities in the eastern, central, and western regions were 25, 7, and 3, respectively, accounting for 29.76%, 9.09%, and 4.92%, respectively, of all cities in each region. The betweenness centrality of the cities in northeastern China was on average lower than the mean. This indicates that eastern cities still dominated, while the intermediary position of cities in the central and western China regions greatly declined, and the participation rate of northeastern cities remained relatively low. Moreover, out of 176 cities, only 11.84% attained a betweenness centrality less than 40, with 24, 48, 57, and 47 cities in the northeastern, eastern, central, and western regions, respectively. The sum of the betweenness centrality of the top ten cities accounted for 44.97% of the total value, while the sum of the betweenness centrality of the bottom ten cities accounted for only 0.11%, indicating a more serious two-level differentiation than that of the degree centrality. This also indicates that eastern cities, as represented by Wuxi, Suzhou, Nanjing, Shenzhen, and Changzhou, occupied the key resource elements for the digital economy development in most parts of China, exerting notable control over the flow of resource elements for digital economy development in other cities and becoming critical nodes for the connections among other cities, fulfilling an intermediary or bridge role.
As shown in Figure 7, the eigenvector centrality could still be divided into four levels, from low to high, namely, green, yellow, orange, and red. Overall, in the network, the Yangtze River Delta region was still marked in red, which was the area with the highest eigenvector centrality. The average value of the eigenvector centrality of the 248 cities was 8.29, with 83 cities attaining a value greater than the average, and the cumulative sum of the eigenvector centrality of these cities accounted for 47.09% of the total value of the 248 cities. This indicates that more than 40% of the cities in the network indirectly influence nondirectly connected cities. Among the cities with values greater than the average, the number of cities in the eastern, central, and western regions was 35, 26, and 22, respectively, accounting for 41.67%, 33.77%, and 36.06%, respectively, of the total number of cities in each region. The cities in the northeast region attained an eigenvector centrality lower than the average. In addition, the sum of the eigenvector centrality of the top ten cities accounted for 9.74% of the total value, while the sum of the eigenvector centrality of the bottom ten cities accounted for 1.6% of the total value. This indicates that some cities in the central and western regions, although not directly connected to many cities, exhibited a strong ability to indirectly influence other cities.
3.3 The impact of the DEN on carbon emissions
3.3.1 Descriptive statistics
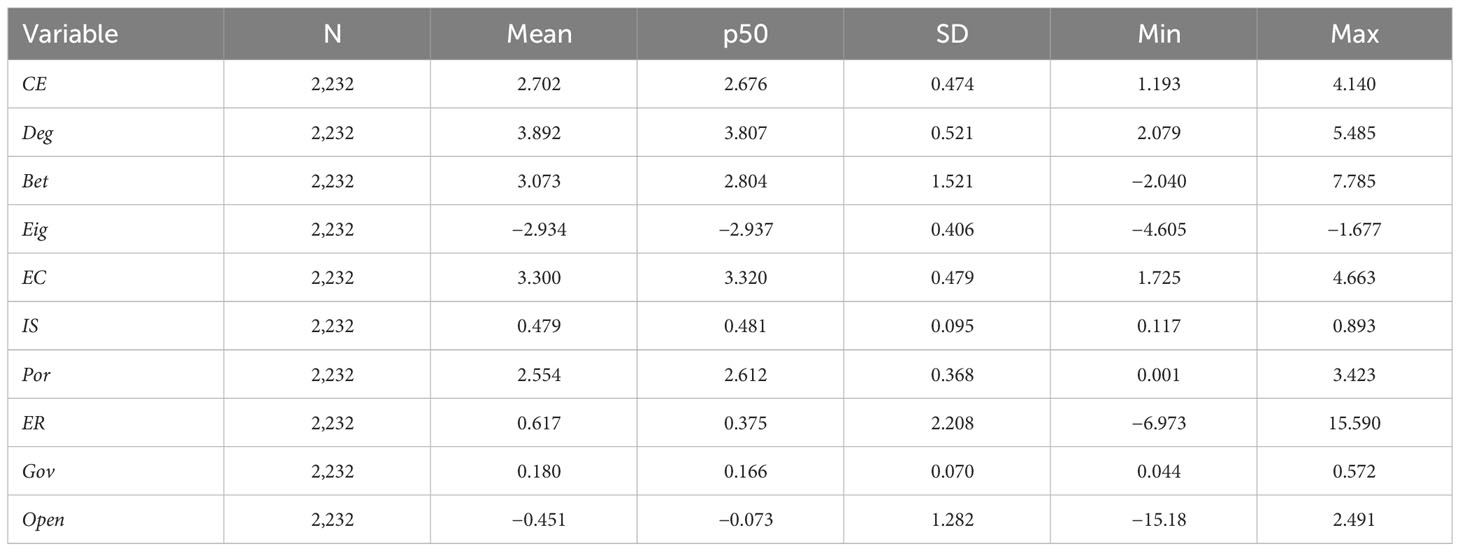
In this paper, the degree centrality, betweenness centrality, and eigenvector centrality of the DEN are selected as factors influencing carbon emissions for empirical analysis. Descriptive statistics for each variable are shown in Table 2, with both the explanatory and response variables logarithmically transformed.
To examine the relationship between the characteristics of the DEN and carbon emissions mentioned above, a trend analysis, scatter plots, and regression curves are employed, as shown in Figure 8. All three indicators showed a significant positive correlation with carbon emissions, indicating an overall increasing trend of carbon emissions as the central characteristics of the increase in each city.
3.3.2 Baseline regression results
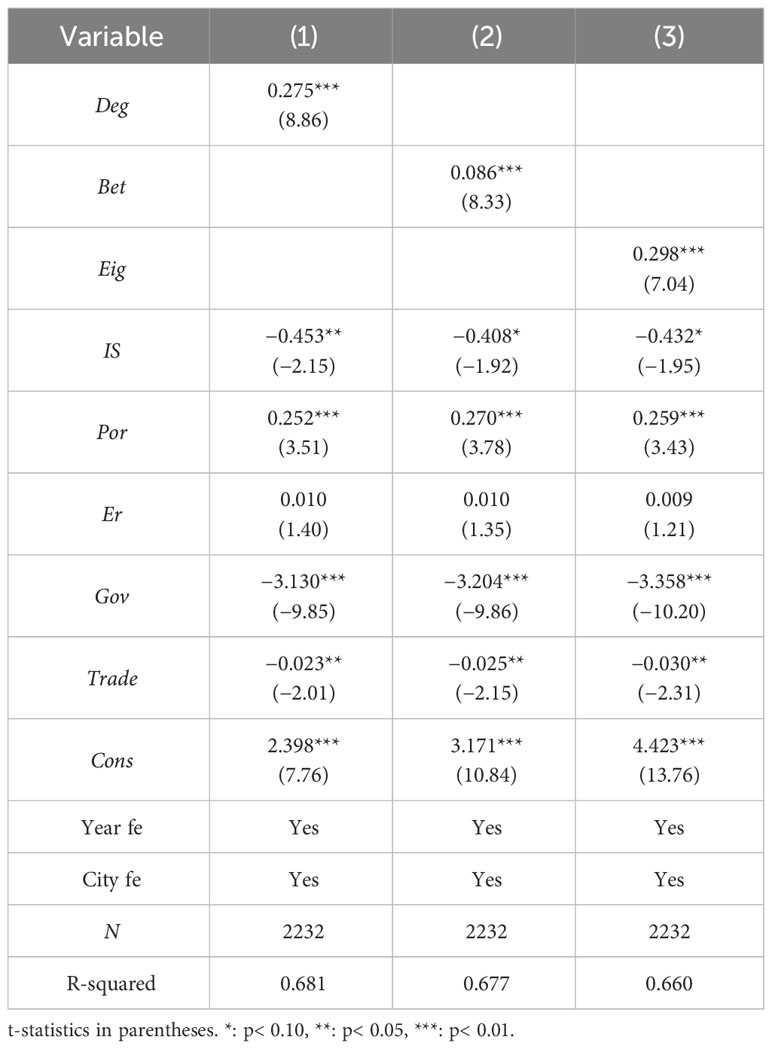
A two-way fixed effects regression model with city and year fixed effects is employed, and the results are shown in Table 3. Columns (1), (2), and (3) represent the regression results with Deg, Bet, and Eig as independent variables, which are the same in Tables 4, 5 and 6. After controlling for a range of factors that affect carbon emissions, the regression coefficients of the degree centrality, betweenness centrality, and eigenvector centrality are all significantly positive, indicating that the enhancement in the central characteristics in each city increase carbon emissions. Specifically, for each 1% increase in the degree centrality, betweenness centrality, and eigenvector centrality, carbon emissions increase by 0.275%, 0.086%, and 0.298%, respectively. Possible reasons include China’s digital economy occurring at its early stages of development, relying primarily on investment in human capital and technology research and development, rather than on the large-scale input of ecological resources such as coal, oil, and forest products, as in traditional manufacturing industries. However, the hardware manufacturing needed, such as electronic components, equipment, and production of entire machines, occurs in high-energy-consumption areas, which increases carbon emissions. In addition, in cities with high centrality, the digital economy imposes a strong clustering effect, and the storage, transmission, and processing of data all require support from data centers. This often results in intense investment in equipment facilities in small spaces, such as large data centers or supercomputers, which consume large amounts of electricity, resulting in increased carbon emissions.
According to the control variables, the regression coefficients of the industrial structure are significantly negative in all three models, indicating that an increase in the proportion of the tertiary industry can suppress carbon emissions. The regression coefficient of the population is significantly positive at the 1% level, indicating that population expansion may lead to an increase in the number of production and life activities, thereby increasing carbon emissions. The regression coefficient of government intervention is significantly negative, showing that government intervention can effectively suppress carbon emissions. The reason may be that under the constraint of the dual carbon targets, local governments allocate more fiscal expenditure to carbon reduction. The coefficient of openness is significantly negative, and the high openness degree of cities to the outside world can be more conducive to local enterprises learning and utilizing advanced foreign technology, thereby promoting energy conservation and emission reduction.
3.3.3 Robustness test
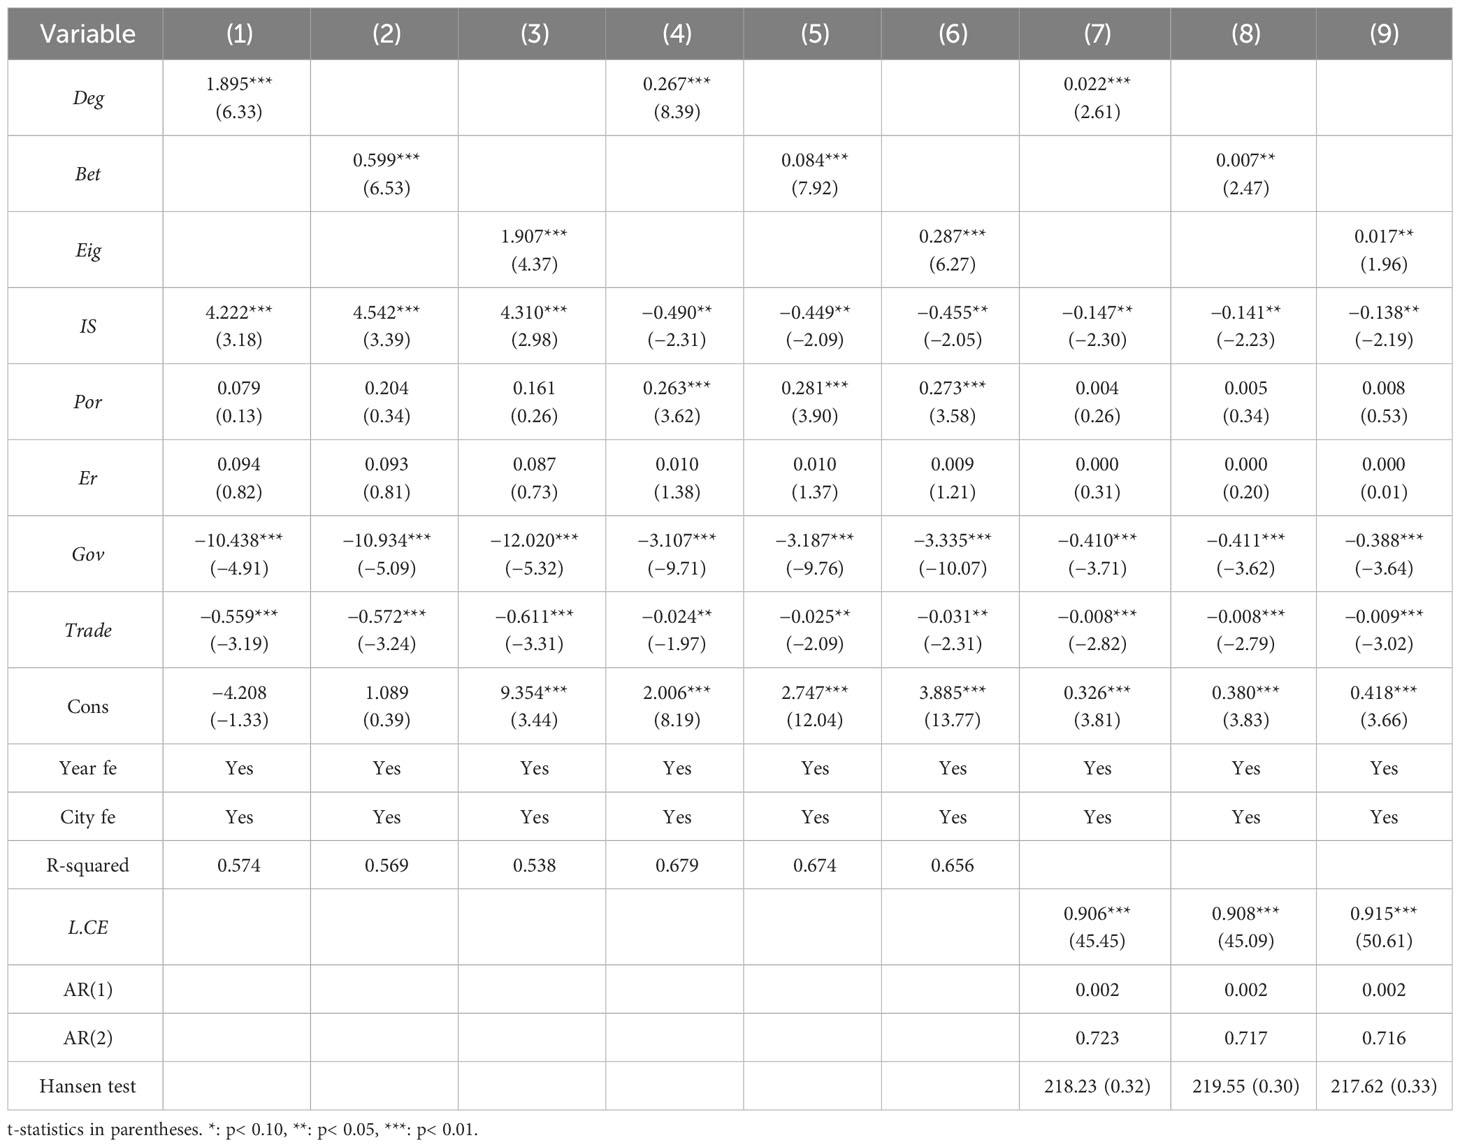
Robustness tests are conducted using three methods. First, carbon emissions are replaced with per capita carbon emissions. As shown in columns (1) to (3) of Table 4, the coefficients of the three central indicators are significantly positive, with only slight changes in numerical magnitude and no changes in direction. The test results are consistent with the previous conclusions, indicating the robustness of the study. Second, the entropy method is applied to recalculate the digital economy index, and the degree centrality, betweenness centrality, and eigenvector centrality are recalculated based on equations (4) to (6). As shown in columns (4) to (6) of Table 4, the direction of the coefficients of the three central indicators do not change, which is consistent with the previous analysis. Third, parameter estimation is performed using the generalized method of moments (GMM) to address potential endogeneity issues between the central characteristics and carbon emissions, as well as the possibility of omitted variables. The lagged one-period centrality characteristics are used as instrumental variables, and a two-step GMM is employed for regression, as shown in columns (7) to (9) of Table 4. The results indicate that both AR(1) and AR(2) conform with the assumption of no autocorrelation in the error term, and the Hansen test confirms the validity of the instrumental variable used in the estimation. Thus, the above tests demonstrate the validity of using the two-step GMM. The direction of the coefficients of the three central indicators remain consistent with that in the previous research.
3.3.4 Heterogeneity testing
3.3.4.1 Heterogeneity of resource endowment
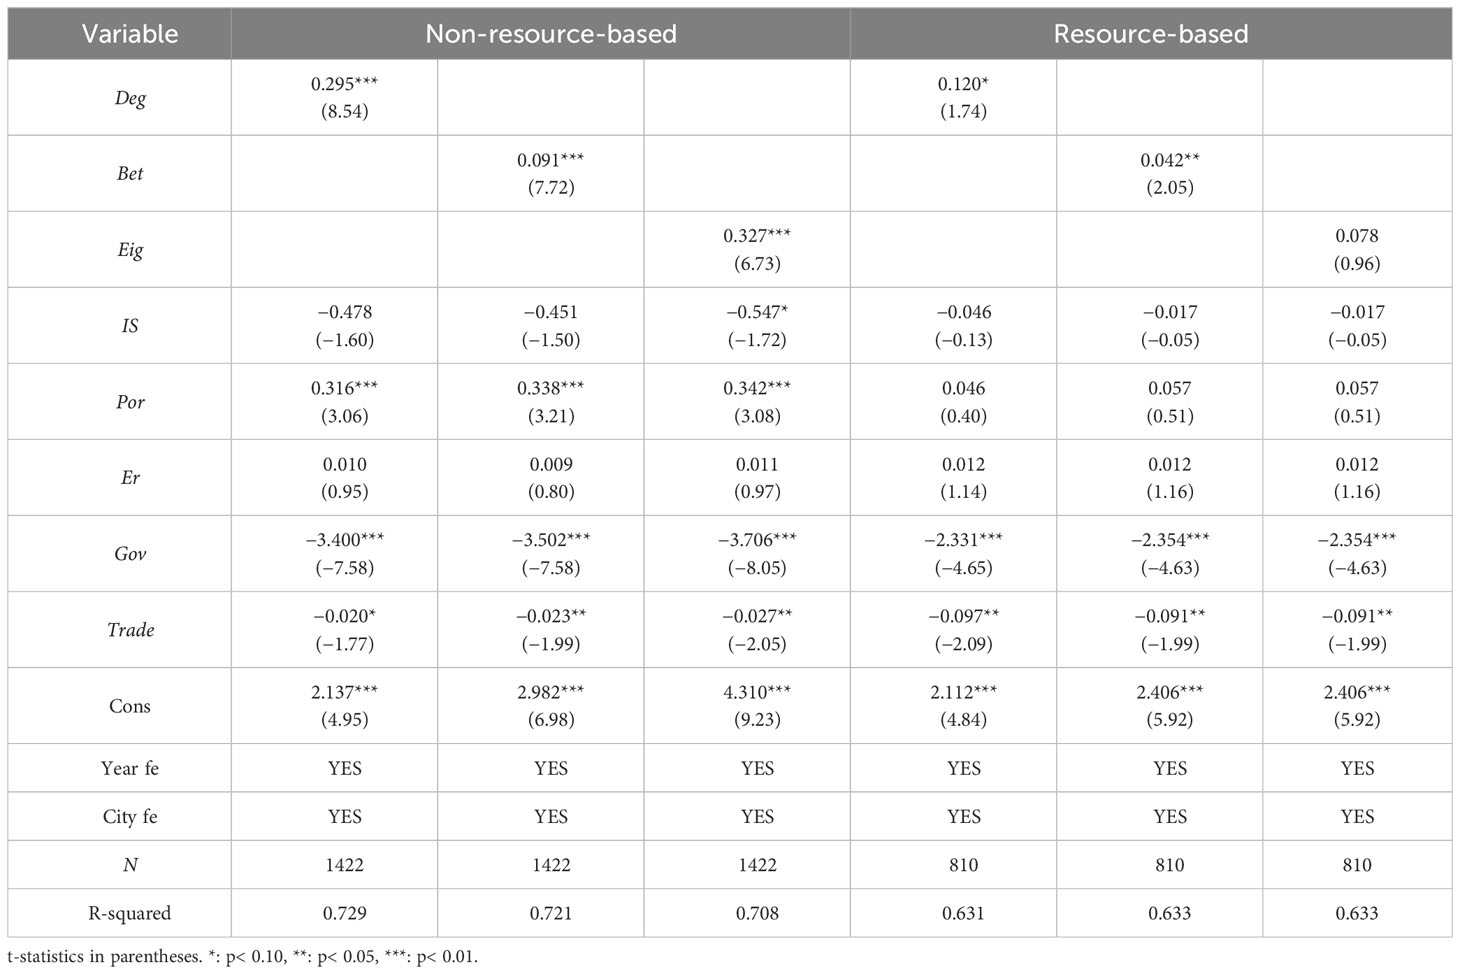
According to the natural resource endowment of each city, the sample are divided into nonresource-based cities and resource-based cities, and parameter estimates are conducted separately. As presented in Table 5, in the nonresource-based cities, the regression coefficients of the degree centrality, betweenness centrality, and eigenvector centrality are all significantly positive at the 1% level. In the resource-based cities, the regression coefficients of degree centrality and betweenness centrality are significantly positive at the 10% and 5% levels, respectively, and the eigenvector centrality is not significant. This indicates that the indirect impact ability of the resource-based cities in the network does not promote carbon emissions.
3.3.4.2 Heterogeneity of urban scale
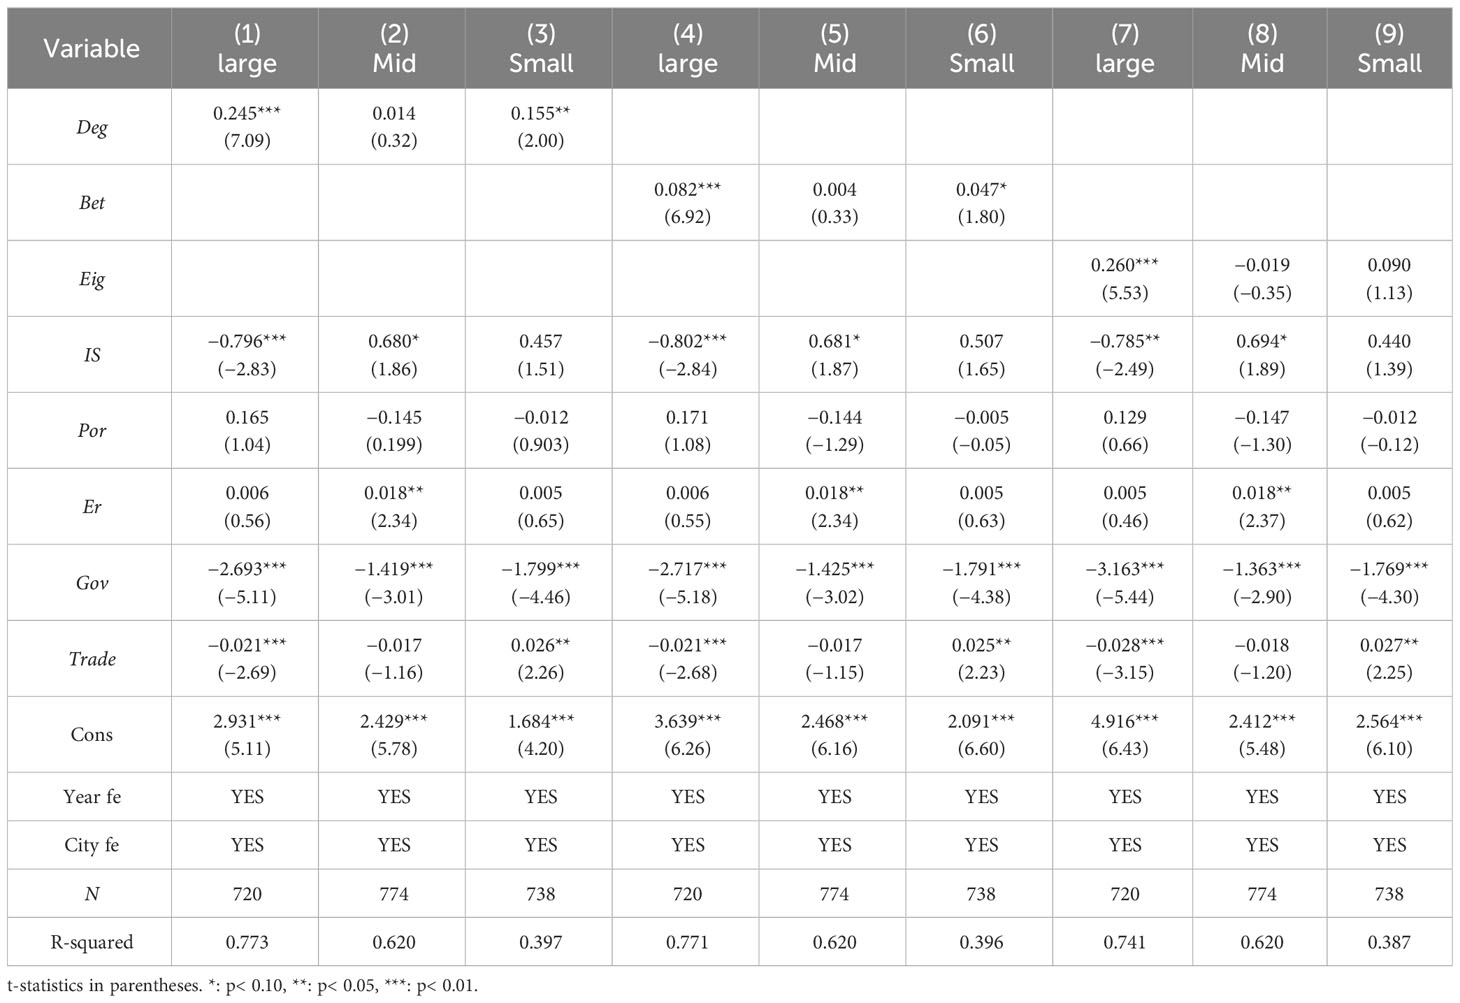
Based on the population size, cities are classified as large, mid-size, and small to examine the heterogeneity of urban scale, as listed in Table 6. The results indicate that in medium-sized cities, the degree centrality, betweenness centrality, and eigenvector centrality are all unrelated to carbon emissions. In large cities, the coefficients of the three central indicators are significantly positive at the 1% level. In small cities, the coefficients of degree centrality and betweenness centrality are significant at the 5% and 10% levels, respectively, while the eigenvector centrality is not significant. In med-size cities, the coefficients of three central indicators are not significant. This suggests that in large cities, enhancing the centrality character can exert a positive promoting effect on carbon emissions. Notably, increasing the digital economic connections and enhancing the intermediation and indirect impacts can also increase carbon emissions in local areas. In small cities, the city’s indirect impact ability does not promote an increase in carbon emissions during digital economic activities. In med-size cities, the increase in central location has no impact on carbon emissions.
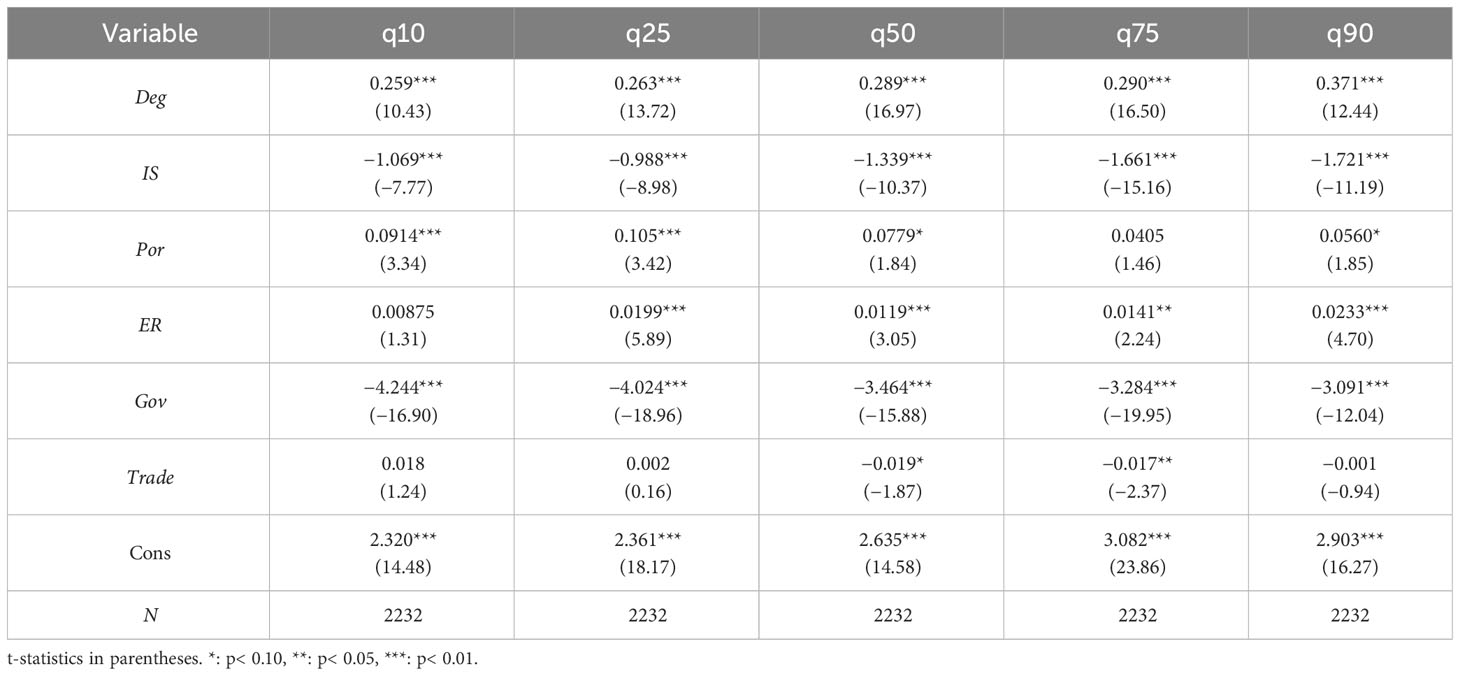
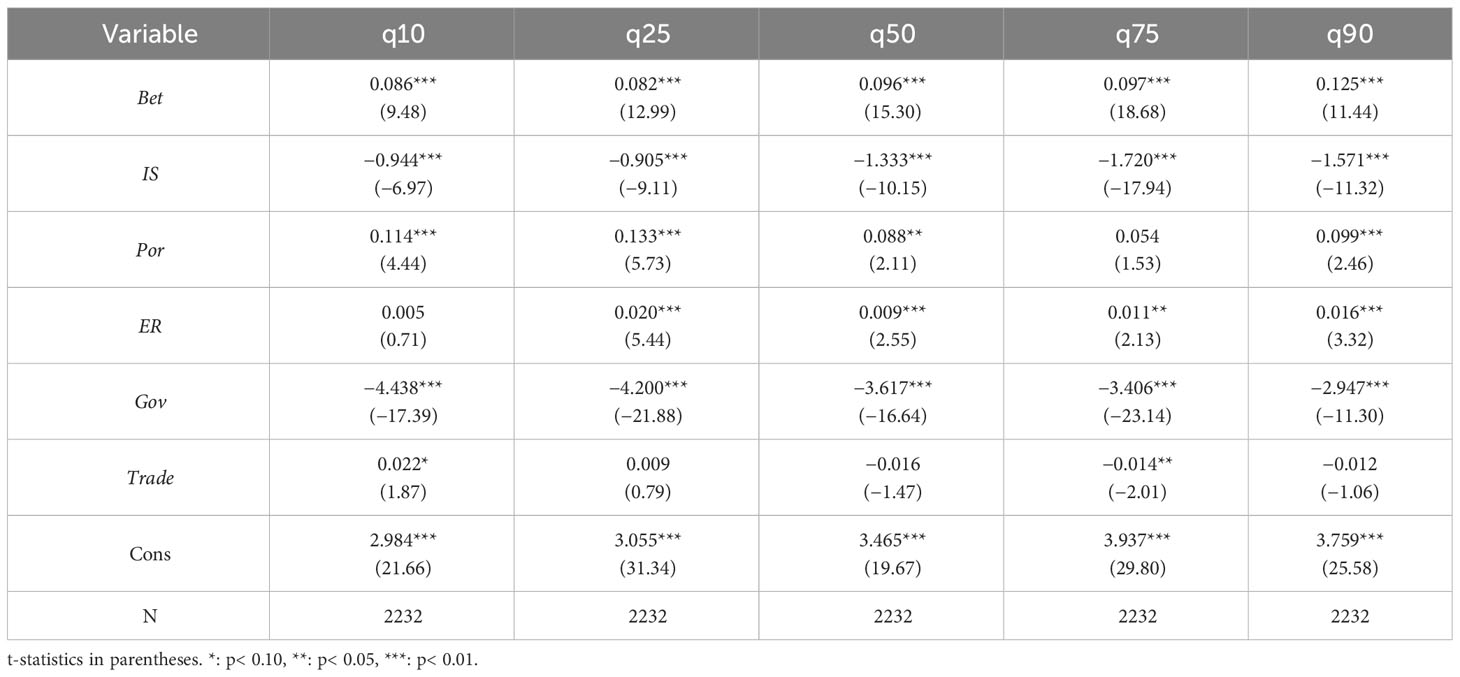
3.3.4.3 Quantile regression
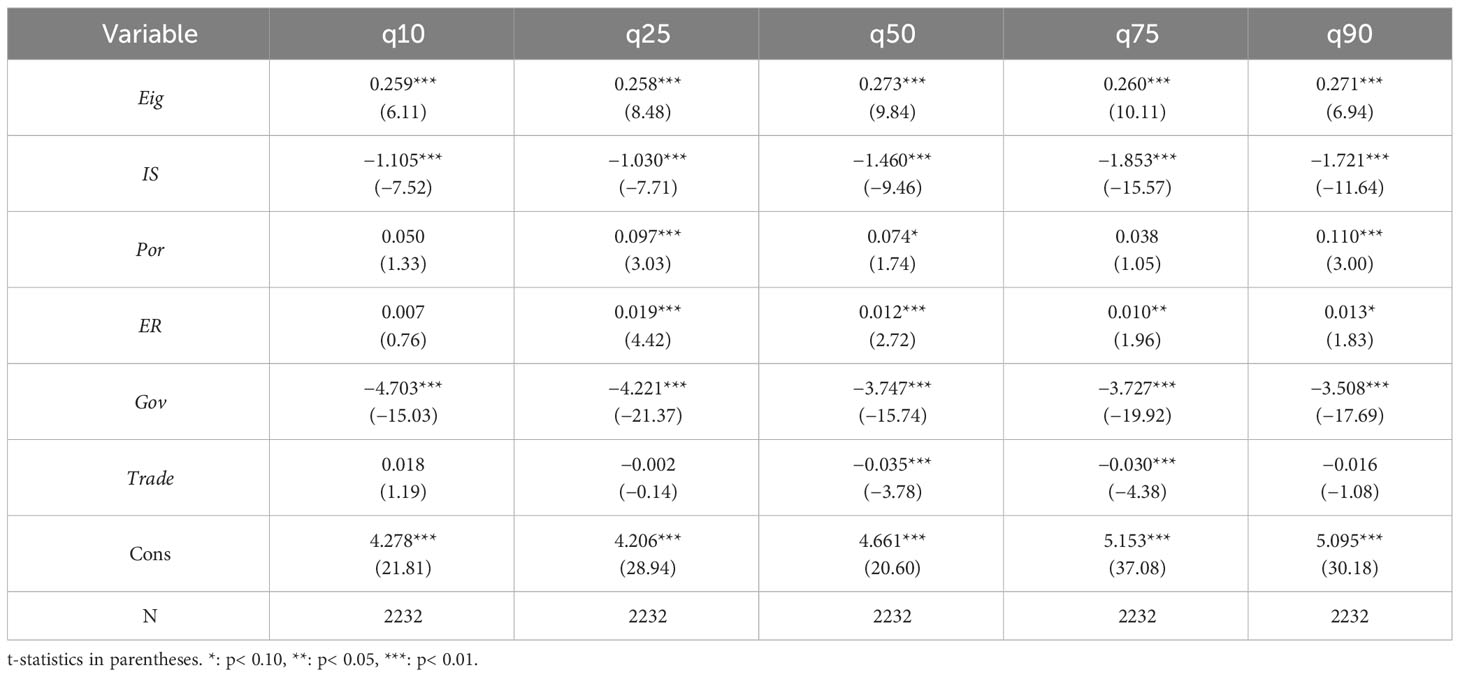
Quantile regression analysis is further employed to investigate the impact of the DEN’s central characteristics on carbon emissions under different quantile conditions. Parameters are estimated at quantile levels of 0.1, 0.25, 0.5, 0.75, and 0.9, as shown in Tables 7–9. At the different quantile levels, the direction of the coefficients of the degree centrality, betweenness centrality, and eigenvector centrality on carbon emissions are completely consistent, and all pass the significance test of 1%, consistent with the previous conclusion. The regression coefficient values increase from 0.259 to 0.371, from 0.086 to 0.125, and from 0.259 to 0.271, respectively, indicating that the promoting effects of the degree centrality, betweenness centrality, and eigenvector centrality on carbon emissions increase with increasing carbon emissions.
3.3.5 Mediation effect analysis
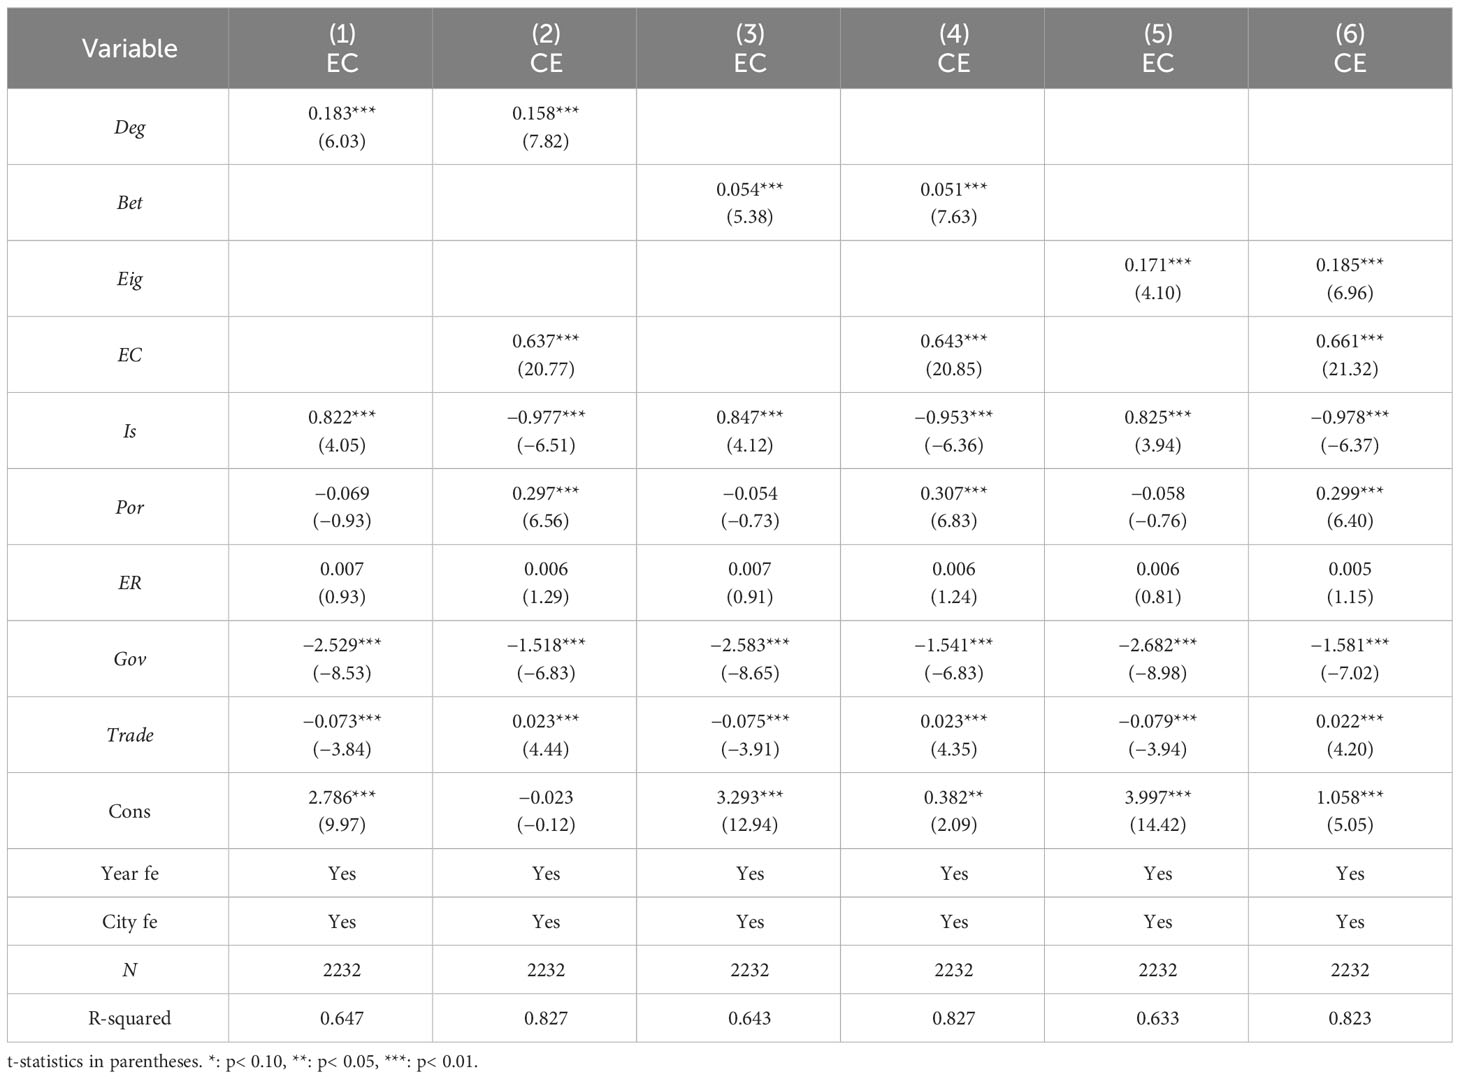
With the use of energy consumption as an intermediary variable, the regression results based on equation (8) are presented in Table 10. Columns (1), (3), and (5) show that the regression coefficients of the degree centrality, betweenness centrality, and eigenvector centrality are significantly positive. This indicates that the increased centrality characteristics of the various cities led to an increase in energy consumption. This may be due to the rise in industries at the early stages of the digital economy, such as online shopping, e-commerce live streaming, and virtual gaming, which contribute to an increased energy consumption. Moreover, columns (2), (4), and (6) show that after controlling for network central characteristics, energy consumption impose a positive promoting effect on carbon emissions, indicating that energy consumption plays a partial intermediary effect.
To verify the intermediary effect, a bootstrap test is also employed with 500, 800, and 1,000 random samples with replacement, and the results are shown in Table 11. Among the 500, 800, and 1,000 testing samples, the 95% confidence intervals do not contain 0. This indicates that the increase in the central characteristics of cities led to an increase in energy consumption and carbon emissions. Table 12 shows the results of the Sobel test for the mediating effect, with a Z statistic greater than 0.97, which indicates that the null hypothesis can be rejected and that energy consumption plays a mediating role between the DEN’s central characteristics and carbon emissions. The indirect effects account for 0.117, 0.035, and 0.112, while the direct effects account for 0.186, 0.051, and 0.186, respectively, and the proportions of the mediating effect are 38.60%, 40.50%, and 37.70%, respectively.
4 Discussion
This paper takes 248 cities in China as samples, aiming to explore the overall and individual characteristics of DEN at the city level, as well as the impact of the central characteristics of DEN on carbon emissions.
First, this paper uses a modified gravity model to discover that the digital economy of 248 cities in China exhibits a clear spatial correlation network structure. Although in recent years, China’s digital economy has developed rapidly, compared to developed countries, China’s development is still in a relatively early stage (Zhong et al., 2017). Moreover, according to the calculation results of the overall network density, the network is in the early stages of development and the relationships between cities are relatively loose, which is the same conclusion as Chen and Zhu (2021). In terms of individual network structure characteristics, some coastal cities in the eastern and southern regions occupy a leading position in the network, while cities in the western and northeastern regions are on the edge of the network, with severe two-level differentiation. Therefore, the conclusion is drawn that the network spatial pattern is dense in the east and sparse in the west. This conclusion is consistent with previous research findings (Chen and Zhu, 2021; Tang et al., 2021).
Second, scholars have not reached a consensus on the relationship between the digital economy and carbon emissions. Possible reasons include the lack of unified calculation and measurement methods for the digital economy as a new form of economy, and the lack of consensus on the scope of the digital economy industry. For example, should the carbon emissions generated from the production of digital economy infrastructure be included in the carbon emissions of the digital economy industry? Which country should the carbon emissions generated by the digital economy industry transferred from developed countries to developing countries belong to? From the conclusion drawn in this paper, it can be seen that the improvement in the central position of the DEN significantly increases carbon emissions. This viewpoint is basically consistent with previous conclusions (Dong F. et al., 2022; Zhang L. et al., 2022; Zhou et al., 2022). Some scholars believe that there is an inverted U-shaped relationship between the digital economy and carbon emissions (Li and Wang, 2022), so whether there is a nonlinear relationship between the center position of the DEN and carbon emissions needs further research in the future. However, due to the early formation of China’s DEN, the relationship between the structural characteristics of the DEN and carbon emissions is also credible on the left side of the inverted U-shaped curve.
Finally, the central characteristics of the DEN indirectly promote carbon emissions by increasing energy consumption. Yu and Zhu (2023) also reached the same conclusion in their study introducing energy intensity as a mediator variable. But this conclusion is still valid at the beginning of the development of China’s DEN. As the development of digital economy in various cities in China becomes more mature, the effectiveness of regional collaborative development is truly reflected, and the network structure of digital economy is more reasonable, leading to improved energy efficiency and possibly reducing carbon emissions.
5 Conclusion and implications
This paper first uses the SNA method and the Panel data of 248 cities in China from 2011 to 2019 to study the structural characteristics of the DEN from a more microscopic urban perspective, filling the gap in existing research. Second, we describe the overall and individual characteristics of DEN, and combine the SNA method with the traditional econometric methods to explore the impact of the central characteristics of DEN on carbon emissions. Finally, from the perspective of relationship, we propose policy recommendations for the coordinated development of the digital economy to local governments to explore a clearer path of emission reduction. The results are as follows:
First, between 2011 and 2019, the overall structure of China’s DEN was relatively loose, with few connections. However, over time, the overall network density showed an upward trend. In terms of individual network characteristics, cities in the Yangtze River Delta region, as represented by Wuxi, Suzhou, and Nanjing, occupied a core position in the DEN. Only 35 cities played an intermediary role, affecting the connection between other cities, and more than 40% of cities attained strong relationships with nonconnected partners.
Second, empirical research suggests that due to the formative stage of China’s DEN, the central characteristics of each city in the network, such as the degree centrality, betweenness centrality, and eigenvector centrality, impose a positive promoting effect on carbon emissions. Moreover, this research conclusion remains significant through explanatory variable replacement, explained variable replacement, and GMM regression.
Third, the heterogeneity tests of endowment resources indicate that the central characteristics of the DEN promote carbon emissions in the nonresource-based cities. In the resource-based cities, the eigenvector centrality exerts no effect on carbon emissions. The heterogeneity tests of urban scale indicate that increasing the central characteristics of large cities could promote carbon emissions in large cities. In small cities, increasing the degree centrality and betweenness centrality can promote carbon emissions. But In med-size cities, the increase in central location has no impact on carbon emissions. The quantile regression results show that the promotion effect of the network central characteristics on carbon emissions can continuously increase with increasing carbon emissions. According to the influencing mechanisms, the DEN’s central characteristics can promote carbon emissions through energy consumption.
Here are some policy recommendations based on the findings above:
First, the digital transformation of various industries should be accelerated so that more regions and industries can be integrated into the DEN. Each city should create a digital industry development model that is in line with its own characteristics based on its unique situation. For example, core cities such as Wuxi, Suzhou, and Nanjing should strive to implement new technologies in the digital economy, continue to leverage their strengths and influences, explore new directions for the digital economy industry, and drive the development of the digital economy in other cities in China. Cities situated at the edge of the network should combine their specific local conditions, increase exchanges with core cities, actively learn from the experience and advanced technology of digital economy industry development, and constantly explore new ways to assist local digital economy development.
Second, the initial formation of the DEN increases carbon emissions, so it is particularly important to reasonably allocate resources and formulate suitable plans for long-term development of the digital industry in local areas. Therefore, local governments should focus on making rational decisions, creating effective connections in the digital economy, optimizing digital economic relationships, and avoiding blindly expanding the digital economy industry, which leads to waste of digital economy resources and increased carbon emissions.
Third, we should focus on developing the digital economy in resource-based cities, prioritizing the exploration of business models that synergistically combine the digital economy and carbon emission reduction. At the same time, we should actively utilize the intermediary role of nonresource-based cities in the network and form regional alliances with resource-based cities to explore development models. In the expansion process, both large and small cities should guide the green and low-carbon development of the digital industry, focusing on supporting the development of green and low-carbon digital technology, promoting effective integration of existing digital resources, accelerating optimization of industrial structures, and reducing carbon emissions resulting from the digital economy.
Fourth, while developing the digital economy, cities should actively promote green and energy-saving technologies, improve the energy efficiency of digitization and industrialization processes, promote a change in the energy consumption structure, and reduce the digital economy’s dependence on traditional energy sources. In addition, during the construction of digital infrastructure, countermeasures such as green information and communication technology infrastructure should be implemented to avoid excessive carbon emissions originating from communication base stations, data centers, and other facilities.
Data availability statement
The original contributions presented in the study are included in the article/supplementary material. Further inquiries can be directed to the corresponding author.
Author contributions
HW: Conceptualization, Formal analysis, Writing—review and editing, Supervision. PL: Data curation, Methodology, Writing—original draft. All authors contributed to the article and approved the submitted version.
Funding
This work was supported by the National Social Science Fund of China (No. 22XTJ004), the National Social Science Fund of China (No. 20CJY057), the Social Science Project of Shaanxi (No.2021D062), the National Statistical Science Research Project (No.2022LY068), and the Education and Teaching Reform Research Project of Xi’an University of Finance and Economics (23xcj003).
Conflict of interest
The authors declare that the research was conducted in the absence of any commercial or financial relationships that could be construed as a potential conflict of interest.
Publisher's note
All claims expressed in this article are solely those of the authors and do not necessarily represent those of their affiliated organizations, or those of the publisher, the editors and the reviewers. Any product that may be evaluated in this article, or claim that may be made by its manufacturer, is not guaranteed or endorsed by the publisher.
References
Amuso V., Poletti G., Montibello D. (2020). The digital economy: opportunities and challenges. Glob. Policy 11, 124–127. doi: 10.1111/1758-5899.12745
Bai C. Q., Zhou L., Xia M. L., Feng C. (2020). Analysis of the spatial association network structure of China’s transportation carbon emissions and its driving factors. J. Environ. Manage. 253, 109765. doi: 10.1016/j.jenvman.2019.109765
BP (2022) Statistical Review of World Energy. Available at: https://www.bp.com.
Bu Y., Wang E. D., Bai J. H., Shi Q. B. (2020). Spatial pattern and driving factors for interprovincial natural gas consumption in China: Based on SNA and LMDI. J. Clean. Prod. 263, 121392. doi: 10.1016/j.jclepro.2020.121392
Chen X. L., Di Q. B., Jia W. H., Hou Z. W. (2023). Spatial correlation network of pollution and carbon emission reductions coupled with high-quality economic development in three Chinese urban agglomerations. Sustain. Cities Soc 94, 104552. doi: 10.1016/j.scs.2023.104552
Chen F., Zhao T., Liao Z. (2020). The impact of technology-environmental innovation on CO2 emissions in China’s transportation sector. Environ. Sci. pollut. Res. 27, 29485–29501. doi: 10.1007/s11356-020-08983-y
Chen B., Zhu H. (2021). Has the digital economy changed the urban network structure in China? Based on the analysis of China’s top 500 new economy enterprises in 2020. Sustainability 14 (1), 150. doi: 10.3390/su14010150
Cheng Y., Zhang Y., Wang J. J., Jiang J. X. (2023). The impact of the urban digital economy on China's carbon intensity: Spatial spillover and mediating effect. Resour. Conserv. Recy. 189, 106762. doi: 10.1016/j.resconrec.2022.106762
Dong F., Hu M., Gao Y., Liu Y., Zhu J., Pan Y. (2022). How does digital economy affect carbon emissions? Evidence from global 60 countries. Sci. Total Environ. 852, 158401. doi: 10.1016/j.scitotenv.2022.158401
Dong J., Li C. B. (2022). Structure characteristics and influencing factors of China's carbon emission spatial correlation network: A study based on the dimension of urban agglomerations. Sci. Total Environ. 853, 158613. doi: 10.1016/j.scitotenv.2022.158613
Dong K. Y., Wang J. D., Taghizadeh-Hesary F. (2022). Assessing the embodied CO2 emissions of ICT industry and its mitigation pathways under sustainable development: A global case. Appl. Soft Comput. 131, 109760. doi: 10.1016/j.asoc.2022.109760
Dong T., Yin S., Zhang N. (2023). New energy-driven construction industry: Digital green innovation investment project selection of photovoltaic building materials enterprises using an integrated fuzzy decision approach. Systems 11, 11. doi: 10.3390/systems11010011
Fan J., Xiao Z. (2021). Analysis of spatial correlation network of China’s green innovation. J. Clean. Prod. 299, 126815. doi: 10.1016/j.jclepro.2021.126815
Fanea-Ivanovici M., Mus¸etescu R. C., Pan˘a M. C., Voicu C. (2019). Fighting corruption and enhancing tax compliance through digitization: achieving sustainable development in ROmania. Sustainability 11 (5), 1480. doi: 10.3390/su11051480
Gan C., Voda M., Wang K., Chen L., Ye J. (2021). Spatial network structure of the tourism economy in urban agglomeration: A social network analysis. J. Hosp. Tour. Manage. 47, 124–133. doi: 10.1016/j.jhtm.2021.03.009
Guo B. N., Wang Y., Zhang H., Liang C. Y., Feng Y., Hu F. (2023). Impact of the digital economy on high-quality urban economic development: Evidence from Chinese cities. Econ. Model. 120, 106194. doi: 10.1016/j.econmod.2023.106194
Hamilton J., Hogan B., Lucas K., Mayne R. (2019). Conversations about conservation? Using social network analysis to understand energy practices. Energy Res. Soc Sci. 49, 180–191. doi: 10.1016/j.erss.2018.10.030
Han J., Jiang T. (2022). Does the development of the digital economy improve carbon emission effciency? Front. Ecol. Evol. 10, 1031722. doi: 10.3389/fevo.2022.1031722
Hao Y., Li Y., Guo Y. X., Chai J. X., Yang C. X., Wu H. T. (2022). Digitalization and electricity consumption: does internet development contribute to the reduction in electricity intensity in China? Energy Policy 164, 112912. doi: 10.1016/j.enpol.2022.112912
Hao X., Wen S., Li Y., Xu Y., Xue Y. (2022). Can the digital economy development curb carbon emissions? Evidence from China. Front. Psychol. 13, 938918. doi: 10.3389/fpsyg.2022.938918
Jiang S., Li Y., Lu Q., Hong Y., Guan D., Xiong Y., et al. (2021). Policy assessments for the carbon emission flows and sustainability of Bitcoin blockchain operation in China. Nat. Commun. 12 (1), 1–10. doi: 10.1038/s41467-021-22256-3
Jiang Q., Ma X. (2021). Spillovers of environmental regulation on carbon emissions network. Technol. Forecast. Soc 169, 120825. doi: 10.1016/j.techfore.2021.120825
Kuik O., Branger F., Quirion P. (2019). Competitive advantage in the renewable energy industry: Evidence from a gravity mode. Renew. Energy 131, 472–481. doi: 10.1016/j.renene.2018.07.046
Lan F., Li S., Pu W. Y. (2021). Research on the influence of manufacturing agglomeration modes on regional carbon emission and spatial effect in China. Econ. Model. 96, 346–352. doi: 10.1016/j.econmod.2020.03.016
Leng Z. H., Sun H., Cheng J. H., Wang H., Yao Z. (2021). China’s rare earth industry technological innovation structure and driving factors: A social network analysis based on patents. Resour. Policy 73, 102233. doi: 10.1016/j.resourpol.2021.102233
Li K., Kim D. J., Lang K. R., Kauffman R. J., Naldi M. (2020). How should we understand the digital economy in Asia? Critical assessment and research agenda. Electron. Commer. Res. Appl. 44, 101004. doi: 10.1016/j.elerap.2020.101004
Li F. Y., Li X. M. (2022). An empirical analysis on regional natural gas market of China from a spatial pattern and social network perspective. Energy 244, 122598. doi: 10.1016/j.energy.2021.122598
Li Z., Wang J. (2022). The dynamic impact of digital economy on carbon emission reduction: Evidence city-level empirical data in China. J. Clean. Prod. 351, 131570. doi: 10.1016/j.jclepro.2022.131570
Liu D., Zeng X. M., Su B., Wang W. B., Sun K., Sadia U. H. (2020). A social network analysis regarding electricity consumption and economic growth in China. J. Clean. Prod. 274, 122973. doi: 10.1016/j.jclepro.2020.122973
Meng X. X., Liu M. L., Wang J. (2021). Innovation network economic model of new energy automobile industry based on social network perspective. J. Therm. Anal. Calorim. 144, 1671–1168. doi: 10.1007/s10973-020-10369-8
Norbutas L., Corten R. (2018). Network structure and economic prosperity in municipalities: A large-scale test of social capital theory using social media data. Soc Networks 52, 120–134. doi: 10.1016/j.socnet.2017.06.002
Ozturk I., Ullah S. (2022). Does digital financial inclusion matter for economic growth and environmental sustainability in OBRI economies? An empirical analysis. Resour. Conserv. Recy. 185, 106489. doi: 10.1016/j.resconrec.2022.106489
Ren S., Hao Y., Xu L., Wu H., Ba N. (2021). Digitalization and energy: how does internet development affect China’s energy consumption? Energy Econ. 98, 105220. doi: 10.1016/j.eneco.2021.105220
Ruiz D., San Miguel G., Rojo J., Teriús-Padrón J. G., Gaeta E., Arredondo M. T., et al. (2022). Life cycle inventory and carbon footprint assessment of wireless ICT networks for six demographic areas. Resour. Conserv. Recy. 176, 105951. doi: 10.1016/j.resconrec.2021.105951
Salahuddin M., Alam K. (2016). Information and communication technology, electricity consumption and economic growth in OECD countries: a panel data analysis. Int. J. Electr. Power 76, 185–193. doi: 10.1016/j.ijepes.2015.11.005
Shen W. R., Liang H. W., Dong L., Ren J. Z., Wang G. J. (2020). Synergistic CO2 reduction effects in Chinese urban agglomerations: Perspectives from social network analysis. Sci. Total Environ. 798, 149352. doi: 10.1016/j.scitotenv.2021.149352
Simon W. J., Krupnik T. J., Aguilar-Gallegos N., Halbherr L., Groot J. C. (2021). Putting social networks to practical use: improving last-mile dissemination systems for climate and market information services in developing countries. Clim. Serv. 23, 100248. doi: 10.1016/j.cliser.2021.100248
Song C. Y., Zhang Z. M., Xu W. H., Elshkaki A. (2023). The spatial effect of industrial transfer on carbon emissions under firm location decision:A carbon neutrality perspective. J. Environ. Manage. 330, 117139. doi: 10.1016/j.jenvman.2022.117139
Su Y., Yu Y. Q. (2019). Spatial association effect of regional pollution control. J. Clean. Prod. 213, 540–552. doi: 10.1016/j.jclepro.2018.12.121
Tang X., Ding S. T., Gao X., Zhao T. Q. (2022). Can digital finance help increase the value of strategic emerging enterprises? Sustain. Cities Soc 81, 103829. doi: 10.1016/j.scs.2022.103829
Tang L., Lu B., Tian T. (2021). Spatial correlation network and regional differences for the development of digital economy in China. Entropy 23 (12), 1575. doi: 10.3390/e23121575
Wang J. D., Dong K. Y., Dong X. C., Taghizadeh-Hesary F. (2022). Assessing the digital economy and its carbon-mitigation effects: The case of China. Energy Econ. 113, 106198. doi: 10.1016/j.eneco.2022.106198
Wang W. W., Gao P. P., Wang J. H. R. (2023). Nexus among digital inclusive finance and carbon neutrality: Evidence from company-level panel data analysis. Resour. Policy 80, 103201. doi: 10.1016/j.resourpol.2022.103201
Wang H. P., Liu P. L. (2023). Spatial correlation network of energy consumption and its influencing factors in the Yangtze River Delta Urban Agglomeration. Sustainability 15, 3650. doi: 10.3390/su15043650
Wang L. H., Shao J. (2023). Digital economy, entrepreneurship and energy efficiency. Energy 269, 126801. doi: 10.1016/j.energy.2023.126801
Wang H. P., Zhang R. J. (2022). Effects of environmental regulation on CO2 emissions: An empirical analysis of 282 cities in China. Sustain. Prod. Consump. 29, 259–272. doi: 10.1016/j.spc.2021.10.016
Xue Y., Tang C., Wu H., Liu J., Hao Y. (2022). The emerging driving force of energy consumption in China: Does digital economy development matter? Energy Policy 165, 112997. doi: 10.1016/j.enpol.2022.112997
Yang P. J., Peng S., Benani N., Dong L. Y., Li X. M., Liu R. P., et al. (2022). An integrated evaluation on China's provincial carbon peak and carbon neutrality. J. Clean. Prod. 377, 134497. doi: 10.1016/j.jclepro.2022.134497
Yu J. K., Ma J. Q. (2020). Social network analysis as a tool for the analysis of the international trade network of aquatic products. Aquacult. Int. 28, 1195–1211. doi: 10.1007/s10499-020-00520-5
Yu H. Y., Wei W., Li J. H., Li Y. (2022). The impact of green digital finance on energy resources and climate change mitigation in carbon neutrality: Case of 60 economies. Resour. Policy 79, 103116. doi: 10.1016/j.resourpol.2022.103116
Yu H., Zhu Q. (2023). Impact and mechanism of digital economy on China’s carbon emissions: From the perspective of spatial heterogeneity. Environ. Sci. pollut. Res. 30 (4), 9642–9657. doi: 10.1007/s11356-022-22552-5
Zhang M. L., Chen X. ,. L., Yang G. M. (2023). Coupling coordination degree and influencing factors of green science and technology innovation efficiency and digital economy level: Evidence from provincial panel data in China. Front. Environ. Sci. 11, 1104078. doi: 10.3389/fenvs.2023.1104078
Zhang W., Liu X. M., Wang D., Zhou J. P. (2022). Digital economy and carbon emission performance: Evidence at China's city level. Energy Policy 165, 112927. doi: 10.1016/j.enpol.2022.112927
Zhang L., Mu R., Zhan Y., Yu J., Liu L., Yu Y., et al. (2022). Digital economy, energy efficiency, and carbon emissions: Evidence from provincial panel data in China. Sci. Total Environ. 852, 158403. doi: 10.1016/j.scitotenv.2022.158403
Zhang P. F., Zhao Y. Y., Zhu X. H., Cai Z. W., Xu J. X., Shi S. (2020). Spatial structure of urban agglomeration under the impact of high-speed railway construction: Based on the social network analysis. Sustain. Cities Soc 62, 10240. doi: 10.1016/j.scs.2020.102404
Zhao X., Dong Y., Gong X. (2022). The digital economy and carbon productivity: Evidence at China’s city level. Sustainability 14 (17), 10642. doi: 10.3390/su141710642
Zhong K., Fu H., Li T. (2022). Can the digital economy facilitate carbon emissions decoupling? An empirical study based on provincial data in China. Int. J. Env. Res. Pub. He. 19 (11), 6800. doi: 10.3390/ijerph19116800
Zhong C., Liu C., Li Y. (2017). Actively respond to the “Digital economy”: the gap between China and the United States, causes and countermeasures. Econ. Rev. 4, 41–47.
Keywords: digital economy, carbon emissions, social network analysis, network characteristics, central position
Citation: Wang H and Liu P (2023) Characteristics of China’s digital economy network and its impact on carbon emissions. Front. Ecol. Evol. 11:1243360. doi: 10.3389/fevo.2023.1243360
Received: 20 June 2023; Accepted: 08 August 2023;
Published: 01 September 2023.
Edited by:
Shi Yin, Hebei Agricultural University, ChinaReviewed by:
Ying Zhu, Xi’an University of Architecture and Technology, ChinaZerouali Bilel, University of Chlef, Algeria
Copyright © 2023 Wang and Liu. This is an open-access article distributed under the terms of the Creative Commons Attribution License (CC BY). The use, distribution or reproduction in other forums is permitted, provided the original author(s) and the copyright owner(s) are credited and that the original publication in this journal is cited, in accordance with accepted academic practice. No use, distribution or reproduction is permitted which does not comply with these terms.
*Correspondence: Huiping Wang, d2FuZ2h1aXBpbmdAeGF1ZmUuZWR1LmNu
 Huiping Wang
 Peiling Liu