 Jaap P. P. Saers1,2*
- 1Department of Archaeology, University of Cambridge, Cambridge, United Kingdom
- 2Vertebrate Evolution Development and Ecology, Naturalis Biodiversity Center, Leiden, Netherlands
Introduction: Modern humans are the only fully terrestrial ape. All other apes are partially arboreal, particularly as infants and juveniles. Precocial locomotor development, high frequency of arboreal locomotion in early ontogeny, and increased terrestriality throughout development are ubiquitous amongst the hominines and likely represent the ancestral state. The role of climbing in hominin evolution has been debated for decades, but if hominins climbed regularly then subadults likely relied on it most frequently. Investigating the role of climbing throughout hominin evolution requires reliable developmentally plastic traits that are responsive to locomotor loading and can be identified in the fossil record. Chimpanzees and gorillas provide a natural experiment to examine the relationship between age-related variation locomotor activities and bone structure. Chimpanzees and gorillas are most arboreal during infancy and become more terrestrial throughout development. Gorillas are comparatively more terrestrial and transition to predominantly terrestrial locomotion at an earlier age. This paper has two main objectives. First, to examine if interspecific differences in the rate of locomotor development is reflected in bone structure. Second, to determine if ontogenetic reductions in the frequency of arboreal locomotion correspond to age-related variation in bone structure.
Methods: The humerus, tibia, calcaneus, and seventh cervical vertebrae of an ontogenetic series of gorillas and chimpanzees from the Powell Cotton Museum (n = 71) were uCT scanned. Trabecular, cortical, and total bone volume fraction (BV/TV) were calculated in developmentally homologous regions of interest.
Results: BV/TV scales with positive allometry throughout ontogeny. The achievement of adult-like locomotor behaviour can be identified by a significant change in the slope of Total.BV/TV with age. Younger, more arboreal individuals have relatively greater upper limb Total.BV/TV relative to the neck and lower limb than older, more terrestrial individuals in gorillas and chimpanzees. More arboreal chimpanzees have relatively more Total.BV/TV in the upper limb relative to the lower limb and neck.
Discussion: The correspondence between developmental trajectories of BV/TV and locomotor ontogeny in extant apes suggests that analyses of hominin skeletal ontogeny can provide new insights into the evolution of two characteristic human traits: our slow rate of maturation and the evolution of fully terrestrial bipedalism.
1 Introduction
Modern humans are the only fully terrestrial apes. All other apes incorporate arboreal locomotion into their locomotor repertoire to varying degrees (Thorpe and Crompton, 2006; Doran, 2010). Arboreal locomotion is a broad term that includes a diverse set of actions including vertical climbing, bridging between trees, uni-, bi- and tri-limb suspension, bipedal and quadrupedal walking on branches (Thorpe and Crompton, 2006). Asian hominoids – gibbons, siamangs, and orangutans – remain largely arboreal throughout life (Sugardjito and van Hooff, 1986; Phillips, 2011; Fan et al., 2013). Non-human African apes transition from a predominantly arboreal locomotor repertoire in infancy to a repertoire of dominated by high frequencies of terrestrial knuckle walking, although they remain highly competent climbers throughout their life (Doran, 1992; Doran, 1997; Sarringhaus et al., 2014). Modern humans are still able to climb trees and members of some populations climb regularly to collect honey or fruit (Venkataraman et al., 2013). However, regular tree climbing is far from a universal human behaviour and its frequency largely depends on environmental conditions and subsistence strategy.
The percentage of arboreal locomotion relative to total locomotion is negatively associated with body mass across primates including Nomascus (Fan et al., 2013), Pygathrix (Bailey et al., 2020), Macaca fuscata (Chatani, 2003), and African apes (Doran, 1997). Infants are often most arboreal, followed by juveniles, smaller adult females, then larger bodied adult males (Dunbar and Badam, 1998). In almost fully arboreal Cao vit gibbons (Nomascus nasatus) infants and juveniles climb and brachiate most, followed by adult females, and finally adult males. Adults males bridge and walk more than the others (Fan et al., 2013). Non-human apes are relatively precocial in terms of locomotor development compared to humans (Doran, 1992; Doran, 1997; Lacquaniti et al., 2012; Young and Shapiro, 2018; Saers et al., 2022b). The terms altricial and precocial represent two ends of a spectrum used to described the state at birth of birds and mammals. Animals on the precocial side of the spectrum are born relatively mature and mobile. While the onset of locomotion in African apes is around 4–5 months after birth, humans don’t begin walking until around 12 months of age (Doran, 1997; Sutherland, 1997; Sarringhaus et al., 2014). Delayed, altricial, locomotor development in modern humans can be linked to a slow rate of neuromuscular maturation compared to other apes which, in turn, is strongly related to adult brain size (Iwaniuk and Nelson, 2003; Garwicz et al., 2009; Saers et al., 2022b). Modern humans are exceptional amongst the apes in terms of a late onset, slow maturation rate, and obligate bipedal mode of locomotion. Precocial locomotor development, high frequency of arboreal locomotion in early ontogeny, and increased frequency of terrestrial locomotion throughout development are therefore likely the ancestral hominin condition. This is supported by the relatively small adult brain size and ape-like upper limb anatomy of early hominins such as Ardipithecus ramidus (White et al., 2009), several species of Australopithecus (Green and Alemseged, 2012; Rein et al., 2017; Dunmore et al., 2020; Alemseged, 2023), and Homo naledi (Feuerriegel et al., 2017). However, it is debated how well anatomical traits in fossil hominins can be linked to arboreality (Stern, 2000; Ward, 2002). Some interpret the ape-like postcranial traits found in Pliocene hominins to indicate the retention of arboreal locomotor capabilities (Stern and Susman, 1983; Stern, 2000; Rein et al., 2017; Kivell et al., 2018; Alemseged, 2023) while others argue that ape-like postcranial traits are most likely unused retentions of an ancestral state that are either selectively neutral or a case of stabilizing selection (Latimer and Lovejoy, 1989; Latimer, 1991; Ward, 2002). Taken together, the ancestral hominin condition of locomotor development was likely similar to extant non-human apes with a relatively early onset of locomotion, a relatively fast rate of locomotor development and including an arboreal component, particularly in early ontogeny. The modern human condition of altricial locomotor development lacking a significant arboreal component emerged at some point during the last 7 million years of hominin evolution. How, when, and why this transition occurred is still up for debate.
There are several reasons why precocial locomotor development and climbing ability can enhance fitness of both mother and offspring. Before being able to pass on one’s genes, an individual first has to survive until reproductive age. Because juvenile animals suffer higher rates of predation than adults, selection on juvenile locomotor performance is strong (Wasserug and Sperry, 1977; Carrier, 1983; Carrier, 1995; Jablonski et al., 2002; Young and Shapiro, 2018). Once past infancy, mortality rates are lower in apes than in monkeys (Kelley, 2002). Precocial climbing ability may increase the odds of surviving the dangerous infant years by enabling an individual to avoid predators by clinging to their mother or independently fleeing up a tree. A review of predation events on African great apes indicates that apes rely on trees to avoid lions and are more likely to escape forest leopard in trees than on the ground (Klailova et al., 2013). Chimpanzees also construct nests in trees to avoid predators (Stewart and Pruetz, 2013). Nests are built higher and closer to the periphery of trees in groups that live in areas with more predators (Pruetz et al., 2008; Stewart and Pruetz, 2013). In addition to predator avoidance, precocial climbing ability may reduce energetic demands of travel for both mother and offspring. Manually carrying an infant incurs significant costs to mothers, representing an energetic drain similar to lactation (Altmann and Samuels, 1992; Ross, 2001; Wall-Scheffler et al., 2007). Wall-Scheffler et al. (2007) calculated that, in humans, actively carrying a baby in one’s arms costs 16% more energy than carrying them in a sling. An infant that is able to cling onto its mother by itself saves its mother a significant amount of energy. Suspensory postures requires little muscular effort in the shoulder and elbow of apes (Tuttle and Basmajian, 1974; Tuttle and Basmajian, 1978; Tuttle et al., 1983). Instead, bones and ligaments carry the stresses of suspensory arm hanging (Hunt, 2016). Hominins that possessed similar osseoligamentous adaptations in the upper limb and thorax as extant apes likely reduced the energetic cost to the infant of clinging on to its mother.
The evolutionary transition from a relatively small, bipedal, and partially arboreal hominin to a larger, fully terrestrial hominin required substantial changes to the timing and rate of neuromuscular maturation and musculoskeletal development in early Homo, but it is unknown is when and how these developmental changes occurred due to a historical dearth of juvenile hominin fossils. Recent discoveries of juvenile hominins (Alemseged et al., 2006; Bolter et al., 2020; Cofran et al., 2022; Braga et al., 2023) paired with methodological advances in the functional analysis of whole bones (Gross et al., 2014; DeMars et al., 2021; Saers et al., 2022b) provide a unique opportunity to investigate the evolution of hominin locomotor development.
Bone morphology is partially determined by genetic processes that regulate growth and development and partially by bone cells adapting to their mechanical environment (Carter and Beaupré, 2001; Wells and Stock, 2011; Paaby and Testa, 2018; Hallgrimsson et al., 2019). Reconstructing age-related variation in locomotor behaviour from skeletal remains requires mechanically sensitive traits that are phenotypically plastic throughout ontogeny. Several studies have demonstrated the developmental plasticity in response to locomotor loading in hominoid long bone diaphyseal structure (Carrier, 1983; Cowgill, 2010; Cowgill et al., 2010; Sarringhaus et al., 2016; Cowgill and Robyn, 2018; Morimoto et al., 2018; Ruff et al., 2018; Nadell et al., 2021). Ruff and colleagues (2018) investigated the ontogeny of limb morphology and diaphyseal strength between relatively arboreal western lowland gorillas to more terrestrial Virunga mountain gorillas. They showed that limb bone diaphyseal robusticity is identical birth but diverges after two years of age after which the more arboreal lowland gorillas obtain relatively stronger forelimbs. In contrast, limb bone lengths and joint dimensions did not differ ontogenetically between gorilla species. In other words, some aspects of limb morphology like length and joint size are relatively canalized whereas other aspects such as cross-sectional geometry of the shaft are plastic and more free to vary in response to environmental inputs such as locomotor behaviour during development (Ruff et al., 2018).
Ontogenetic trajectories of diaphyseal structure provide insights into age-related variation in locomotor behaviour in fossil taxa. The utility of trabecular bone structure for reconstructing locomotor behaviour has not been investigated as extensively. Trabecular bone is a type of bone tissue that fills the interior of bones with a latticework of small bony rods and plates and interstices containing bone marrow or fat. However, interest in trabecular bone functional adaptation has increased dramatically over the last decade due to the increased availability of high resolution CT imaging and computing power (Kivell, 2016). The high remodelling rate and complex three dimensional structure of trabecular bone potentially makes it a more dynamic indicator of developmental changes in joint loading conditions compared to cortical bone (Carter and Beaupré, 2001). Bones adapt to changes in loading direction, magnitude, and frequency by altering the structure of trabecular bone. Research on trabecular bone development is still relatively in its infancy, but previous research on humans (Raichlen et al., 2015; Ryan et al., 2017; Colombo et al., 2019; Saers et al., 2020; Chevalier et al., 2021; Figus et al., 2022; Saers et al., 2022b), non-human primates (Tsegai et al., 2018; Ragni, 2020; Deckers et al., 2022; Saers et al., 2022a; Saers et al., 2022b; Cosman, 2023) and other mammals (Tanck et al., 2001; Wolschrijn and Weijs, 2004; Gorissen et al., 2016) points to the existence of strong links between changes in loading conditions and trabecular structure throughout growth and development.
Recently, I proposed a model that situates ontogenetic trajectories of trabecular bone within a broader developmental context of neuromuscular development, locomotor control, and ultimately life history in primates (Saers et al., 2022b). This work showed that age-related variation in trabecular bone in the primate calcaneus is strongly associated with ontogenetic changes in locomotor kinetics, which, in turn, is a consequence of interactions between brain development and body size growth. These findings point to fundamental links between ontogenetic changes in bone morphology on the one hand, and locomotor behaviour, brain development, and life history on the other. Age-related variation in bone structure therefore can serve not just as a proxy for developmental changes in locomotor kinetics, but perhaps also of neuromuscular maturation in fossil taxa (Saers et al., 2022b). This model for trabecular bone ontogeny was based on the analysis of trabecular structure in the calcaneus of humans, chimpanzees, gorillas, and Japanese macaques. This paper builds on the framework and methodology outlined in Saers et al. (2022b) in three ways. First, I will test the model’s predictions in additional anatomical regions including the upper limb, lower limb, and neck. Secondly, I will examine if age-related variation in arboreal locomotion reflected in the bone structure of these anatomical regions. Finally, I will examine whether the model predictions apply to trabecular, cortical, and total bone volume fraction in various anatomical regions.
The overall aim of this paper is to examine if ontogenetic changes in the locomotion correspond to age-related variation in bone structure. The African non-human apes, chimpanzees and gorillas, provide a natural experiment for examining the relationship between age-related variation locomotor activities and bone structure. Both chimpanzees and gorillas are most arboreal during infancy and become more terrestrial with increasing age and body size (Doran, 1992; Doran, 1997; Doran-Sheehy et al., 2009; Sarringhaus et al., 2014). Gorillas are more terrestrial than chimpanzees on average (Masi, 2004; Doran-Sheehy et al., 2009; Doran, 2010) and the shift to predominantly terrestrial locomotion occurs at an earlier age (Doran, 1997). Locomotor ontogeny of both taxa is described in greater detail in the material and methods section. I will examine if these relatively subtle species differences in locomotor ontogeny correspond to ontogenetic trajectories of bone structure throughout the postcranium of gorillas and chimpanzees. If supported, these traits may be used to investigate the evolution of hominin locomotion and locomotor development.
The first aim of this study is to examine if age-related variation in bone structure throughout the postcranium of African apes corresponds to locomotor maturation. Previous work on the primate calcaneus has shown that landmark moments in the development of locomotion including the onset of locomotion and the achievement of adult-like locomotion can be identified as distinct changes in the slope of bone volume fraction when plotted against age (Saers et al., 2022b). These predictions will be tested in several skeletal elements throughout the appendicular skeleton that are actively involved in propelling the body forward during locomotion (calcaneus, tibia, humerus) and the seventh cervical vertebrae (C7) which is not actively involved in locomotion. Since the neck is not actively involved in propelling the body forward during locomotion, the relationship between locomotor development and trabecular structure should be absent, or at least significantly weaker in the C7 compared to limbs. In other words, no significant changes in slope of bone volume fraction are expected in the C7 when plotted against age. I will test these predictions in three different variables: trabecular bone volume fraction (Tb.BV/TV), cortical bone volume fraction (Ct.BV/TV), and total bone volume fraction (Total.BV/TV). The null-hypothesis (H01) is that no significant changes in slope occur at the ages when adult-like locomotor patterns are achieved in gorillas (3–4 years) and chimpanzees (4–6 years) (Doran, 1997; Sarringhaus et al., 2014). Significant changes in slope will be identified using piecewise linear regression analyses (see Section 2). H01 is rejected under the following three conditions:
1. Significant breakpoints in slope between age and bone volume fraction identified using piecewise linear regressions overlap with the age of locomotor onset and the achievement of adult gait in the appendicular skeleton.
2. Piecewise regression models are higher quality models compared to linear regressions between age and bone volume fraction in the appendicular skeleton. Model quality is indicated by a high R2 and low Akaike Information Criterion values [AIC, (Akaike, 1974)].
3. No breakpoint should occur in the relationship between age and bone volume fraction in the C7.
The second aim of the study is to investigate whether age-related variation in the frequency of arboreal locomotion relative to total locomotor activities is reflected in bone structure during development. Arboreal locomotion involves a greater degree of upper limb use compared to terrestrial locomotion (Ruff et al., 2018; Sarringhaus et al., 2022). An individual that is largely arboreal would therefore be expected to have more robust upper limbs (greater trabecular, cortical, and total BV/TV) relative to the neck and lower limb. Conversely, an individual that is predominantly terrestrial would be expected to have more robust lower limbs compared to the upper limb and the neck. Terrestrial knuckle walking loads both fore- and hindlimbs but given that quadrupedal locomotion in African apes, and primates in general, is hindlimb driven, loads are significantly greater on the hindlimbs (Kimura et al., 1979; Demes et al., 1994). I will test these predictions using ratios of bone volume fraction between upper limb (proximal humerus), neck (C7), and lower limb (calcaneus and distal tibia). Data on ontogenetic variation in terrestriality (terrestrial locomotor time/total locomotor time) from published studies on locomotor development will be age-matched to skeletal data. The null-hypothesis (H02) is that there is no significant relationship between terrestriality and ratios of bone volume fraction. H02 is rejected if:
1. Bone volume fraction in the humerus divided by the C7 is negatively associated with terrestriality.
2. Bone volume fraction in the lower limb elements (calcaneus and tibia) divided by the C7 is positively associated with terrestriality.
3. Bone volume fraction in the upper limb divided by the lower limb elements is negatively associated with terrestriality.
2 Materials and methods
2.1 Materials
The gorilla (Gorilla gorilla, n = 37) and chimpanzee (Pan troglodytes, n = 34) are wild shot specimens derived from the skeletal collection of the Powell Cotton Museum, Kent, UK (Gordon et al., 2013). Sample numbers for each species and anatomical region are provided in Table 1. Most bones come from complete specimens but some were damaged by metal nails that were used to hold skeletons together in the past, and were excluded from the study. Age at death was estimated by scoring the degree of dental crown and root development from CT scans of the mandible using reference images from (Dean and Wood, 1981). Relevant life history variables for both species are provided in Table 2. Body mass was estimated from supero-inferior femoral head diameter following ontogenetic regression equations by Burgess et al. (2018):
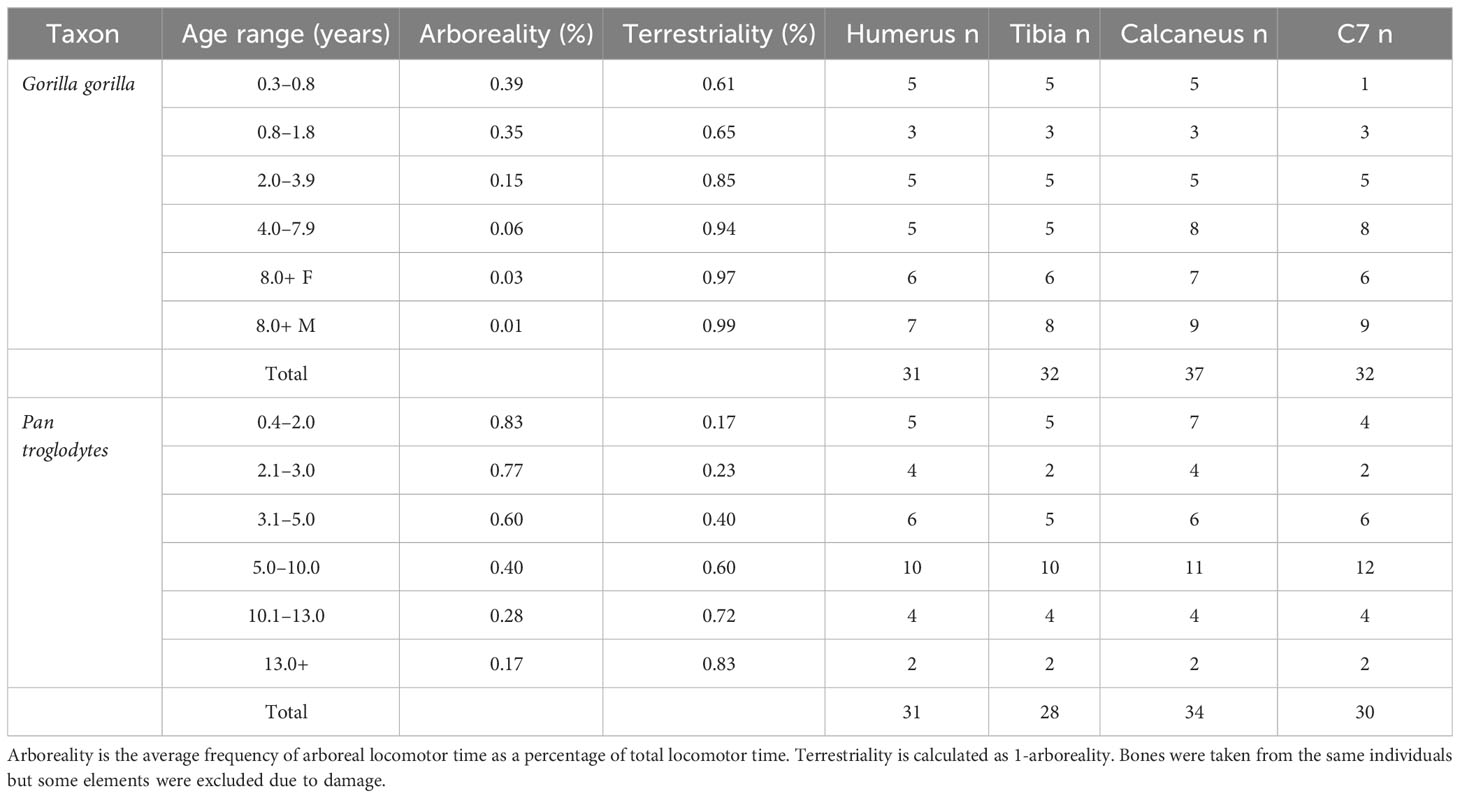
Table 1 Study sample divided across age categories used by Sarringhaus et al. (2014) for chimpanzees and Doran (1997) for gorillas.

Table 2 Summary of selected life history variables in mean years after birth.
Where BM is body mass in kilograms and FHD is femoral head diameter in millimetres.
2.2 Locomotor development in African apes
Chimpanzees (Pan troglodytes) show a remarkable transition in their locomotor repertoire from forelimb dominated arboreal locomotion to hindlimb driven terrestrial knuckle walking (Doran, 1992; Doran, 1997; Sarringhaus et al., 2014; Sarringhaus et al., 2016). There is limited independent locomotion in the first year of a chimpanzee’s life (Sarringhaus et al., 2014). During the first two years of life infant chimpanzees spend 80–90% of their locomotor time engaged in forelimb dominated suspensory and climbing behaviours with the remainder dominated by terrestrial quadrupedalism (Doran, 1997; Sarringhaus et al., 2014). Chimpanzees transition from palmigrade to knuckle walking quadrupedalism in the second year of life (Doran, 1997). Chimpanzees become increasingly terrestrial between 2–5 years of age (Doran, 1997). Adolescent chimpanzees spend 65% of their total locomotion on terrestrial quadrupedalism and adults around 80–90% (Doran, 1992; Doran, 1997; Sarringhaus et al., 2014). Doran (1992; 1997) argues that overall adult locomotor repertoires are obtained at juvenility while Sarringhaus et al. (2014) argues that adult-like locomotion does not fully appear until adolescence.
Doran (1997) described locomotor ontogeny in wild mountain gorillas (G. beringei) while Knobloch and Pasamanick described postural development in a single Western lowland gorilla (Gorilla gorilla gorilla) born in Columbus Zoo during the first 18 months of its life (Knobloch and Pasamanick, 1959). Infant mountain gorillas begin locomoting around 4–5 months of age on average. Before this they cling to or are held by their mother (Doran, 1997). Locomotion is dominated by the upper limb, including climbing and suspension, 90% of which occurs on the mother (Doran, 1997). Around six months infants begin palmigrade quadrupedal walking for short distances. Locomotion also becomes much more frequent and substrate use is divided roughly equally among the ground, branches, and the mother (Doran, 1997). Between 10 and 15 months after birth gorillas become significantly more active and transition from palmigrade quadrupedalism to knuckle walking. There is a pronounced shift towards adult-like, more terrestrial locomotion around 2 years where quadrupedalism begins to dominate and rate of locomotor activity decreases. Nearly all travel occurs independent of the mother at 2.5 years. By 4 years gorilla locomotor behaviour is adult-like and over 85% of locomotion is knuckle walking (Doran, 1997). The only detailed data on the locomotor development of gorillas was collected from Gorilla beringei (Doran, 1997) while this study uses a skeletal sample of Gorilla gorilla. Adult mountain gorillas (G. beringei) climb trees less regularly than Western gorillas (G. gorilla) (Remis, 1995; Doran, 1997; Doran, 2010). Adult Western lowland gorillas (G. gorilla gorilla) reportedly locomote using arboreal substrates more than 15% of the time (Masi, 2004; Doran-Sheehy et al., 2009), in contrast to 1–3% in G. beringei (Doran, 1997). Ruff and colleagues (2018) demonstrated that while limb bone cross-sectional robusticity does not differ at birth, mountain gorillas develop more robust lower limbs relative to upper limbs during ontogeny relative to lowland gorillas. In contrast, limb bone lengths and joint dimensions do not differ ontogenetically between gorilla species. In other words, some aspects of limb morphology like length and joint size are relatively canalized whereas other aspects such as cross-sectional geometry of the shaft are plastic and more free to vary in response to environmental inputs such as locomotor behaviour. Taken together, biomechanical analyses and field observations strongly suggest that mountain gorillas are more terrestrial overall than lowland gorillas. While frequencies of locomotor behaviours vary, the total locomotor repertoire of both species are identical (Remis, 1998). Currently, Doran’s field observations on G. beringei are the only detailed source on the development of gorilla locomotor behaviour. I will use these data to interpret the ontogenetic trajectory of trabecular bone in G. gorilla keeping in mind that environmental, behavioural and phylogenetic differences exist between the two species.
2.3 Quantifying arboreality
Bone volume fraction from individuals from the Powell Cotton skeletal collection was age-matched to data on age-related variation in the frequency of arboreal locomotion from the literature (Table 2). Age categories are different between taxa because Doran (1997) and Sarringhaus et al. (2014) used different age categories in their publications. Sex differences in the relative frequencies of terrestrial and arboreal locomotion were pronounced in adult Gorilla, presumably due to sexual dimorphism in body size. Hence, this is taken into account in adult Gorilla. Male and female Pan did not differ in the amount of time they spent in any locomotor mode in any age category and so males and females are pooled. In gorillas arboreality for each age category was calculated from data presented in Table 1 from Doran (1997) by summing the percentage of time spent climbing and in suspension. Some age categories were pooled by multiplying percentage of locomotor time with hours of locomotion for each category and dividing by the total number of locomotor hours. The degree of arboreality in Pan was taken from data presented in Sarringhaus et al. (2014). Infant 3 and 4 were pooled in the age range of 3.1–5.0 years and juvenile 1 and 2 were pooled into the 5.0–10.0 range. Locomotor ontogeny data is only available for G. beringei, yet the sample in this study is G. gorilla. Since G. beringei is more terrestrial than G. gorilla, it is likely that the degree of arboreality throughout ontogeny is underestimated for the gorilla sample. This will be taken into account in interpretations of the data.
2.4 CT-scanning and data processing
Specimens were µCT scanned with a Nikon XTH 225 ST HRCT laboratory scanning system at the University of Cambridge using energy settings optimized for the contrast between dry bone and air (125 kV, 135 µA, 1,080 views, 1,000 ms exposure). Voxel sizes of scans range between, 19 and 50 µm depending on bone size and reconstructions were saved as 16 bit tiff stacks.
Tiff stacks were imported into ORS Dragonfly (Object Research Systems Inc, Montreal, CA) for processing. Image stacks were segmented into bone and non-bone using Otsu segmentation (Otsu, 1979). The whole calcaneus was used in analyses but in other skeletal elements only a specific region of the bone (region of interest, ROI) was analysed (Figure 1). This approach was adopted to ensure that only regions of bone were analysed that are present in the youngest individuals included in the sample and to ensure that homologous regions are compared throughout development. The vertebral body of the C7 was isolated by severing the body from the pedicles and running a connected components analysis, keeping only connected voxels in the vertebral body. Long bone ROIs were scaled to 5% of diaphyseal length (distance between the medial edge of the proximal and distal growth plates). Scaling ROIs to a percentage of diaphyseal length is appropriate for ontogenetic studies since the position of superstructures of a bone (e.g. muscle and ligament attachments or articulations) scale isometrically with length (Stern et al., 2015). The proximal border of the humerus ROI was located at the widest region fitted along the diaphyseal long axis of the bone without including the growth plate in the cross-section. The distal border of the humerus ROI was located 5% of diaphyseal length distally along the long axis of the diaphysis. This ROI was chosen because it is the most proximal region of the humerus that is present in the youngest individuals and is easily recognisable on CT scans. This ROI overlaps with the surgical neck of the humerus which is a common site for humeral fractures and thus relevant from a bone functional adaptation perspective. The distal border of the tibia ROI was placed on the widest part of the metaphysis where the growth plate is not visible in cross-section. The proximal border of the ROI is located 5% of diaphyseal length proximally. Both long bone ROIs were oriented along the diaphyseal long axis of the humerus and tibia.
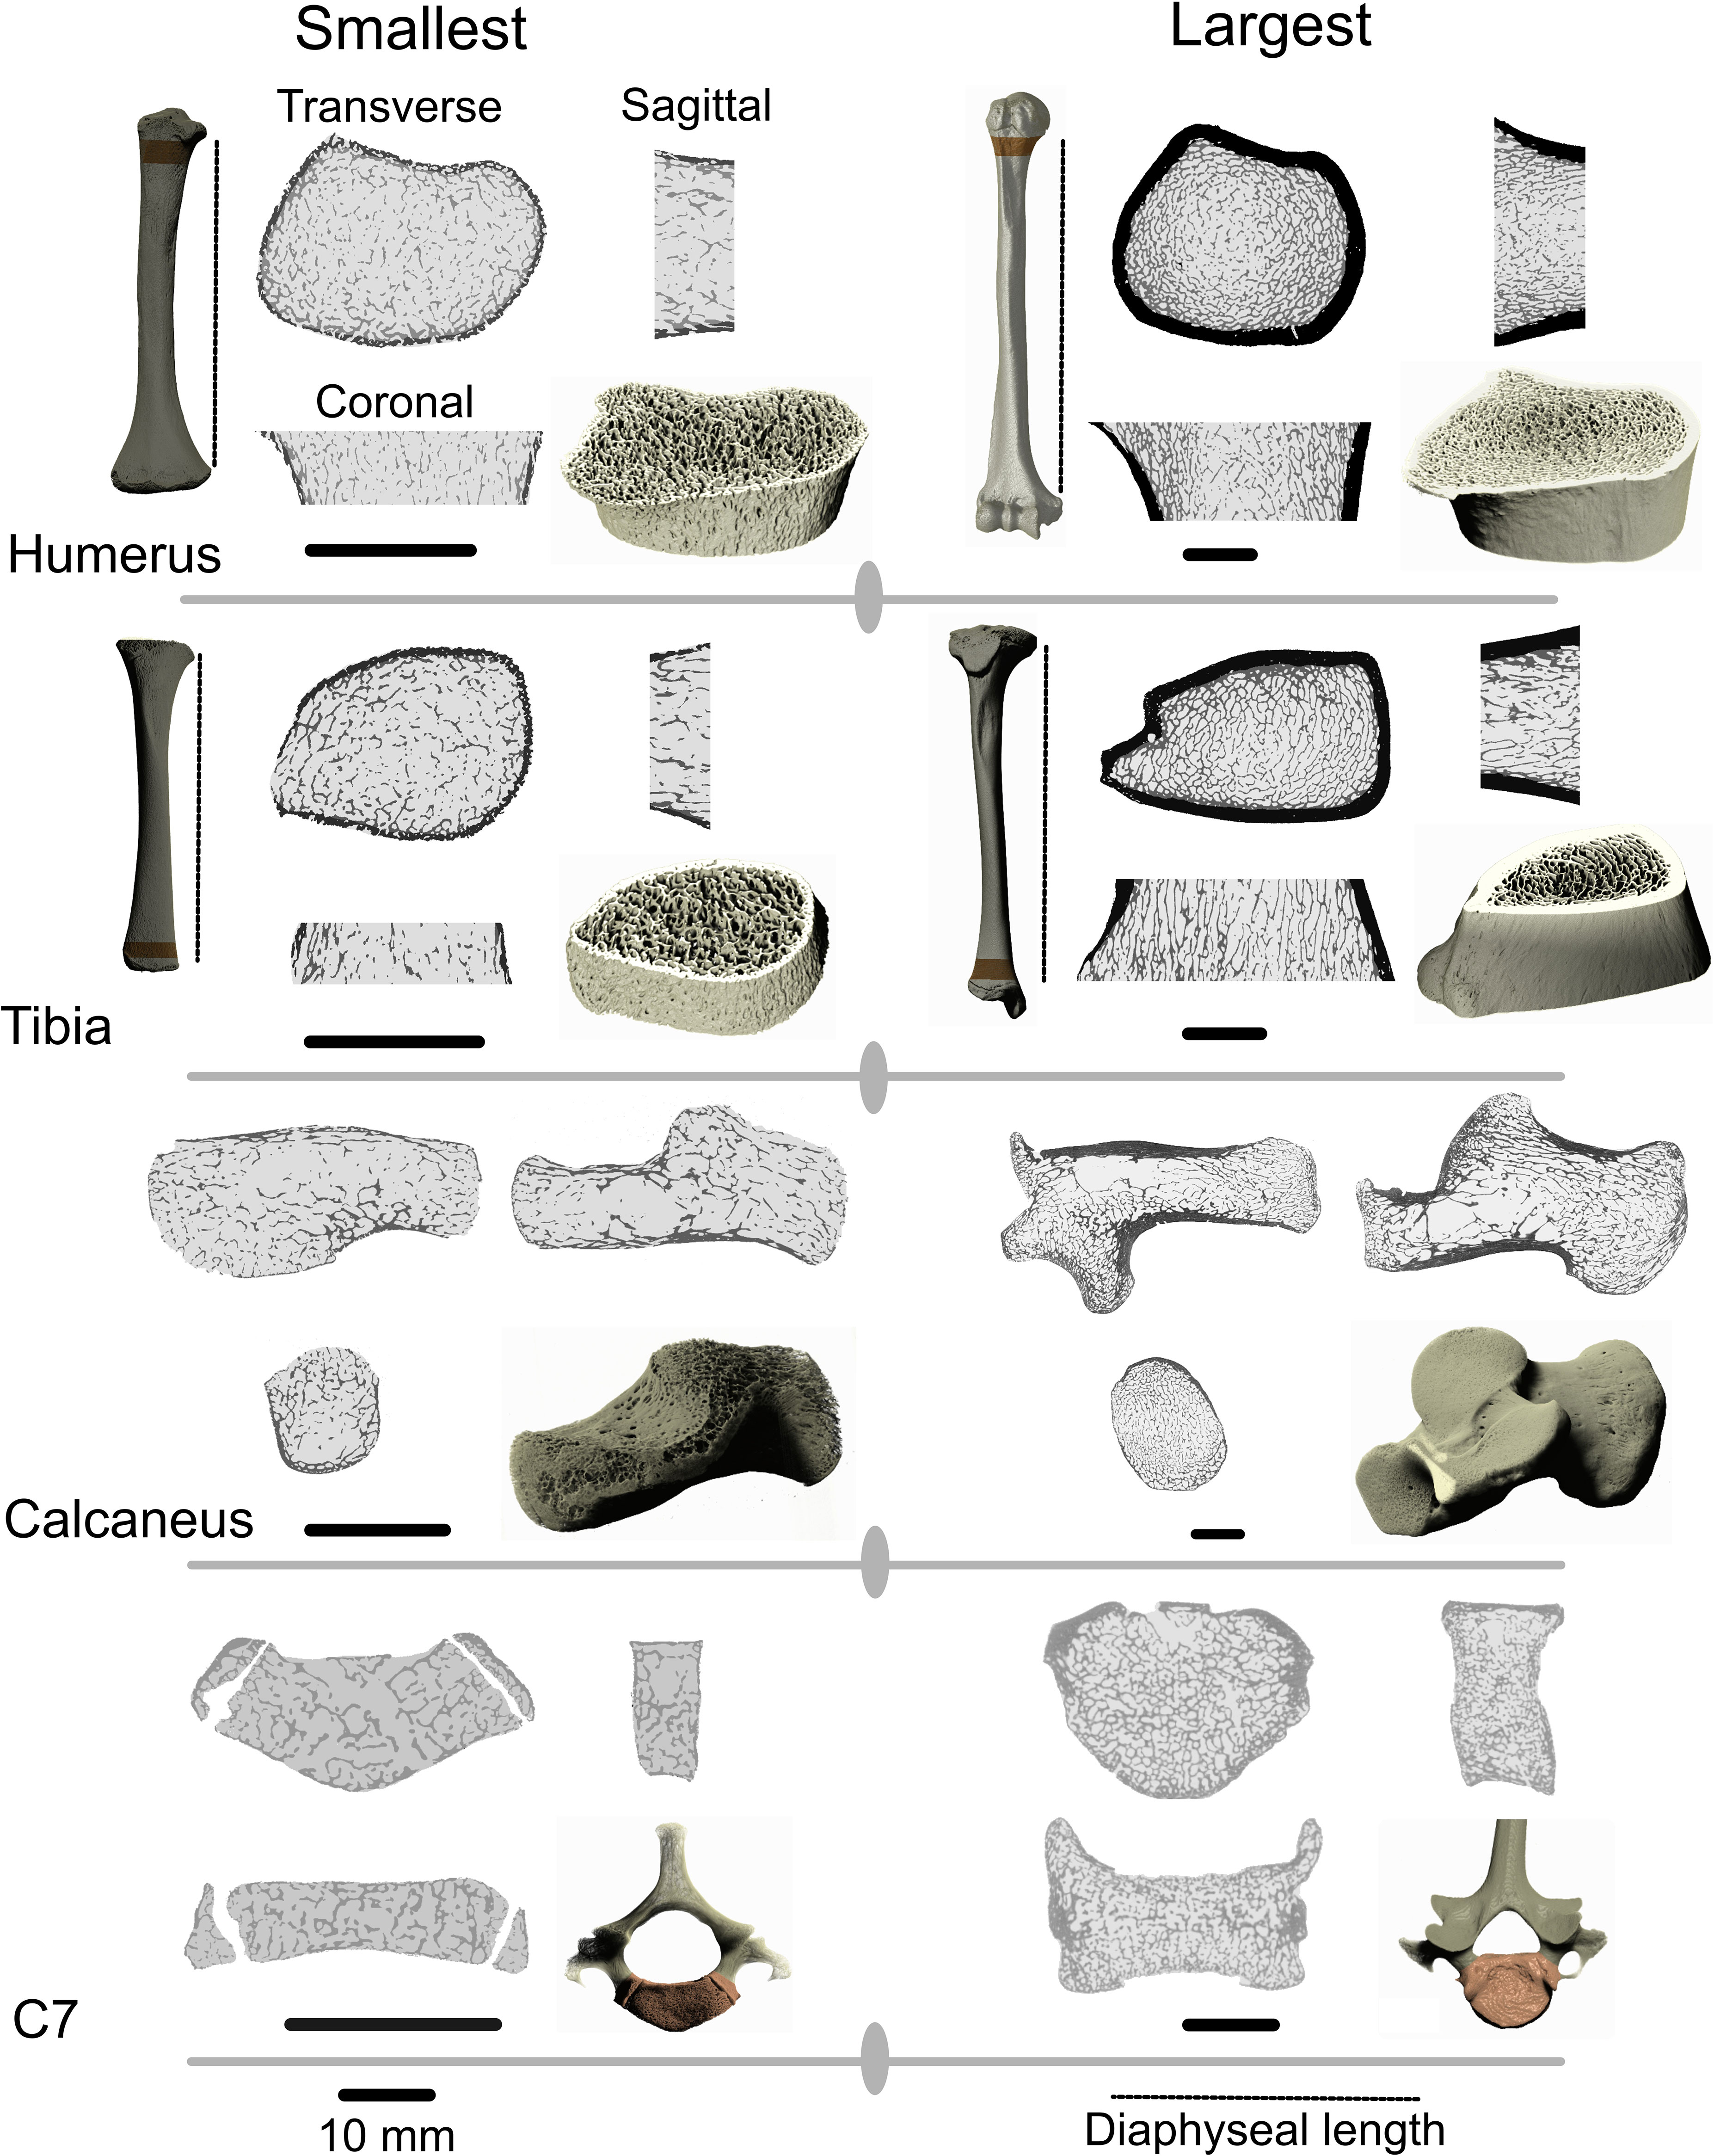
Figure 1 Regions of interest in the proximal humerus, distal tibia, calcaneus and seventh cervical vertebra (C7) in the individuals with the lowest body mass and highest body mass in the sample. Dark areas on the long bone ROIs are cortical bone. Long bone ROI height was scaled to 5% of diaphyseal length which is represented by the dotted line. Black scale bars represent the scale of the sagittal, coronal, and transverse slices and correspond to 10 mm. 3D renderings are not to scale.
Image stacks were exported from ORS Dragonfly as 8-bit binary tiff files and then imported into R version 4.2.3 (R Core Team, 2019). The indianaBones R package (Veneziano et al., 2021) was used to automatically separate internal trabecular bone from the cortical shell (Figure 1). The bone is filled using a sequence of erosion and dilation steps to create a filled mask. The marrow cavity and cortical shell are subsequently separated into an inner and outer mask (Veneziano et al., 2021). The masking process closes small pores present in the cortical bone, particularly in younger individuals. To correct for this, and to avoid overestimating cortical bone volume in younger individuals, the outer cortical mask is multiplied by the original binary images, resulting in a mask containing only true cortical bone pixels (Figure 1). Pixels were assigned one of four categories: air, cortical bone, trabecular bone, and bone marrow. Three variables were calculated for further analysis. Trabecular bone volume fraction (Tb.BV/TV) is a common biomechanical variable that is strongly correlated to trabecular bone stiffness (Maquer et al., 2015). Tb.BV/TV was calculated by dividing trabecular bone pixels by the total amount of pixels in the marrow cavity. Total.BV/TV was calculated by dividing the sum of cortical and trabecular bone pixels by the total number of pixels in the ROI. Cortical bone volume fraction (Ct.BV/TV) was calculated by dividing the sum of cortical bone pixels by the total number of pixels in the ROI. Ct.BV/TV represents the percentage of the total volume of the ROI that is taken up by the cortical bone compartment. 1-Ct.BV/TV would be the size of the marrow cavity within which Tb.BV/TV is calculated. Ct.BV/TV has little mechanical relevance but is instead used to quantify ontogenetic variation in relative volume of the cortical and medullary compartments of the ROI.
2.5 Statistical analysis
Regression analyses were performed in R version 4.2.3 using the lm() function. Bivariate plots were created using ggplot (Wickham, 2016). Piecewise regressions were performed using the ‘segmented’ R package (Muggeo, 2008). Piecewise regression is a useful technique for finding significant changes in slope in the relation between a dependent and independent variable. The technique uses dummy variables and an interaction term to split a linear regression into multiple segments. The least squares method is applied separately to each segment, by which the two regression lines are made to fit the dataset as closely as possible while minimizing the sum of squares of the differences between observed and predicted values of the dependent variable. When comparing various regression models, the model with the lowest Akaike Information Criterion (AIC; Akaike, 1974) and highest R2 was chosen as indicating the highest model quality. AIC measures the degree to which a model is overfit with lower values indicating less overfitting. Since R2 always increases with every predictor added to a model, R2 was adjusted for the number of terms in a model. Alpha level was set to 0.05 for all statistical tests.
3 Results
3.1 Allometry
Allometry describes how anatomical and physiological characteristics scale with body size. A scaling relationship is isometric when size and shape scale linearly and allometric when scaling is non-linear. Since BV/TV is a ratio, a scaling exponent (slope) of zero is expected under isometry in a log–log regression while significant positive and negative slopes are indicative of positive and negative allometry, respectively. Regressions with ln BV/TV as outcome variable and an interaction between ln estimated body mass and genus as predictor variables are presented in Figure 2 and Table 3.
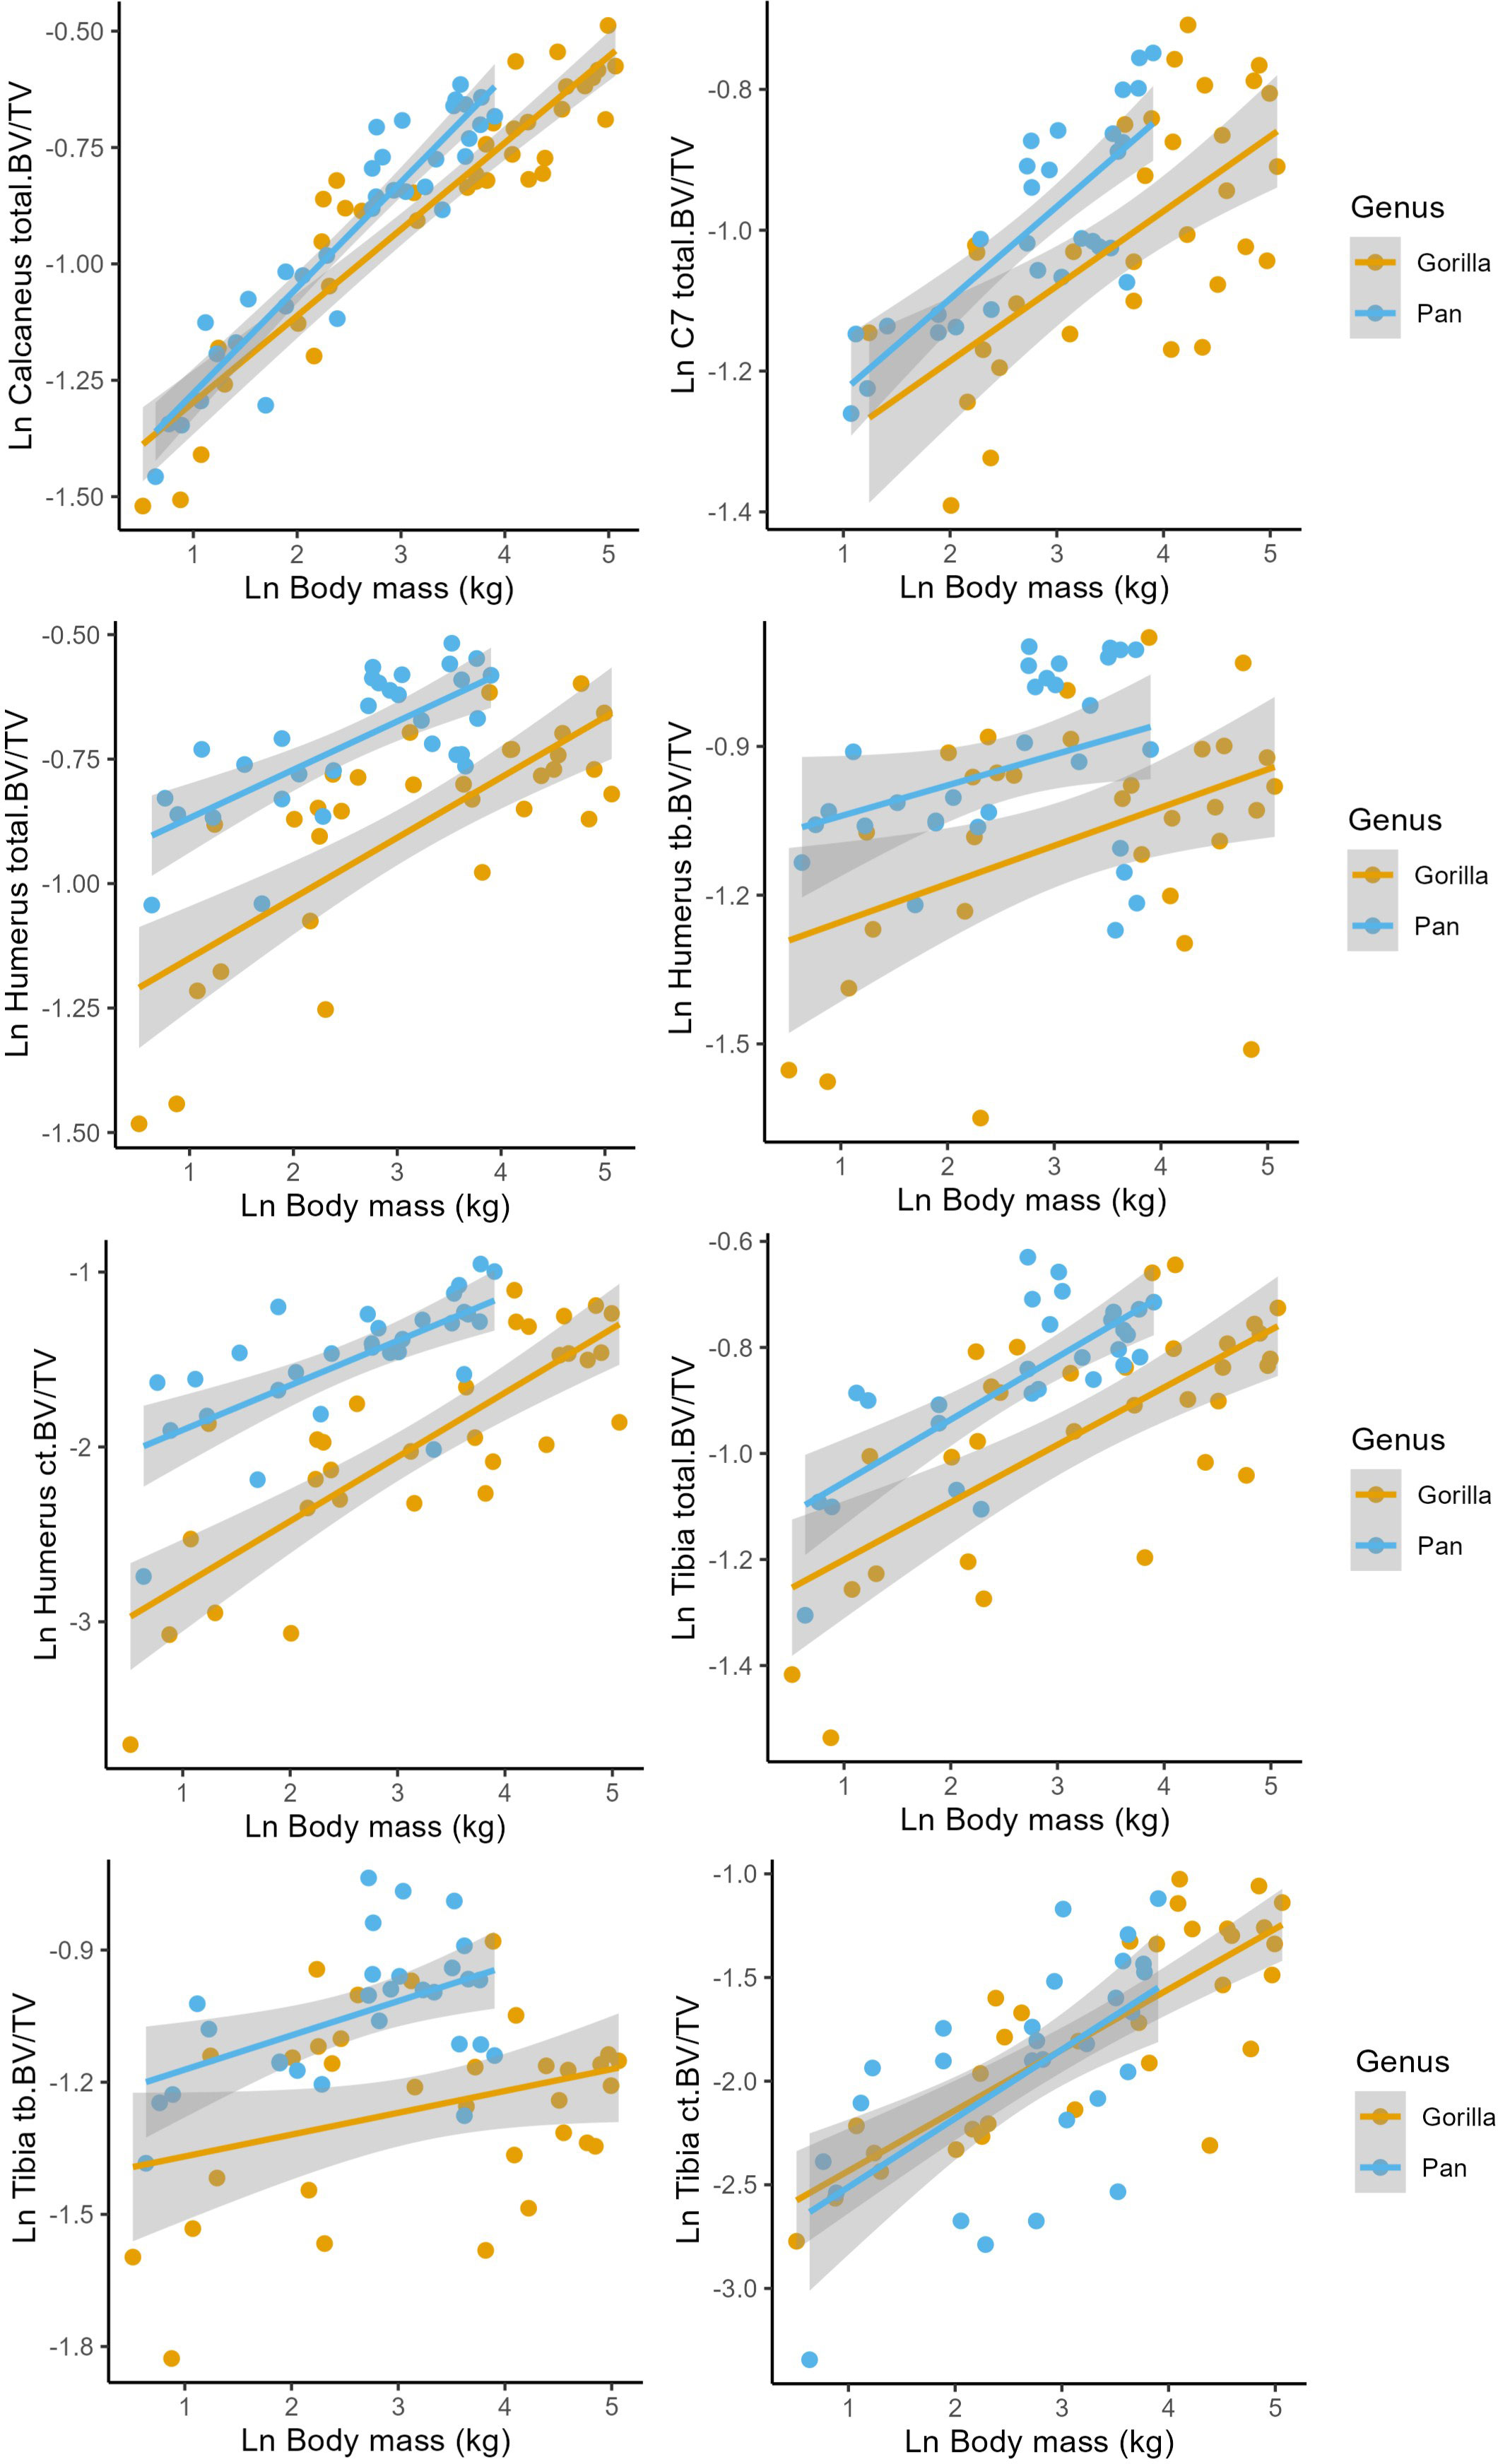
Figure 2 Regressions of Ln estimated body mass (kg) against Ln bone volume fraction (BV/TV) in the humerus, tibia, calcaneus, and C7. Corresponding model parameters are provided in Table 3.
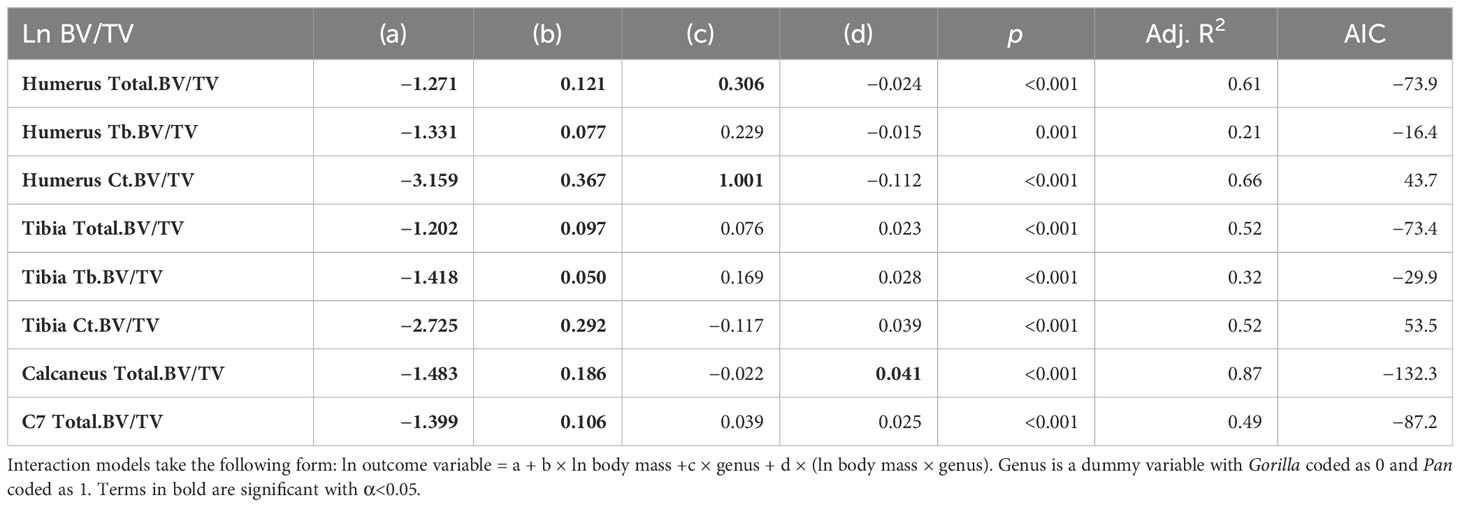
Table 3 Ontogenetic allometry of BV/TV throughout the postcranium of chimpanzees and gorillas.
Total.BV/TV, Ct.BV/TV, and Tb.BV/TV scale with positive allometry in chimpanzees and gorillas (positive b in Table 3). As such, larger bodied individuals have greater BV/TV than smaller bodied individuals. Total.BV/TV and Ct.BV/TV is significantly greater in the chimpanzee humerus compared to gorillas of similar body size (significant positive c in Table 3). In the Calcaneus, chimpanzee Total.BV/TV scales with greater positive allometry than gorillas (significantly positive d in Table 3). R2 values in models of Total.BV/TV and Ct.BV/TV are greater than those of Tb.BV/TV (R2 = 0.49–0.87 versus 0.21–0.32, respectively). This indicates that estimated body mass is a relatively strong predictor of total and cortical BV/TV but not trabecular BV/TV. The latter is likely due to the non-linear relationship of Tb.BV/TV with estimated age (see Section 3.2).
3.2 Does age-related variation in bone structure throughout the postcranium correspond to locomotor maturation?
Bone volume fraction varies with estimated age (age hereafter) across the skeleton of chimpanzees and gorillas (Figure 3). The neuromaturation model proposed by Saers et al. (2022b) predicts that BV/TV increases rapidly with age while the neuromuscular system is developing, and less rapidly after locomotion resembles that of adults (locomotor maturity). In other words, a significant change in slope of BV/TV against age is predicted as locomotion reaches an adult-like state. This prediction is tested using piecewise linear regression. The null hypothesis (H01) that no significant changes in slope occur at the age when adult-like locomotion is achieved is rejected when (1) the piecewise regression model has higher quality (lower AIC, higher R2) than a simple linear regression in all anatomical locations except the C7, and (2) when estimated breakpoint ± a standard deviation overlaps with the age at which locomotion reaches an adult-like state in in gorillas (3–4 years) and chimpanzees (4–6 years). Results of these analyses are plotted in Figure 3 and summarised in Table 4.
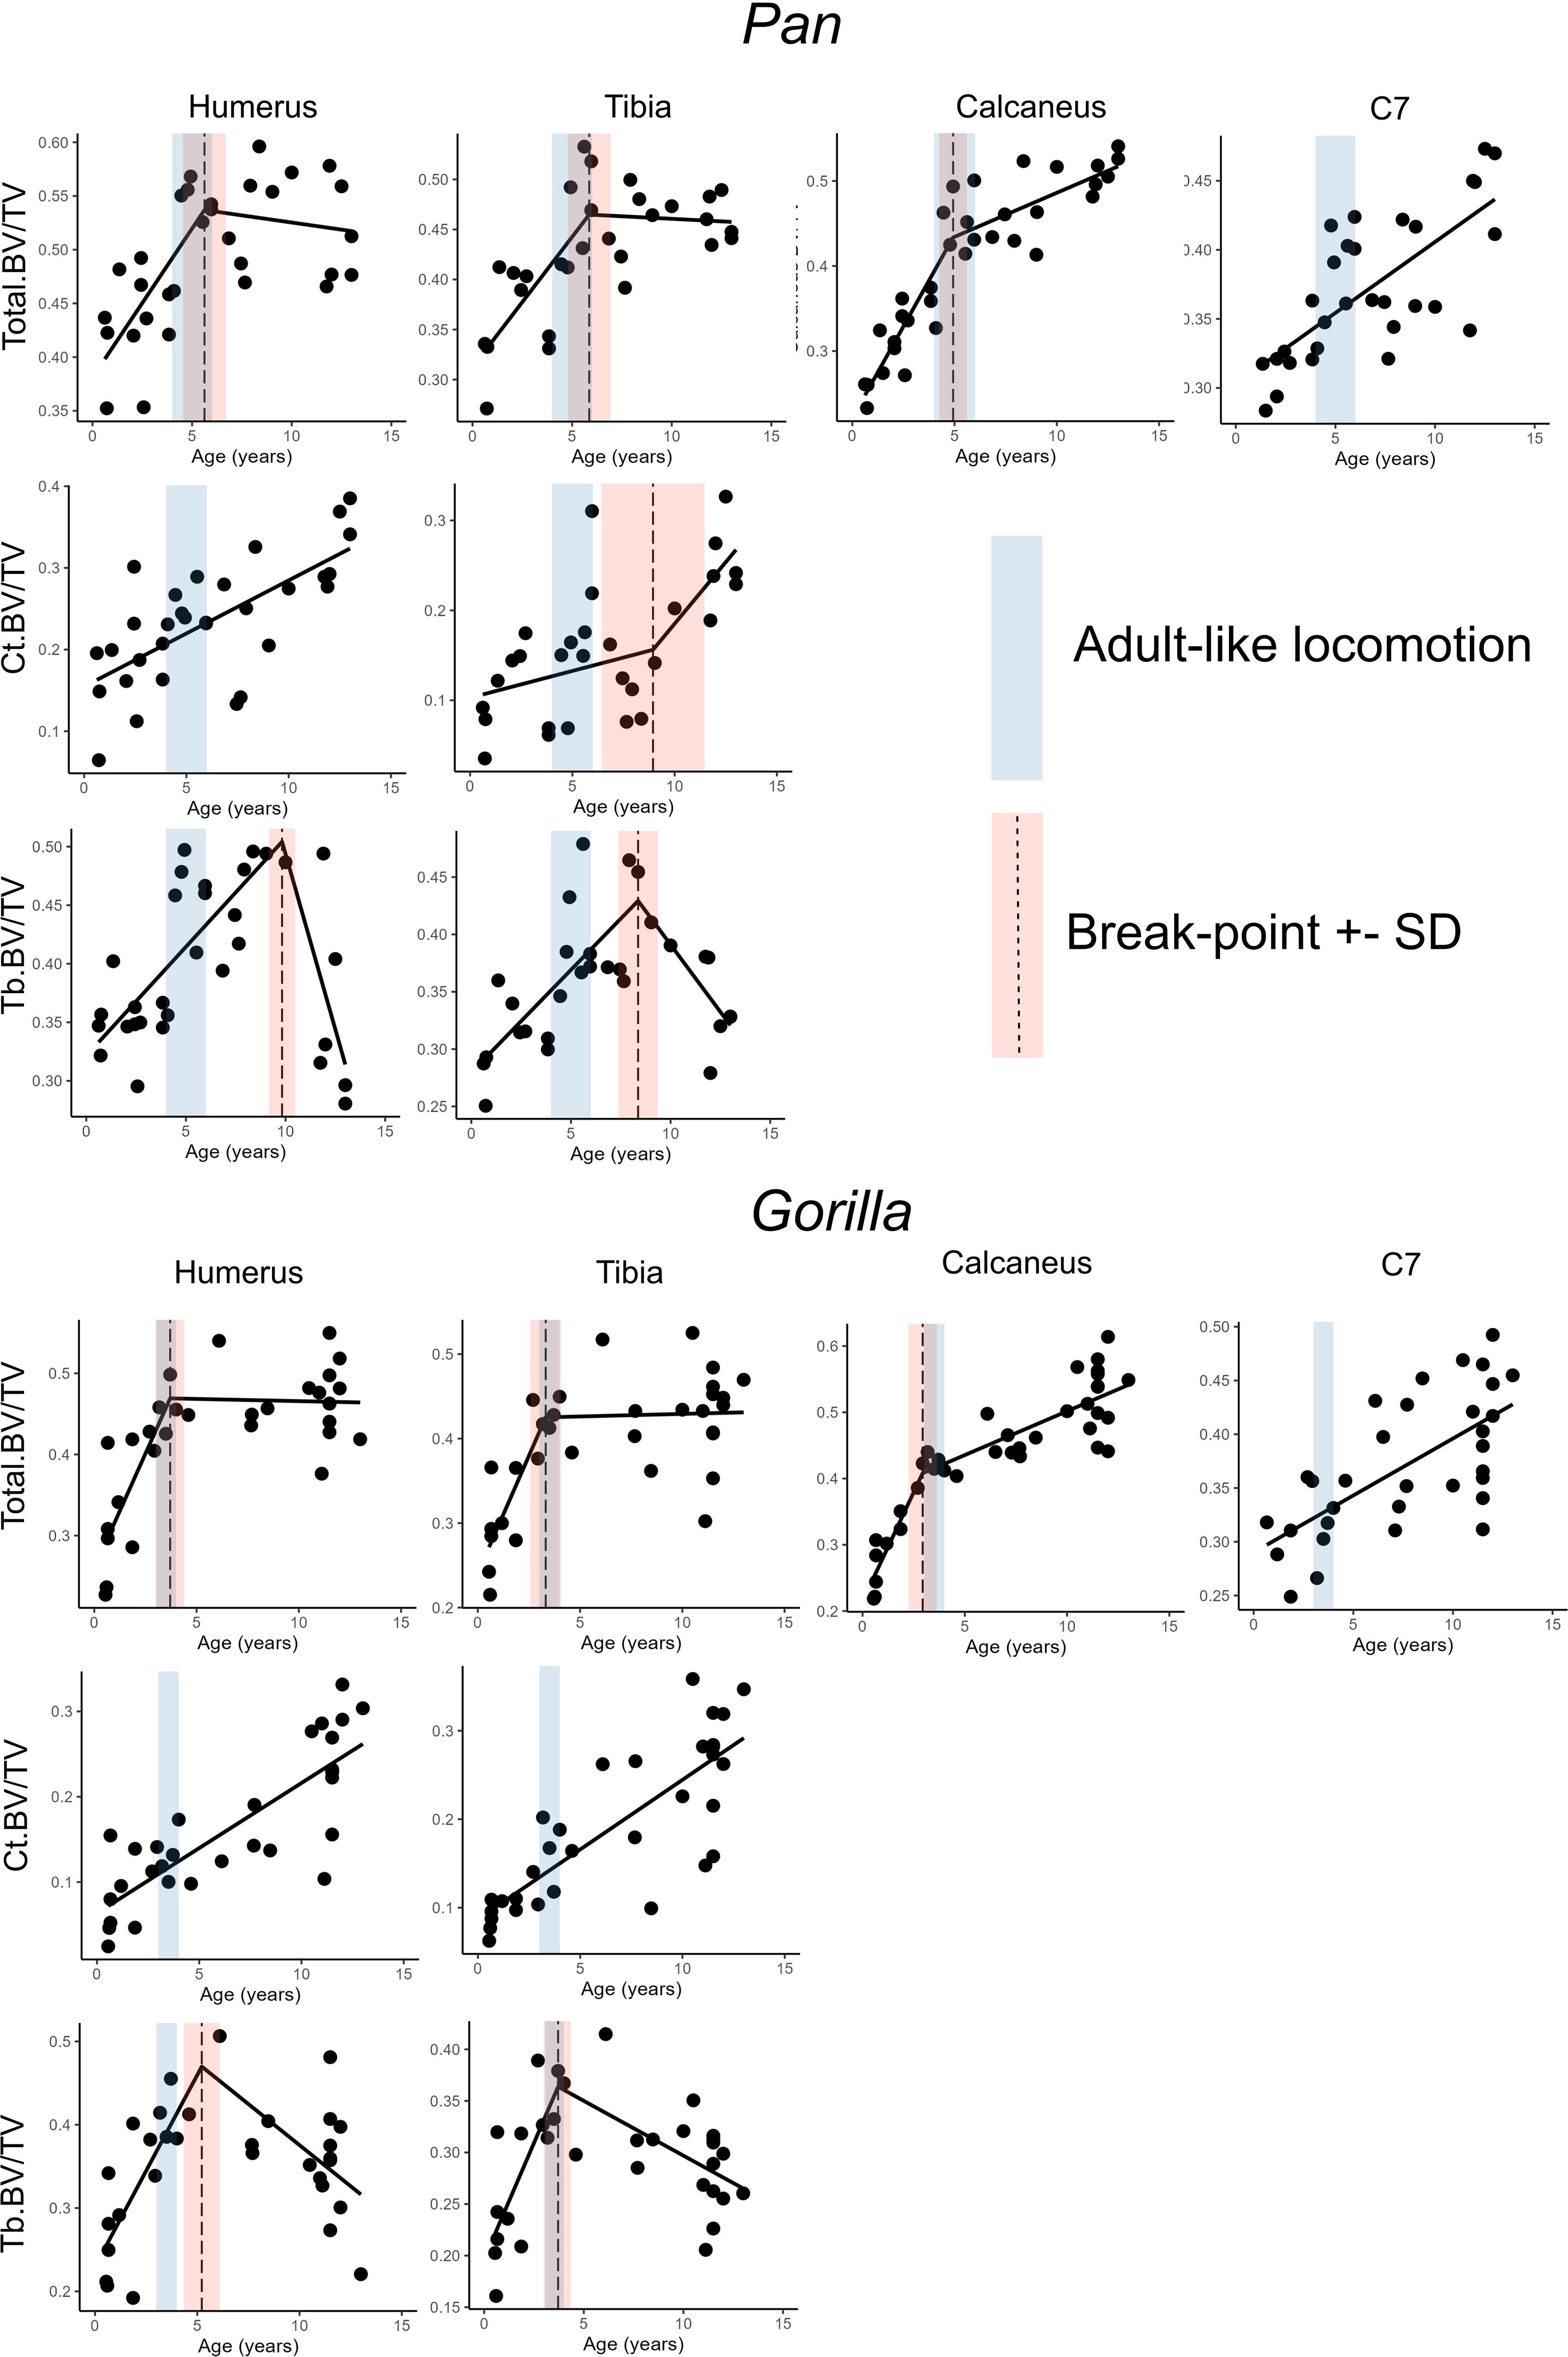
Figure 3 Highest quality regression models (bold in Table 4) with estimated age in years as independent variable and bone volume fraction in several anatomical regions as independent variable. Age-range where locomotor behaviour becomes adult-like is in blue, dashed line represents the break-point estimate and red range represents one standard deviation above and below the break-point estimate.
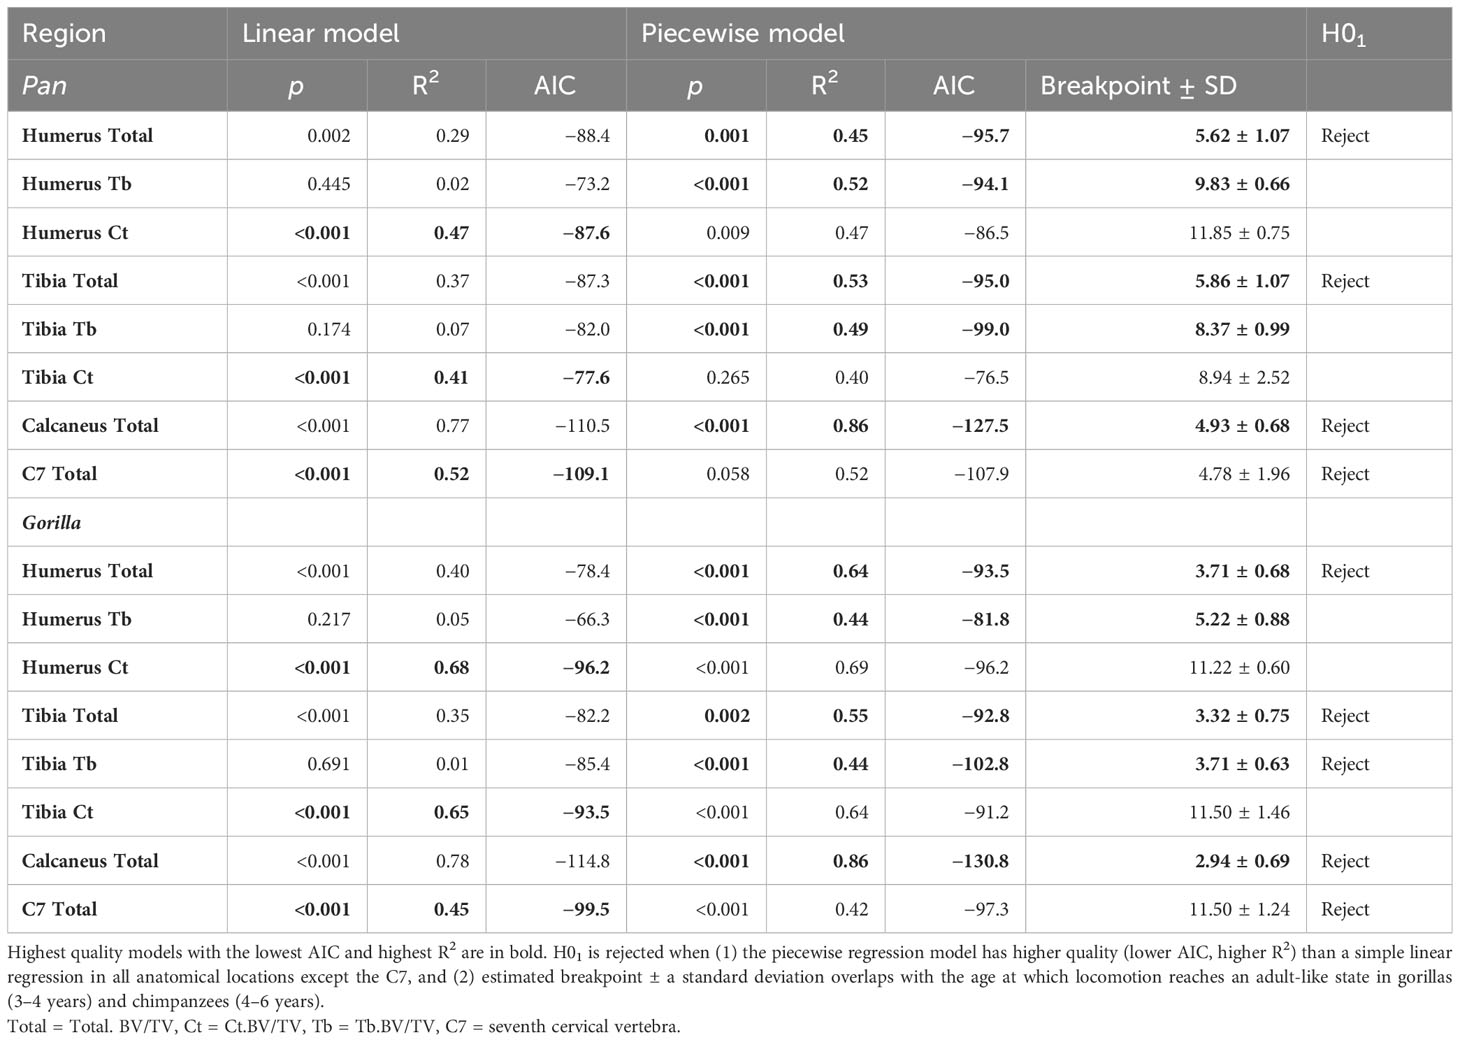
Table 4 Model comparison between linear and piecewise regression models with estimated age in years as independent variable and bone volume fraction as dependent variable.
Simple linear models have the greatest quality in the C7 and Ct.BV/TV in the humerus of chimpanzees, and in Ct.BV/TV of the distal tibia in chimpanzees and gorillas (Table 4). In the other anatomical regions piecewise regressions have greater model quality. Breakpoint estimates overlap with the timing of adult-like locomotion in Total.BV/TV in the calcaneus, humerus, and tibia in both taxa. Additionally, breakpoints overlap with the achievement of adult-like locomotion in Tb.BV/TV in the distal tibia of gorillas. In summary, H01 is rejected for both taxa in the calcaneus, C7, and in the proximal humerus and distal tibia when cortical and trabecular bone volume fraction are combined (Total.BV/TV) but not when trabecular and cortical bone are considered separately.
3.3 Age-related variation in trabecular and cortical bone volume
Cortical bone volume fraction (Ct.BV/TV, cortical bone volume divided by total ROI volume) increases with age in the tibia and humerus of both chimpanzees and gorillas (Figure 3). Trabecular bone volume fraction (Tb.BV/TV, the amount of trabecular bone in the marrow cavity) first increases and then sharply decreases with age in the tibia and humerus of both taxa instead. Cortical and trabecular bone share loads in the proximal and distal metaphyses of long bones (Nawathe et al., 2015). As such, an increase in one type of bone may lead to a decrease in the other. To examine this, ontogenetic variation in the volume of trabecular relative to cortical bone in the long bones is plotted in Figure 4 and interaction regression models are shown in Table 5. There is a significant negative relationship between chronological age and the ratio of trabecular and cortical bone volume. In other words, the proportion of trabecular bone decreases while cortical bone increases. Chimpanzees have significantly lower trabecular/cortical bone in the proximal humerus and significantly greater trabecular/cortical bone in the distal tibia compared to gorillas. There were no significant interactions between chronological age and genus, indicating that regression slopes do not significantly differ between chimpanzees and gorillas. Estimated age is a marginally better predictor of trabecular/cortical bone volume than estimated body mass or femoral head diameter due to its higher R2 (Table 5). It is not possible to disentangle the effects of these variables since age and body mass strongly covary (Age ~ fhd*genus R2 0.91, p<0.001; Age ~ ln body mass * genus R2 = 0.87, p<0.001).
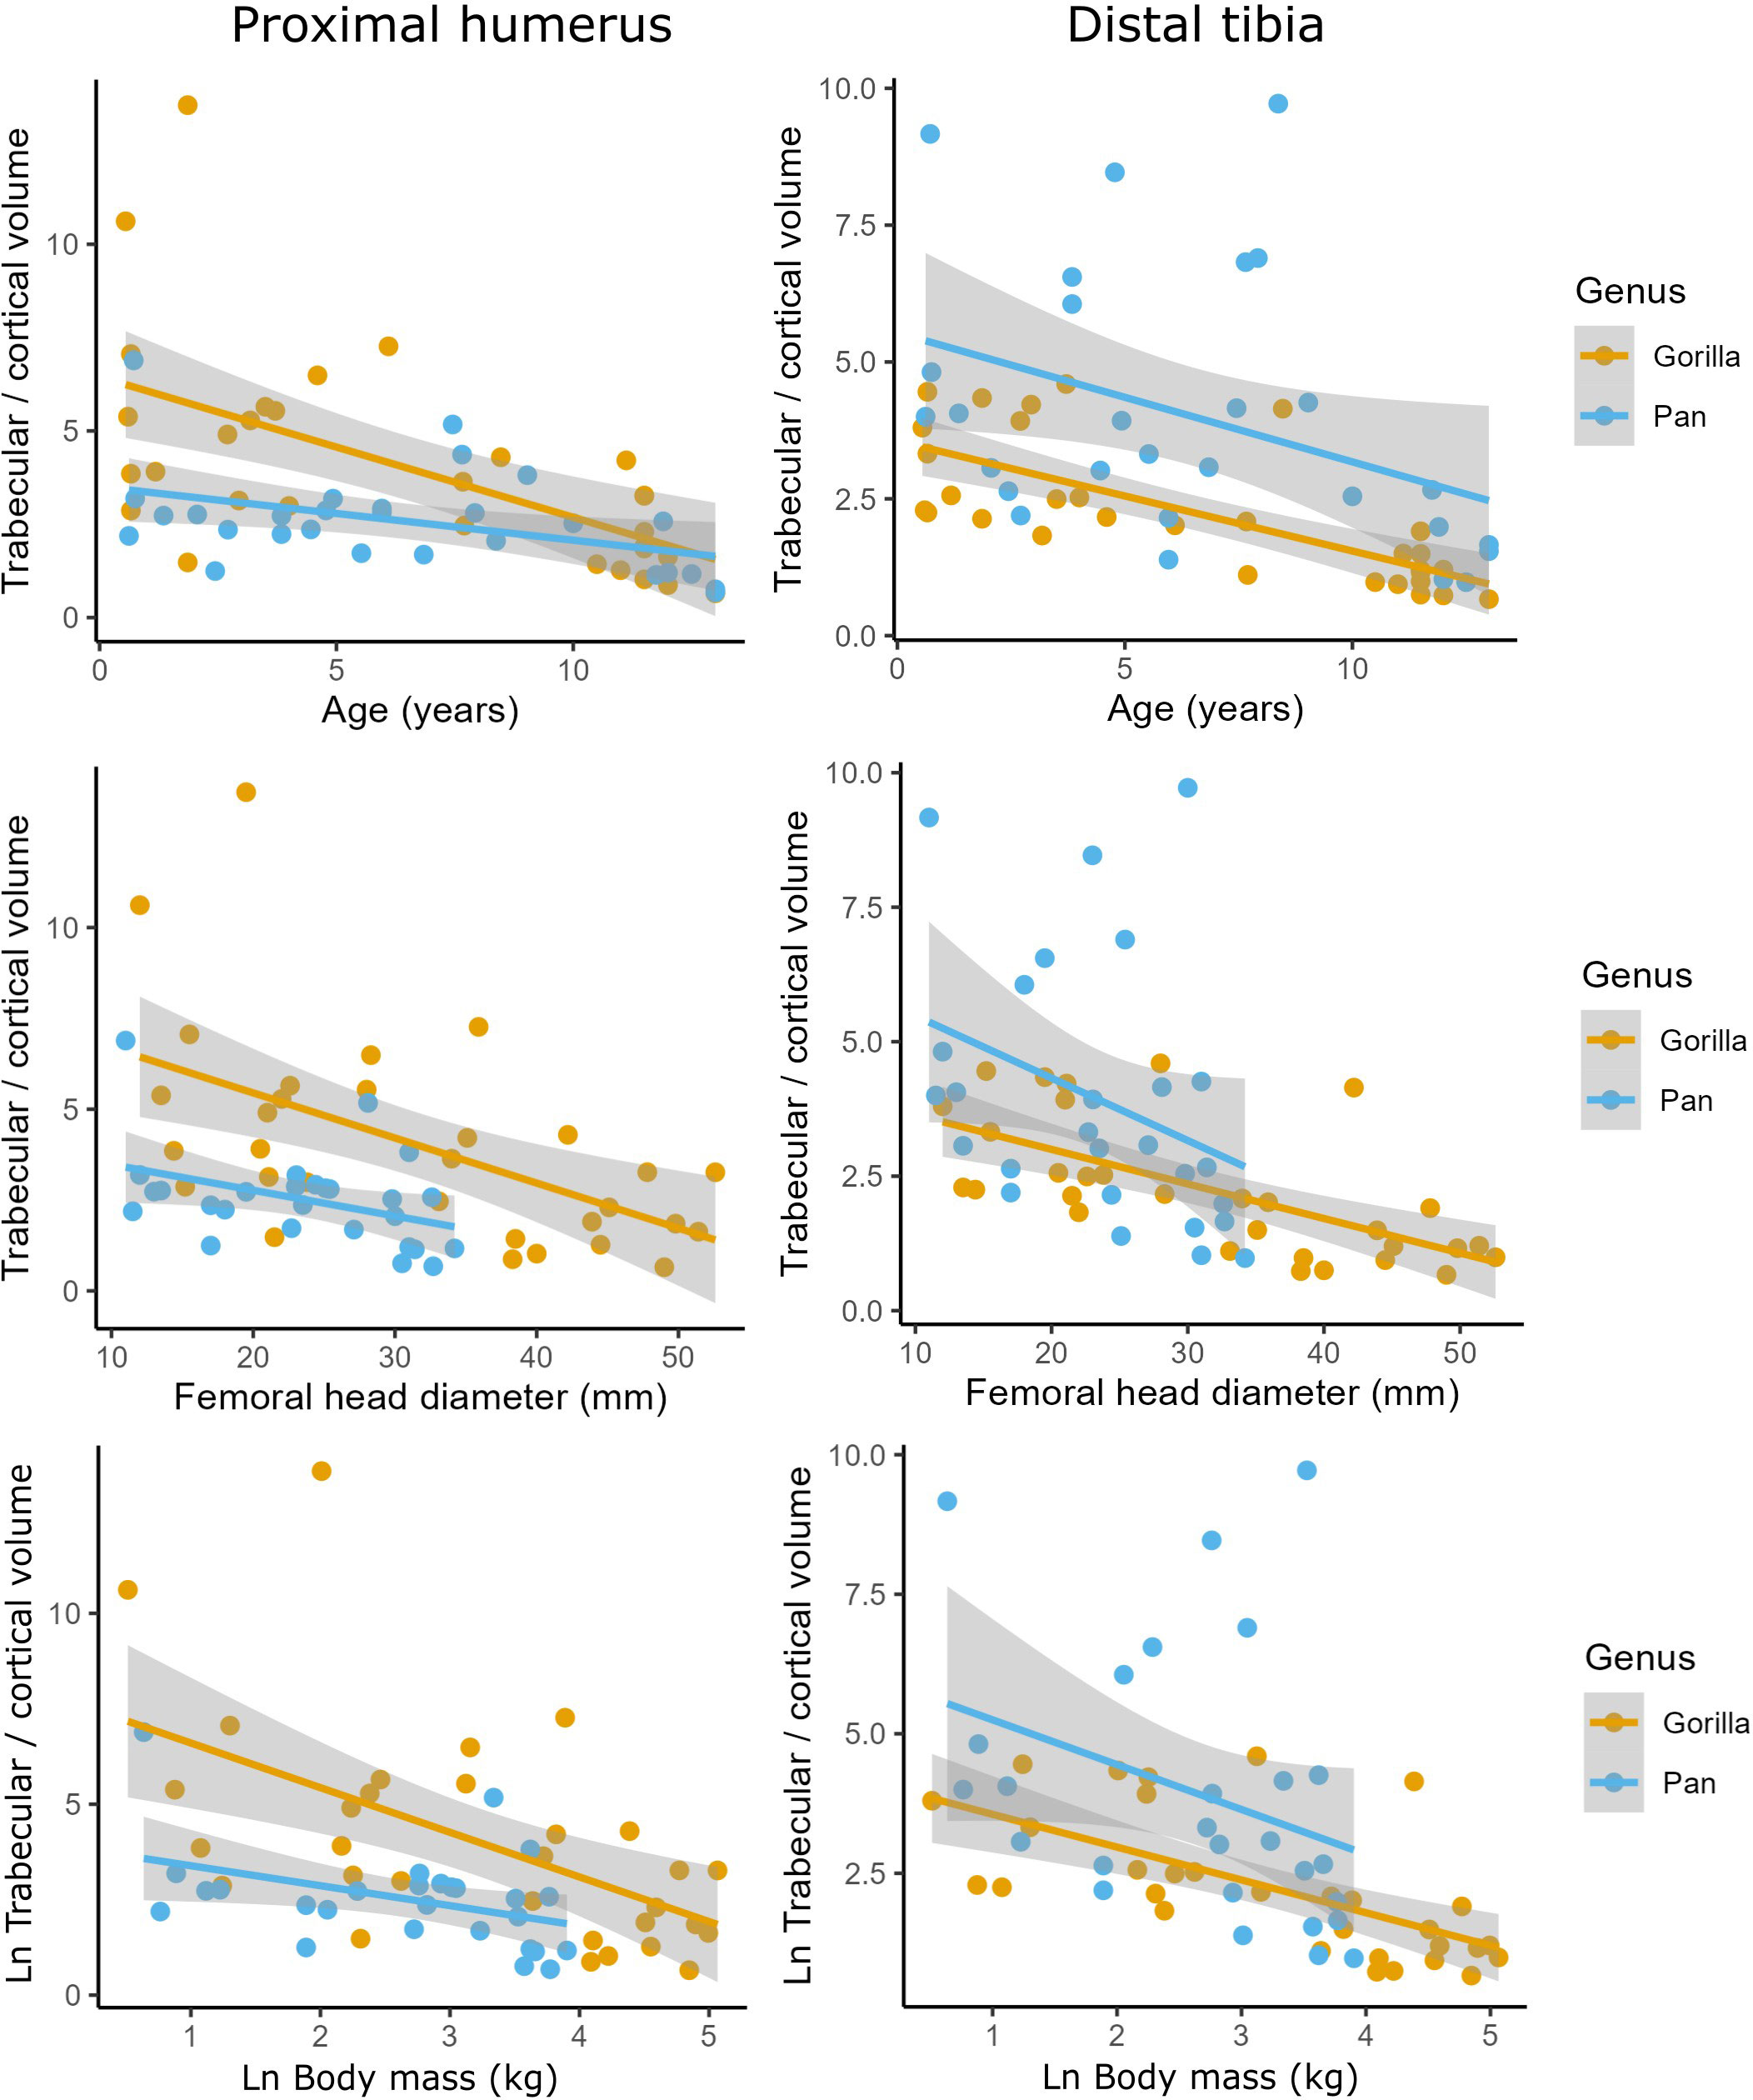
Figure 4 Ratios of trabecular/cortical bone volume against estimated age in years, femoral head diameter (mm), and Ln body mass (kg) in the proximal humerus and distal tibia of Gorilla gorilla and Pan troglodytes.
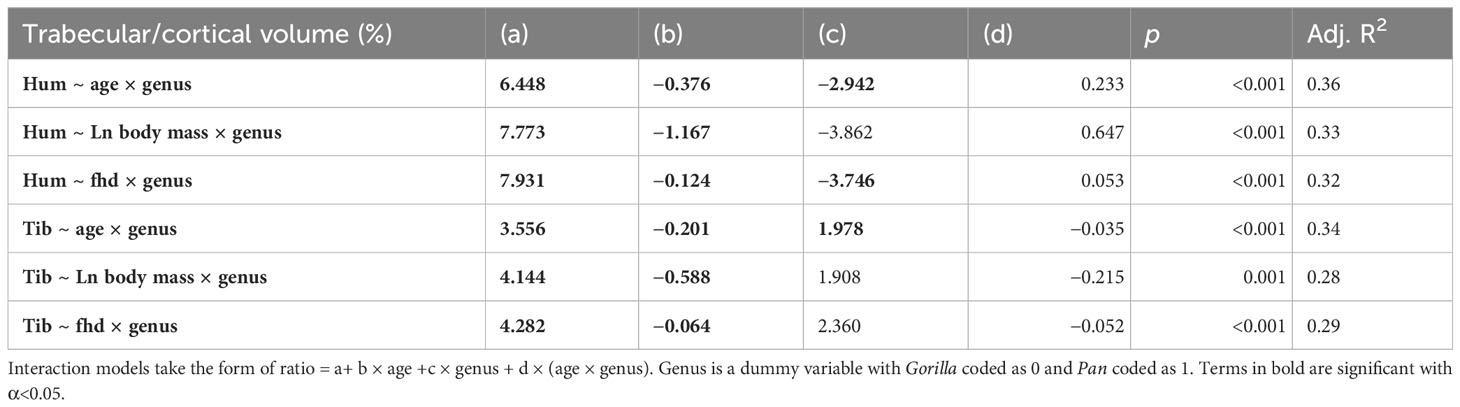
Table 5 Regression output where the ratio of trabecular bone volume (mm3) relative to cortical bone volume (mm3) is predicted by estimated age (years), Ln estimated body mass (kg), and femoral head diameter (mm).
3.4 Are age-related reductions in the frequency of arboreal locomotion reflected in bone structure?
The relationships between age-related variation in the frequency of arboreal and terrestrial locomotion and ratios of total bone volume fraction (Total.BV/TV) in the upper limb, neck, lower limb are shown in Figure 5. Linear regressions are presented in Figure 5 and model outputs for linear regressions and regressions including a genus interaction are provided in Table 6. I have opted to plot terrestriality on the x-axis rather than arboreality since this makes the graphs easier to read. Terrestriality was simply calculated as 1 minus the percentage of arboreal relative to total locomotion.
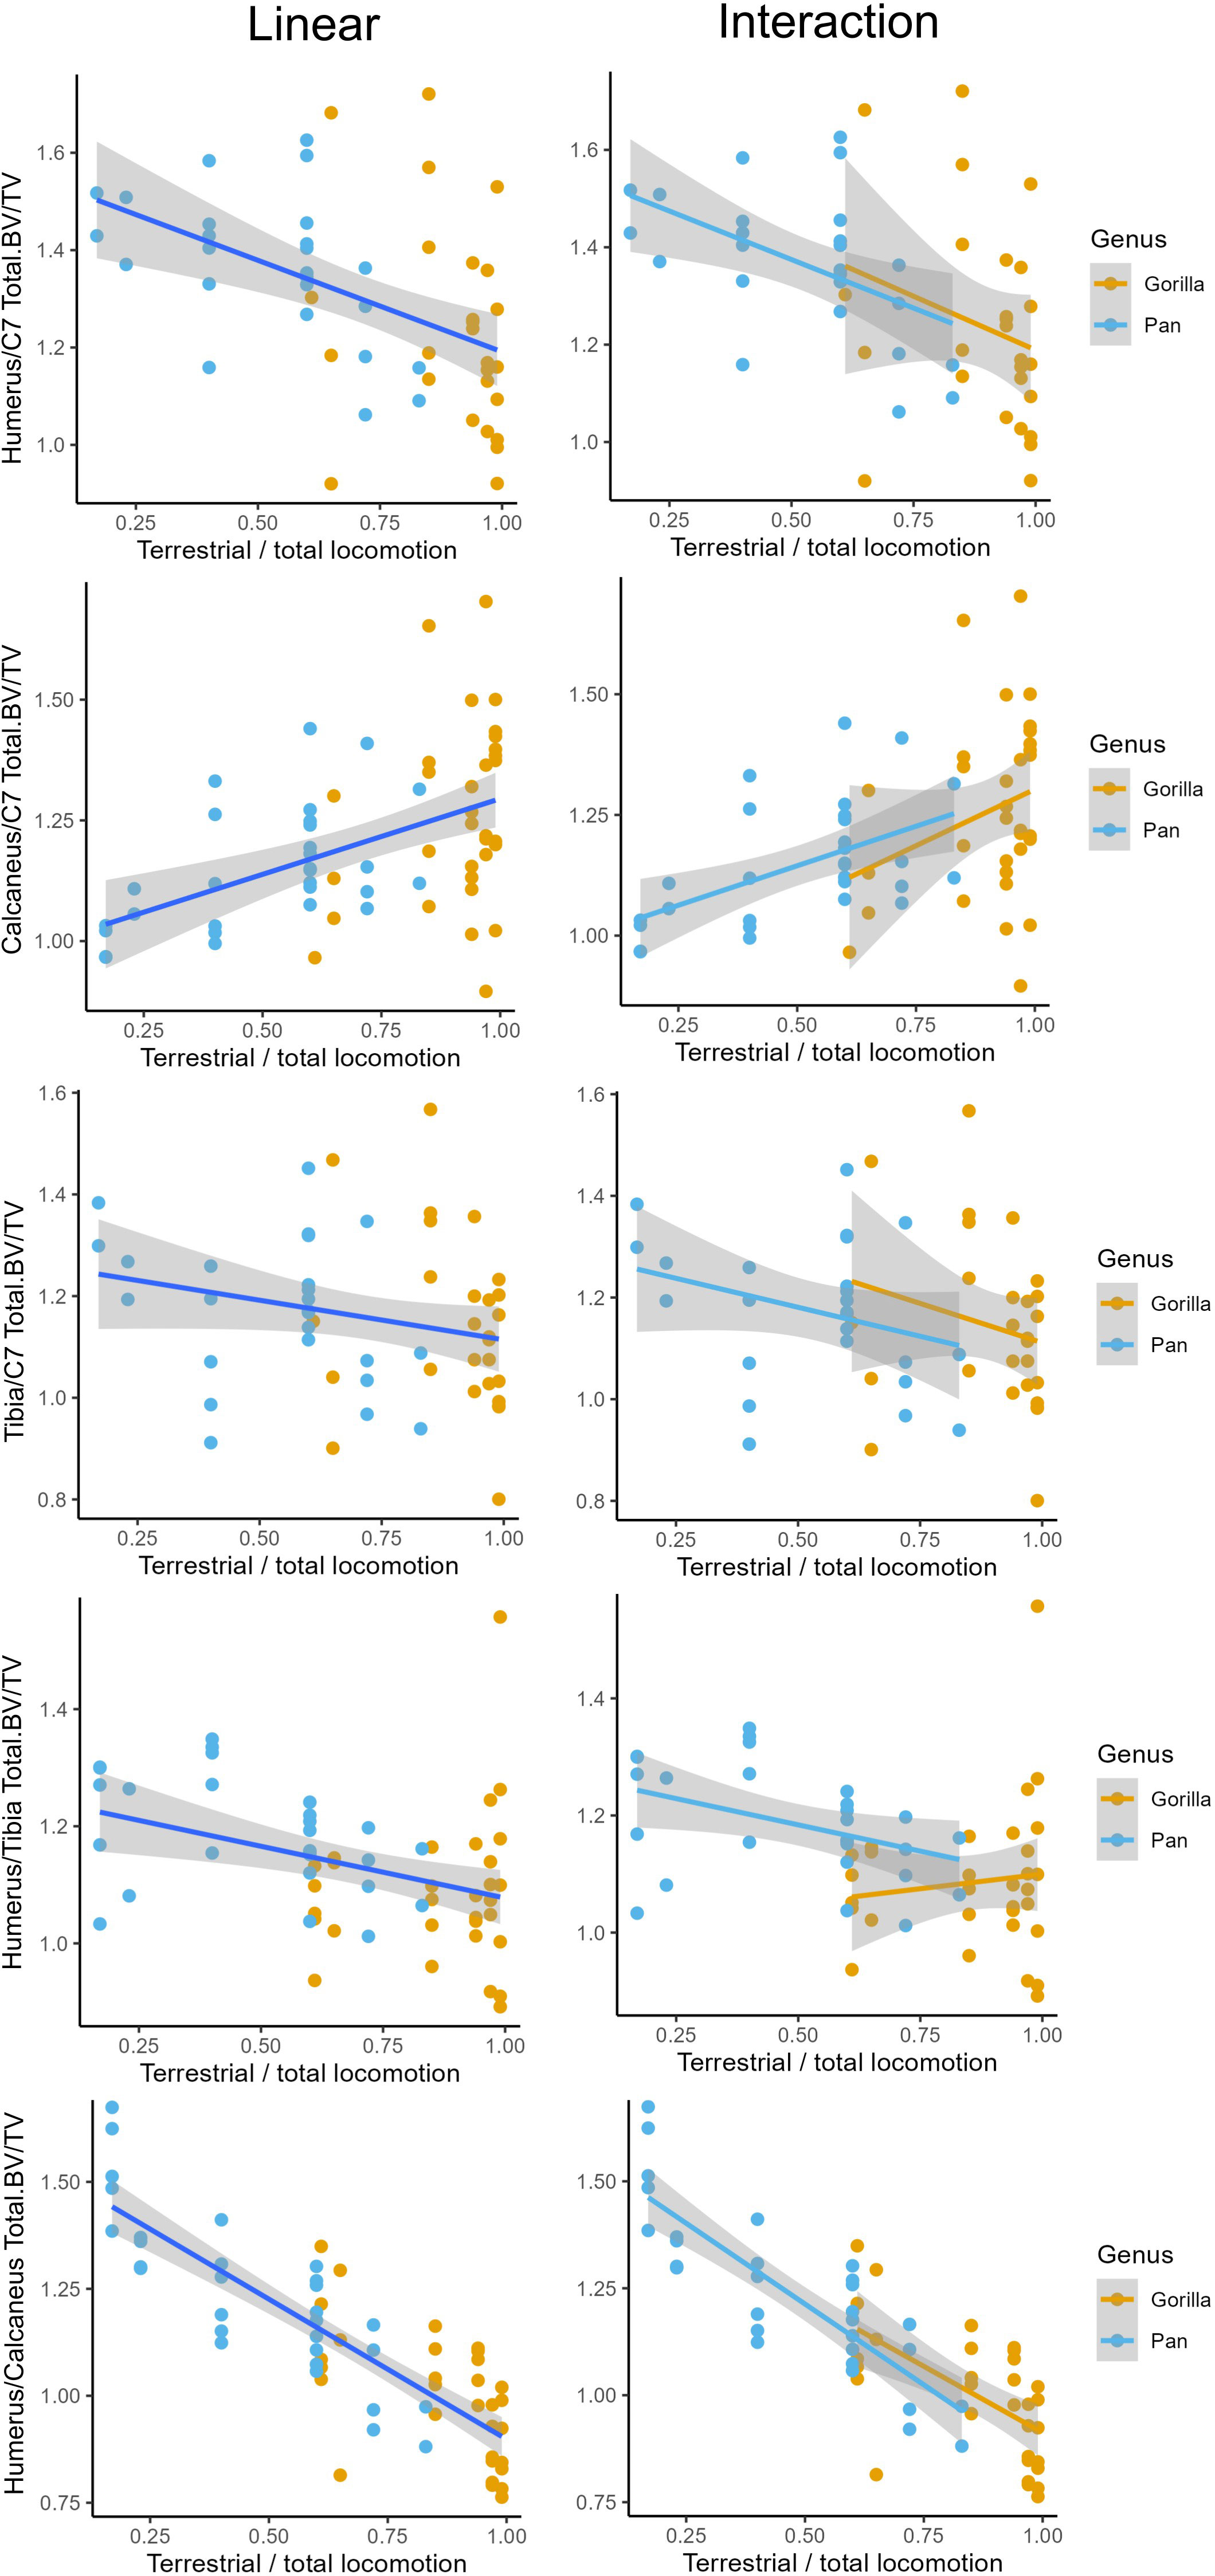
Figure 5 Linear and interaction regressions with terrestriality as independent variable and ratios of total bone volume fraction (Total.BV/TV) between several anatomical regions as dependent variable. Interaction models include an interaction term with genus.
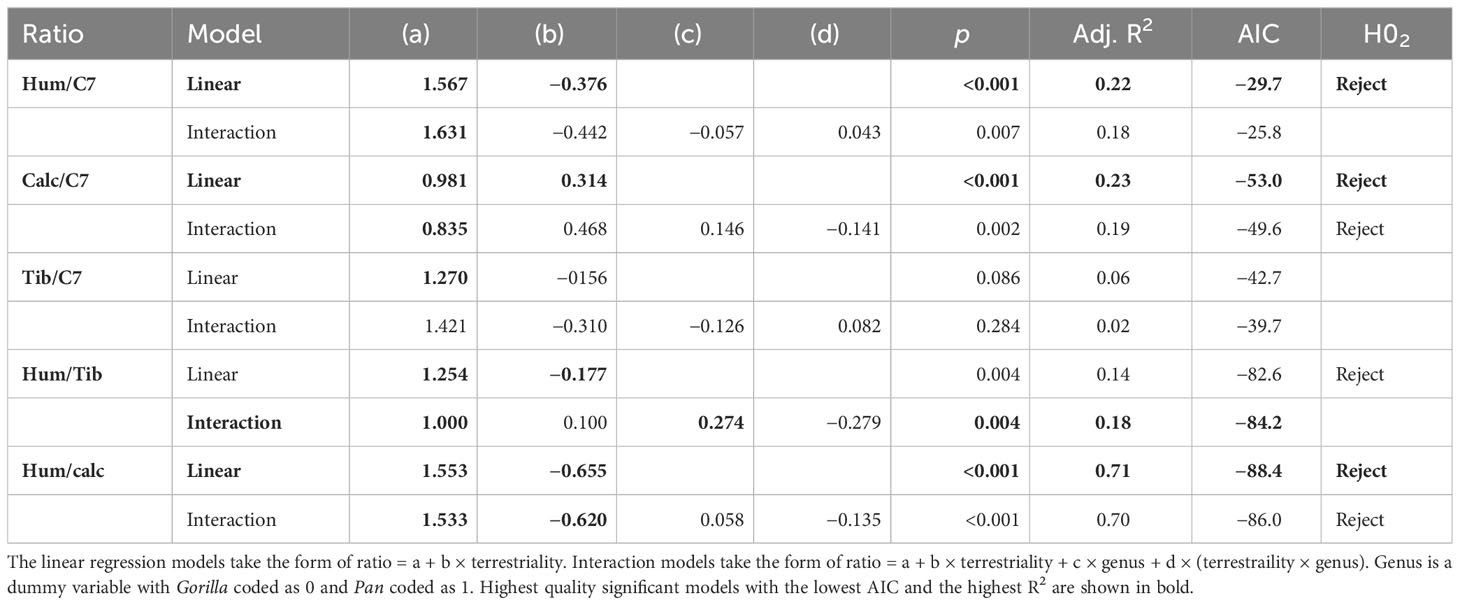
Table 6 Ratios of Total.BV/TV between various anatomical regions.
There is a significant negative relationship between terrestriality and ratios of the upper limb relative to the lower limb and neck. In other words, more arboreal individuals have more robust humeri relative to the neck and relative to the lower limb compared to more terrestrial ones. There is a significant positive relationship between terrestriality and the ratio of bone volume fraction in the calcaneus to neck. This indicates that individuals with a greater degree of terrestrial locomotion have relatively greater Total.BV/TV in the calcaneus compared to the neck. There is no significant relationship between terrestriality and the ratio of tibia to C7.
Simple linear regressions are the highest quality models for explaining the relationship between inter-bone ratios and age-related variation in terrestriality. No significant interaction terms were found between genus and terrestriality in any of the models (d in Table 6). Linear regressions used on single-species datasets showed the same significant trends as the ones reported in Table 6. This indicates that, in general, there are no significant differences in slope or intercept between chimpanzees and gorillas. The one exception is the ratio Total.BV/TV in the humerus and tibia. While the univariate linear model is significant and would reject H02, the interaction model has greater explanatory power (higher R2) and is less overfit (lower AIC). In the interaction model there are no significant differences in slope but chimpanzees have a significantly higher intercept than gorillas (c in Table 6).
The majority of results support rejection of null-hypothesis H02 of no significant relationship between terrestriality and ratios of Total.BV/TV. More arboreal individuals have relatively more bone in the humerus and more terrestrial individuals have relatively more bone in the lower limbs. These significant relationships between terrestriality and ratios of Total.BV/TV are the same in chimpanzees and gorillas. The one exception is the tibia relative to the C7 where there is no significant relationship.
4 Discussion
The overall aim of this paper was to examine if ontogenetic changes in locomotor repertoire in African apes corresponds to age-related variation in bone structure in the lower limb, upper limb, and neck. The first research question is whether species differences in the timing of locomotor maturation are reflected in the ontogenetic trajectories of bone volume fraction, following the neuromaturation model of bone development (Saers et al. (2022b)). A significant change in slope (breakpoint) of bone volume fraction against age was predicted when locomotion reaches an adult-like state in each species. Furthermore, these breakpoints were predicted to occur in anatomical regions that are actively used in locomotion (humerus, tibia, calcaneus) but not in the neck (C7). Breakpoints were predicted at 3–4 years of age in gorillas and 4–6 years of age in chimpanzees based on descriptions of their locomotor development (Doran, 1992; Doran, 1997; Sarringhaus et al., 2014). The results support these predictions in the calcaneus, C7, humerus, and tibia, but in the long bones only if cortical and trabecular bone were considered together. Potential reasons why cortical and trabecular bone should be considered together in ontogenetic analyses will be discussed further below. No breakpoints were found in the C7 of gorillas and chimpanzees. This finding supports that breakpoints in ontogenetic trajectories of bone structure are associated with locomotor development (Saers et al., 2022a; Saers et al., 2022b). While locomotion certainly loads the cervical vertebrae via the neck musculature, research has shown that bending and impact loading have substantially greater effects on bone hypertrophy than muscle loading (Shaw and Stock, 2009; Abe et al., 2018; Saers et al., 2021). Overall, these results indicate that ontogenetic trends in bone volume fraction provide insight into the rate at which locomotion matures in extant apes. These results, combined with others (Raichlen et al., 2015; Saers et al., 2020; Saers et al., 2022a; Saers et al., 2022b) suggest that biomechanical analyses of bone development in fossil hominin subadults can be used to infer the timing of locomotor onset and the achievement of adult-like locomotor repertoires, both of which are major life history events that are strongly associated with brain development (Campos et al., 2000; Garwicz et al., 2009; Anderson et al., 2013; Saers et al., 2022b) and that affect independent foraging efficiency, locomotor costs, and the ability to escape predators (Carrier, 1995).
The second research question was whether age-related changes in the amount of arboreal locomotion relative to total locomotor time were reflected in the skeleton. Results showed that younger, more arboreal individuals have relatively greater humeral bone volume fraction compared to other skeletal regions in both gorillas and chimpanzees. Conversely, older and more terrestrial gorillas and chimpanzees had relatively greater bone volume fraction in the calcaneus compared to other skeletal elements. Interestingly, the results from the tibia did not show the same positive trend with degree of terrestriality as the calcaneus. The reasons why results may differ between the calcaneus and the tibia are discussed below. Overall, chimpanzees showed stronger age-related variation in ratios between anatomical regions than gorillas. This may be because the shift from arboreal to terrestrial dominated locomotion is more gradual in chimpanzees (Doran, 1997). The shift occurs earlier in ontogeny in gorillas. Consequently, there is only a small sample of individuals that covers the age-range where gorillas are most arboreal. The effect is greatest in analyses that include the C7, as the C7 was only recovered for one out of five gorillas that were younger than 1 year old (see Table 1). Overall, these results are consistent with the prediction that ratios of Total.BV/TV between anatomical regions corresponds to age-related variation in locomotor repertoire. These findings support evidence of strong associations between locomotor ontogeny and bone morphology from studies on midshaft diaphyseal cortical bone geometry (Pearson and Lieberman, 2004; Ruff et al., 2018; Nadell et al., 2021; Cosman, 2023). The relationship between trabecular bone ontogeny and age-related variation in locomotion is not as straightforward. This too is consistent with findings of previous studies (Tsegai et al., 2018; Deckers et al., 2022; Cosman, 2023). The potential reasons for this are explored are discussed in the following section.
4.1 Load sharing and age-related trends in trabecular and cortical bone
In apes, the vertebral body of the C7 and the calcaneus largely consist of trabecular bone surrounded by a relatively thin cortex. In contrast, the ratio of cortical to trabecular bone volume varies dramatically throughout ontogeny in the proximal humerus and the distal tibia (Figure 3, 4). The breakpoints that were predicted to occur at the timing of locomotor maturity were only reliably found when cortical and trabecular bone volume fraction were considered together (Total.BV/TV), rather than separately. Cortical and trabecular bone both contribute to the mechanical integrity of the skeleton (Currey, 2002; Nawathe et al., 2015; Skedros et al., 2023). The patterns of load sharing varies regionally within bones. In the human femoral neck trabecular bone carries the majority of load proximally while cortical bone takes over the majority distally (Nawathe et al., 2015). Long bones increase in length and in cross-sectional area during ontogeny. In early ontogeny trabecular bone volume fraction makes up the majority of all bone and presumably carries the majority of loading. The cortex around the distal and proximal metaphysis is a relatively thin shell in early ontogeny and gradually expands relative to the total volume during development (Figure 4). As the dense cortical shell expands during limb development, load sharing presumably shifts from trabecular bone to the cortex. This may explain the eventual shift from an increase in Tb.BV/TV with age to a decrease found in the humerus and tibia (Figure 3). As cortical volume increases, trabecular bone may carry a smaller portion of the load leading to resorption of trabeculae. This interpretation has several important implications for study design and functional interpretations. The first is that measurements of average trabecular bone volume fraction from anatomical regions with significant amounts of cortical bone such as the metaphysis may have limited value in biomechanical analysis and behavioural reconstructions based on bone structure. Instead, cortical bone should also be included in such analyses. Short and irregular bones such as the calcaneus and C7 do not possess a dense, cortical shaft, as such, trabecular portion likely continues to have a greater load-bearing function in such elements throughout life. Trabecular bone shows the strongest functional signals of mechanical loading history near the articulations where reaction forces are applied (DeMars et al., 2021). Further from the joint surface, i.e. in the metaphysis, reaction forces will have already dissipated through the trabecular network. Furthermore, the metaphysis is subjected to additional bending and torsion. Since bending strength is proportional to the radius to the fourth power, the external cortical bone contributes most to the resistance of bending forces. In summary, trabecular bone volume fraction in the metaphysis may not be a good proxy for locomotor loading. However, theoretically more suitable anatomical regions such as the epiphyses of long bones are challenging to study quantitatively due to their incomplete ossification in early ontogeny. These factors are important to consider in the design and interpretation of future studies of bone functional morphology.
4.2 The effects of regions of interest
Residual variation at each age point is lower in the calcaneus compared to the limb bones, shown by lower residual standard error in all models that include the calcaneus. There are several potential factors that may explain this, each of which merits further investigation. One difference between the calcaneus and the other elements is that calcaneus Total.BV/TV was calculated across the whole bone whereas volumes of interest were used to calculate Total.BV/TV in the other elements. The use of ROIs inevitably introduces some additional measurement error in the C7, humerus, and tibia. Another issue is that these ROIs must be scaled with a bone that is changing in size and shape (Lazenby et al., 2011). In this study, ROI height was scaled to 5% of diaphyseal length. Since the locations of superstructures on limb bones scale isometrically with bone length (Stern et al., 2015), this ROI should consistently sample a homologous region of the metaphysis. Another likely reason why data from the calcaneus are less noisy is that the calcaneus has several joints, tendons, and ligaments attached to it that apply constant loading to the calcaneus during locomotion (Giddings et al., 2000). In contrast, the ROIs in the humerus and tibia were placed in the metaphysis, some distance away from the joints where loads are applied. As a result the effects of locomotor loading may be more diffuse in these locations (see Section 4.1). Indeed, in humans, interpopulation variation in BV/TV related to subsistence strategy is strongest near joint surfaces where loads are applied (DeMars et al., 2021). The explanations suggested above can and should be examined further in future studies.
4.3 Ontogeny, allometry, and locomotion
Results presented in Figure 2 and Table 3 showed that Total.BV/TV, Tb.BV/TV, and Ct.BV/TV scale with positive allometry, indicating that larger individuals have greater BV/TV than smaller ones. Body mass is an important confounding variable and is correlated with bone size, joint reaction forces, and brain maturation, and is associated with intraspecific variation in arboreal locomotor behavior across primates (Doran, 1997; Dunbar and Badam, 1998; Chatani, 2003; Doran-Sheehy et al., 2009; Fan et al., 2013). I have investigated the relationship between the ontogeny of bone structure, locomotor kinetics, allometry, and neuromuscular development in previous manuscripts (Saers et al., 2022a; Saers et al., 2022b). Results from these analyses suggest that an interaction between allometry and development of the neuromuscular system underlies age-related variation in loading conditions which, in turn, predict ontogenetic patterns in BV/TV in several primate species. As such, the causal mechanism underlying the age-related variation in Total.BV/TV ratios between the upper and lower limb is most likely age-related variation in locomotor behavior and their associated joint reaction forces, rather than body mass. A good illustration of this is the study by Ruff et al. (2018) comparing ontogeny of upper and lower limb diaphyseal cross-sectional geometry in gorillas. More arboreal Gorilla gorilla obtain relatively stronger upper limbs compared to the lower limb than more terrestrial, but equally sized Gorilla beringei. Separating the effects of body size and locomotion on BV/TV is difficult with the current study design. Least squares regression requires that the predictor variables are independent (McElreath, 2015) but arboreality is strongly correlated with body mass (R2 = 0.94). Another option is to compare model quality between models that use either body mass or degree of arboreality by comparing R2 and AIC. However, this comparison is not fair either due to the way in which these variables were derived. Arboreality data was age-matched from other studies that used age categories rather than absolute chronological age. Percent terrestriality is thus not a true continuous variable in addition to being derived from different populations. Body mass on the other hand is estimated using femoral head diameter from each individual and is a continuous variable. Separating out the effects of body size and locomotor behaviour throughout ontogeny will require experimental data where individual behaviour can be observed and controlled, and body mass of the actors can be measured.
4.4 Implications for reconstructing the evolution and development of hominin locomotion
Hominin evolution is characterised by substantial changes to life history and locomotion. Little is known about how Plio-Pleistocene hominins shifted from the ancestral, ape-like developmental trajectory characterised by faster locomotor development and partially arboreal juveniles to slowly developing and fully terrestrial modern humans. For example, it is unknown if these two aspects evolved as a single package or at various separate stages. This poor understanding derives from a dearth of fossil hominin juveniles and limited tools for reconstructing locomotor development. The work presented here is part of an ongoing project that seeks to develop new methodologies to reconstruct locomotor behaviour from limited fossil data. The results point to promising links between age-related variation in locomotor repertoire and bone volume fraction throughout the skeleton of non-human African apes. Breakpoints in the developmental trajectories of bone volume fraction in the appendicular skeleton coincide with the achievement of adult-like locomotor repertoires in chimpanzees and gorillas. Additionally, age-related variation in ratios of upper limb, lower limb, and neck region overall appear to correspond to degree of arboreal and terrestrial locomotion in both species. These results suggest that ontogenetic differences in the rate of locomotor development as well as the degree of arboreal locomotion can be identified from skeletal remains. In other words, ontogenetic trajectories of bone volume fraction can provide new insights into the evolution of hominin life history (i.e. how quickly does locomotion develop) and variation in the frequency of arboreal versus terrestrial locomotion throughout the life course.
Establishing ontogenetic trajectories requires sample sizes that are rarely available in the hominin fossil record. Analysis of the three-dimensional distribution of bone tissue throughout a bone provides more information about the loading environment of a bone than simple mean bone volume fraction used in this study. A limitation of such an approach is that it is challenging to statistically compare the distribution of bone throughout the joints of animals with different sizes and shapes. While statistical approaches have recently been developed (DeMars et al., 2021; Bachmann et al., 2022), their application to ontogenetic data is complex due to developmental changes in external bone morphology (Figus et al., 2023). Given the low sample sizes inherent in studies of the hominin fossil record however, a whole bone approach may be favourable. Most analyses of bone functional adaptation focus on trabecular and cortical bone separately. Results show that proportions of both types of bone tissue vary during ontogeny and should be considered together due to load sharing.
4.5 Limitations
Ontogenetic studies should ideally rely on longitudinal approaches where the same individuals are measured throughout development (German and Stewart, 2002). Instead, the cross-sectional approach used here relied on age-matching specimens from a skeletal collection, for which age was estimated based on dental development, to behavioural data reported on different populations, and different species in the case of gorillas. All of these factors contribute some degree of uncertainty to the data. Most of this uncertainty will not be biased in a particular direction and should thus average out with sufficient sample size. One factor that is likely directionally biased is the estimated arboreality/terrestriality of Gorilla gorilla. Locomotor ontogeny data from more terrestrial G. beringei is used to interpret morphological variation in more arboreal G. gorilla, which likely led to an underestimation of the degree of arboreality in the gorilla sample. Data on locomotor development in wild populations is scarce and future research would greatly benefit from detailed longitudinal studies of locomotor development. Analyses presented above rely on the assumption that arboreal locomotion entails greater forelimb loading than terrestrial locomotion. However, the degree to which the loading environments differ between these types of locomotion, and how these vary throughout ontogeny have not been measured. Future work would be strengthened by detailed kinetic and kinematic data on arboreal locomotion in great apes, as well as finite element analyses using such data to estimate the loading environment throughout the postcranium during terrestrial and arboreal locomotion.
5 Conclusions
Age-related variation in bone volume fraction across the postcranium corresponds to relatively subtle differences in locomotor ontogeny between gorillas and chimpanzees. Significant changes in slope of total bone volume fraction when plotted against age correspond to the timing of locomotor maturation in the appendicular skeleton of both species. The seventh cervical vertebra (C7) does not show the age-related changes in slope that characterise bone structure throughout the appendicular skeleton. This supports the idea that ontogenetic changes in limb bone volume fraction are driven by age-related changes in locomotor loading. Ratios of bone volume fraction between the proximal humerus, calcaneus, and C7, correspond to degree of arboreality in both species. Finally, results show that the fraction of trabecular and cortical bone in the metaphysis changes throughout ontogeny. Due to load sharing between cortical and trabecular bone both types of bone should therefore be taken into account in functional interpretations of morphology. These findings imply that analyses of developmental trajectories of bones throughout the postcranium can be used to reconstruct the rate of locomotor development, an important life history characteristic, as well as ontogenetic variation in arboreality. Analyses of hominin skeletal ontogeny therefore provide new ways of investigating the evolution of two characteristic human traits: our slow rate of maturation and the evolution of fully terrestrial bipedalism.
Data availability statement
The raw data supporting the conclusions of this article will be made available by the authors, without undue reservation.
Ethics statement
Ethical approval was not required for the study involving animals in accordance with the local legislation and institutional requirements because Research on historical museum collections does not require ethical approval.
Author contributions
JS: Conceptualization, Data curation, Formal analysis, Funding acquisition, Investigation, Methodology, Project administration, Resources, Software, Supervision, Validation, Visualization, Writing – original draft, Writing – review & editing.
Funding
The author(s) declare financial support was received for the research, authorship, and/or publication of this article. This work has received funding from RCUK/BBSRC grant number BB/R01292X/1, the European Union’s Horizon 2021 research and innovation programme under the Marie Skłodowska Curie grant agreement number 101066276, and Dutch national e-infrastructure with the support of the SURF Cooperative using grant no. EINF-5670.
Acknowledgments
I am grateful to Dr. Rachel Jennings of the Powell Cotton Museum for facilitating access and loans of the skeletal sample. I am also grateful to Prof. Jay Stock of Western University, CA, whose RCUK/BBSRC grant number BB/R01292X/1 funded the CT scanning of the skeletal sample. This project has received funding from the European Union’s Horizon 2021 research and innovation programme under the Marie Skłodowska Curie grant agreement number 101066276. This work used the Dutch national e-infrastructure with the support of the SURF Cooperative using grant no. EINF-5670.
Conflict of interest
The author declares that the research was conducted in the absence of any commercial or financial relationships that could be construed as a potential conflict of interest.
Publisher’s note
All claims expressed in this article are solely those of the authors and do not necessarily represent those of their affiliated organizations, or those of the publisher, the editors and the reviewers. Any product that may be evaluated in this article, or claim that may be made by its manufacturer, is not guaranteed or endorsed by the publisher.
References
Abe S., Narra N., Nikander R., Hyttinen J., Kouhia R., Sievänen H. (2018). Impact loading history modulates hip fracture load and location: A finite element simulation study of the proximal femur in female athletes. J. Biomechanics 76, 136–143. doi: 10.1016/j.jbiomech.2018.05.037
Akaike H. (1974). A new look at the statistical model identification. IEEE Trans. Automatic Control 19 (6), 716–723. doi: 10.1109/TAC.1974.1100705
Alemseged Z. (2023). Reappraising the palaeobiology of australopithecus. Nature 617 (7959), 45–54. doi: 10.1038/s41586-023-05957-1
Alemseged Z., Spoor F., Kimbel W. H., Bobe R., Geraads D., Reed D., et al. (2006). A juvenile early hominin skeleton from dikika, Ethiopia. Nature 443 (7109), 296–301. doi: 10.1038/nature05047
Altmann J., Samuels A. (1992). Behavioral ecology and sociobiology costs of maternal care: infant-carrying in baboons. Behav. Ecol. Sociobiol. 29, 391–398. doi: 10.1007/BF00170168
Anderson D. I., Campos J. J., Witherington D. C., Dahl A., Rivera M., He M., et al. (2013). The role of locomotion in psychological development. Front. Psychol. 4. doi: 10.3389/fpsyg.2013.00440
Bachmann S., Dunmore C. J., Skinner M. M., Pahr D. H., Synek A. (2022). A computational framework for canonical holistic morphometric analysis of trabecular bone. Sci. Rep. 12 (1), 1–135. doi: 10.1038/s41598-022-09063-6
Bailey K. E., Winking J. W., Carlson D. L., Bang T. V., Long H. T. (2020). Arm-swinging in the red-shanked douc (Pygathrix nemaeus): implications of body mass. Int. J. Primatol. 41 (4), 583–955. doi: 10.1007/s10764-020-00163-6
Bolter D. R., Elliott M. C., Hawks J., Berger L. R. (2020). Immature remains and the first partial skeleton of a juvenile homo naledi, a late middle pleistocene hominin from South Africa. PloS One 15 (4), e02304405. doi: 10.1371/journal.pone.0230440
Braga J., Wood B. A., Zimmer V. A., Moreno B., Miller C., Thackeray J. F., et al. (2023). Hominin fossils from kromdraai and drimolen inform paranthropus robustus craniofacial ontogeny. Sci. Adv. 9 (18), eade7165. doi: 10.1126/sciadv.ade7165
Burgess M. L., McFarlin S. C., Mudakikwa A., Cranfield M. R., Ruff C. B. (2018). Body mass estimation in hominoids: age and locomotor effects. J. Hum. Evol. 115, 36–46. doi: 10.1016/j.jhevol.2017.07.004
Campos J. J., Anderson D. I., Barbu-Roth M. A., Hubbard E. M., Hertenstein M. J., Witherington D. (2000). Travel broadens the mind. Infancy 1 (2), 149–2195. doi: 10.1207/S15327078IN0102_1
Carrier D. (1983). Postnatal ontogeny of the musculo-skeletal system in the black-tailed jack rabbit (Lepus californicus). J. Zool. 201, 27–55. doi: 10.1111/j.1469-7998.1983.tb04259.x
Carrier D. R. (1995). Ontogenetic limits on locomotor performance. Physiol. Zool. 69 (3), 467–488. doi: 10.2307/30164211
Carter D. R., Beaupré G. S. (2001). Skeletal Function and Form: Mechanobiology of Skeletal Development, Aging and Regeneration (New York: Cambridge University Press).
Chatani K. (2003). Positional behavior of free-ranging Japanese macaques (Macaca fuscata). Primates 44 (1), 13–24. doi: 10.1007/s10329-002-0002-z
Chevalier T., Colard T., Colombo A., Golovanova L., Doronichev V., Hublin J. J. (2021). Early ontogeny of humeral trabecular bone in neandertals and recent modern humans. J. Hum. Evol. 154, 102968. doi: 10.1016/j.jhevol.2021.102968
Cofran Z., Desilva J. M. (2015). A neonatal perspective on homo erectus brain growth. J. Hum. Evol. 81, 41–47. doi: 10.1016/j.jhevol.2015.02.011
Cofran Z., VanSickle C., Valenzuela R., García-Martínez D., Walker C. S., Hawks J. (2022). The immature homo naledi ilium from the lesedi chamber, rising star cave, South Africa. Am. J. Biol. Anthropol. 179, 3–17. doi: 10.1002/ajpa.24522
Colombo A., Stephens N. B., Tsegai Z. J., Bettuzzi M., Morigi M. P., Belcastro M. G., et al. (2019). Trabecular analysis of the distal radial metaphysis during the acquisition of crawling and bipedal walking in childhood: A preliminary study. Bull. Mémoires La Société D’Anthropol. Paris 31 (1–2), 43–51. doi: 10.3166/bmsap-2018-0041
Cosman M. N. (2023). Trabecular and Cortical Skeletal Correlates of Locomotor Ontogeny in Pan with Comparisons to Skeletal Variation and Adaptation in Gorilla and Pongo (University of Michigan).
Cowgill L. W. (2010). The ontogeny of holocene and late pleistocene human postcranial strength. Am. J. Phys. Anthropol. 141 (1), 16–37. doi: 10.1002/ajpa.21107
Cowgill L. W., Robyn A. J. (2018). Biomechanical implications of the onset of walking. J. Hum. Evol. 122, 133–145. doi: 10.1016/j.jhevol.2018.06.003
Cowgill L. W., Warrener A., Pontzer H., Ocobock C. (2010). Waddling and toddling: the biomechanical effects of an immature gait. Am. J. Phys. Anthropol. 143, 52–61. doi: 10.1002/ajpa.21289
Dean M. C., Wood B. A. (1981). Developing pongid dentition and it’s use for ageing individual crania in comparative cross-sectional growth studies. Folia Primatol. 36, 111–127. doi: 10.1159/000156011
Deckers K., Tsegai Z. J., Skinner M. M., Zeininger A., Kivell T. L. (2022). Ontogenetic changes to metacarpal trabecular bone structure in mountain and western lowland gorillas. J. Anat 241 (1), 82–100. doi: 10.1111/joa.13630
DeMars L. J. D., Stephens N. B., Saers J. P. P., Gordon A., Stock J. T., Ryan T. M. (2021). Using point clouds to investigate the relationship between trabecular bone phenotype and behavior: an example utilizing the human calcaneus. Am. J. Hum. Biol. 33 (2), 1–16. doi: 10.1002/ajhb.23468
Demes B., Larson S. G., Stern J. T., Jungers W. L., Biknevicius A. R., Schmitt. D. (1994). The kinetics of primate quadrupedalism: ‘Hindlimb drive’ Reconsidered. J. Hum. Evol. 26 (5–6), 353–374. doi: 10.1006/jhev.1994.1023
Doran D. M. (1992). The ontogeny of chimpanzee and pygmy chimpanzee locomotor behavior: A case study of paedomorphism and its behavioral correlates. J. Hum. Evol. 23 (2), 139–157. doi: 10.1016/0047-2484(92)90104-H
Doran D. M. (1997). Ontogeny of locomotion in mountain gorillas and chimpanzees. J. Hum. Evol. 32, 323–344. doi: 10.1006/jhev.1996.0095
Doran D. M. (2010). “Comparative positional behavior of the African apes” in Great ape societies. Eds. McGrew W. C., Marchant L. F., Nishidapage T. (Cambridge University Press). Chapter 16, p 213–224.
Doran-Sheehy D., Andrianady M., Lodwick J. (2009). Sex differences in western gorilla arboreality. Am. J. Phys. Anthropol. Supplement 48, 120.
Dunbar D. C., Badam G. L. (1998). Development of posture and locomotion in free-ranging primates. Neurosci. Biobehav. Rev. 22 (4), 541–465. doi: 10.1016/S0149-7634(97)00042-0
Dunmore C. J., Skinner M. M., Bardo A., Berger L. R., Hublin J. J., Pahr D. H., et al. (2020). The position of australopithecus sediba within fossil hominin hand use diversity. Nat. Ecol. Evol. 4 (7), 911–185. doi: 10.1038/s41559-020-1207-5
Fan P., Scott M. B., Fei H., Ma C. (2013). Locomotion behavior of cao vit gibbon (Nomascus nasutus) living in karst forest in bangliang nature reserve, Guangxi, China. Integr. Zool. 8 (4), 356–645. doi: 10.1111/j.1749-4877.2012.00300.x
Feuerriegel E. M., Green D. J., Walker C. S., Schmid P., Hawks J., Berger L. R., et al. (2017). The upper limb of homo naledi. J. Hum. Evol. 104, 155–173. doi: 10.1016/j.jhevol.2016.09.013
Figus C., Sorrentino R., Carlson K. J., Colombo A., Bortolini E., Bernardini F., et al. (2023). Becoming adults: exploring the late ontogeny of the human talus. Front. Ecol. Evol. 11. doi: 10.3389/fevo.2023.1205277
Figus C., Stephens N. B., Sorrentino R., Bortolini E., Arrighi S., Lugli F., et al. (2022). Human talar ontogeny: insights from morphological and trabecular changes during postnatal growth. Am. J. Biol. Anthropol. 179 (2), 211–228. doi: 10.1002/ajpa.24596
Garwicz M., Christensson M., Psouni E. (2009). A unifying model for timing of walking onset in humans and other mammals. Proc. Natl. Acad. Sci. United States America 108 (1), 4335. doi: 10.1073/pnas.1018365108
German R. Z., Stewart S. A. (2002). “Sexual dimorphism and ontogeny in primates,” in Human Evolution Through Developmental Change. Eds. Minugh-Purvis N., McNamara K. J. (Baltimore: The Johns Hopkins University Press), 207–222.
Giddings V. L., Beaupré G. S., Whalen R. T., Carter D. R. (2000). Calcaneal loading during walking and running. Med. Sci. Sports Excercise 32, 627–634. doi: 10.1097/00005768-200003000-00012
Gordon A. D., Marcus E., Wood B. (2013). Great ape skeletal collections: making the most of scarce and irreplaceable resources in the digital age. Am. J. Phys. Anthropol. 152, 2–32. doi: 10.1002/ajpa.22391
Gorissen B. M. C., Wolschrijn C. F., Vilsteren A. A. M. v., Rietbergen B.v., Weeren P. R. v. (2016). Trabecular bone of precocials at birth; are they prepared to run for the wolf(f)? J. Morphol. 277 (7), 948–565. doi: 10.1002/jmor.20548
Green D. J., Alemseged Z. (2012). Australopithecus afarensis scapular ontogeny, function, and the role of climbing in human evolution. Science 338, 514–517. doi: 10.1126/science.1227123
Gross T., Kivell T. L., Skinner M. M., Nguyen N. H., Pahr D. H. (2014). A CT-image-based framework for the holistic analysis of cortical and trabecular bone morphology. Palaeontol. Electronica 17 (3), 2019–2205. doi: 10.26879/438
Hallgrimsson B., Green R. M., Katz D. C., Fish J. L., Bernier F. P., Roseman C. C., et al. (2019). The developmental-genetics of canalization. Semin. Cell Dev. Biol. 88, 67–79. doi: 10.1016/j.semcdb.2018.05.019
Hunt K. D. (2016). Why are there apes? Evidence for the co-evolution of ape and monkey ecomorphology. J. Anat. 228 (4), 630–685. doi: 10.1111/joa.12454
Iwaniuk A. N., Nelson J. E. (2003). Developmental differences are correlated with relative brain size in birds: A comparative analysis. Can. J. Zool. 81 (12), 1913–1285. doi: 10.1139/z03-190
Jablonski N. G., Chaplin G., McNamara K. J. (2002). “Natural selection and the evolution of hominid patterns of growth and development,” in Human Evolution Through Developmental Change. Eds. Minugh-Purvis N., McNamara K. J. (Baltimore: The Johns Hopkins University Press), 189–206.
Kelley J. (2002). “Life history evolution in miocene apes and extant primates,” in Human Evolution Through Developmental Change. Eds. Minugh-Purvis N., McNamara K. (Baltimore: The Johns Hopkins University Press), 223–248.
Kelley J., Schwartz G. T. (2010). Dental development and life history in living African and Asian Apes. Proc. Natl. Acad. Sci. United States America 107 (3), 1035–1405. doi: 10.1073/pnas.0906206107
Kimura T., Okada M., Ishida H. (1979). “Kinesiological characteristics of primate walking: its significance in human walking,” in Environment, Behavior, and Morphology: Dynamic Interactions in Primates. Eds. Morbeck M. E., Preuschoft H., Gomberg N. (New York: Gustav Fischer), 297–311.
Kivell T. L. (2016). A review of trabecular bone functional adaptation: what have we learned from trabecular analyses in extant hominoids and what can we apply to fossils? J. Anat. 228, 569–594. doi: 10.1111/joa.12446
Kivell T. L., Davenport R., Hublin J. J., Thackeray J. F., Skinner M. M. (2018). Trabecular architecture and joint loading of the proximal humerus in extant Hominoids, Ateles, and Australopithecus Africanus. Am. J. Phys. Anthropol. 167 (2), 348–655. doi: 10.1002/ajpa.23635
Klailova M., Casanova C., Henschel P., Lee P., Rovero F., Todd A. (2013). Non-human predator interactions with wild great apes in Africa and the use of camera traps to study their dynamics. Folia Primatol. 83 (3–6), 312–328. doi: 10.1159/000342143
Knobloch H., Pasamanick B. (1959). Gross motor behavior in an infant gorilla. J. Comp. Physiol. Psychol. 52 (5), 559–635. doi: 10.1037/h0041745
Lacquaniti F., Ivanenko Y. P., Zago M. (2012). Development of human locomotion. Curr. Opin. Neurobiol. 22 (5), 822–285. doi: 10.1016/j.conb.2012.03.012
Latimer B. M. (1991). “Locomotor adaptations in australopithecus afarensis: the issue of arboreality,” in Origine(s) de la Bipédie Chez Les Hominidés. Eds. Coppens Y., Senut B. (Paris: CNRS), 169–176.
Latimer B., Lovejoy C. O. (1989). The calcaneus of australopithecus afarensis and its implications for the evolution of bipedality. Am. J. Phys. Anthropol. 78 (3), 369–386. doi: 10.1002/ajpa.1330780306
Lazenby R. A., Skinner M. M., Kivell T. L., Hublin J.-J. (2011). Scaling VOI size in 3D μCT studies of trabecular bone: A test of the over-sampling hypothesis. Am. J. Phys. Anthropol. 144 (2), 196–2035. doi: 10.1002/ajpa.21385
Maquer G., Musy S. N., Wandel J., Gross T., Zysset P. K. (2015). Bone volume fraction and fabric anisotropy are better determinants of trabecular bone stiffness than other morphological variables. J. Bone Mineral Res. 30 (6), 1000–10085. doi: 10.1002/jbmr.2437
Masi S. (2004). Tree use by a western gorilla group (Gorilla gorilla gorilla) in the dzanga-ndoki national park. Folia Primatol. 75, 393.
McElreath R. (2015). Statistical Rethinking: A Bayesian Course With Examples in R and Stan (McElreath 2015: Chapman and Hall/CRC).
Morimoto N., Nakatsukasa M., Ponce De León M. S., Zollikofer C. P. E. (2018). Femoral ontogeny in humans and great apes and its implications for their last common ancestor. Sci. Rep. 8 (1), 1–9. doi: 10.1038/s41598-018-20410-4
Muggeo V. M. R. (2008). Segmented: An R Package to Fit Regression Models with Broken-Line Relationships (R news). 8 (1), 20-25.
Nadell J. A., Elton S., Kovarovic K. (2021). Ontogenetic and morphological variation in primate long bones reflects signals of size and behavior. Am. J. Phys. Anthropol. 174 (2), 327–515. doi: 10.1002/ajpa.24198
Nawathe S., Nguyen B. P., Barzanian N., Akhlaghpour H., Bouxsein M. L., Keaveny T. M. (2015). Cortical and trabecular load sharing in the human femoral neck. J. Biomechanics 48 (5), 816–225. doi: 10.1016/j.jbiomech.2014.12.022
Otsu N. (1979). A threshold selection method from gray-level histograms. IEEE Trans. Syst. Man Cybernetics 9 (1), 62–66. doi: 10.1109/TSMC.1979.4310076
Paaby A. B., Testa N. D. (2018). Developmental plasticity and evolution. in Evolutionary Developmental Biology: A Reference Guide. Edited by Nuno de la Rosa L, Müller G. 1–13. Cham: Springer. doi: 10.1007/978-3-319-33038-9_110-1
Pearson O. M., Lieberman D. E. (2004). The aging of wolff’s ‘Law’: ontogeny and responses to mechanical loading in cortical bone. Am. J. Phys. Anthropol. Suppl 39, 63–99. doi: 10.1002/ajpa.20155
Phillips A. C. (2011). Locomotor Development and Gap Crossing Behaviour in Bornean Orangutans (Pongo Pygmaeus) (University of Birmingham).
Pruetz J. D., Fulton S. J., Marchant L. F., Mcgrew W. C., Schiel M., Waller M. (2008). Arboreal nesting as anti-predator adaptation by savanna chimpanzees (Pan troglodytes verus) in southeastern Senegal. Am. J. Primatol. 70 (4), 393–4015. doi: 10.1002/ajp.20508
Ragni A. J. (2020). Trabecular architecture of the capitate and third metacarpal through ontogeny in chimpanzees (Pan Troglodytes) and gorillas (Gorilla gorilla). J. Hum. Evol. 138, 102702. doi: 10.1016/j.jhevol.2019.102702
Raichlen D. A., Gordon A. D., Foster A. D., Webber J. T., Sukhdeo S. M., Scott R. S., et al. (2015). An ontogenetic framework linking locomotion and trabecular bone architecture with applications for reconstructing hominin life history. J. Hum. Evol. 81, 1–12. doi: 10.1016/j.jhevol.2015.01.003
R Core Team (2019). R: A Language and Environment for Statistical Computing (Vienna: R Foundation for Statistical Computing). Available at: http://www.r-project.org/.
Rein T. R., Harrison T., Carlson K. J., Harvati K. (2017). Adaptation to suspensory locomotion in australopithecus sediba. J. Hum. Evol. 104, 1–12. doi: 10.1016/j.jhevol.2016.12.005
Remis M. (1995). Effects of body size and social context on the arboreal activities of lowland gorillas in the Central African Republic. Am. J. Phys. Anthropol. 97, 413–433. doi: 10.1002/ajpa.1330970408
Ross C. (2001). Park or ride? Evolution of infant carrying in primates. Int. J. Primatol. 22 (5), 749–771. doi: 10.1023/A:1012065332758
Ruff C. B., Burgess M. L., Junno J. A., Mudakikwa A., Zollikofer C. P. E., Ponce de Leóon M. S., et al. (2018). Phylogenetic and environmental effects on limb bone structure in gorillas. Am. J. Phys. Anthropol. 166 (2), 353–725. doi: 10.1002/ajpa.23437
Ryan T. M., Raichlen D. A., Gosman J. H. (2017). “Structural and mechanical changes in trabecular bone during early development in the human femur and humerus,” in Building Bones: Bone Formation and Development in Anthropology. Eds. Percival C. J., Richtsmeier J. T. (Cambridge: Cambridge University Press), 281–302.
Saers J. P. P., DeMars L. J. D., Stephens N. B., Jashashvili T., Carlson K. J., Gordon A. D., et al. (2021). Combinations of trabecular and cortical bone properties distinguish various loading modalities between athletes and controls. Am. J. Phys. Anthropol. 174 (3), 434–505. doi: 10.1002/ajpa.24176
Saers J. P. P., Gordon A. D., Ryan T. M., Stock J. T. (2022a). Growth and development of trabecular structure in the calcaneus of Japanese macaques (Macaca fuscata) reflects locomotor behavior, life history, and neuromuscular development. J. Anat. 241 (1), 67–815. doi: 10.1111/joa.13641
Saers J. P. P., Gordon A. D., Ryan T. M., Stock J. T. (2022b). Trabecular bone ontogeny tracks neural development and life history among humans and non-human primates. Proc. Natl. Acad. Sci. 119 (49), 1–125. doi: 10.1073/pnas.2208772119
Saers J. P. P., Ryan T. M., Stock J. T. (2020). Baby steps towards linking calcaneal trabecular bone ontogeny and the development of bipedal human gait. J. Anat. 236, 474–492. doi: 10.1111/joa.13120
Sarringhaus L., Lewton K. L., Iqbal S., Carlson K. J. (2022). Ape femoral-humeral rigidities and arboreal locomotion. Am. J. Biol. Anthropol. 179 (4), 624–395. doi: 10.1002/ajpa.24632
Sarringhaus L. A., MacLatchy L. M., Mitani J. C. (2014). Locomotor and postural development of wild chimpanzees. J. Hum. Evol. 66, 29–38. doi: 10.1016/j.jhevol.2013.09.006
Sarringhaus L. A., MacLatchy L. M., Mitani J. C. (2016). Long bone cross-sectional properties reflect changes in locomotor behavior in developing chimpanzees. Am. J. Phys. Anthropol. 160 (1), 16–295. doi: 10.1002/ajpa.22930
Shaw C. N., Stock J. T. (2009). Intensity, repetitiveness, and directionality of habitual adolescent mobility patterns influence the tibial diaphysis morphology of athletes. Am. J. Phys. Anthropol. 140 (1), 149–595. doi: 10.1002/ajpa.21064
Skedros J. G., Cronin J. T., Dayton M. R., Bloebaum R. D., Bachus K. N. (2023). Exploration of the synergistic role of cortical thickness asymmetry (‘Trabecular eccentricity’ Concept) in reducing fracture risk in the human femoral neck and a control bone (Artiodactyl calcaneus). J. Theor. Biol. 567, 111495. doi: 10.1016/j.jtbi.2023.111495
Stern J. T. (2000). Climbing to the top: A personal memoir of australopithecus afarensis. Evolutionary Anthropol.: Issues News Rev. 9 (3), 113–133. doi: 10.1002/1520-6505(2000)9:3<113::AID-EVAN2>3.0.CO;2-W
Stern T., Aviram R., Rot C., Galili T., Sharir A., Achrai N. K., et al. (2015). Isometric scaling in developing long bones is achieved by an optimal epiphyseal growth balance. PloS Biol. 13 (8), 1–285. doi: 10.1371/journal.pbio.1002212
Stern J. T., Susman R. L. (1983). The locomotor anatomy of australopithecus afarensis. Am. J. Phys. Anthropol. 60 (3), 279–317. doi: 10.1002/ajpa.1330600302
Stewart F. A., Pruetz J. D. (2013). Do chimpanzee nests serve an anti-predatory function? Am. J. Primatol. 75 (6), 593–6045. doi: 10.1002/ajp.22138
Sugardjito J., van Hooff J., (1986). Age-sex class differences in the positional behaviour of the sumatran orang-utan (Pongo pygmaeus abelii) in the gunung LEuser NAtional park, Indonesia. Folia Primatol. 47, 14–25. doi: 10.1159/000156260
Sutherland D. (1997). The development of mature gait. Gait Posture 6 (2), 163–170. doi: 10.1016/S0966-6362(97)00029-5
Tanck E., Homminga J., van Lenthe G. H., Huiskes R. (2001). Increase in bone volume fraction precedes architectural adaptation in growing bone. Bone 28 (6), 650–654. doi: 10.1016/S8756-3282(01)00464-1
Thorpe S. K. S., Crompton R. H. (2006). Orangutan positional behavior and the nature of arboreal locomotion in hominoidea. Am. J. Phys. Anthropol. 131 (3), 384–4015. doi: 10.1002/ajpa.20422
Tsegai Z. J., Skinner M. M., Pahr D. H., Hublin J.-J., Kivell T. L. (2018). Ontogeny and variability of trabecular bone in the chimpanzee humerus, femur and tibia. Am. J. Phys. Anthropol. 167 (4), 713–365. doi: 10.1002/ajpa.23696
Tuttle R., Basmajian J. V. (1974). Electromyography of brachial muscles in pan gorilla and hominoid evolution. Am. J. Phys. Anthropol. 41 (1), 71–905. doi: 10.1002/ajpa.1330410110
Tuttle R. H., Basmajian J. V. (1978). Electromyography of pongid shoulder muscles. II. Deltoid, rhomboid and rotator cuff. Am. J. Phys. Anthropol. 49 (1), 47–565. doi: 10.1002/ajpa.1330490109
Tuttle R. H., Velte M. J., Basmajian J. V. (1983). Electromyography of brachial muscles in pan troglodytes and pongo pygmaeus. Am. J. Phys. Anthropol. 61 (1), 75–835. doi: 10.1002/ajpa.1330610108
Veneziano A., Cazenave M., Alfieri F., Panetta D., Marchi D. (2021). Novel strategies for the characterization of cancellous bone morphology: virtual isolation and analysis. Am. J. Phys. Anthropol. 175, 920–930. doi: 10.1002/ajpa.24272
Venkataraman V. V., Kraft T. S., Dominy N. J. (2013). Tree climbing and human evolution. Proc. Natl. Acad. Sci. United States America 110 (4), 1237–1425. doi: 10.1073/pnas.1208717110
Wall-Scheffler C. M., Geiger K., Steudel-Numbers K. L. (2007). Infant carrying: the role of increased locomotory costs in early tool development. Am. J. Phys. Anthropol. 133 (2), 841–846. doi: 10.1002/ajpa.20603
Ward C. V. (2002). Interpreting the posture and locomotion of australopithecus afarensis: where do we stand? Am. J. Phys. Anthropol. 119 (S35), 185–215. doi: 10.1002/ajpa.10185
Wasserug R. J., Sperry D. G. (1977). The relationships of locomotion to differential predation on pseudacris triseriata (Anura: hylidae). Ecology 58 (4), 830–839. doi: 10.2307/1936218
Wells J. C. K., Stock J. T. (2011). Re-examining heritability: genetics, life history and plasticity. Trends Endocrinol. Metabol.: TEM 22 (10), 421–285. doi: 10.1016/j.tem.2011.05.006
White T. D., Asfaw B., Beyene Y., Haile-Selassie Y., Lovejoy C. O., Suwa G., et al. (2009). Ardipithecus ramidus and the paleobiology of early hominids. Science 326 (5949), 75–86. doi: 10.1126/science.1175802
Wickham H. (2016). Ggplot2: Elegant Graphics for Data Analysis (Second. Cham: Springer International Publishing).
Wolschrijn C. F., Weijs W. A. (2004). Development of the trabecular structure within the ulnar medial coronoid process of young dogs. Anatomical Rec. 278 (2), 514–195. doi: 10.1002/ar.a.20039
Keywords: ontogeny, locomotion, primates, hominin evolution, bone, life history
Citation: Saers JPP (2023) Skeletal indicators of developmental changes in arboreality and locomotor maturation in extant apes and their relevance to hominin paleobiology. Front. Ecol. Evol. 11:1274762. doi: 10.3389/fevo.2023.1274762
Received: 08 August 2023; Accepted: 08 November 2023;
Published: 24 November 2023.
Edited by:
Nicholas Baird Holowka, University at Buffalo, United StatesReviewed by:
Zewdi Tsegai, The University of Chicago, United StatesAntony Colombo, Université Paris Sciences et Lettres, France
Copyright © 2023 Saers. This is an open-access article distributed under the terms of the Creative Commons Attribution License (CC BY). The use, distribution or reproduction in other forums is permitted, provided the original author(s) and the copyright owner(s) are credited and that the original publication in this journal is cited, in accordance with accepted academic practice. No use, distribution or reproduction is permitted which does not comply with these terms.
*Correspondence: Jaap P. P. Saers, anBwczJAY2FtLmFjLnVr