 Marijke Struijk1,2*
 Jamie R. Stavert3Rebecca J. Le Grice1,4
 Luitgard Schwendenmann2Poppy Joaquina Romera1Grace Mitchell1,5
 Marie Sünnemann6,7Jaynie Yang2Fredrik Hjelm8
 Andrew D. Barnes1
- 1Environmental Research Institute, Te Aka Mātuatua School of Science, University of Waikato, Hamilton, New Zealand
- 2School of Environment, The University of Auckland, Auckland, New Zealand
- 3Department of Conservation – Te Papa Atawhai, Auckland, New Zealand
- 4Canterbury Museum, Christchurch, New Zealand
- 5Manaaki Whenua - Landcare Research, Waikato Mail Centre, Hamilton, New Zealand
- 6German Centre for Integrative Biodiversity Research (iDiv) Halle-Jena-Leipzig, Leipzig, Germany
- 7Institute of Biology, Leipzig University, Leipzig, Germany
- 8BioSense, Auckland, New Zealand
Tree pathogens threaten the survival of many forest foundation tree species worldwide. However, there is limited knowledge of how dieback of foundation tree species may threaten other components of forest ecosystems, such as soil biodiversity and associated ecosystem functions. Kauri (Agathis australis), threatened by the root-borne pathogen Phytophthora agathidicida, are culturally and ecologically significant tree species that exert great influence on soil properties. We aimed to characterise soil mesofauna community structure and energy fluxes in kauri forests and assess the potential threat that tree pathogens such as P. agathidicida pose to belowground ecosystems. We sampled soil mesofauna communities and identified specimens to functional feeding groups at 24 pairs of kauri and adjacent broadleaf trees in sites across the Waitākere Ranges Regional Park, Aotearoa – New Zealand. We attributed kauri canopy health scores, measured tree diameter, slope, forest floor depth, and soil carbon dioxide efflux. We also analysed soil samples for P. agathidicida presence, total carbon, and total nitrogen. We constructed soil mesofauna food webs associated with kauri and broadleaf trees, and assessed the uniqueness of food webs associated with kauri and the impacts of P. agathidicida on density, biomass, mean body mass, and energy fluxes of mesofauna taxonomic and trophic groups. We found omnivores with larger body mass at kauri where P. agathidicida was detected (i.e., P. agathidicida-positive soils). Compared to broadleaf trees, mesofauna density and biomass were lower in soils under kauri, and body masses of Symphyla and omnivores were smaller in soils under kauri. Differences in mesofauna community response variables between tree types were mainly modulated by the soil C:N ratio, which had positive effects under broadleaf and neutral to negative effects under kauri. Energy fluxes to detritivores and fungivores were greater under larger trees, regardless of tree type or P. agathidicida detection status. Our findings suggest that kauri support soil mesofauna food webs that are distinctly different from those found under broadleaf trees in the same habitat. A decreased presence of this foundation species may be linked to future impacts on soil mesofauna in this forest ecosystem with increasingly advanced stages of kauri dieback.
1 Introduction
Species that modulate much of the structure of a community by exerting significant local impacts on fundamental ecosystem processes can be described as foundation species (Dayton, 1972; Ellison et al., 2005), and have also been referred to as ecosystem engineers (Jones et al., 1994), or structural species (Huston, 1994). Trees often have the role of foundation species in forest ecosystems (Ellison et al., 2005), influencing aspects such as microclimate and soil biogeochemistry, and thereby imposing local selection criteria on the community structure of other forest species.
Ongoing introductions and spread of tree pathogens threaten many of the world’s foundation tree species. Impacts of tree pathogens on beyond-the-host aspects of forest ecosystems remain largely understudied and can be difficult to disentangle from variables associated with environmental conditions that are conducive to pathogen introduction, establishment and spread. However, it is generally understood that illness or loss of foundation trees will likely have far-reaching impacts on associated plant and animal composition and diversity, as well as on associated soil biogeochemical properties including carbon (C) storage, and on ecosystem functions, stability, and cultural value (Ellison et al., 2005; Boyd et al., 2013; Dietze and Matthes, 2014; Anderson-Teixeira et al., 2021). Additional factors that threaten the survival and dominance of foundation tree species include forest fragmentation and soil disturbance due to (a history of) logging and compounding stressors caused by climate change, such as increased frequency and/or severity of drought events, increased storm events, temperature changes, and extended periods of soil water saturation. These stressors can all contribute to host susceptibility to forest pathogens and the diseases they cause (Jung et al., 2000; Panzavolta et al., 2021).
One group of organisms that may be indirectly affected by ecosystem changes resulting from tree pathogens include soil mesofauna, commonly considered as bioindicators of soil conditions after disturbance or land-use change (Sousa et al., 2006; Pulleman et al., 2012; George et al., 2017). Tree pathogen impacts on soil mesofauna are likely to occur through changes in (1) physical habitat characteristics, especially porosity, water and air, where different organisms occupy slightly different niches depending on pore size preference or tolerance to desiccation; and (2) food availability in the form of organic C and nutrients contained in microbial biomass and organic matter, as well as in soil aggregate-protected organic substrates, chemically sorbed substrates, and organic molecules in solution (Lavelle, 2012). Pathogen-induced changes to canopy cover and litterfall (Kaňa et al., 2013) could alter soil moisture (Ritter et al., 2005), soil structure and food availability by affecting solar radiation, soil and air temperature, soil cover, inputs of organic matter and nutrients, and soil microbial densities (Reinhart et al., 2010). Furthermore, vegetation is a key driver of soil invertebrate diversity, and a reduced aboveground plant richness due to loss of foundation species will likely have negative impacts on soil fauna (Bastida et al., 2020).
Kauri (Agathis australis) is a conifer species, endemic to the northern regions of Aotearoa (New Zealand), occurring between 34 °S and 38 °S (Steward and Beveridge, 2010). Despite being an early successional species, kauri is also the largest and longest-lived tree species in Aotearoa forests (Wyse and Burns, 2013) with trunks up to five metres in diameter (Steward and Beveridge, 2010). Kauri are culturally significant and considered as a taonga (treasure) species by Māori. Many of these ‘living giants’ have been named and form part of Māori stories of creation, such as Tāne Mahuta, the largest surviving kauri at present. Both spiritually and environmentally, the health of kauri is regarded as an indicator of the overall health of the forests they occur in.
Kauri are critically threatened by the soil-borne root pathogen Phytophthora agathidicida (Oomycota), one of many Phytophthora species found in association with kauri but the only pathogen species currently known to threaten its survival. P. agathidicida causes a disease commonly known as kauri dieback. As the Phytophthora mycelium infects the roots, root cells are destroyed and the roots become unable to extract moisture and nutrients from the soil (Erwin and Ribeiro, 1996). This leads to collar rot, excessive resin production (base bleeds), crown decline, severe chlorosis, and eventually tree mortality. The onset of these visible aboveground symptoms can take several years, while mortality can take as long as ten years. This prolonged process of dying may be due to a gradual suppression of the host’s defence response and a long latency period of the disease (Bradshaw et al., 2020).
Our aims were to determine the ecological significance of kauri—as a foundation species (Jones et al., 1994; Wyse et al., 2014) and modulator of soil abiotic conditions and resource availability—and to assess the impact of P. agathidicida in structuring belowground biodiversity. Kauri produce large volumes of polyphenol- and tannin-rich litter (Enright and Ogden, 1987), that is thought to contain phytotoxic compounds that impose environmental filtering (Wyse and Burns, 2013). It has been observed that some plant species are comparatively more abundant in association with kauri than in surrounding kauri-free forests, while other species that are abundant in surrounding forest are often found to be absent from kauri stands (Cockayne, 1908; Wardle, 1991; Wyse et al., 2014). The remarkably thick soil organic layers (Silvester and Orchard, 1999), with large stocks of organic matter and immobilised N (Silvester, 2000; Verkaik et al., 2006), low nutrient availability (Verkaik and Braakhekke, 2007), low pH levels around four (Silvester, 2000; Wyse, 2012) and periodically low moisture contents (Verkaik and Braakhekke, 2007) of soils found under kauri will shape the habitat of the soil organisms that form the soil food web (Briones, 2018). Therefore, the soil under kauri is likely to harbour food webs that are distinct in terms of their structure and functioning from those found in the soil under other surrounding vegetation. A study on reared insect assemblages (from beetle-, fly, and moth larvae and pupae) from kauri, kanuka and puriri leaf litter collected from study sites in kauri forests, demonstrated that kauri litter harboured a higher abundance of native insect species, as well as more abundant and diverse beetle assemblages (Tomlinson, 2007). These findings reinforce the likelihood of kauri supporting distinct soil faunal communities.
Because of the measurable influence of kauri on the ecosystem, kauri dieback threatens not only the survival of kauri, but also the associated biota and ecosystem functions of these forest ecosystems. Soil invertebrates are key drivers of ecosystem functioning (Wilson, 1987; Eisenhauer et al., 2019) and the quantification of energy fluxes in soil food webs can be a powerful tool to assess rates of ecosystem functioning across multiple trophic levels (Barnes et al., 2018). An initial increase in the amount of kauri litter (Kaňa et al., 2013) and loss of kauri root productivity (Yang, 2022) and exudation can be expected as the disease takes hold. This, in turn, will affect the habitat available for members of the soil food web, by changes to soil physicochemical properties like the C:N ratio of organic substrates, nutrient availability, soil porosity, and soil pH (Paul, 2015). Higher pathogen (P. agathidicida DNA) concentrations have been associated with lower nutrient concentrations and fluxes in canopy throughfall (especially potassium and manganese) and forest floor leachate (especially calcium and silicon) (Schwendenmann and Michalzik, 2021), and with lower dissolved organic C and dissolved nitrogen (N) fluxes in canopy throughfall and forest floor leachate (Schwendenmann and Michalzik, 2019). Some studies report pathogen infection of trees to lead to increased photosynthetic activity in seedlings (D’Souza et al., 2021), and higher C content in litter (Jones, 2021) while there are also indications that stem growth rates of symptomatic trees are suppressed (T. Elliot, pers. comm., 9 November 2023). These pathogen-induced shifts in tree nutrient and C budgets can have cascading effects on soil mesofauna by altering their habitat and food sources.
To assess the potential belowground ecosystem impacts of P. agathidicida and the role of kauri as a foundation species in supporting distinct soil food webs, we measured the density (abundance m-2), biomass, and mean body mass of mesofauna taxa and trophic groups, and quantified energy fluxes in mesofauna soil food webs under kauri and broadleaf trees in three kauri forest locations. Specifically, we compared soil mesofauna food webs from kauri with P. agathidicida-positive soil to those from kauri with P. agathidicida-negative soil to find out if kauri dieback causes pervasive shifts in soil food web structure and functioning. We expected that soil food webs under kauri with P. agathidicida-positive soil would shed more litter and therefore contain a higher density and biomass of decomposer species, and greater energy fluxes attributed to fungivory, bactivory, and detritivory. We also compared soil mesofauna food webs from below kauri to those below broadleaf trees to test the hypothesis that kauri harbour distinctly different soil food webs. To better understand modulators of differences between kauri growing in soils of contrasting P. agathidicida detection statuses, and between kauri and broadleaf trees, we also included a suite of environmental variables and tree characteristics in our models. Our findings will help assess how major pathogens affecting dominant tree species around the world may shift the properties and stability of ecosystem functions associated with the presence of foundation species in these forests.
2 Materials and methods
2.1 Field sites
We collected soil fauna samples underneath the canopies of 48 focal trees at three locations (Cascades, Huia, and Piha) in the Waitākere Ranges Regional Park, Auckland, Aotearoa (Figure 1). The Waitākere Ranges Regional Park is covered predominantly by podocarp-broadleaf forest growing on sandy loam soils derived from andesitic grit, sand, and siltstone (Hayward, 1976). The area has mean annual temperatures between 13 °C and 16 °C and a mean annual total rainfall of 1300 mm to 1600 mm, based on data from the period 1981-2010 (Chappell, 2013).
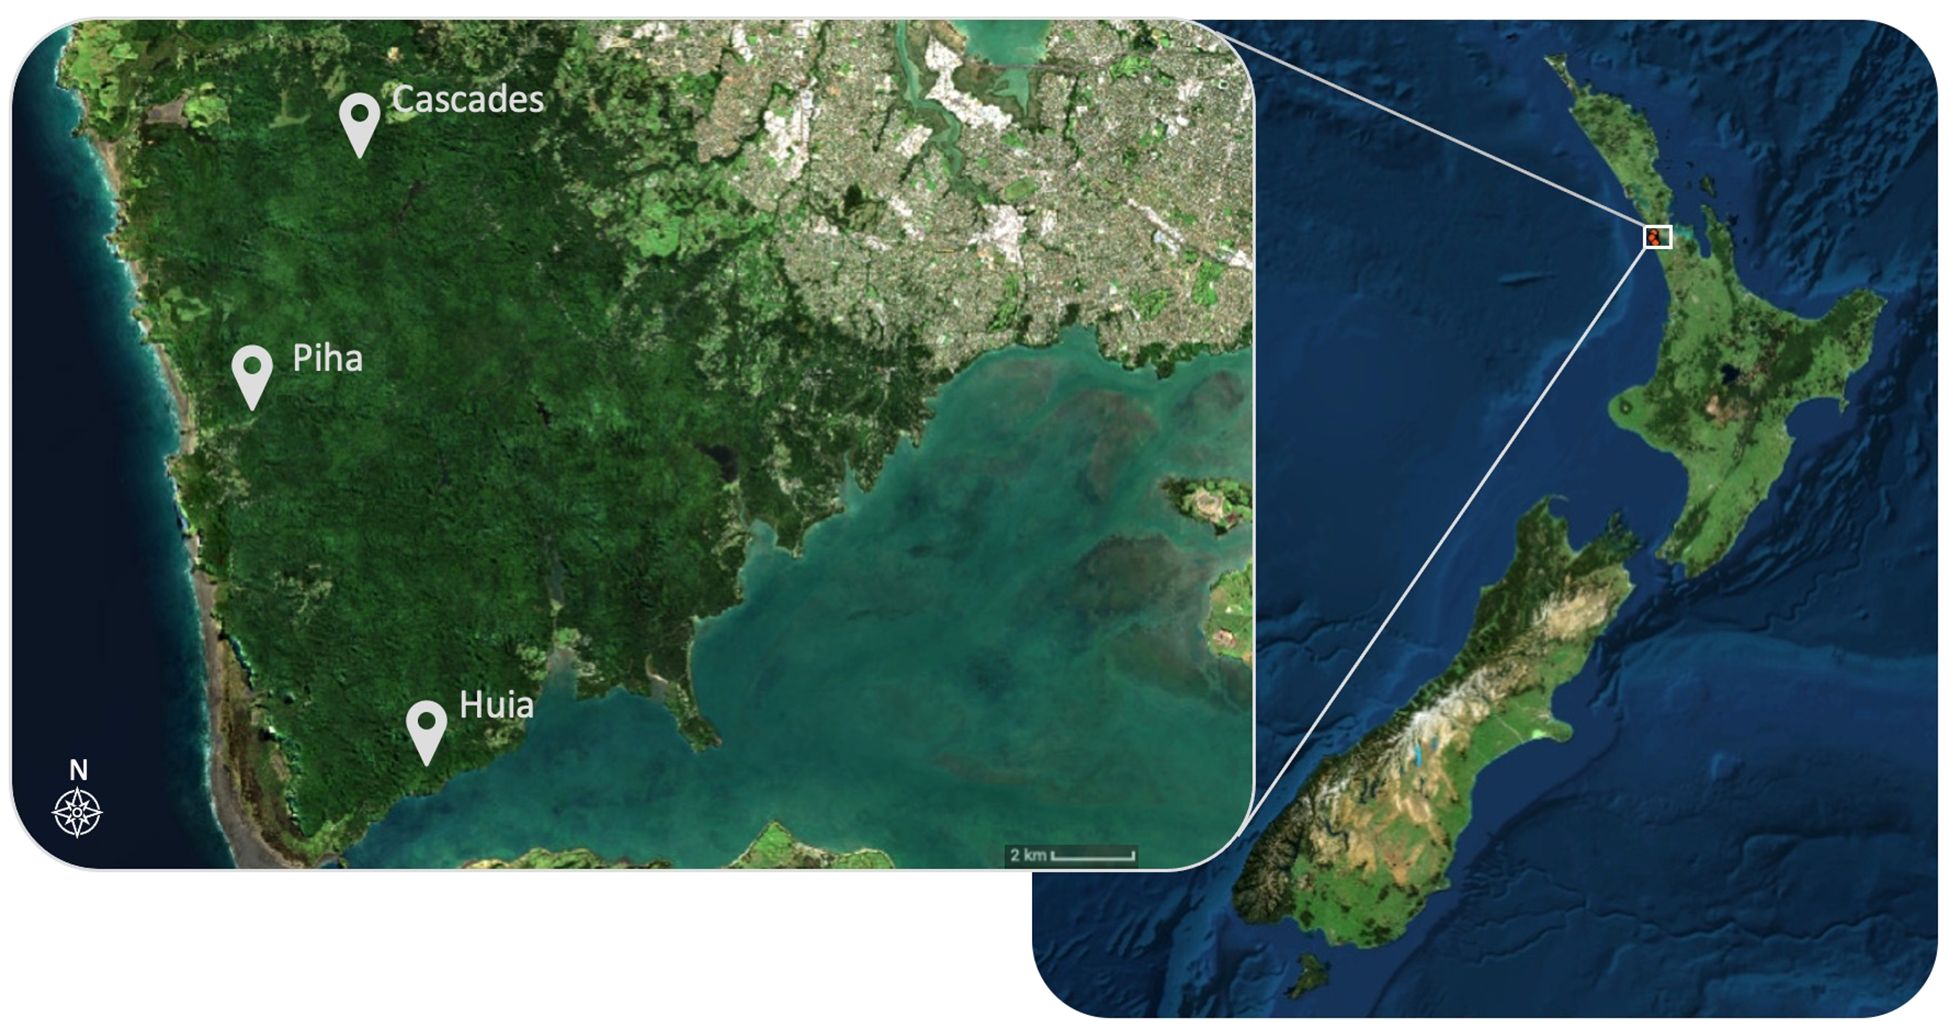
Figure 1 Map of the three locations within the Waitākere Ranges Regional Park where samples were collected. There were two plots at each location. Maps were prepared in ArcGIS Desktop 10.8.2 using the NZ Imagery Basemap (Eagle Technology, LINZ, 2020).
At each of our three study locations, there were two 40 m × 50 m plots, which were established between 2011 and 2014 for long-term vegetation monitoring. These plots were originally established to represent stands of either symptomatic or asymptomatic kauri at each location, based on visual tree assessments. However, symptomatic trees have since been identified in asymptomatic plots and P. agathidicida has been detected in soil in five out of six plots.
We sampled pairs of trees at the corners of each plot to achieve a minimum distance of 40 m among sampled tree pairs. First we selected four focal kauri as close as possible to the corner of each plot, and then four focal broadleaf trees outside of the plot adjacent to each focal kauri (Figure 2). We selected kauri and broadleaf trees with a minimum diameter at breast height (DBH) of 10 cm and where the leaf litter under the canopy was clearly dominated by kauri or broadleaf litter, respectively. Kauri litter was easily distinguished from broadleaf litter as kauri sheds litter as branchlets with many opposite leaf pairs that gradually dislodge to become incorporated in the soil litter layer (Figure 2). No broadleaf trees fulfilling our criteria were found in the vicinity of two of the kauri trees at the Piha location, and therefore our study included a total of 24 focal kauri and 22 focal broadleaf trees. Distance between each kauri-broadleaf pair ranged from 7 m to 30 m, with a median distance of 15.5 m. Focal broadleaf tree species included Coprosma arboria, Knigthia excelsa, Melicytus ramiflorus, Pseudopanax crassifolius, and Vitex lucens.
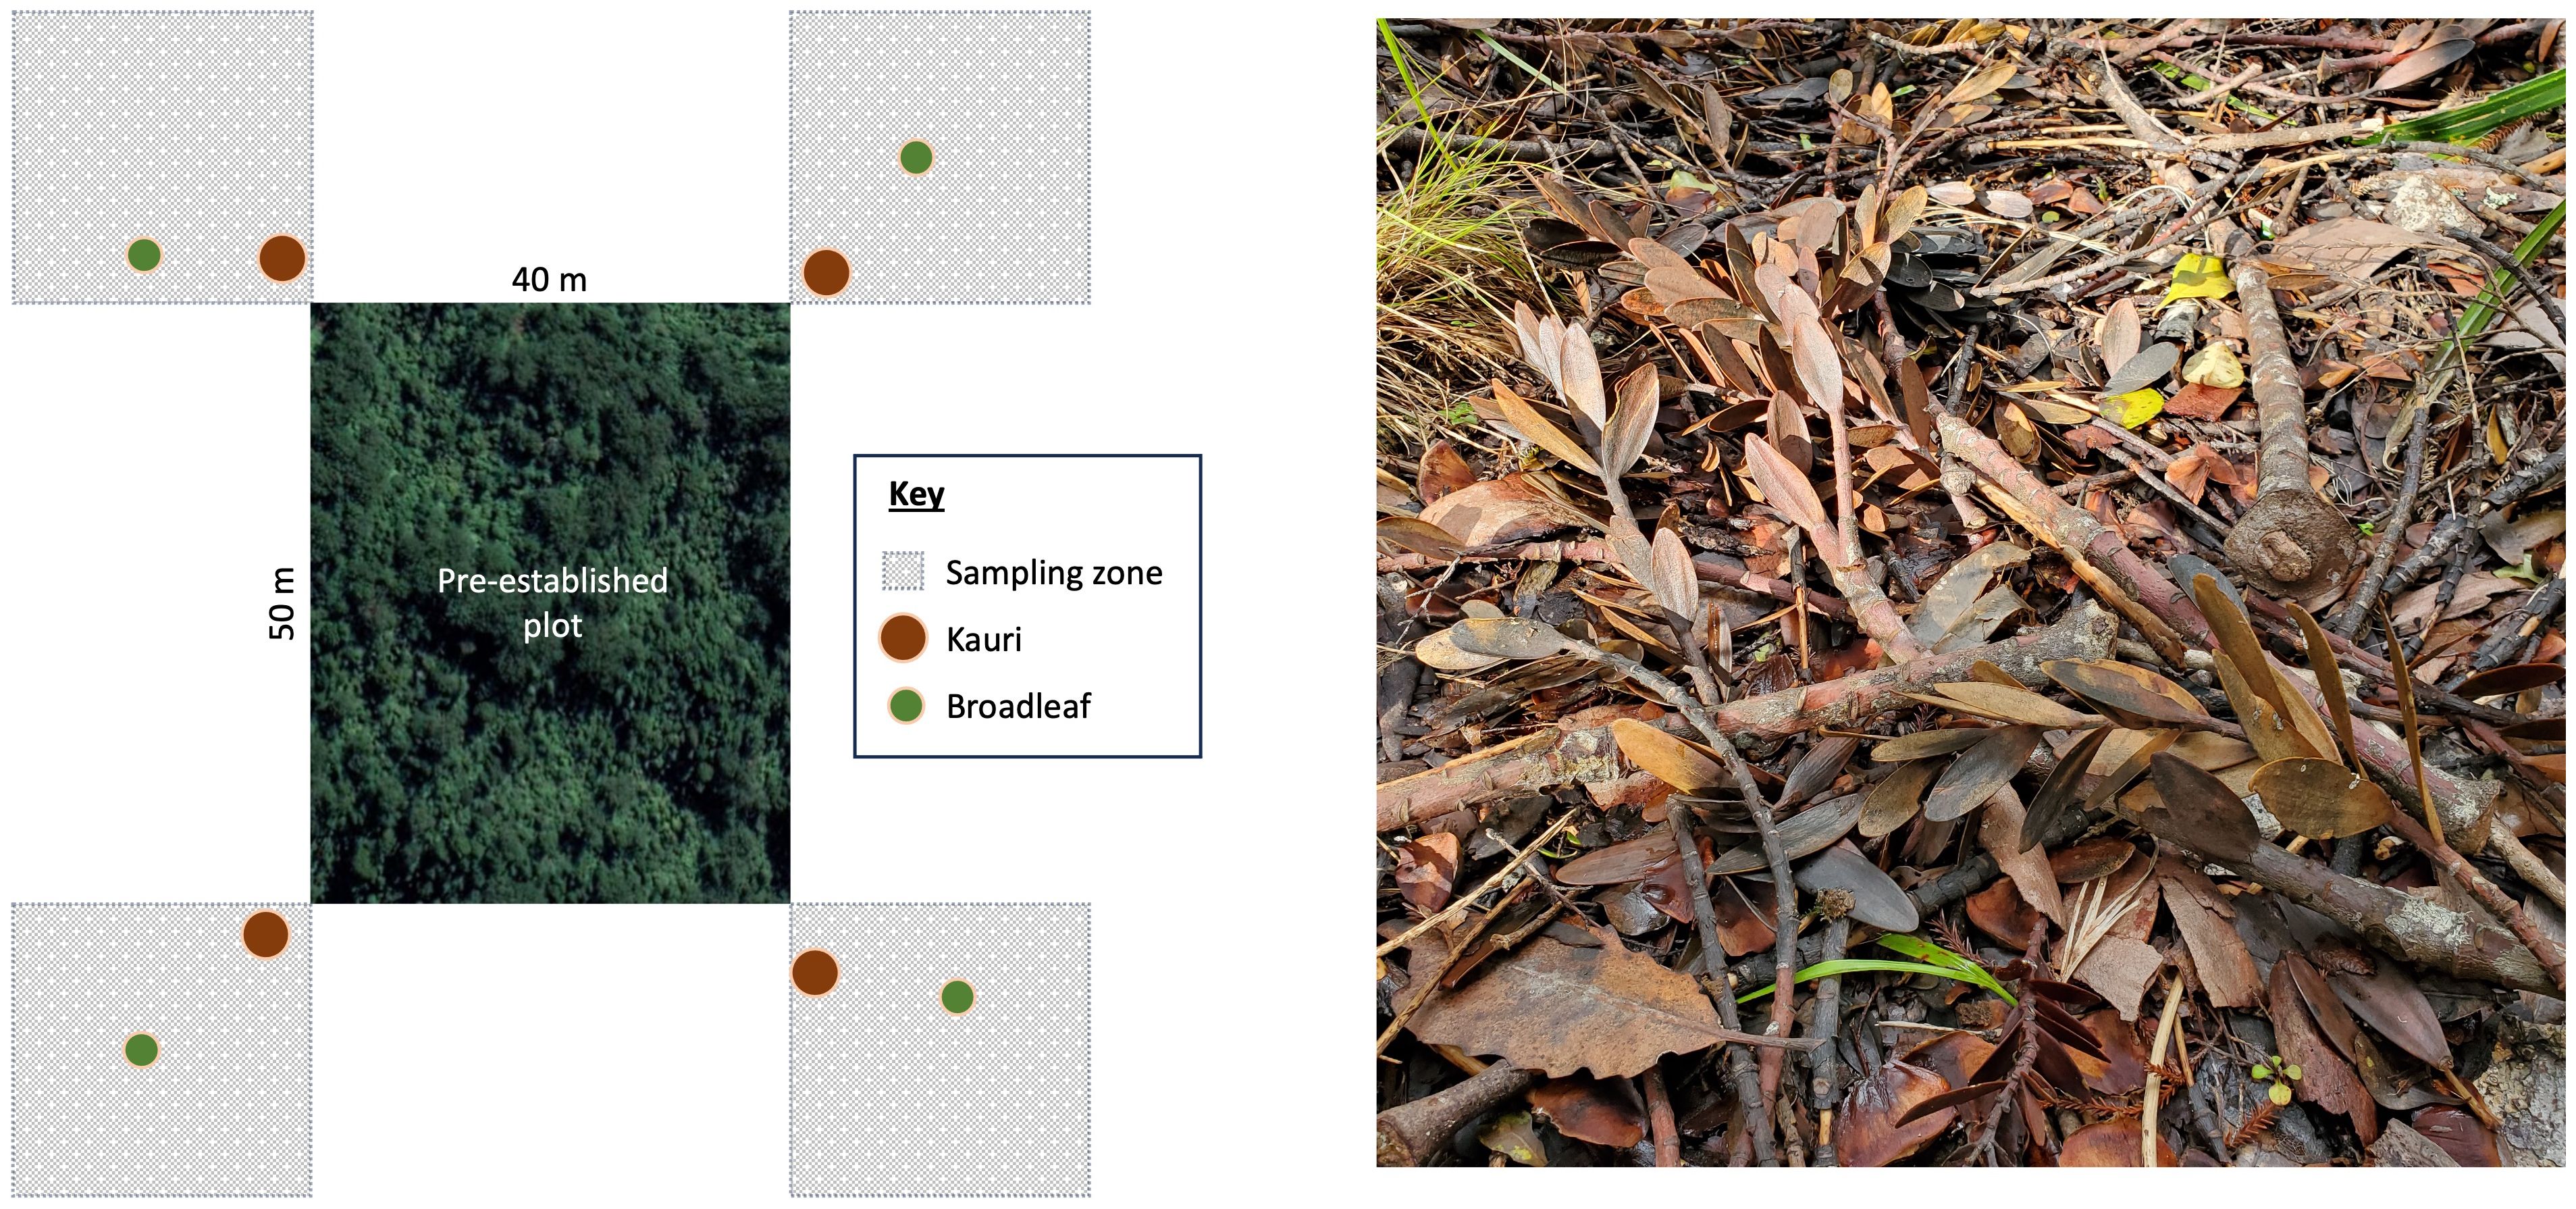
Figure 2 Sampling zone for each focal tree relative to each pre-established vegetation plot (left) and kauri litter (right).
2.2 Soil fauna sampling, extraction, and identification
Soil fauna samples were collected during the austral summer, in January 2022. At each focal tree, we placed a 50 cm × 50 cm quadrat at half-canopy distance, i.e., the midway point between the stem and edge of the canopy extending from the focal tree. Within the quadrat, we collected one soil core of 5 cm diameter and 10 cm depth, not counting the loose litter layer. Each 5 cm soil core was kept cool and returned to the lab, where they were gently placed upside down in a small container with a 2 mm mesh underside and put in a MacFadyen high-gradient heat extractor (ecoTech Umwelt-Messsysteme GmbH, Bonn, Germany) to expel soil mesofauna (i.e., fauna with 0.1 mm – 2 mm body width). Extractions were run for 11 days at a programmed temperature ramp starting at 20 °C on day one and reaching 55 °C on the last two days (see Supplementary Material Table 1 for full schedule), until the soil core was completely desiccated. All mesofauna were extracted into vials containing ethylene glycol, and then transferred to 75% ethanol for storage.
Mesofauna were identified to functional feeding group as specified in Table 1. Furthermore, the body length of each individual was measured using an ocular micrometre under a stereo microscope. Soil mesofauna fresh body mass (mg) was calculated from body length according to published allometric scaling relationships for Collembola, Astigmata, Mesostigmata, Oribatida, Prostigmata, Endeostigmata, Pauropoda, Protura, Symphyla, and Pseudoscorpions (Mercer et al., 2001; Gruner, 2003; Höfer and Ott, 2009) (Supplementary Material Table 2). We then used fresh body mass to quantify community biomass by summing all individual body masses for major taxa, trophic groups, and the food web for each sampled community (at each focal tree). In addition, we calculated the mean body mass of each mesofauna group in each community by calculating the community weighted mean of individual body masses (i.e., the total biomass of each functional group divided by the abundance of that group for each sample).
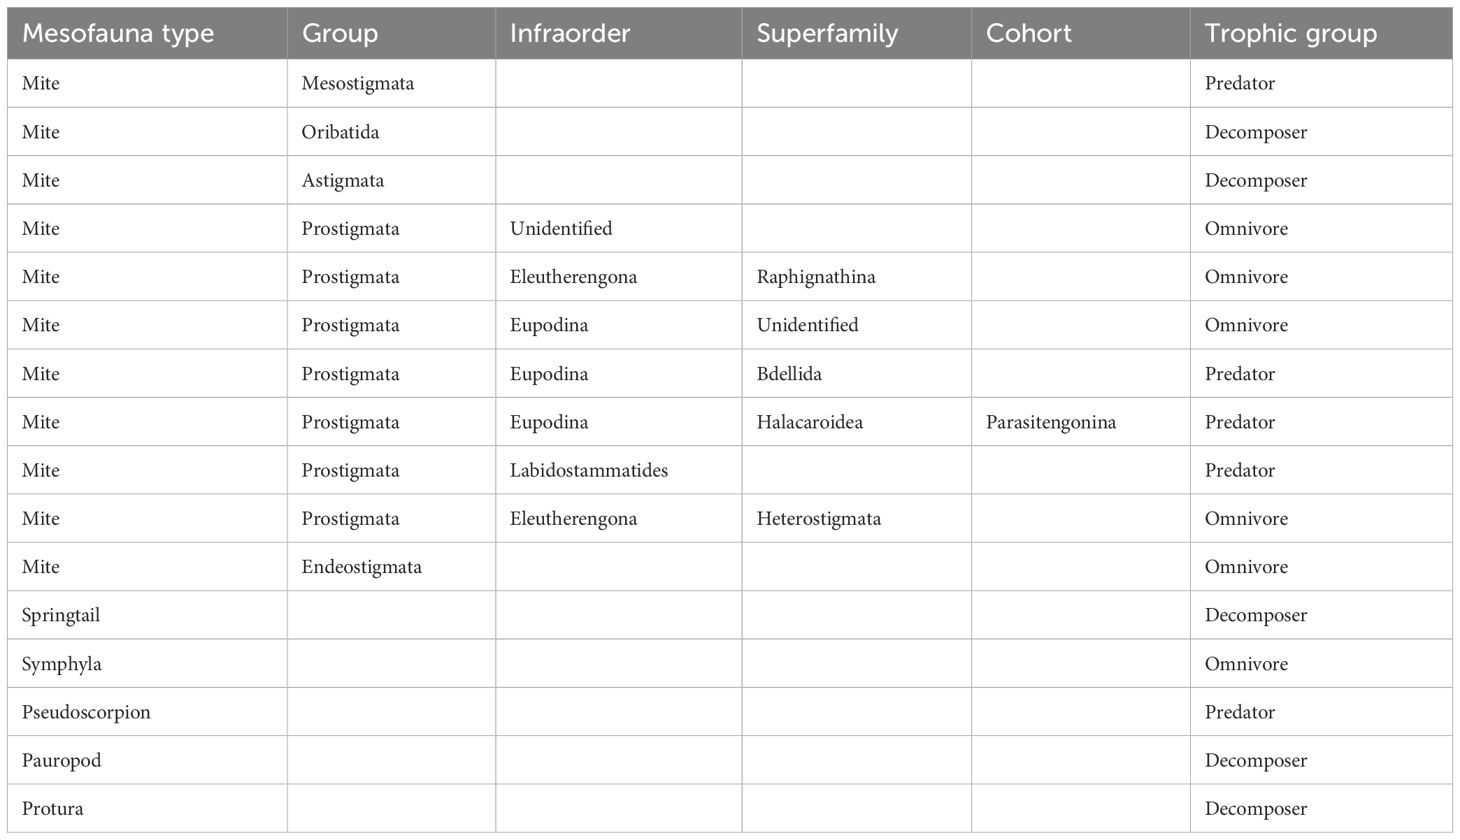
Table 1 Mesofauna trophic group attributions, based on Potapov et al. (2022); Crotty and Adl (2019); Krantz and Walter (2009); Lindquist (1986); Walter and Proctor (2013).
We created a meta food web (Supplementary Material Table 3) describing the feeding relationships and preferences of all mesofauna taxa identified in our samples. To create this meta food web, we drew on published data from forest soil food webs constructed for 16 sites in German temperate forests (Digel et al., 2014). To improve accuracy, we adjusted our meta food web with data from other published food webs and reports on feeding preferences of specific mesofauna groups (Lindquist, 1986; Krantz and Walter, 2009; Walter and Proctor, 2013; Crotty and Adl, 2019; Potapov et al., 2022). It is likely that the link structure of forest soil food webs differs notably between kauri forests in Aotearoa and temperate European forests. However, we expect that the more general structure of food webs among these systems will be consistent enough to provide a reliable indication of major energy channels in Aotearoa kauri forests.
2.3 Soil analyses and tree health assessments
We used the remaining soil after mesofauna extraction to determine total C and N concentration by combustion (El Vario, Elementar Analysensysteme GmbH, Langenselbold, Germany), from which we calculated C:N ratio. The DBH of each focal tree was measured in May-June 2021 (late austral autumn to early austral winter). Forest floor depth (thickness of the litter layer and soil organic layer) was measured during the austral summer, in November-December 2021, by pressing a thin metal rod straight down into an area of undisturbed forest floor until resistance was felt, indicating the boundary to the mineral soil layer (Alcázar et al., 2002; Haukenes et al., 2022). The rod was marked at this spot, removed from the soil, and measured for length (cm). This was repeated three times, and the average reading taken. Using a clinometer, the slope at each focal tree was also measured in November-December 2021. Soil carbon dioxide (CO2) efflux (µmol m-2 s-1) was measured in May-June 2022 using a soil respiration chamber SRC-2 connected to portable infrared analyser (EGM 5, PP Systems, Amesbury, USA) at half-canopy distance from the stem of each focal tree.
We attributed canopy health scores to each focal kauri following Dick and Bellgard (2010), where 1 = good condition, 2 = foliage thinning, 3 = some branch dieback, 4 = severe dieback, and 5 = dead. To test for P. agathidicida presence, additional soil samples were collected at each focal kauri during in late February - early March 2022 (late austral summer to early austral autumn). These samples contained both soil and root material from the top 10-15 cm of soil (excluding litter) and consisted of (1) four subsamples collected at each cardinal point at ca. 100 cm from the trunk, and (2) four additional subsamples from high-risk areas within the kauri rootzone (ca. 15 × DBH). High-risk areas included kauri roots, necrotic roots, locally waterlogged points, or areas next to resin oozing from a trunk. Each sample was homogenised, and 200 g subsamples were air-dried. The dried soils were sprayed with reverse osmosis (RO) water and stored at 19 °C – 22 °C for four days for moist incubation, after which they were flooded with 500 ml RO water. Five cedar needles (baits) were floated on the water surface. After two days, the baits were removed by sterile technique and immediately stored thereafter at −20 °C. Total DNA was extracted from the baits (NucleoSpin Plant II kits, Macherey-Nagel) and analysed following the loop-mediated isothermal amplification (LAMP) procedure described by Winkworth et al. (2020) (LightCycler 480 Instrument II, Roche). Positive (DNA from known P. agathidicida isolates) and negative (no P. agathidicida DNA) control samples were included in the run. Results were evaluated based on real-time changes in fluorescence and by gel electrophoresis.
2.4 Quantifying energy fluxes in soil mesofauna food webs
We calculated soil food web energy fluxes according to the food web energetics approach (Barnes et al., 2014, 2018) using the ‘fluxweb’ package in R (Gauzens et al., 2019). This approach combines information on metabolism, assimilation efficiency and trophic interactions, to estimate energy fluxes from resources to consumers, linking sampled communities with multiple ecosystem functions that are carried out across trophic levels (Barnes et al., 2018; Jochum and Eisenhauer, 2022). We calculated energy fluxes to all consumer groups in constructed mesofauna food webs using the formula:
where Fij is the flux of energy from resource i to consumer j, eij is the assimilation efficiency with which consumer j converts energy consumed from resource i to energy used for metabolism and biomass production, Xj is the loss of energy via metabolism of consumer j, and Ljk is the loss of energy from consumer j to its predators k. Metabolic rates were calculated from body masses using the general linear model:
where I is the whole organism metabolic rate, a is the allometric exponent, E is the activation energy (eV), k is the Boltzmann’s constant, T is environmental temperature (Kelvin), and io is a normalisation factor. To maximise accuracy in the estimation of mesofauna metabolic rates, we used group-specific scaling parameters where available (i.e., for Mesostigmata, Oribatida and Prostigmata) (Ehnes et al., 2011). Location-specific temperatures were set at 17.6 °C for Huia, 17.8 °C for Cascades, 17.9 °C for Piha plot 1, and at 18.4 °C for Piha plot 2. These temperatures were obtained from the layer “Mean annual temperature of the warmest quarter” (v1.0) (McCarthy et al., 2021) from the New Zealand Environmental Data Stack (NZEnvDS) on the Land Resource Information Systems (LRIS) data portal (Manaaki Whenua - Landcare Research, 2022). This NZEnvDS was calculated using the source monthly Land Environments of New Zealand (LENZ) temperature layers for the years 1950–1980 (Leathwick et al., 2002). Assimilation efficiencies were set at 0.906 for energy obtained from animals (carnivory), 0.545 for energy obtained from plants (herbivory), 0.158 for energy obtained from detritus (detritivory) (Lang et al., 2017) and 0.50 for energy obtained from microbes (microbivory) (De Ruiter et al., 1993; Wan et al., 2022). After quantifying all energy fluxes among nodes in each mesofauna food web, we aggregated energy fluxes to different trophic levels to determine absolute rates of bactivory, fungivory, detritivory, herbivory, and carnivory. For bactivory, fungivory, detritivory, and herbivory, we summed all outgoing energy fluxes from bacteria, fungi, detritus, and plants, respectively. Likewise, carnivory was calculated by summing all outgoing energy fluxes from mesofauna in the food web.
2.5 Data analysis
To test whether mesofauna communities responded differently to tree type (broadleaf or kauri) or P. agathidicida detection status (P. agathidicida-positive or P. agathidicida-negative), we constructed Linear Mixed-Effects Models (LMMs) where either density (abundance m-2), biomass, or mean body mass of (1) the full mesofauna community, (2) each general mesofauna group (mites, springtails, Symphyla, and pseudoscorpions), (3) each mite taxonomic group (Oribatida, Mesostigmata, Astigmata, Prostigmata), or (4) each trophic group (decomposers, omnivores, predators) were the response variables. Some groups, such as Endeostigmata, Pauropoda, and Protura occurred in numbers too small to be statistically analysed. We also analysed variation in energy fluxes through soil mesofauna food webs, with total food web energy flux, detritivory, bactivory, fungivory, herbivory, and carnivory as response variables each in separate models.
Specifically, for each of the response variables listed above, we constructed a maximal LMM using the function ‘lmer’ from the lme4 package (v1.1-32; Bates et al., 2015). We included tree type (broadleaf or kauri; categorical) as the main predictor variable, as well as its interaction with slope, DBH, forest floor depth, soil CO2 efflux, and the log of the soil C:N ratio. All numeric response variables and predictor variables were mean-centred and scaled to one standard deviation using the function ‘scale’ prior to modelling to allow comparison of effects of predictor variables that were measured on different scales, and location was specified as a random effect to account for the effect of variation among different locations in soil and tree characteristics (predictor variables) on mesofauna density, biomass, mean body mass, and energy flux (response variables). Model formulas are included in the Supplementary Material. Correlations of numeric environmental variables were run to assess collinearity between each pair of predictor variables, the results of which are also included in the Supplementary Material (Supplementary Figure 1). Model assumptions were assessed by inspecting model residuals for normality and homogeneity of variance. On each maximal model, we then used the ‘dredge’ function from the MuMIn package (v1.46.0; Bartoń, 2022) to calculate AICc scores for models based on all possible predictor combinations derived from the maximal model. We selected the model with the combination of predictors that yielded the lowest AICc score as the most parsimonious model to report our findings. When more than one model fell within 2 AICc units of the top-ranked model, we selected the model with the fewest predictors.
Since the canopy health assessment and soil P. agathidicida testing was only performed at kauri, we also created a maximal model with the subset of data collected from kauri, where P. agathidicida detection status (positive or negative; categorical), and the interactions between the P. agathidicida detection status and slope, DBH, forest floor depth, soil CO2 efflux, the log of the soil C:N ratio and the canopy health score were predictor variables. All numeric response variables and predictor variables were centred and scaled using the function ‘scale’ prior to modelling and location was specified as a random effect. We then applied model selection to this maximal model as described above.
Data analyses were conducted in R version 4.1.3 (R Core Team, 2022) using RStudio version 2023.06.1 + 524 (Posit team, 2023).
3 Results
3.1 Impacts of kauri health on soil mesofauna food webs
We found P. agathidicida detection status to have a significant influence on the body mass of omnivorous mesofauna (Estimate = 1.205, SE = 0.238, p < 0.001) (Figure 3), where omnivores were smaller under kauri with P. agathidicida-positive soil. Furthermore, there was a negative interactive effect between soil C:N ratio and P. agathidicida detection status on omnivore mean body mass; Estimate = -1.431, SE = 0.346, p < 0.001), such that increasing levels of soil C:N ratio had a greater negative effect on omnivore body mass under kauri with P. agathidicida-negative soil than under kauri with P. agathidicida-positive soil (Figure 3). Our model also indicated that the effect of P. agathidicida on omnivore body mass was exacerbated by slope steepness, i.e., under kauri with P. agathidicida-positive soil on steep slopes, omnivores were even smaller, whereas under kauri with P. agathidicida-negative soil on steep slopes, omnivores were even bigger (i.e., there was a significant interactive effect between slope and P. agathidicida detection status; Estimate = 0.845, SE = 0.193, p < 0.001) (Figure 3; Supplementary Table 4).
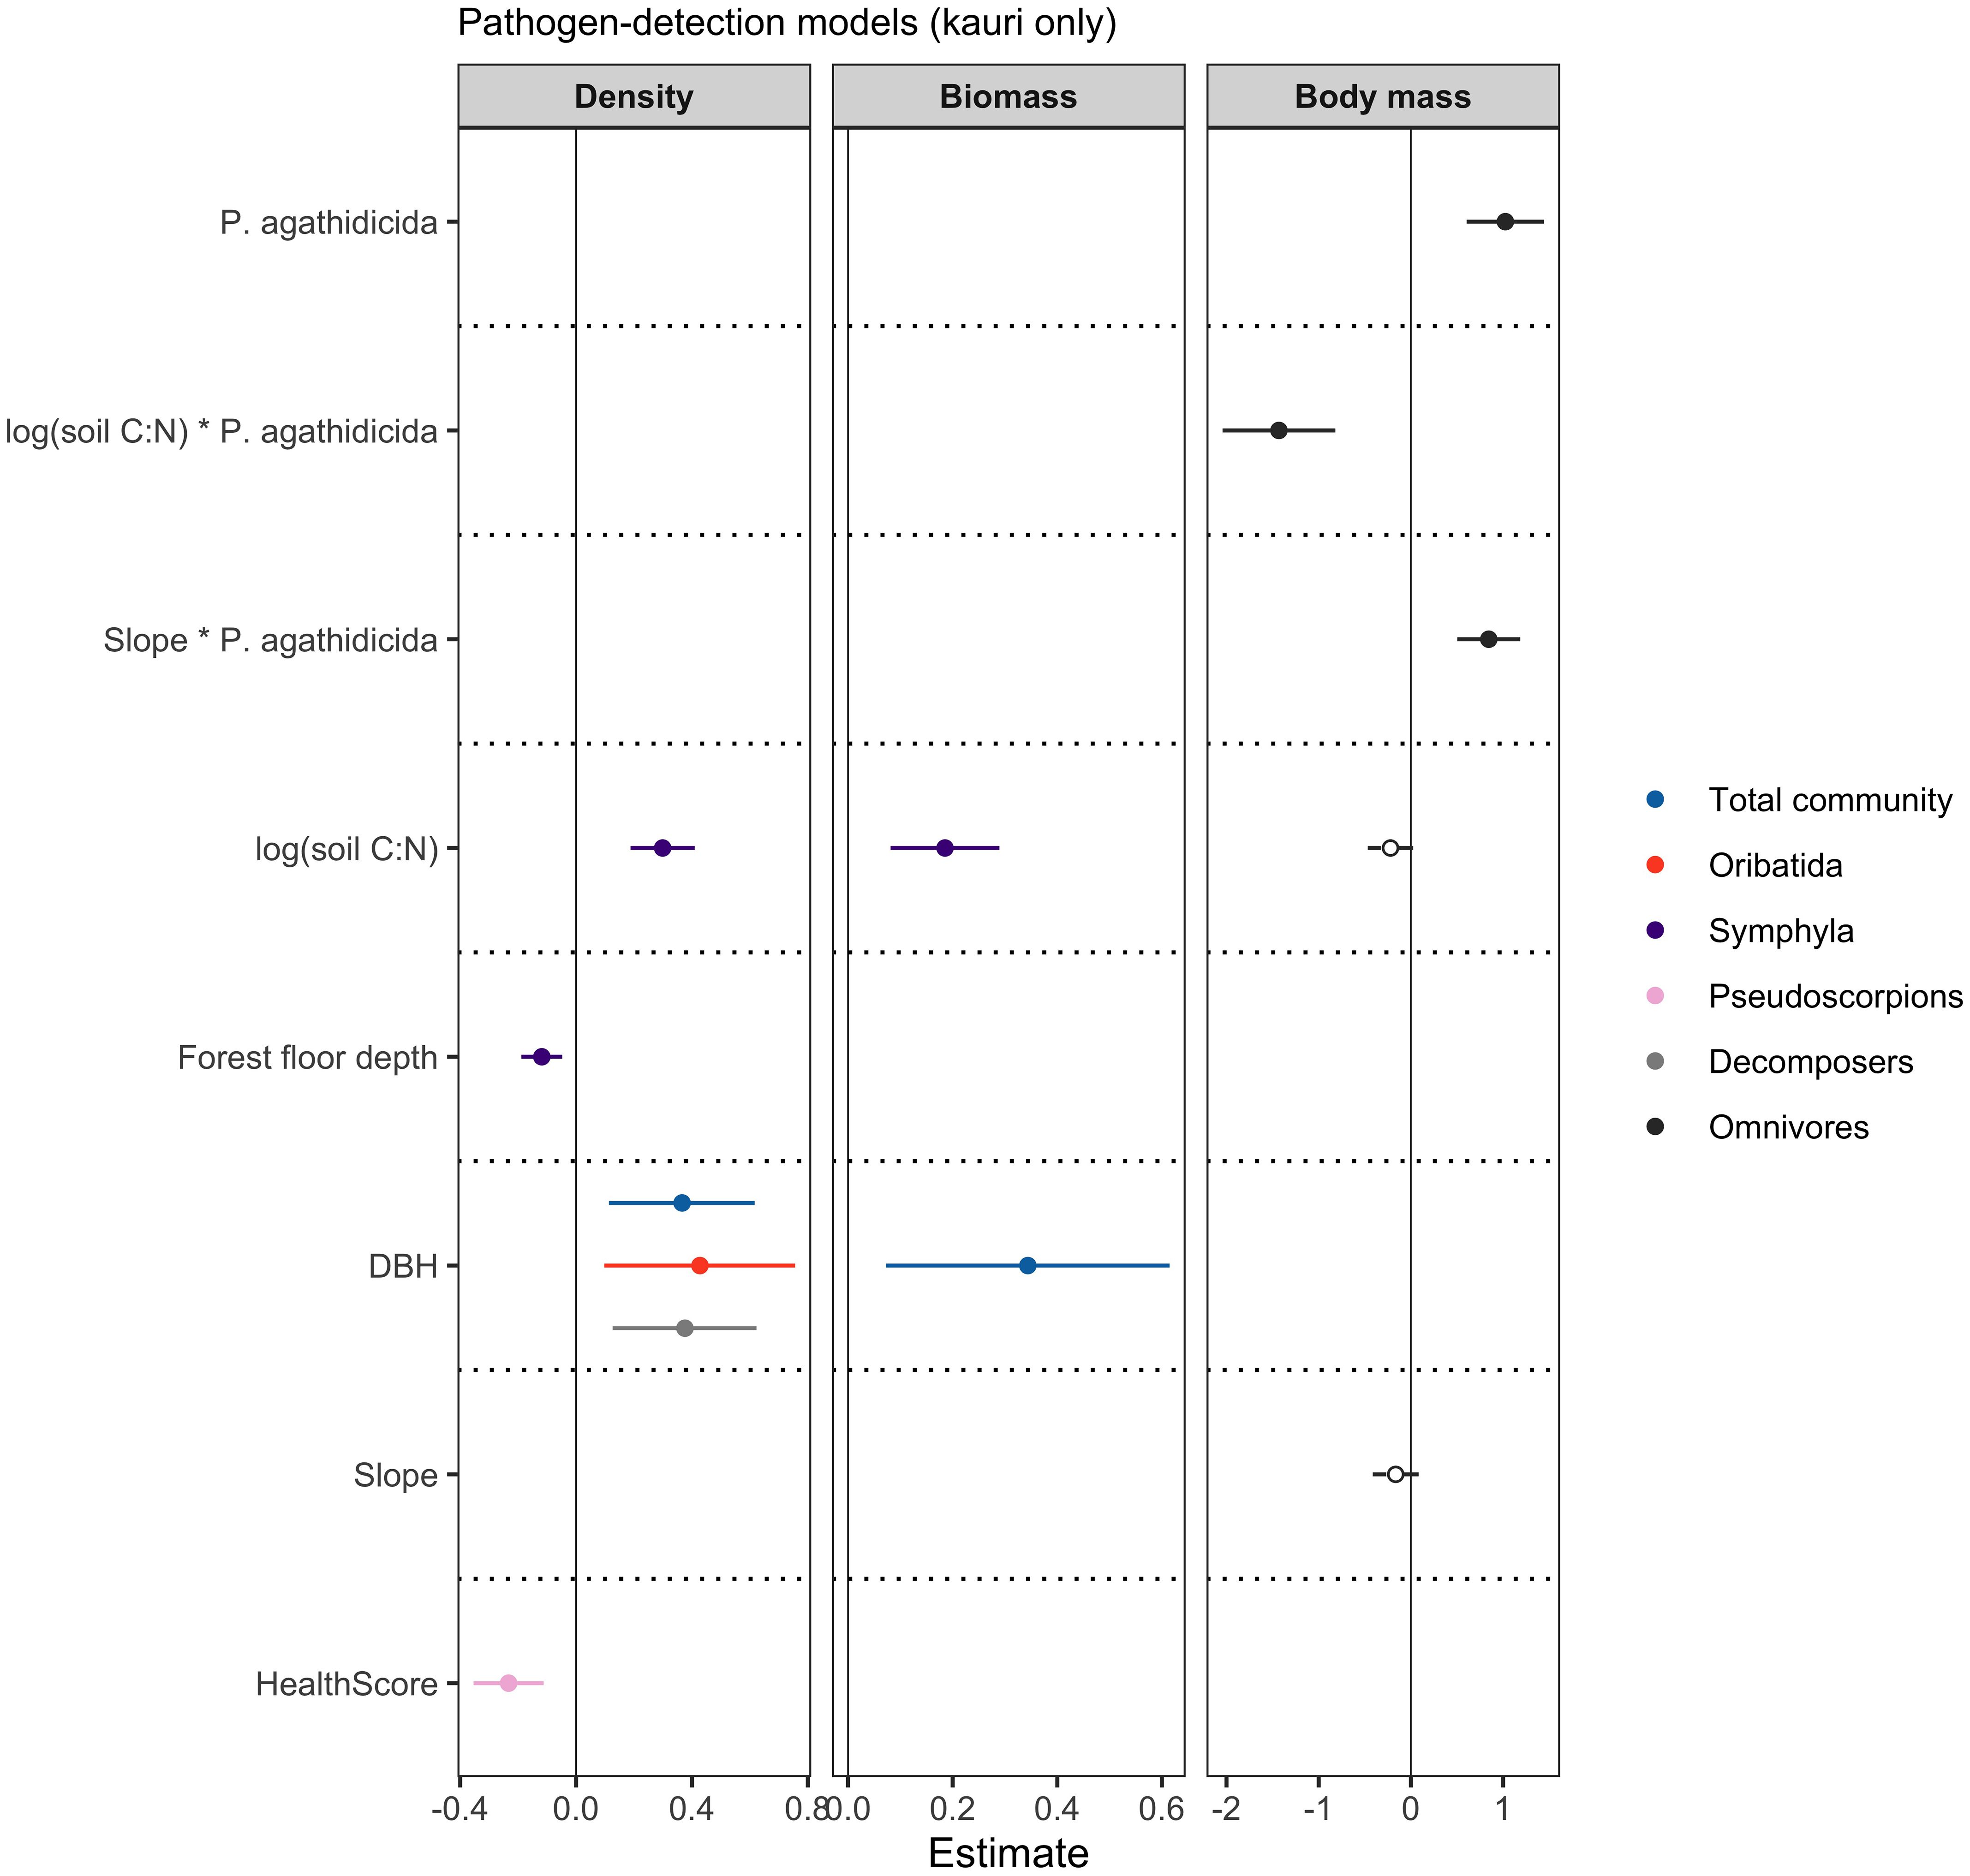
Figure 3 Forest plots showing model estimates and 95% confidence intervals of each of the predictor variables included in the best models, determined by AICc model selection. Response variables of density, biomass and body mass are colour-coded and predictor variables are listed along the left-hand side of the forest plots. The predictor variable P. agathidicida shows the estimate for the not-detected status, compared to the detected status as the reference. Solid lines and data points indicate statistical significance (p < 0.05).
We further observed an influence of canopy health score on pseudoscorpion density, where higher scores (sparser canopies) were associated with lower pseudoscorpion densities (Estimate = -0.233, SE = 0.062, p = 0.001) (Figure 3; Supplementary Table 4).
3.2 The role of kauri in shaping soil mesofauna food webs
Overall, mesofauna communities under kauri tended to be of lower density (abundance m-2), biomass and mean body mass compared to mesofauna communities found under nearby broadleaf trees. We also found that soil C:N ratio, forest floor depth, and tree size (DBH) were major drivers of differences in soil mesofauna communities in these forests.
The density of the total soil mesofauna communities was lower under kauri compared to broadleaf trees (Estimate = -0.990, SE = 0.298, p = 0.002) (Figures 4, 5). Mesofauna density was positively influenced by soil C:N ratio (Estimate = 0.756, SE = 0.208, p < 0.001) and there was a significant negative interaction between tree type and soil C:N ratio (Estimate = -0.863, SE = 0.301, p = 0.007) (Figures 5) due to soil C:N having a positive effect on total mesofauna density at broadleaf trees but a negative effect on total mesofauna density at kauri (Figure 4). The biomass of the total soil mesofauna communities was also lower under kauri compared to broadleaf trees (Estimate = -0.775, SE = 0.362, p = 0.038) and was further positively influenced by forest floor depth (Estimate = 1.069, SE = 0.331, p = 0.002) (Figures 4, 5). There was a significant negative interaction between tree type and forest floor depth on total soil mesofauna biomass (Estimate = -0.775, SE = 0.362, p = 0.038) because forest floor depth had a more positive effect on total mesofauna biomass at broadleaf trees than at kauri (Figure 4).
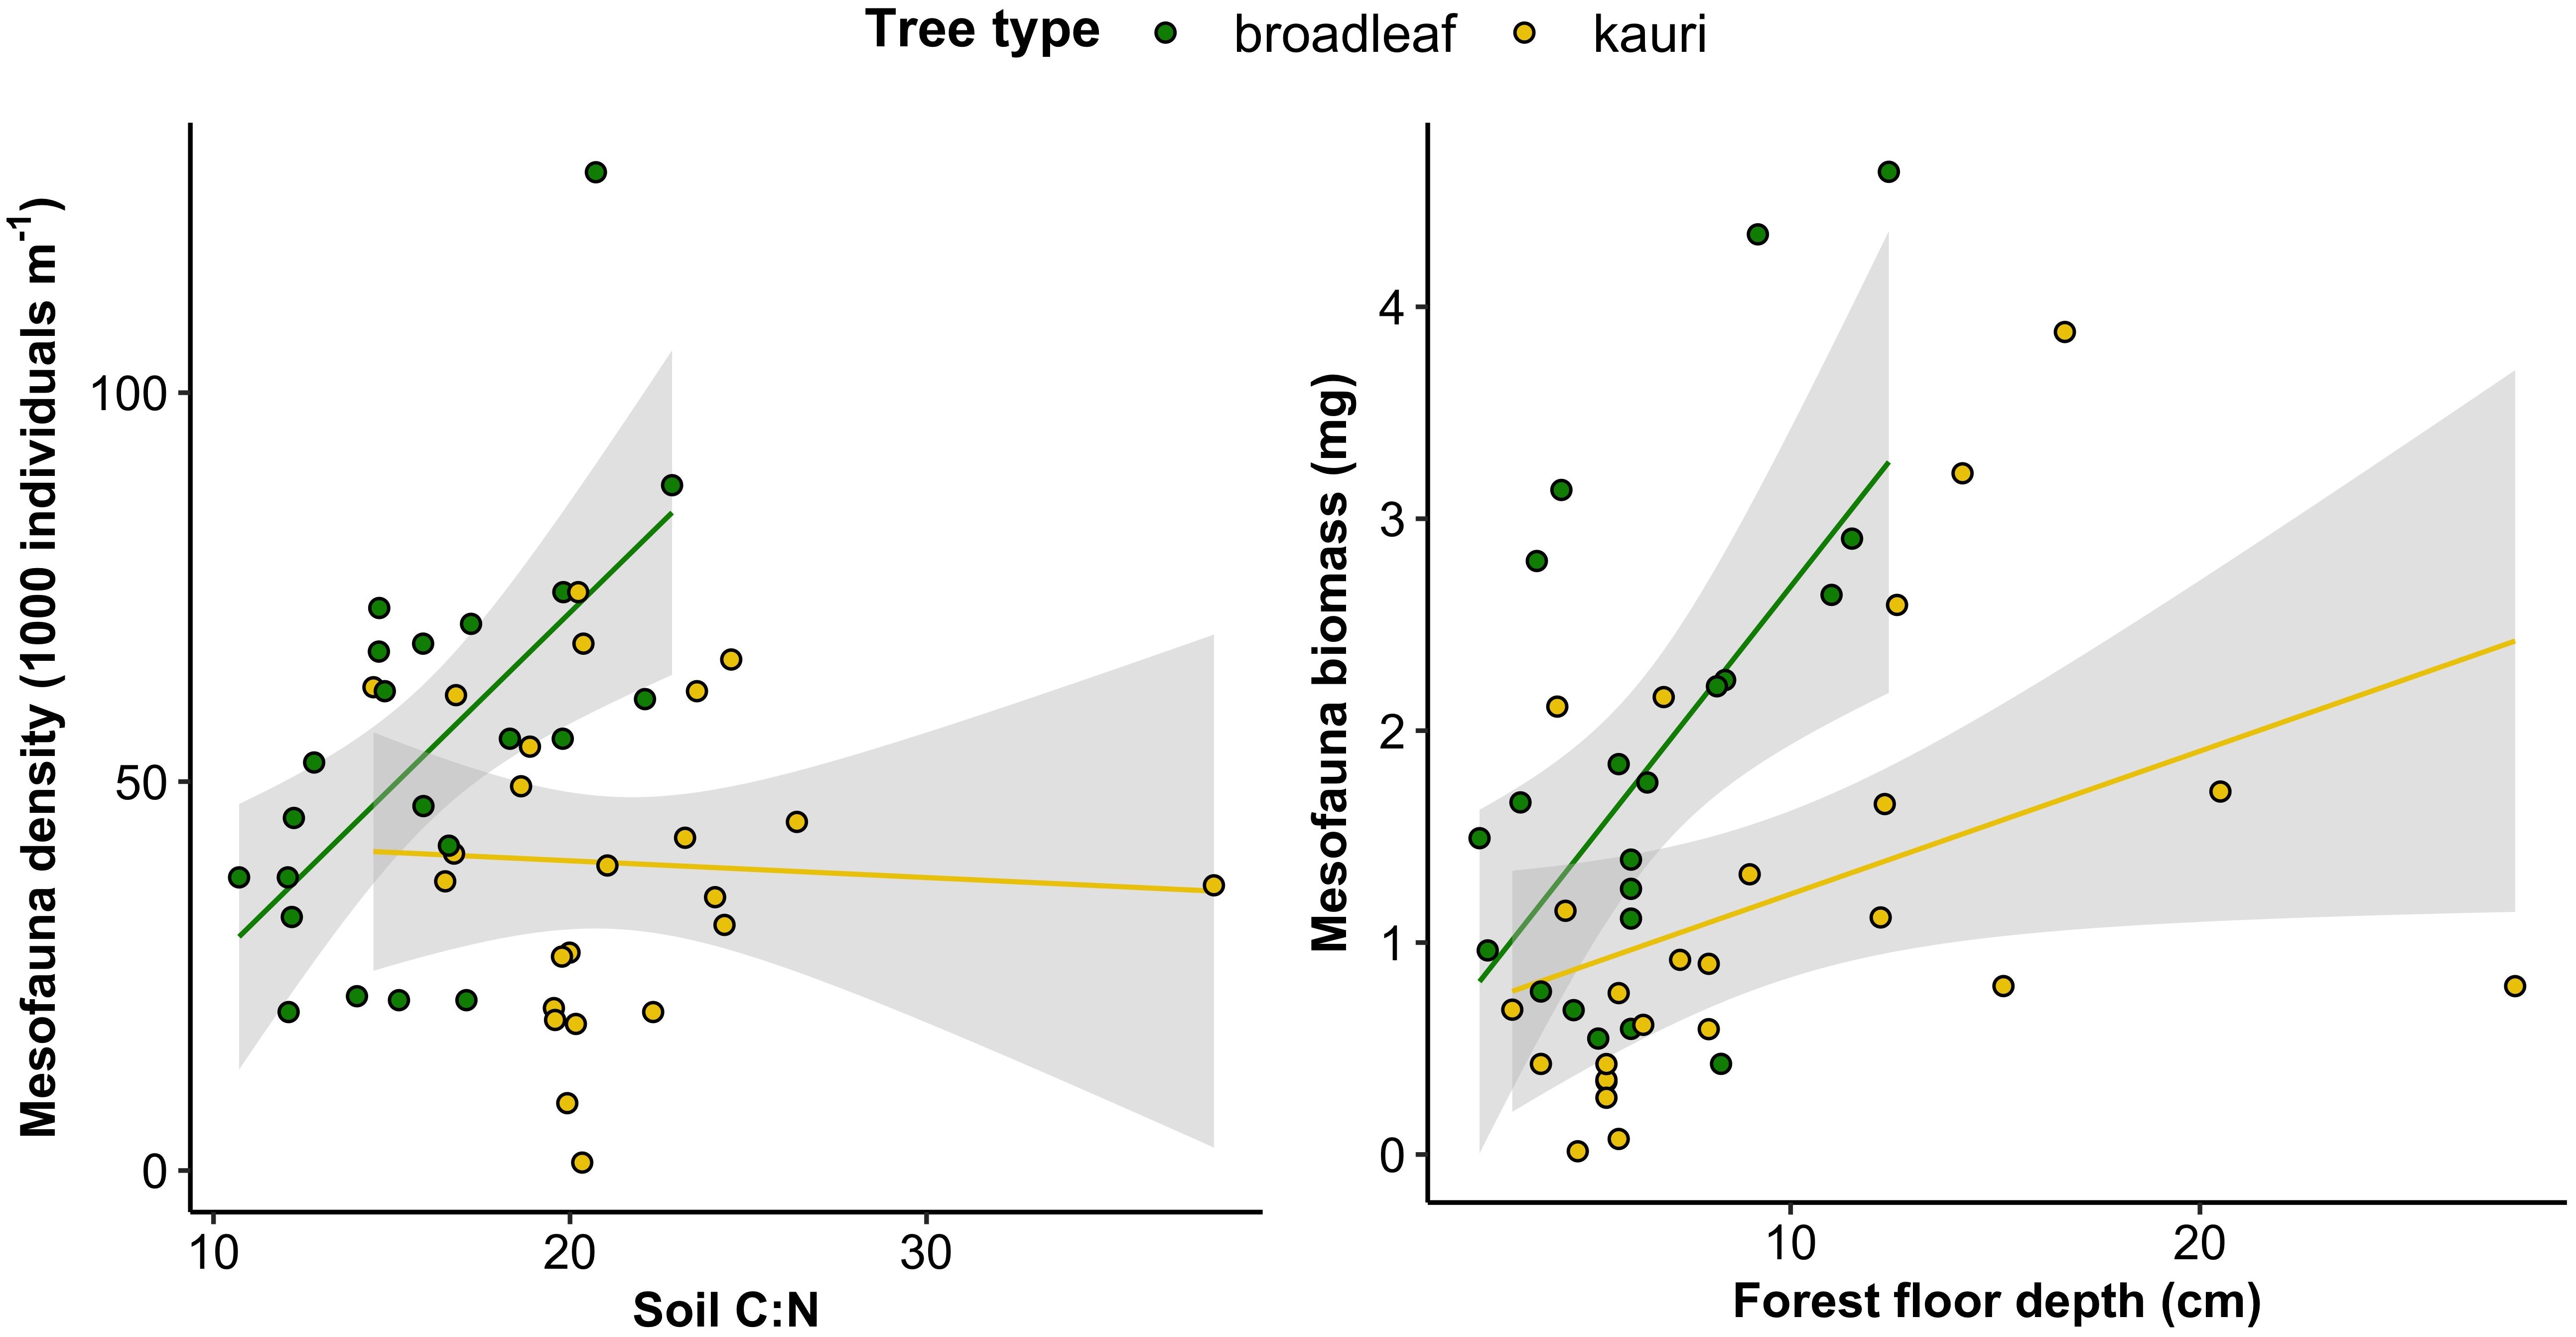
Figure 4 Relationships between density of the total mesofauna community and soil C:N ratio at the different tree types (left) and between biomass of the total mesofauna community and forest floor depth at the different tree types (right).
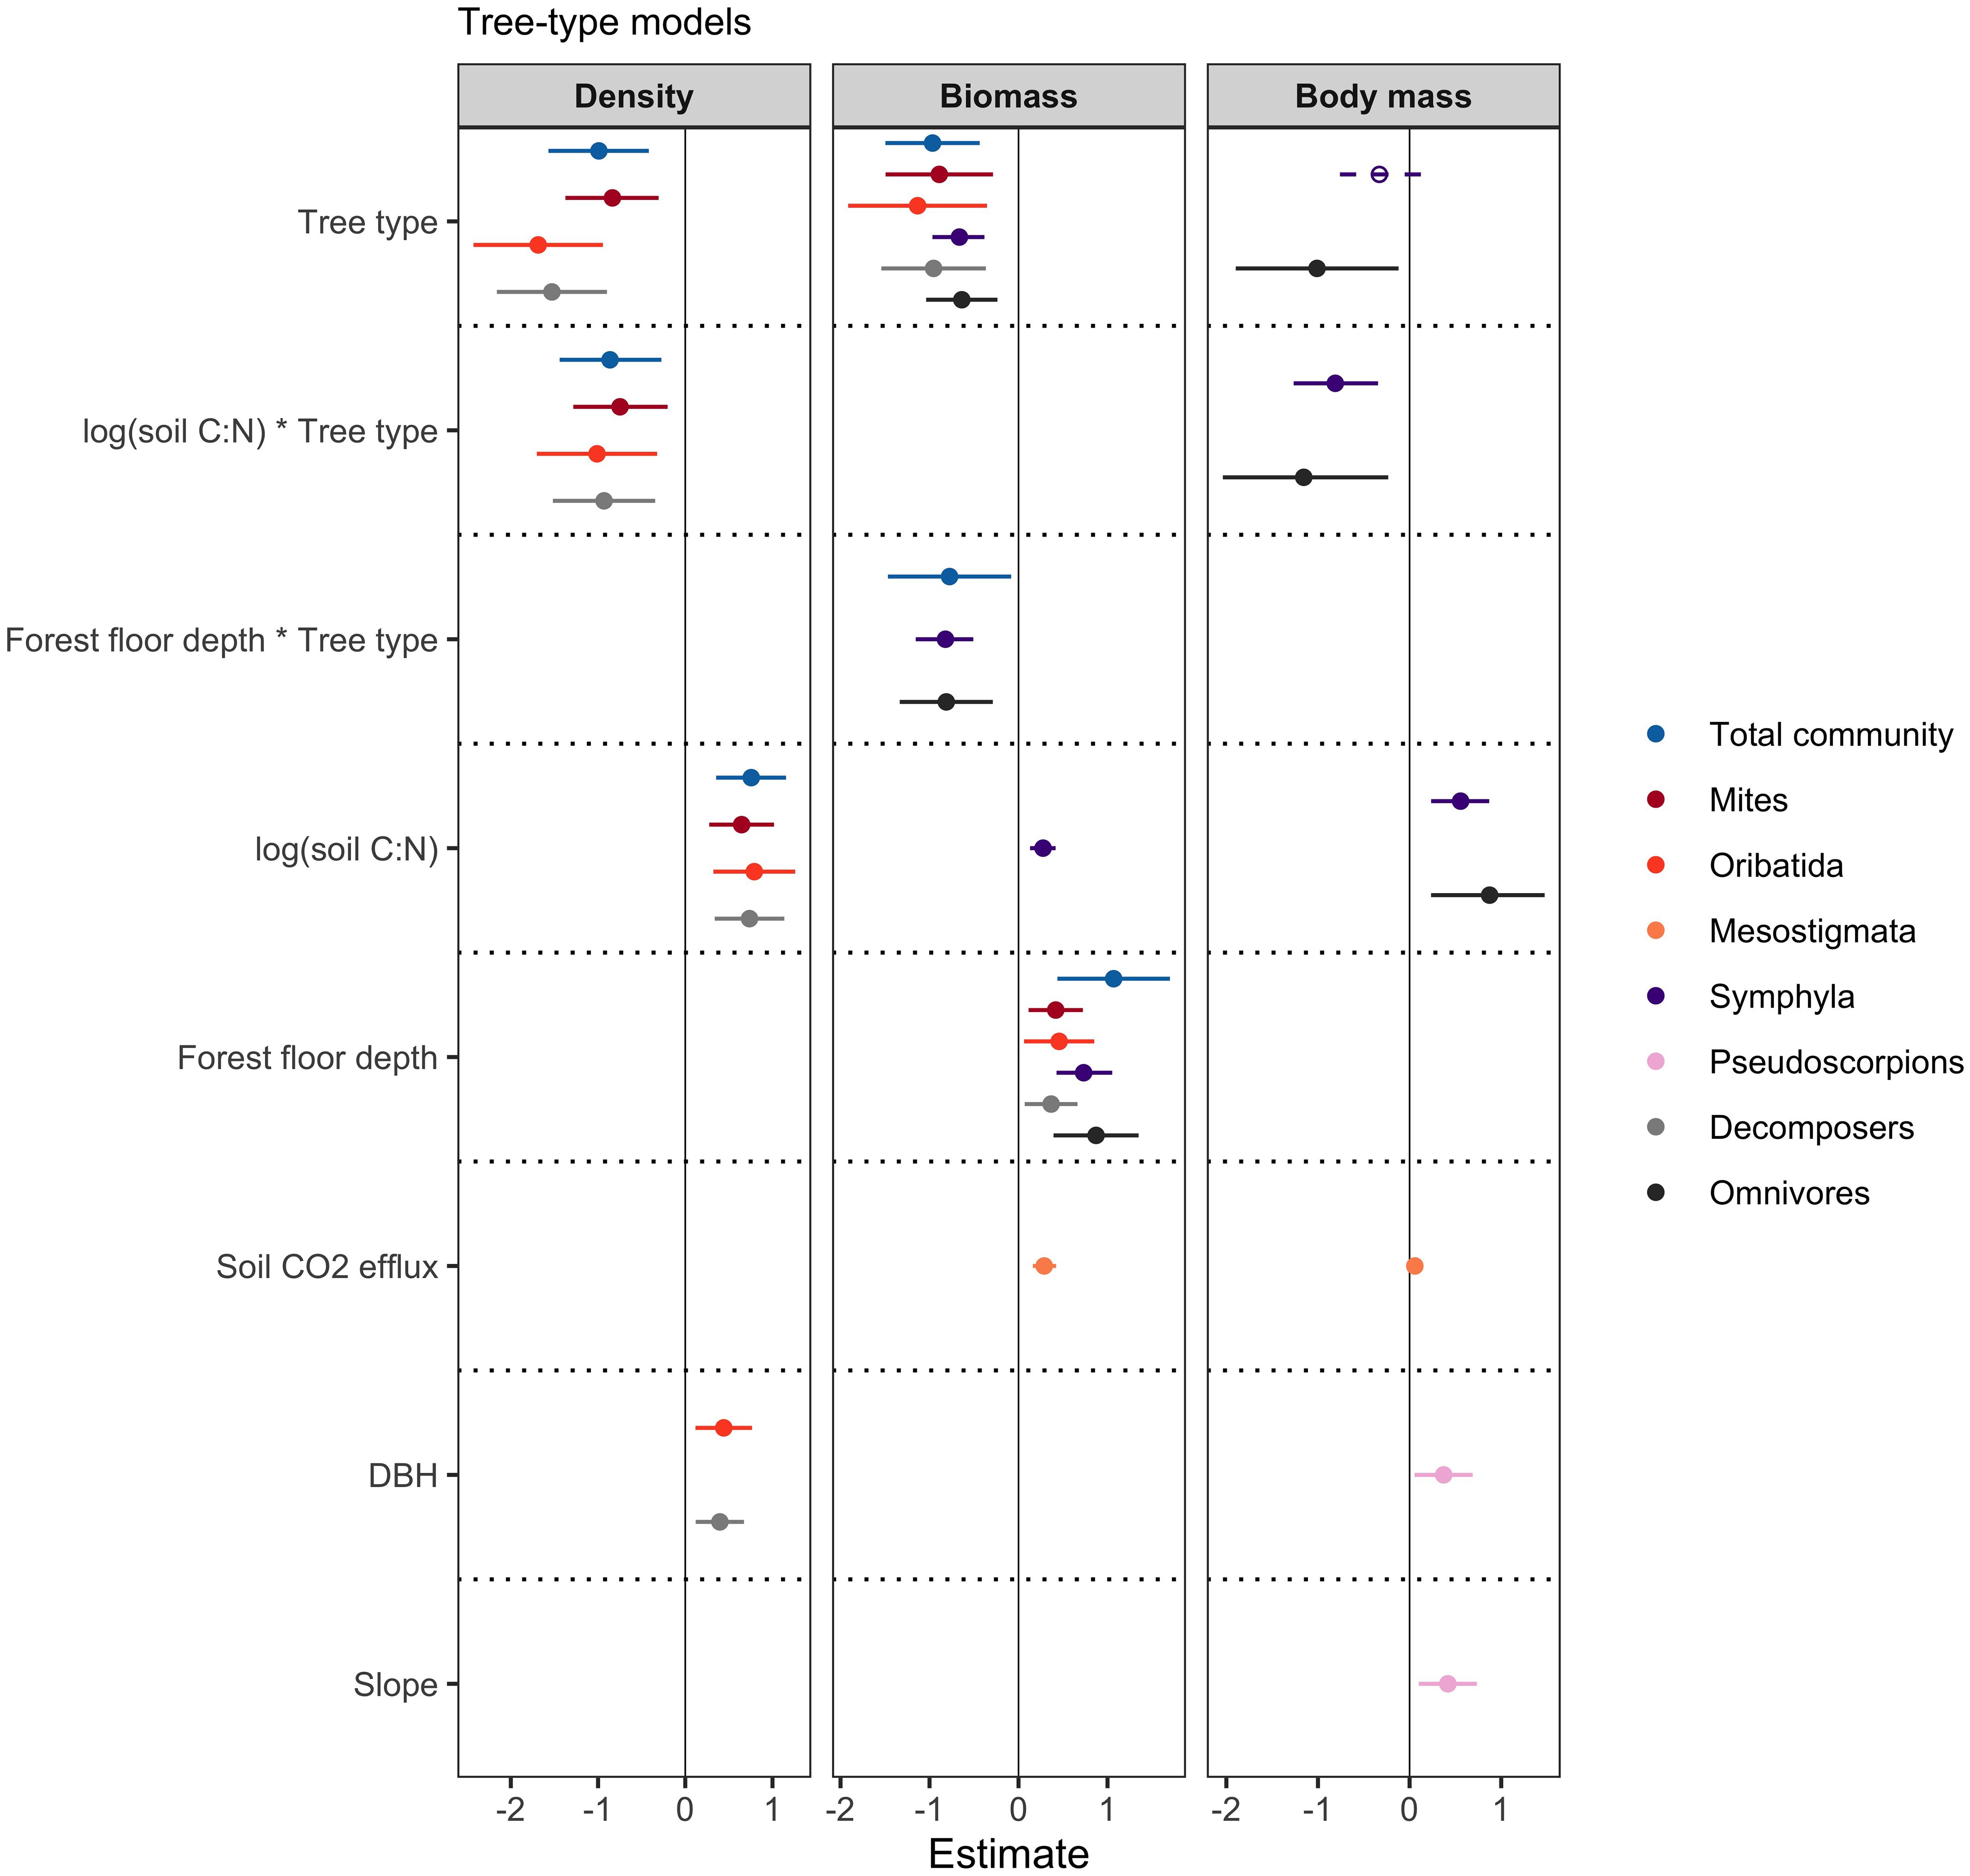
Figure 5 Forest plots showing model estimates and 95% confidence intervals of each of the predictor variables included in the best models, determined by AICc model selection. Response variables of density, biomass and body mass are colour-coded and predictor variables are listed along the left-hand side of the forest plots. The predictor variable tree type shows the estimate for kauri, compared to broadleaf as the reference. Solid lines and data points indicate statistical significance (p < 0.05).
Mites were the mesofauna group in our sampled communities within kauri forests that were most consistently influenced by the predictor variables in the tree-type models. Total mite density and biomass were both lower under kauri compared to broadleaf trees (Estimate = -0.835, SE = 0.276, p = 0.004, and Estimate = -0.890, SE = 0.312, p = 0.007, respectively) (Figure 5). Mite density increased with soil C:N ratio (Estimate = 0.756, SE = 0.208, p < 0.001), and mite biomass increased with forest floor depth (Estimate = 1.069, SE = 0.331, p = 0.002) (Figure 5).
There were different responses of the various mite taxa to the suite of environmental variables that we measured. Oribatida, which were the most abundant taxonomic group of mites in our samples (Figure 6), were found at greater densities at trees with greater DBH (Estimate = 0.441, SE = 0.172, p = 0.014) and with higher soil C:N ratios (Estimate = 0.791, SE = 0.248, p = 0.003) (Figure 5). The biomass of Oribatida was only significantly influenced by forest floor depth, having higher biomass values at trees with deeper forest floors (Estimate = 0.456, SE = 0.204, p = 0.030) (Figure 5). Mesostigmata biomass and body mass, on the other hand, increased in soils with higher soil CO2 efflux rates (Estimate = 0.288, SE = 0.67, p < 0.001, and Estimate = 0.057, SE = 0.017, p = 0.007, respectively) (Figure 5). Our models did not detect any significant effects of measured environmental variables on Prostigmata or Astigmata communities.
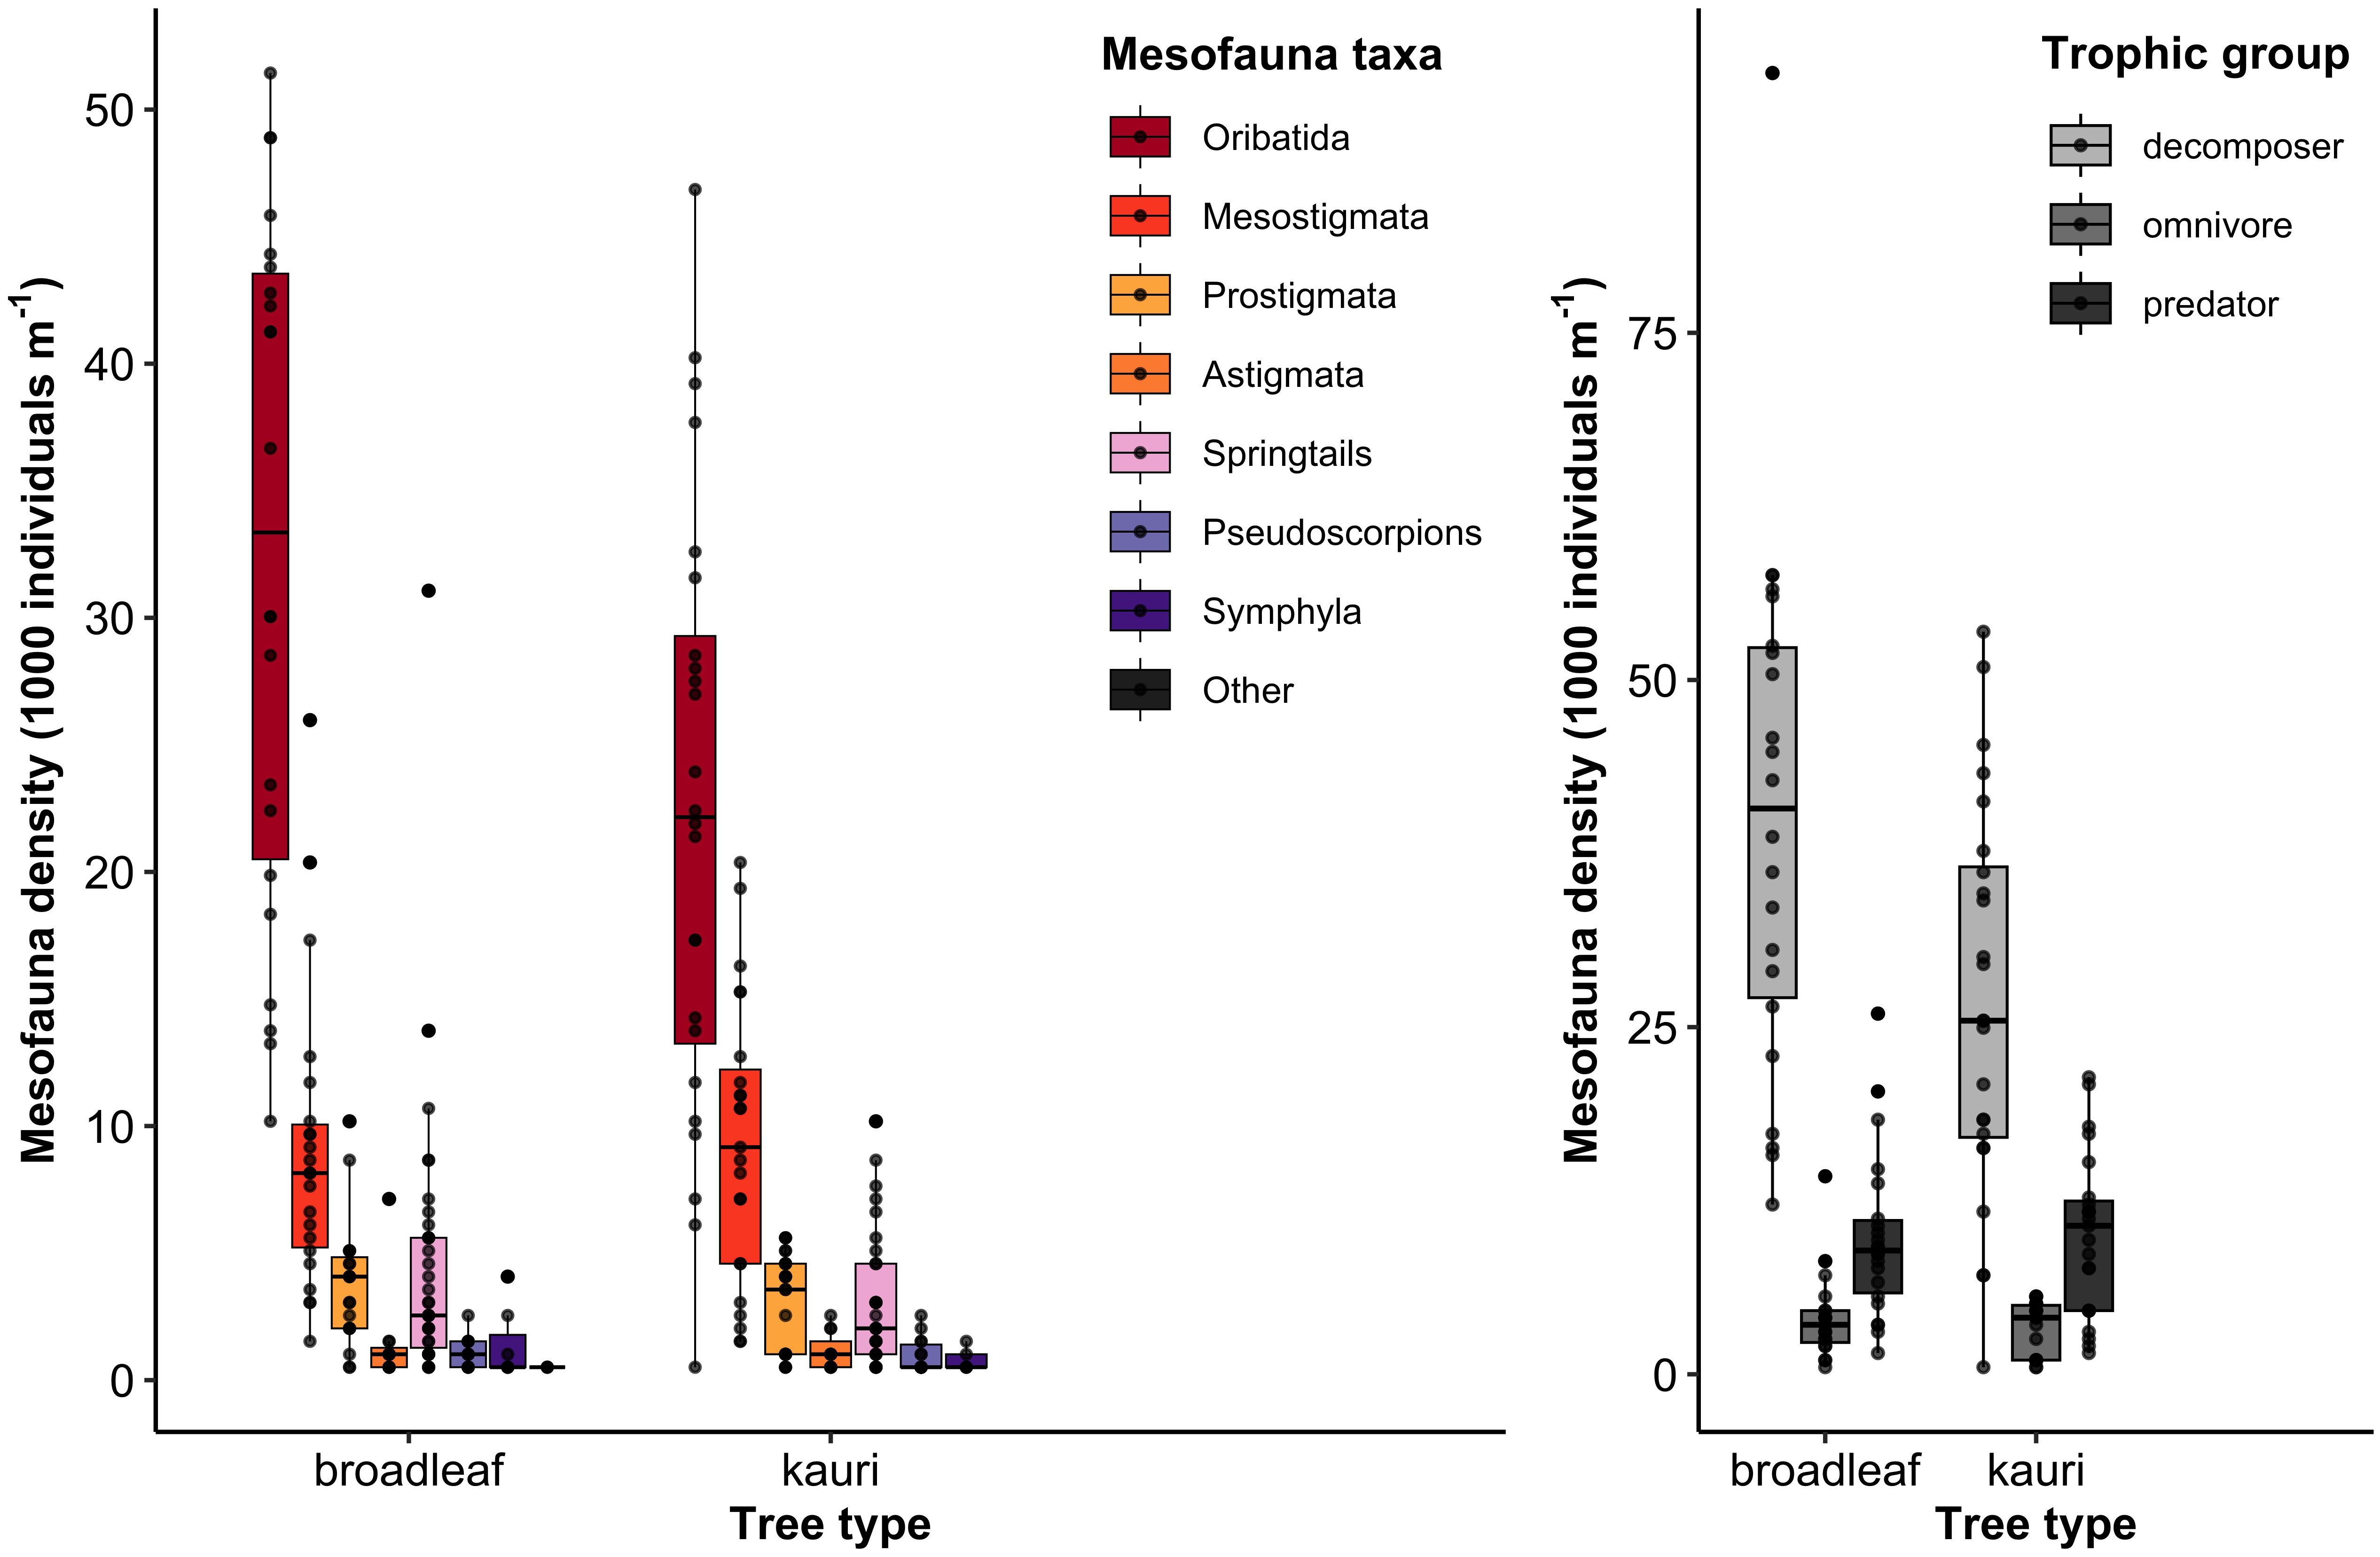
Figure 6 Mesofauna community structures at each tree type in terms of taxonomic groups (left) and trophic groups (right). Midline of each boxplot represents the median; lower and upper hinges correspond to the 25th and 75th percentiles; black dots represent individual datapoints.
Springtail communities followed similar trends to most of the mesofauna taxa, with lower densities under kauri compared to broadleaf trees, and generally increasing in density with soil C:N ratio, forest floor depth, and tree size. However, we found that the influence of none of the environmental variables was significant on springtail density, biomass or body mass.
Symphyla community biomass and mean body mass both responded to several environmental variables. Symphyla biomass and body mass were positively influenced by soil C:N ratio (Estimate = 0.276, SE = 0.0767, p < 0.001, and Estimate = 0.557, SE = 0.164, p = 0.002, respectively), and Symphyla biomass was also positively influenced by forest floor depth (Estimate = 0.732, SE = 0.162, p < 0.001) (Figure 5). We did not detect any significant shifts in community density.
Pseudoscorpion communities were only affected in terms of their mean body mass. They had higher mean body mass at larger kauri or broadleaf trees (Estimate = 0.372, SE = 0.164, p = 0.028) and at locations with steeper slopes (Estimate = 0.418, SE = 0.164, p = 0.014) (Figure 5).
We also classified mesofauna by the trophic groups decomposers, omnivores, and predators (Table 1) to account for potential similarities in faunal responses based on their functional roles in soil food webs. Both decomposers and omnivores exhibited a range of significant responses to both tree type and the suite of environmental variables, but predators were not affected by any of the predictor variables in our models. Decomposer density was lower under kauri (Estimate = -1.529, SE = 0.334, p < 0.001), and increased with soil C:N ratio (Estimate = 0.737, SE = 0.211, p = 0.001) and tree size (Estimate = 0.397, SE = 0.146, p = 0.010) (Figure 5). Decomposer biomass was also lower under kauri (Estimate = -0.954, SE = 0.304, p = 0.003), and was positively influenced by forest floor depth (Estimate = 0.366, SE = 0.153, p = 0.021) (Figure 5). Omnivore mean body mass was lower under kauri (Estimate = -1.010, SE = 0.459, p = 0.034), and was positively influenced by soil C:N ratio (Estimate = 0.873, SE = 0.319, p = 0.009) (Figure 5).
3.3 Mesofauna energy flux
Despite the aforementioned effects of declining kauri health on soil mesofauna density and body mass (section 3.1), we did not find any effects of P. agathidicida detection status or canopy health score on soil mesofauna energy fluxes (Figure 7; Supplementary Table 5). We found that total energy flux, as well as fluxes to detritivores, bacterivores, fungivores, and carnivores, were all positively influenced by the size (DBH) of focal kauri, but this was unrelated to P. agathidicida detection status.
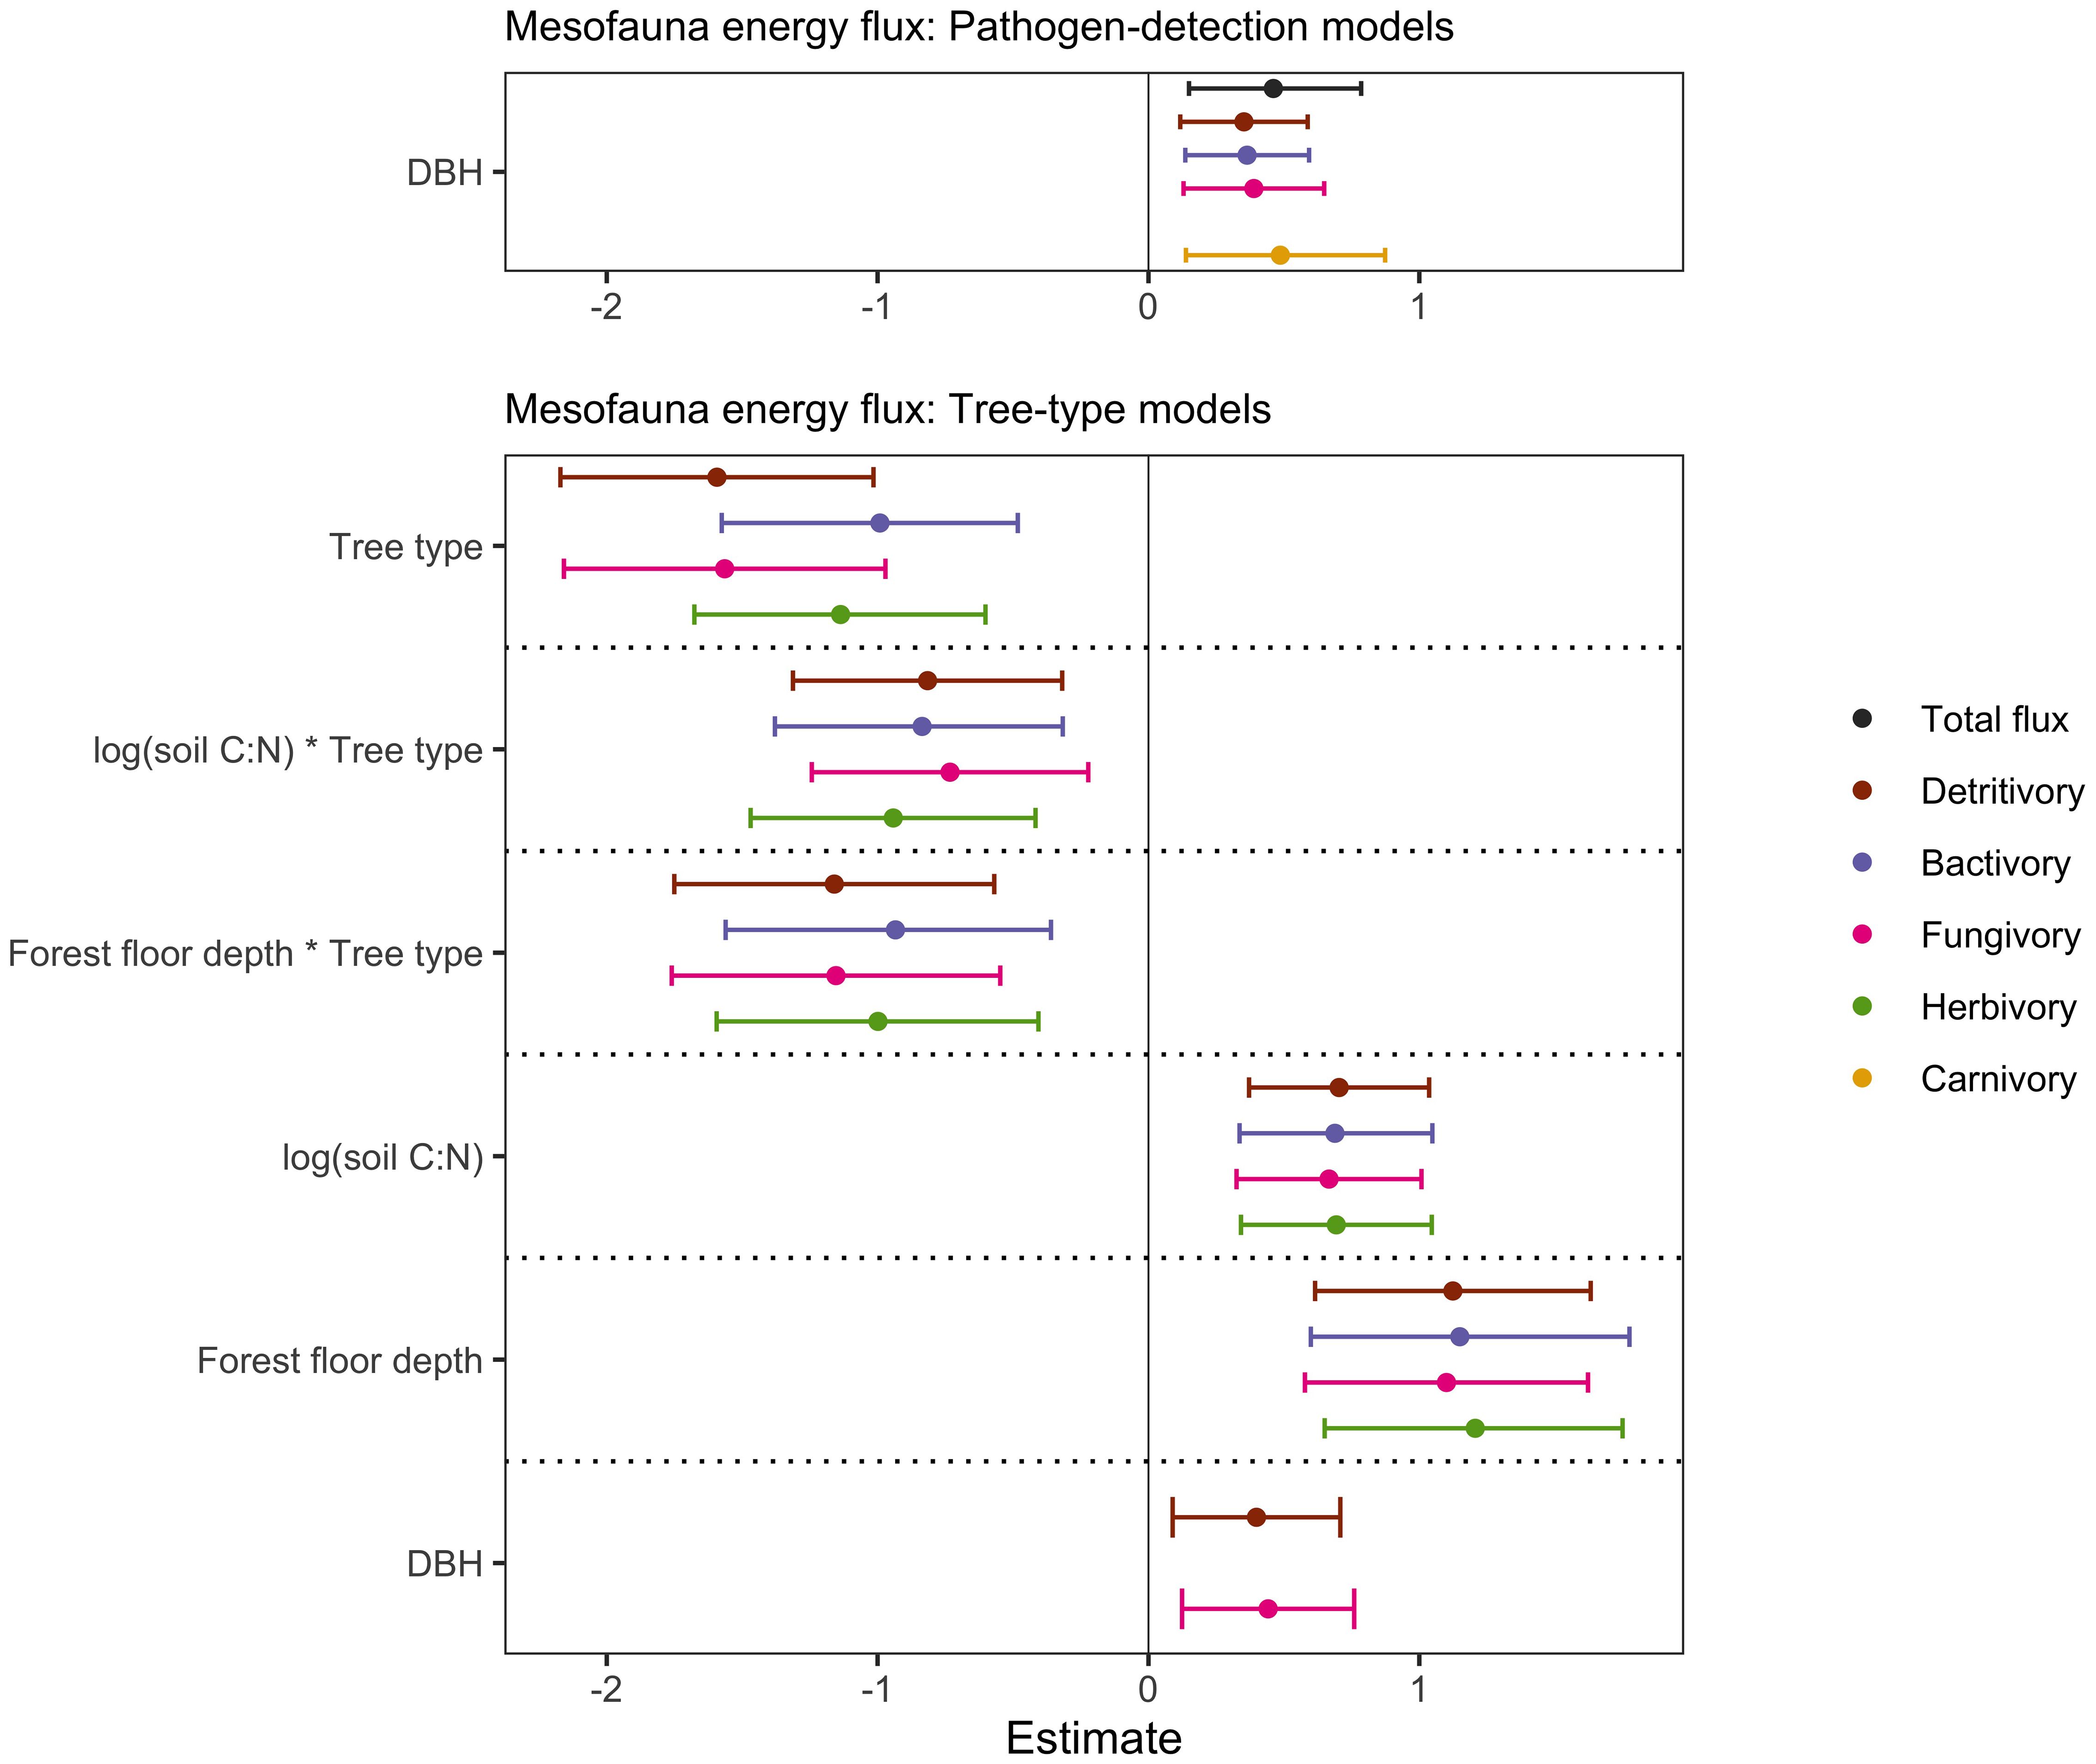
Figure 7 Forest plots showing model estimates and 95% confidence intervals of each of the predictor variables included in the best models, determined by AICc model selection. Response variables of mesofauna energy flux are colour-coded and predictor variables are listed along the left-hand side of the forest plots. The predictor variable tree type shows the estimate for kauri, compared to broadleaf as the reference. Solid lines and data points indicate statistical significance (p < 0.05).
Our tree-type models suggest that the food webs in soils under kauri tended to have lower energy fluxes to fungivores, detritivores, bacterivores, and herbivores compared to soils under broadleaf trees. Furthermore, energy fluxes to fungivores and detritivores were positively influenced by DBH, forest floor depth, and soil C:N ratio, while energy fluxes to herbivores and bacterivores were positively influenced by forest floor depth and soil C:N ratio (Figure 7; Supplementary Table 7). Negative effects of the interaction between forest floor depth and tree type, and of the interaction between soil C:N ratio and tree type on energy fluxes to fungivore, detritivores, bacterivores and herbivores suggest that the negative effect of kauri soil on these energy fluxes was slightly dampened in soils with lower C:N ratio and/or shallower forest floor depths (Figure 7; Supplementary Table 7). Our suite of tree and environmental variables did not have significant effects on total mesofauna energy flux or carnivory.
4 Discussion
4.1 Impact of kauri health on the soil food web
We measured effect sizes of kauri health (P. agathidicida detection status and canopy health score), alongside a suite of tree and environmental variables, on soil mesofauna community density, biomass, mean body mass, and energy flux. Contrary to our expectation, most aspects of the mesofauna community attributes that we measured were unaffected by P. agathidicida presence and ill canopy health scores. However, we did observe (1) that the P. agathidicida detection status had a significant influence on the mean body mass of omnivorous soil mesofauna, which were significantly smaller at kauri with P. agathidicida-positive soil; and (2) that the canopy health score had a significant influence on pseudoscorpion density, where a higher canopy health score (higher scores correspond to less healthy trees with sparser canopies) related to the presence of fewer pseudoscorpions. This might be a first indication that, as kauri dieback progresses, we can expect impacts on an increasing number of soil faunal functional groups, which could have important implications for the functions that they provide. Nevertheless, we did not find any significant responses of mesofauna energy fluxes to varying kauri health.
The impact of P. agathidicida detection status on omnivore mean body mass could be related to impacts of the pathogen on their main food source(s). Omnivorous soil mesofauna included all Symphyla and some of the Prostigmata taxa (see Table 1). Symphyla alone were not significantly affected by P. agathidicida detection status, so omnivorous Prostigmata, must be at least partly responsible for the pathogen effect we observed on omnivore body mass. Although evidence exists of Prostigmata in forest soils occupying a trophic niche between Oribatida and Mesostigmata (Crotty et al., 2014), their feeding preferences remain largely unknown (Potapov et al., 2022). Smaller omnivores at kauri with P. agathidicida-positive soil may be linked to lower fine root biomass at those trees (Yang, 2022), because analysis of global soil fauna data has shown a positive correlation between omnivore biomass and fine root biomass (Heděnec et al., 2022). Future research could investigate resource use of omnivorous mesofauna in kauri forests to determine their feeding preference for roots and mycorrhizal fungi (e.g., by stable isotope analysis), which could provide insight into their dependence on healthy roots.
Since pseudoscorpions are predators (Harvey, 1988), the impact of canopy health on pseudoscorpion density could be related to how canopy cover can influence habitat suitability for pseudoscorpions themselves and/or their prey. Pseudoscorpion density has been found to correlate positively with vegetation cover, with absence of pseudoscorpions when vegetation cover is insufficient (Yamamoto et al., 2001). This can be attributed to a preference by most pseudoscorpions for high levels of moisture (Weygoldt, 1969, cited in Yamamoto et al., 2001). Lower canopy cover at kauri with more severe dieback symptoms (higher canopy health scores) will let in more light and solar radiation, increasing soil surface temperature, and decreasing soil moisture. Another reason that reduced canopy cover may be limiting pseudoscorpion density may be related to availability of prey. The diet of pseudoscorpions mostly consists of small invertebrates species including springtails and mites (Harvey, 1988). Indeed, the pseudoscorpion density in our study correlated positively and significantly with mite density (Pearson’s r = 0.29, p < 0.05). Microarthropods are generally known to be sensitive to desiccation, even to short-term drought (Edney, 1977; Frampton et al., 2000), and it has been suggested that microarthropod abundance is related to soil pore volume (Nielsen et al., 2008). With greater sun exposure under less canopy cover, availability of pore spaces with sufficient moisture may have been low, causing microinvertebrates to retreat deeper into the soil and into smaller pores. As one of the larger mesofauna species, pseudoscorpions might struggle to access spaces that mites and springtails retreat into during dryer conditions, thereby reducing food availability for pseudoscorpions.
4.2 Impact of soil and tree characteristics at focal kauri
Favourable soil conditions at large kauri might be responsible for higher densities of mesofauna belonging to lower trophic groups. At our focal kauri, we found that total energy flux and fluxes to detritivores, bacterivores, and fungivores were higher at larger kauri, and that soil mesofauna groups that relied primarily on basal resources (total mesofauna community, Oribatida, decomposers) were present at higher densities and received higher energy fluxes at larger kauri (higher DBH). Oribatida are mainly decomposer species and were the most abundant species contributing significantly to total mesofauna abundance. Presumably, larger kauri produced more leaf litter, root litter and root exudates, providing more basal resources for a more productive and energy-rich soil food web. Meanwhile, larger kauri likely exert greater influence on the soil physicochemical properties, meaning more acidic soils with deeper organic layers. Indeed, we found positive correlations between DBH and forest floor depth, and between DBH and soil total C concentration (Supplementary Figure 1). Correlation of kauri DBH measurements with soil pH data from another dataset collected at the same focal trees (Yang, 2022) indicates that soils under larger kauri had lower pH values (Pearson’s r = -0.45, p = 0.03). Low forest soil pH values are mainly caused by higher inputs of organic acids and replacement of hydrogen ions by cationic soil nutrients (e.g., potassium and calcium) on soil particle cation exchange sites. Soil microarthropods have widely varying soil pH preferences (van Straalen and Verhoef, 1997) and there might be species-specific trade-offs between availability of basal food sources, microbial biomass (Chen et al., 2015), and soil porosity at different soil pH values that may make the soil habitat more or less favourable for soil mesofauna. Therefore, kauri tree size likely influences soil mesofauna community composition by affecting food availability and habitat suitability.
Predatory and omnivorous mesofauna groups seemed to have different responses, which might be due to them being mostly affected by changes in prey availability and less so by habitat characteristics (vegetation composition and soil properties) (Nielsen et al., 2010). While we observed higher energy fluxes to carnivores at larger kauri—possibly because soil at larger kauri contained more decomposer species, i.e., prey items—the density, biomass and body mass of predatory mesofauna did not seem to be influenced by kauri soil or tree variables. Symphyla (omnivores) density, on the other hand, was higher at kauri with higher soil C:N ratio, which was not significantly related to kauri DBH (data not shown). Future research might improve our understand of the feeding and habitat preferences of predatory mesofauna in kauri forests and how these groups might respond to further disturbance ensued from kauri dieback.
4.3 Role of kauri in shaping unique soil food webs, compared to nearby broadleaf trees
We measured effect sizes of tree type (kauri or broadleaf), alongside a suite of tree and environmental variables, on soil mesofauna community structure (density, biomass, mean body mass) and function (energy flux) to test the hypothesis that kauri harbour distinctly different soil food webs due to the soil biogeochemical environments they generate. We found that mesofauna density, biomass, mean body mass and energy flux differed significantly between kauri and broadleaf trees for many trophic and taxonomic levels (Figure 5), particularly Oribatida, and the direction of the effects consistently indicated that mesofauna at kauri were generally scarcer, lighter and smaller. The tree-type effect on mesofauna density was often observed in combination with influences of soil C:N ratio, and the tree type effect on mesofauna biomass was often observed in combination with influences of forest floor depth. Predatory and omnivorous mesofauna tended to respond differently, if at all, to tree type and to soil and tree characteristics. Overall, our data suggest that a decreased dominance of kauri in these ecosystems due to P. agathidicida infection could have significant consequences on the soil food web structure and ecosystem functioning.
Because density and biomass of mesofauna were lower at kauri compared to broadleaf trees, a reduction in kauri dominance and replacement by other trees might not lead to a long-term loss of mesofauna in terms of the broad mesofauna categories considered in our study. However, the categories used in our analyses did not capture the role of kauri soil for mesofauna at a species level, which might be additional cause for conservation of this foundation tree species. For instance, there are indications that kauri litter is abundant in native invertebrate species, compared to kānuka litter, and may contain fewer individuals of introduced moth and millipede species (Tomlinson, 2007). Moreover, we also observed that forest floor depth attenuated negative effects of kauri soil on mesofauna density and biomass. In fact, kauri with deep forest floors, which are typical of larger kauri, approached soil mesofauna density and biomass levels similar to those in broadleaf soils. A loss of large kauri from these forests may therefore constitute a loss of kauri soil characteristics that are more favourable for soil mesofauna.
The high densities of Oribatida relative to other taxa in our study were to be expected, because Oribatida are typically the most abundant mesofauna group in forest soils (Wallwork, 1983). The Oribatida densities in our study were relatively low compared to studies in other coniferous forests, e.g., ca. 200,000-plus individuals per m2 (Wallwork, 1983) or ca. 60,000-110,000 individuals per m2 (Bluhm et al., 2016). This might be due to the timing of our sampling, which took place in the summer when the soil was drier (Edney, 1977; Frampton et al., 2000). In addition, forests of Auckland are in a subtropical region (Chappell, 2013), while most studies on Oribatida densities are performed in boreal and temperate forest soils, which generally contain more soil fauna than tropical forest soils (Heděnec et al., 2022). Disturbance caused by P. agathidicida might also play a role. Oribatida are deemed to be sensitive to soil disturbance or unfavourable soil conditions (Norton and Palmer, 1991; Maraun et al., 2003; Rola et al., 2017). Spread of the pathogen in our forests plots may already have led to a decreasing kauri dominance and increasing dominance of broadleaf tree species. Broadleaf forest soils tend to harbour lower Oribatida densities, e.g., ca. 40,000 m-2 in a beech forest (Maraun et al., 2003) or ca. 55,000 m-2 in a deciduous hardwood forest (Wallwork, 1983). Therefore, to better understand beyond-the-host ecosystem impacts of tree pathogens, it is important to collect baseline information and perform periodic monitoring to observe shifts in community structure and function over time as the effects of the pathogen progress.
Predatory mesofauna groups were represented by pseudoscorpions and Mesostigmata (our samples did not contain sufficient Halacaroidea and Labidostammatides individuals for statistical analysis, although their feeding preferences contributed to energy flux calculations). Mesostigmata are described as opportunistic predators that feed on microfauna and other mesofauna, particularly nematodes and other soft-bodied microarthropods, e.g. Oribatida eggs and juveniles (Coleman et al., 2004; Ruf and Beck, 2005; Potapov et al., 2022). Not influenced by tree type or any of our soil and tree characteristic, Mesostigmata density correlated positively with the densities of all taxa except pseudoscorpions, which are also predatory (Pearson’s r between 0.30 and 0.44, p < 0.05; data not shown). This supports the notion that Mesostigmata are likely more affected by changes in prey availability than habitat characteristics (vegetation composition and soil properties) (Nielsen et al., 2010). The densities of other predators and omnivores were also unrelated to tree type or any of the tree and soil characteristics. Pseudoscorpions were likely more correlated to prey availability, such as Oribatida and Prostigmata (Pearson’s r = 0.31 and 0.34, respectively, p < 0.05; data not shown).
Mesostigmata were the only group for which soil CO2 efflux was a significant predictor variable, with higher Mesostigmata biomass and mean body mass observed in soils exhibiting higher soil CO2 efflux rates. Since soil CO2 efflux rate correlated positively with forest floor depth (Supplementary Figure 1), it is likely that these soils contained more organic substrates for prey items of Mesostigmata (mostly decomposer species). Deeper forest floors, indicative of higher C inputs, are also likely to respire more (Schwendenmann and Macinnis-Ng, 2016), from greater microbial decomposition (heterotrophic respiration) as well as higher abundance of surface feeder roots (autotrophic respiration). The effect of soil CO2 efflux on Mesostigmata biomass and body mass may be a proxy for their ability to thrive somewhat better in well aerated soils abundant in organic matter and braided through with roots, i.e. deep forest floors typical of large kauri. Shallower forest floors have been found at kauri throughout the Waitākere Ranges Regional Park with soil that tested positive for P. agathidicida (Froud et al., 2022), which is likely to negatively affect habitat suitability for Mesostigmata and other soil mesofauna.
5 Conclusion
Although our data represent but a snapshot in time, we found multiple lines of evidence to suggest that kauri are important foundation species that influence assemblages and energy fluxes of soil mesofauna food webs. Soil C:N and forest floor depth could help explain differences in soil mesofauna density and biomass between kauri and nearby broadleaf trees. Further research that resamples these food webs repeatedly over time, and incorporates a wider range of potentially important environmental variables, would be beneficial to better understand temporal variation and underlying mechanisms in these forest soils.
The impacts of forest pathogens affecting foundation tree species is a growing problem worldwide and our study serves as a model for the consideration of cascading ecosystem-wide impacts of major tree pathogens. While pathogens may not impact soil mesofauna directly, reduced dominance and altered C and nutrient fluxes of foundation tree species poses a threat to availability of food and suitable habitat for soil mesofauna.
Data availability statement
The datasets presented in this article are not readily available because the data in this research were collected from the traditional lands of Te Kawerau ā Maki with their permission. The authors recognise their sovereignty and authority to control data about their lands under the CARE Principles for Indigenous Data Governance. Requests to access the datasets should be directed to bC5zY2h3ZW5kZW5tYW5uQGF1Y2tsYW5kLmFjLm56.
Ethics statement
The manuscript presents research on animals that do not require ethical approval for their study.
Author contributions
MSt: Conceptualization, Data curation, Formal analysis, Investigation, Methodology, Project administration, Visualization, Writing – original draft, Writing – review & editing. JS: Conceptualization, Supervision, Writing – review & editing. RL: Conceptualization, Investigation, Methodology, Writing – review & editing. LS: Funding acquisition, Investigation, Resources, Supervision, Writing – review & editing. PR: Investigation, Writing – review & editing. GM: Investigation, Writing – review & editing. MSu: Methodology, Writing – review & editing. JY: Investigation, Writing – review & editing. FH: Investigation, Writing – review & editing. AB: Conceptualization, Formal analysis, Methodology, Project administration, Supervision, Writing – review & editing.
Funding
The author(s) declare financial support was received for the research, authorship, and/or publication of this article. This work was funded by the Ministry of Business, Innovation and Employment (Ngā Rākau Taketake—Myrtle Rust and Kauri Dieback Research, C09X1817). Publication costs were funded by the University of Waikato Library Open Access Equity Fund.
Acknowledgments
We acknowledge the mana whenua Te Kawerau ā Maki (Waitākere Ranges Regional Park). We thank Auckland Council for granting permission (WS 1450, WS 1437) to perform our research in the Waitākere Ranges Regional Park. We are grateful for support from laboratory technicians Danielle Le Lievre and Toni Cornes (University of Waikato) as well as from Amruta Desai and Hoa Nguyen (University of Auckland).
Conflict of interest
The authors declare that the research was conducted in the absence of any commercial or financial relationships that could be construed as a potential conflict of interest.
Publisher’s note
All claims expressed in this article are solely those of the authors and do not necessarily represent those of their affiliated organizations, or those of the publisher, the editors and the reviewers. Any product that may be evaluated in this article, or claim that may be made by its manufacturer, is not guaranteed or endorsed by the publisher.
Supplementary material
The Supplementary Material for this article can be found online at: https://www.frontiersin.org/articles/10.3389/fevo.2024.1338109/full#supplementary-material
References
Alcázar J., Woodard P. M., Rothwell R. L. (2002). Soil disturbance and the potential for erosion after mechanical site preparation. Northern J. Appl. Forestry 19, 5–13. doi: 10.1093/njaf/19.1.5
Anderson-Teixeira K. J., Herrmann V., Cass W. B., Williams A. B., Paull S. J., Gonzalez-Akre E. B., et al. (2021). Long-term impacts of invasive insects and pathogens on composition, biomass, and diversity of forests in Virginia’s blue ridge mountains. Ecosystems 24, 89–105. doi: 10.1007/s10021-020-00503-w
Barnes A. D., Jochum M., Lefcheck J. S., Eisenhauer N., Scherber C., O’Connor M. I., et al. (2018). Energy flux: the link between multitrophic biodiversity and ecosystem functioning. Trends Ecol. Evol. 33, 186–197. doi: 10.1016/j.tree.2017.12.007
Barnes A. D., Jochum M., Mumme S., Haneda N. F., Farajallah A., Widarto T. H., et al. (2014). Consequences of tropical land use for multitrophic biodiversity and ecosystem functioning. Nat. Commun. 5, 5351. doi: 10.1038/ncomms6351
Bastida F., Eldridge D. J., Abades S., Alfaro F. D., Gallardo A., García-Velázquez L., et al. (2020). Climatic vulnerabilities and ecological preferences of soil invertebrates across biomes. Mol. Ecol. 29, 752–761. doi: 10.1111/mec.15299
Bates D., Mächler M., Bolker B., Walker S. (2015). Fitting linear mixed-effects models using lme4. J. Stat. Softw. 67, 1–48. doi: 10.18637/jss.v067.i01
Bluhm C., Scheu S., Maraun M. (2016). Temporal fluctuations in oribatid mites indicate that density-independent factors favour parthenogenetic reproduction. Exp. Appl. Acarol 68, 387–407. doi: 10.1007/s10493-015-0001-6
Boyd I. L., Freer-Smith P. H., Gilligan C. A., Godfray H. C. J. (2013). The consequence of tree pests and diseases for ecosystem services. Science 342, 1235773. doi: 10.1126/science.1235773
Bradshaw R. E., Bellgard S. E., Black A., Burns B. R., Gerth M. L., McDougal R. L., et al. (2020). Phytophthora agathidicida: research progress, cultural perspectives and knowledge gaps in the control and management of kauri dieback in New Zealand. Plant Pathol. 69, 3–16. doi: 10.1111/ppa.13104
Briones M. J. I. (2018). The serendipitous value of soil fauna in ecosystem functioning: the unexplained explained. Front. Environ. Sci. 6. doi: 10.3389/fenvs.2018.00149
Chappell P. R. (2013). “The climate and weather of Auckland,” in NIWA science and technology series, 2nd (NIWA, Wellington).
Chen D., Lan Z., Hu S., Bai Y. (2015). Effects of nitrogen enrichment on belowground communities in grassland: Relative role of soil nitrogen availability vs. Soil acidification. Soil Biol. Biochem. 89, 99–108. doi: 10.1016/j.soilbio.2015.06.028
Cockayne L. (1908). Department of Lands: Report on a botanical survey of the Waipoua kauri forest. (Appendix to the Journal of the House of Representatives of New Zealand C-14).
Coleman D. C., Crossley D. A., Hendrix P. F. (2004). “4 - secondary production: activities of heterotrophic organisms—The soil fauna,” in Fundamentals of soil ecology, 2nd ed. Eds. Coleman D. C., Crossley D. A., Hendrix P. F. (Academic Press, Burlington), 79–185. doi: 10.1016/B978-012179726-3/50005-8
Crotty F. V., Blackshaw R. P., Adl S. M., Inger R., Murray P. J. (2014). Divergence of feeding channels within the soil food web determined by ecosystem type. Ecol. Evol. 4, 1–13. doi: 10.1002/ece3.905
Crotty F. V., Adl S. M. (2019). Competition and predation in soil fungivorous microarthropods using stable isotope ratio mass spectrometry. Front. Microbiol. 10.
D’Souza K., Scott P., Williams N., Bellgard S., Bader M. (2021). Early infection by phytophthora agathidicida up-regulates photosynthetic activity in agathis australis seedlings. For. Pathol. 51. doi: 10.1111/efp.12680
Dayton P. K. (1972). “Toward an understanding of community resilience and the potential effects of enrichments to the benthos at McMurdo Sound, Antarctica,” in Proceedings of the colloquium on conservation problems in Antarctica. Ed. Parker B. C. (Allen Press, Lawrence, KS).
De Ruiter P. C., Van Veen J. A., Moore J. C., Brussaard L., Hunt H. W. (1993). Calculation of nitrogen mineralization in soil food webs. Plant Soil 157, 263–273. doi: 10.1007/BF00011055
Dick M., Bellgard S. (2010). Preliminary survey for Phytophthora taxon Agathis (New Zealand: Client: MAF Biosecurity).
Dietze M. C., Matthes J. H. (2014). A general ecophysiological framework for modelling the impact of pests and pathogens on forest ecosystems. Ecol. Lett. 17, 1418–1426. doi: 10.1111/ele.12345
Digel C., Curtsdotter A., Riede J., Klarner B., Brose U. (2014). Unravelling the complex structure of forest soil food webs: higher omnivory and more trophic levels. Oikos 123, 1157–1172. doi: 10.1111/oik.00865
Edney E. B. (1977). “Water loss—Respiratory,” in Water balance in land arthropods, zoophysiology and ecology. Ed. Edney E. B. (Springer, Berlin, Heidelberg), 66–86. doi: 10.1007/978-3-642-81105-0_4
Ehnes R. B., Rall B. C., Brose U. (2011). Phylogenetic grouping, curvature and metabolic scaling in terrestrial invertebrates. Ecol. Lett. 14, 993–1000. doi: 10.1111/j.1461-0248.2011.01660.x
Eisenhauer N., Bonn A., A. Guerra C. (2019). Recognizing the quiet extinction of invertebrates. Nat. Commun. 10, 50. doi: 10.1038/s41467-018-07916-1
Ellison A. M., Bank M. S., Clinton B. D., Colburn E. A., Elliott K., Ford C. R., et al. (2005). Loss of foundation species: consequences for the structure and dynamics of forested ecosystems. Front. Ecol. Environ. 3, 479–486. doi: 10.1890/1540-9295(2005)003[0479:LOFSCF]2.0.CO;2
Enright N. J., Ogden J. (1987). Decomposition of litter from common woody species of kauri (Agathis australis Salisb.) forest in northern New Zealand. Aust. J. Ecol. 12, 109–124. doi: 10.1111/j.1442-9993.1987.tb00933.x
Erwin D. C., Ribeiro O. K. (1996). Phytophthora diseases worldwide (St. Paul, Minnesota, USA: APS Press).
Frampton G. K., van den Brink P. J., Gould P. J. L. (2000). Effects of spring drought and irrigation on farmland arthropods in southern Britain. J. Appl. Ecol. 37, 865–883. doi: 10.1046/j.1365-2664.2000.00541.x
Froud K., Chew Y. C., Kean J., Geddes H., Edwards G., Hill L., et al. (2022). “Chapter 2: Baseline prevalence study of Phytophthora agathidicida and kauri dieback in the Wait kereRangesandfrequencyofpotential risk factors using a cross-sectional study,” in 2021 Waitakere Ranges kauri population health monitoring survey (Auckland, New Zealand: Auckland Council).
Gauzens B., Barnes A., Giling D. P., Hines J., Jochum M., Lefcheck J. S., et al. (2019). fluxweb: An R package to easily estimate energy fluxes in food webs. Methods Ecol. Evol. 10, 270–279. doi: 10.1111/2041-210X.13109
George P. B. L., Keith A. M., Creer S., Barrett G. L., Lebron I., Emmett B. A., et al. (2017). Evaluation of mesofauna communities as soil quality indicators in a national-level monitoring programme. Soil Biol. Biochem. 115, 537–546. doi: 10.1016/j.soilbio.2017.09.022
Gruner D. S. (2003). Regressions of length and width to predict arthropod biomass in the Hawaiian islands. Pacific Sci. 57, 325–336. doi: 10.1353/psc.2003.0021
Haukenes V. L., Åsgård L., Asplund J., Nybakken L., Rolstad J., Storaunet K. O., et al. (2022). Spatial variation of surface soil carbon in a boreal forest – the role of historical fires, contemporary vegetation, and hydro-topography. Scandinavian J. For. Res. 37, 287–294. doi: 10.1080/02827581.2022.2104364
Hayward B. W. (1976). Lower miocene stratigraphy and structure of the Waitakere Ranges and the Waitakere Group (new). New Z. J. Geology Geophysics 19, 871–895. doi: 10.1080/00288306.1976.10420745
Heděnec P., Jiménez J. J., Moradi J., Domene X., Hackenberger D., Barot S., et al. (2022). Global distribution of soil fauna functional groups and their estimated litter consumption across biomes. Sci. Rep. 12, 17362. doi: 10.1038/s41598-022-21563-z
Höfer H., Ott R. (2009). Estimating biomass of Neotropical spiders and other arachnids (Araneae, Opiliones, Pseudoscorpiones, Ricinulei) by mass-length regressions. arac 37, 160–169. doi: 10.1636/T08-21.1
Huston M. A. (1994). Biological diversity: the coexistence of species on changing landscapes (Cambridge: Cambridge University Press).
Jochum M., Eisenhauer N. (2022). Out of the dark: Using energy flux to connect above- and belowground communities and ecosystem functioning. Eur. J. Soil Sci. 73, e13154. doi: 10.1111/ejss.13154
Jones G. (2021). Carbon dynamics within kauri (Agathis australis) under drought conditions and infection by Phytophthora agathidicida (Thesis). ResearchSpace@Auckland.
Jones C. G., Lawton J. H., Shachak M. (1994). Organisms as ecosystem engineers. Oikos 69, 373–386. doi: 10.2307/3545850
Jung T., Blaschke H., Oßwald W. (2000). Involvement of soilborne Phytophthora species in Central European oak decline and the effect of site factors on the disease. Plant Pathol. 49, 706–718. doi: 10.1046/j.1365-3059.2000.00521.x
Kaňa J., Tahovská K., Kopáček J. (2013). Response of soil chemistry to forest dieback after bark beetle infestation. Biogeochemistry 113, 369–383. doi: 10.1007/s10533-012-9765-5
Krantz G. W., Walter D. E. (2009). A manual of acarology, Third edition. ed (Texas: Texas Tech University Press; Lubbock).
Lang B., Ehnes R. B., Brose U., Rall B. C. (2017). Temperature and consumer type dependencies of energy flows in natural communities. Oikos 126, 1717–1725. doi: 10.1111/oik.04419
Lavelle (2012). “Soil as a habitat,” in Soil ecology and ecosystem services. Eds. Hall D., Bardgett R. D., Behan-Pelletier V., Herrick J. E., Jones T. H., Ritz K., Six J., Strong D. R., van der Putten W. (Oxford Academic, Oxford).
Leathwick J., Morgan F., Wilson G., Ruthledge D., McLeod M., Johnston K. (2002). Land environments of New Zealand: a technical guide (Ministry for the Environment: Wellington).
Lindquist E. E. (1986). The world genera of Tarsonemidae (Acari: Hetrostigmata): A morphological, phylogenetic, and systematic revision, with a reclassification of family-group taxa in the Heterostigmata. Memoirs Entomological Soc. Canada 118, 1–517. doi: 10.4039/entm118136fv
Manaaki Whenua - Landcare Research (2022) NZEnvDS_Mean temperature of the warmest quarter v1.0 [WWW Document] (Manaaki Whenua - Landcare Research). Available at: https://lris.scinfo.org.nz/layer/107427-nzenvds-mean-temperature-of-the-warmest-quarter-v10/ (Accessed 7.17.23).
Maraun M., Salamon J.-A., Schneider K., Schaefer M., Scheu S. (2003). Oribatid mite and collembolan diversity, density and community structure in a moder beech forest (Fagus sylvatica): effects of mechanical perturbations. Soil Biol. Biochem. 35, 1387–1394. doi: 10.1016/S0038-0717(03)00218-9
McCarthy J., Leathwick J., Roudier P., Barringer J., Etherington T., Morgan F., et al. (2021). New Zealand Environmental Data Stack (NZEnvDS): A standardised collection of spatial layers for environmental modelling and site characterisation. NZJE 45 (2), 1–8. doi: 10.20417/NZJECOL
Mercer R. D., Gabriel A. G. A., Barendse J., Marshall D. J., Chown S. L. (2001). Invertebrate body sizes from Marion Island. Antarctic Sci. 13, 135–143. doi: 10.1017/S0954102001000219
Nielsen U. N., Osler G. H. R., Campbell C. D., Burslem D. F. R. P., van der Wal R. (2010). The influence of vegetation type, soil properties and precipitation on the composition of soil mite and microbial communities at the landscape scale. J. Biogeography 37, 1317–1328. doi: 10.1111/j.1365-2699.2010.02281.x
Nielsen U. N., Osler G. H. R., van der Wal R., Campbell C. D., Burslem D. F. R. P. (2008). Soil pore volume and the abundance of soil mites in two contrasting habitats. Soil Biol. Biochemistry Special Section: Funct. Microbial Ecology: Mol. Approaches to Microbial Ecol. Microbial Habitats 40, 1538–1541. doi: 10.1016/j.soilbio.2007.12.029
Norton R. A., Palmer S. C. (1991). “The distribution, mechanisms and evolutionary significance of parthenogenesis in oribatid mites,” in The acari: reproduction, development and life-history strategies. Eds. Schuster R., Murphy P. W. (Springer Netherlands, Dordrecht), 107–136. doi: 10.1007/978-94-011-3102-5_7
Panzavolta T., Bracalini M., Benigno A., Moricca S. (2021). Alien invasive pathogens and pests harming trees, forests, and plantations: pathways, global consequences and management. Forests 12, 1364. doi: 10.3390/f12101364
Paul E. A. (Ed.). (2015). Soil microbiology, ecology and biochemistry (Fourth edition) (Boston: Academic Press). doi: 10.1016/B978-0-12-415955-6.00002-5
Potapov A. M., Beaulieu F., Birkhofer K., Bluhm S. L., Degtyarev M. I., Devetter M., et al. (2022). Feeding habits and multifunctional classification of soil-associated consumers from protists to vertebrates. Biol. Rev. doi: 10.1111/brv.12832
Pulleman M., Creamer R., Hamer U., Helder J., Pelosi C., Pérès G., et al. (2012). Soil biodiversity, biological indicators and soil ecosystem services—an overview of European approaches. Curr. Opin. Environ. Sustainability Terrestrial Syst. 4, 529–538. doi: 10.1016/j.cosust.2012.10.009
Reinhart K. O., Royo A. A., Kageyama S. A., Clay K. (2010). Canopy gaps decrease microbial densities and disease risk for a shade-intolerant tree species. Acta Oecologica 36, 530–536. doi: 10.1016/j.actao.2010.07.006
Ritter E., Dalsgaard L., Einhorn K. S. (2005). Light, temperature and soil moisture regimes following gap formation in a semi-natural beech-dominated forest in Denmark. For. Ecol. Manage. 206, 15–33. doi: 10.1016/j.foreco.2004.08.011
Rola K., Kurek P., Skubała P. (2017). Badger (Meles meles) disturbances affect oribatid mite (Acari: Oribatida) communities in European temperate forests. Appl. Soil Ecol. 121, 20–30. doi: 10.1016/j.apsoil.2017.09.013
Ruf A., Beck L. (2005). The use of predatory soil mites in ecological soil classification and assessment concepts, with perspectives for oribatid mites. Ecotoxicology Environ. Safety Includes Special Issue: Ecol. Soil Qual. 62, 290–299. doi: 10.1016/j.ecoenv.2005.03.029
Schwendenmann L., Michalzik B. (2019). Dissolved and particulate carbon and nitrogen fluxes along a Phytophthora agathidicida infection gradient in a kauri (Agathis australis) dominated forest. Fungal Ecol. 42, 100861. doi: 10.1016/j.funeco.2019.08.005
Schwendenmann L., Michalzik B. (2021). Impact of Phytophthora agathidicida infection on canopy and forest floor plant nutrient concentrations and fluxes in a kauri-dominated forest. Ecol. Evol. 11, 4310–4324. doi: 10.1002/ece3.7326
Schwendenmann L., Macinnis-Ng C. (2016). Soil CO2 efflux in an old-growth southern conifer forest (Agathis australis)-magnitude, components and controls 2, 403–419. doi: 10.5194/soil-2-403-2016
Silvester W. B. (2000). The biology of kauri (Agathis australis) in New Zealand 11. Nitrogen cycling in four kauri forest remnants. New Z. J. Bot. 38, 205–220. doi: 10.1080/0028825X.2000.9512678
Silvester W. B., Orchard T. A. (1999). The biology of kauri (Agathis australis) in new zealand. production, biomass, carbon storage, and litter fall in four forest remnants. New Z. J. Bot. 37, 553–571. doi: 10.1080/0028825X.1999.9512653
Sousa J. P., Bolger T., da Gama M. M., Lukkari T., Ponge J.-F., Simón C., et al. (2006). Changes in Collembola richness and diversity along a gradient of land-use intensity: A pan European study. Pedobiologia 50, 147–156. doi: 10.1016/j.pedobi.2005.10.005
Steward G. A., Beveridge A. E. (2010) 40, 33–59. A review of New Zealand kauri (Agathis australis (D.Don) Lindl.): its ecology, history, growth and potential for management for timber. New Z. J. Forestry Sci. 40, 33–59.
Tomlinson A. (2007). Invertebrate decomposer communities in northern New Zealand forests (Auckland, New Zealand: University of Auckland).
van Straalen N. M., Verhoef H. A. (1997). The development of a bioindicator system for soil acidity based on arthropod pH preferences. J. Appl. Ecol. 34, 217–232. doi: 10.2307/2404860
Verkaik E., Braakhekke G. (2007). Kauri trees (Agathis australis) affect nutrient, water and light availability for their seedlings. New Z. J. Ecol. 31, 39–46.
Verkaik E., Jongkind A. G., Berendse F. (2006). Short-term and long-term effects of tannins on nitrogen mineralisation and litter decomposition in kauri (Agathis australis (D. Don) Lindl.) forests. Plant Soil 287, 337–345. doi: 10.1007/s11104-006-9081-8
Wallwork J. A. (1983). Oribatids in forest ecosystems. Annu. Rev. Entomol. 28, 109–130. doi: 10.1146/annurev.en.28.010183.000545
Walter D. E., Proctor H. C. (2013). Mites: ecology, evolution & Behaviour - life at a microscale. 2nd ed. (Dordrecht, Netherlands: Springer).
Wan B., Hu Z., Liu T., Yang Q., Li D., Zhang C., et al. (2022). Organic amendments increase the flow uniformity of energy across nematode food webs. Soil Biol. Biochem. 170, 108695. doi: 10.1016/j.soilbio.2022.108695
Wilson E. O. (1987). The little things that run the world (The importance and conservation of invertebrates). Conserv. Biol. 1, 344–346. doi: 10.1111/j.1523-1739.1987.tb00055.x
Winkworth R. C., Nelson B. C. W., Bellgard S. E., Probst C. M., McLenachan P. A., Lockhart P. J. (2020). A LAMP at the end of the tunnel: A rapid, field deployable assay for the kauri dieback pathogen, Phytophthora agathidicida. PloS One 15, e0224007. doi: 10.1371/journal.pone.0224007
Wyse S. (2012). Growth responses of five forest plant species to the soils formed beneath New Zealand kauri (Agathis australis). New Z. J. Bot. 50, 411–421. doi: 10.1080/0028825X.2012.724428
Wyse S. V., Burns B. R. (2013). Effects of Agathis australis (New Zealand kauri) leaf litter on germination and seedling growth differs among plant species (New Zealand Journal of Ecology 37).
Wyse S. V., Burns B. R., Wright S. D. (2014). Distinctive vegetation communities are associated with the long-lived conifer Agathis australis (New Zealand kauri, Araucariaceae) in New Zealand rainforests. Austral Ecol. 39, 388–400. doi: 10.1111/aec.2014.39.issue-4
Yamamoto T., Nakagoshi N., Touyama Y. (2001). Ecological study of pseudoscorpion fauna in the soil organic layer in managed and abandoned secondary forests. Ecol. Res. 16, 593–601. doi: 10.1046/j.1440-1703.2001.00422.x
Keywords: soil food web, trophic group, foundation species, kauri dieback, Agathis australis, Phytophthora agathidicida, energy flux, soil fauna
Citation: Struijk M, Stavert JR, Le Grice RJ, Schwendenmann L, Romera PJ, Mitchell G, Sünnemann M, Yang J, Hjelm F and Barnes AD (2024) The threat of a major tree pathogen to forest soil mesofauna food webs and ecosystem functioning. Front. Ecol. Evol. 12:1338109. doi: 10.3389/fevo.2024.1338109
Received: 14 November 2023; Accepted: 12 February 2024;
Published: 25 March 2024.
Edited by:
Treena Burgess, Murdoch University, AustraliaReviewed by:
Alberto Masoni, University of Florence, ItalyLuís Carlos Iunes Oliveira Filho, Universidade do Estado de Santa Catarina, Brazil
Sara Remelli, University of Parma, Italy
Copyright © 2024 Struijk, Stavert, Le Grice, Schwendenmann, Romera, Mitchell, Sünnemann, Yang, Hjelm and Barnes. This is an open-access article distributed under the terms of the Creative Commons Attribution License (CC BY). The use, distribution or reproduction in other forums is permitted, provided the original author(s) and the copyright owner(s) are credited and that the original publication in this journal is cited, in accordance with accepted academic practice. No use, distribution or reproduction is permitted which does not comply with these terms.
*Correspondence: Marijke Struijk, bWFyaWprZXN0cnVpamtAZ21haWwuY29t