 Hui Xu
 Na Li2,3
 Jun Wang
 Shuai Shang
- 1College of Biological and Environmental Engineering, Shandong University of Aeronautics, Binzhou, Shandong, China
- 2The Eighth Geological Brigade of Hebei Geological Prospecting Bureau (Marine Geological Research Survey Center of Hebei Province), Qinhuangdao, China
- 3Marine Ecological Restoration and Smart Ocean Engineering Research Center of Hebei Province (Marine Geological Research Survey Center of Hebei province), Qinhuangdao, China
- 4Binzhou City Bureau of Natural Resources and Planning, Binzhou, Shandong, China
- 5Qinhuangdao National Aquatic Germplasm Resources Protection Center (Qinhuangdao Marine Fishery Ecological Environment Monitoring Station), Qinhuangdao, China
Introduction: Suaeda salsa is a typical wetland plant species in coastal areas that plays an important role in protecting the marine eco-environment. The rhizosphere microorganisms of S. salsa are responsible for its growth and development.
Method: Eighteen samples were collected from three areas, including the natural S. salsa-growing area (YDJ), artificial S. salsa restoration area (YDB), and nonrestoration area (BKS), and high-throughput sequencing technology was employed to explore the characteristics of the rhizosphere microorganisms of S. salsa in the Yellow River Delta.
Results: The results illustrated that the abundance and diversity of soil bacteria were highest in the YDJ group, fungal abundance was highest in the YDJ group, and fungal diversity was greatest in the YDB group. In total, 26,663 operational taxonomy units (OTUs) were found in soil bacteria, among which 9,095, 8,023, and 11,001 were detected in the BKS, YDB, and YDJ groups, respectively. 11,619 OTUs were found in soil fungi, among which 4,278, 4,552, and 5,100 were detected in the BKS, YDB, and YDJ groups, respectively. The YDJ group had the highest number of OTUs for bacteria and fungi among the three groups.
Discussion: S. salsa in natural wetland conditions tended to be similar to artificially restored S. salsa. The composition of fungi in the S. salsa rhizosphere had greater similarities than that of the bacteria. Proteobacteria had the highest abundance among bacterial communities, and Ascomycota, Basidiomycota, and Olpidiomycota were dominant in the fungal communities of the three groups. The correlation results found that power of hydrogen (pH) was significantly and negatively correlated with the abundance of Acidobacteriota and Proteobacteria. Meanwhile, electrical conductivity (EC) was significantly and positively correlated with the abundance of Firmicutes and negatively correlated with that of Proteobacteria. Regarding fungi, pH and EC were significantly and negatively correlated with the abundance of Chytridiomycota. Our findings provided some theoretical data for S. salsa conservation and wetland restoration.
1 Introduction
For better growth, plants must obtain sufficient nutrients and water from the soil, and microorganisms actively participate in these substance and energy flow processes (Bailey et al., 2011). Microorganisms are the most active biological members in the soil, and they play an important role in substance circulation and energy transform between plants and soil (Liao et al., 2023). They are associated with organic matter decomposition and nutrient acquisition (Jansson & Hofmockel, 2020). In soil, the diversity of microorganisms is high, and the interaction between plants and microbes is intensive. The root exudates of plants can attract more plant growth-promoting bacteria, thus affecting the rhizospheric microbial community (Ahkami et al., 2017). Conversely, rhizosphere microorganisms represent an important indicator of the soil ecosystem. Plant species and their growth can affect the soil environment and change the microbial community structure and diversity. In the vigorous growth period of the plant, associated microbial metabolic groups and the functional diversity of the community tend to increase (Meena et al., 2017).
Suaeda salsa is an annual salt-tolerant herb (Cheng et al., 2014) that grows in deserts, lakesides, saline–alkali land, and coastal wetlands (Li et al., 2021). It can absorb and accumulate salt in the body and release certain secretions to change the physical and chemical properties of the soil (Sun et al., 2013). It is a typical plant species in coastal wetlands with many ecological functions, such as decelerating waves and tidal currents, providing a habitat and food source for marine organisms, filtering nutrients in estuarine and coastal waters, stabilizing pollutants, and purifying water (Sun et al., 2013). Because of the overexploitation of coastal regions and global climate change in recent years, most estuarine wetlands have encountered great ecosystem degradation problems, causing severe damage to biodiversity (Martens et al., 2018) and landscape diversity (Carugati et al., 2018). Therefore, restoring damaged wetlands has become an important eco-environmental protection measure. In particular, S. salsa has been used as an appropriate species in wetland restoration in the Yellow River Delta of China because it is a native species with great salt resistance and landscaping value. Previous studies found that the root exudates of S. salsa may be the main driving force of soil bacteria under environmental changes (Liu et al., 2020), and the S. salsa root-associated microoganisms could improve other plants growth and resistance under salt stress (Wang et al., 2022). A study also found that the Biochar had the potential to improve the restoration of S. salsa in coastal wetlands (Cai et al., 2021). However, little information is available regarding the interaction or correlation between S. salsa and its rhizospheric microorganisms, especially in the restoration process. In our study, samples were collected in areas with natural S. salsa growth, artificial S. salsa restoration, and nonrestoration, and high-throughput sequencing technology was used to better understand the composition of soil microorganisms in S. salsa vegetation and demonstrate the effects of S. salsa restoration on soil microorganisms. We aim to provide some basic data for the restoration of coastal ecosystems.
2 Materials and methods
2.1 Study area and sampling collection
The Yellow River Delta in northern China is the most prominent newborn wetland (Wang et al., 2012). In this area, riverine sediment deposition in the intertidal zone of the Bohai Sea promotes the rise and desalination of the low tide flats. The middle and high tidal beaches are successively covered by alkali, Tamarix and reed vegetation from low to high tidal flats. There are large areas of Phragmites australis and S. salsa swamps in the Yellow River Delta. And the pH of the soil in Yellow River Deltais between 7.8 and 8.5, and the electrical conductivity (EC) of soil Yellow River Deltais is 0.24 dS/m~ 4.83 dS/m (Li et al., 2023).
2.2 Detection of soil physical and chemical indicators
In the present study, 18 soil samples were collected from the natural S. salsa-growing area (YDJ), artificial S. salsa restoration area (YDB), and nonrestoration area (BKS). Each sample was collected in a quadrat using the five-point sampling method. At each sampling station, the whole plant of S. salsa was excavated and associated plants were removed. Then, a brush was used to move the soil adhered to the surface of the roots of S. salsa into a sterile sampling bag. Bulk soils were also collected and then thoroughly mixed to obtain one bulk soil sample. In each sample, a 20 g soil sample was weighed in a 250 ml shaker flask with 100 ml water and placed on a reciprocating degree constant temperature oscillator for 30 min. After standing for 30 min, the extracts were filtered or centrifuged and collected in a 100 ml beaker until measured. Then, the EC of soil samples was measured using an electrical conductivity instrument. The pH of the samples was measured using a pH meter.
2.3 Soil DNA extraction, PCR amplification, and sequencing
For bacterial community analysis, the V3–V4 regions of the 16S rRNA gene were amplified using the PCR primers 341F (5′-CCTACGGGNGGCWGCAG-3′) and 805R (5′-GACTACHVGGGTATCTAATCC-3′) (Cai et al., 2017). The primers ITS1F (5′-CTTGGTCATTTAGAGGAAGTAA-3′) and ITS 2R (5′-GCTGCGTTCTTCATCGATGC-3′) were used to amplify the transcribed spacer region ITS1 for fungal community analysis (Saravanakumar et al., 2017). The library was constructed using Illumina MixSeq for sequencing. The sequencing data are available at NCBI (https://www.ncbi.nlm.nih.gov/, accession numbers PRJNA949580 and PRJNA949571).
2.4 Data analysis
To explore the similarity of different samples in terms of species diversity, QIIME software (Version 1.9.1) was used to calculate alpha and beta diversity (Bolyen et al., 2019). The graph was drawn using R (Version 3.4.4) (McMurdie & Holmes, 2013). The Chao1 and ACE indices measure species abundance as the number of species. The Shannon and Simpson indices are used estimate species diversity. The variance of soil properties between two groups was determined using one-way analysis of variance (ANOVA) (Kim et al., 2009). Based on the random matrix theory, the OTU data were used to construct molecular ecological network models of soil microorganisms in three different groups. And the interactions among soil microorganisms were analyzed (Xiao et al., 2022).
3 Results
3.1 Alpha diversity analysis
In the present study, indices, including ACE, Chao1, Simpson, and Shannon, were used to assess the alpha diversity of bacteria (Table 1) and fungi (Table 2). Our results revealed that the ACE, Chao1, Simpson, and Shannon indices were highest in the YDJ group and significantly different from those in the YDB group (P < 0.05), suggesting the great abundance and diversity of soil bacteria in the natural S. salsa-growing area. No significant differences were observed for the four parameters between the YDB and BKS groups (P > 0.05).
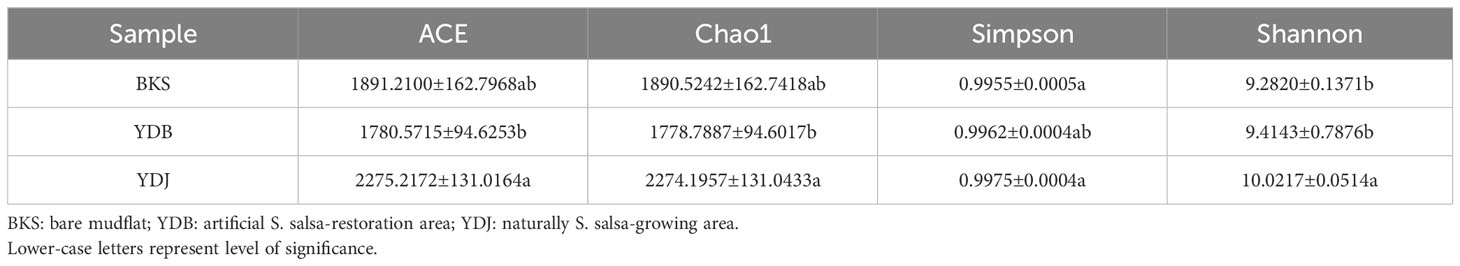
Table 1 Alpha diversity indices of bacteria in the three groups.
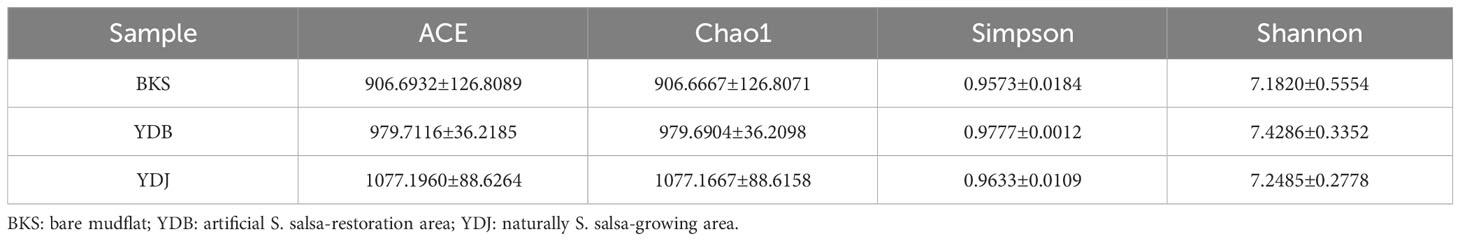
Table 2 Alpha diversity indices of fungi in the three groups.
For fungi, the ACE (1077.1960) and Chao1 (1077.1667) indices were higher in the YDJ group than in the YDB and BKS groups, suggesting the great abundance of fungi in the natural S. salsa-growing area. However, the differences in the Simpson and Shannon indices were not significant among the three groups, indicating that S. salsa does not strongly affect fungal diversity.
In this study, 26,663 OTUs were found in three groups of soil bacteria. The OTU numbers of YDJ group were higher than in the BKS and YDB groups (Figure 1). In total, 981, 242, and 363 OTUs were shared by the BKS and YDB, YDB and YDJ, and BKS and YDJ groups, respectively. Additionally, 11,619 OTUs were found in three groups of soil fungi. The OTU numbers of YDJ group were higher than in the BKS and YDB. Of these, 976, 994, and 952 OTUs were shared by the BKS and YDB, YDB and YDJ, and BKS and YDJ groups, respectively. The YDJ group had the greatest number of OTUs for both bacteria and fungi.
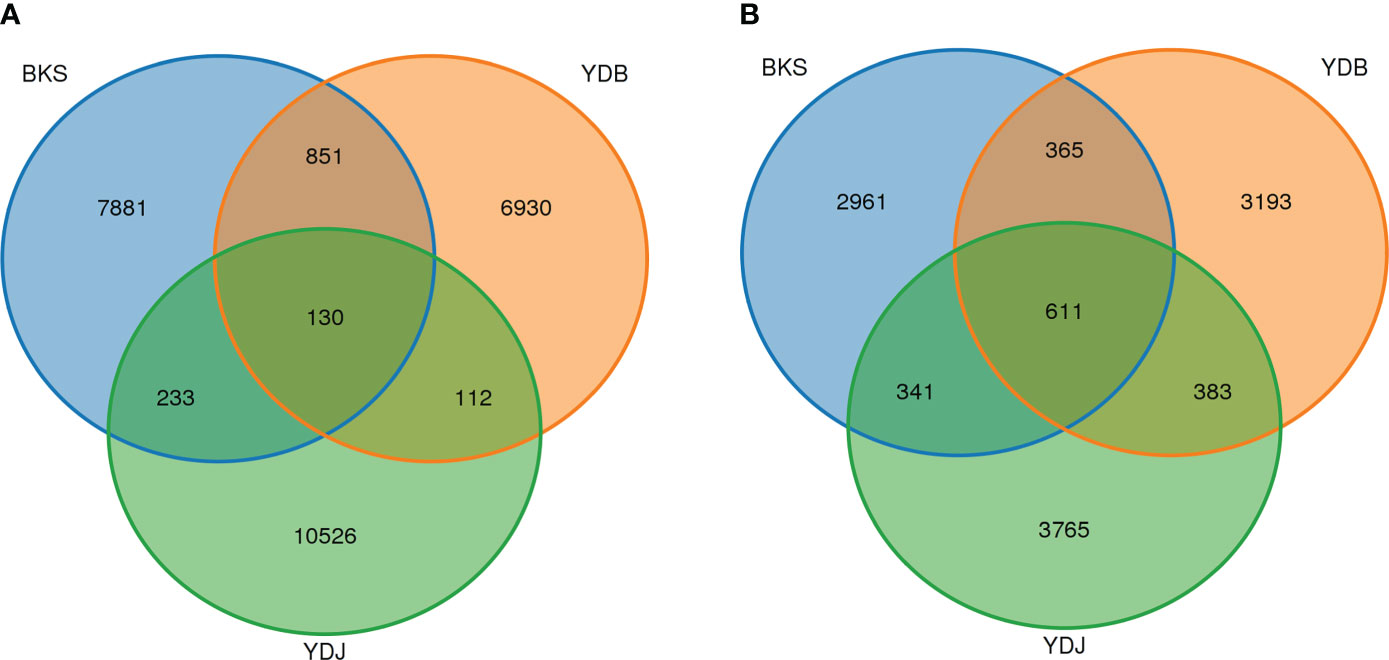
Figure 1 Venn diagram presenting the number of shared and unique OTUs among the different groups. (A) Soil bacteria; (B) soil fungi. BKS: bare mudflat; YDB: artificial S. salsa restoration area; YDJ: natural S. salsa-growing area.
3.2 Soil microbial community structure analysis
The microbial community structure at the phylum level in the three groups is presented in Figure 2. Proteobacteria, Bacteroidota, and Gemmatimonadota were the dominant bacterial groups (accounting for 53.0% of all species) in the BKS group. Proteobacteria, Bacteroidota, and Acidobacteriota dominated in the YDB group (62.9%), and Proteobacteria, Desulfobacterota, and Chloroflexi were the major contributors in the YDJ group (57.5%). It was obvious that Proteobacteria had the greatest abundance in all three groups (30.9%, 42.9%, and 40.3% in the BKS, YDB, and YDJ groups, respectively). Regarding fungi, Ascomycota, Basidiomycota, and Olpidiomycota were dominant in all three groups (accounting for 90.4%, 85.9%, and 85.7% of fungi in the BKS, YDB, and YDJ groups, respectively). It could also be observed that Olpidiomycota had great abundance (13.5%) in the BKS group but low abundance in the YDB and YDJ groups (2.7% and 2.8%, respectively).
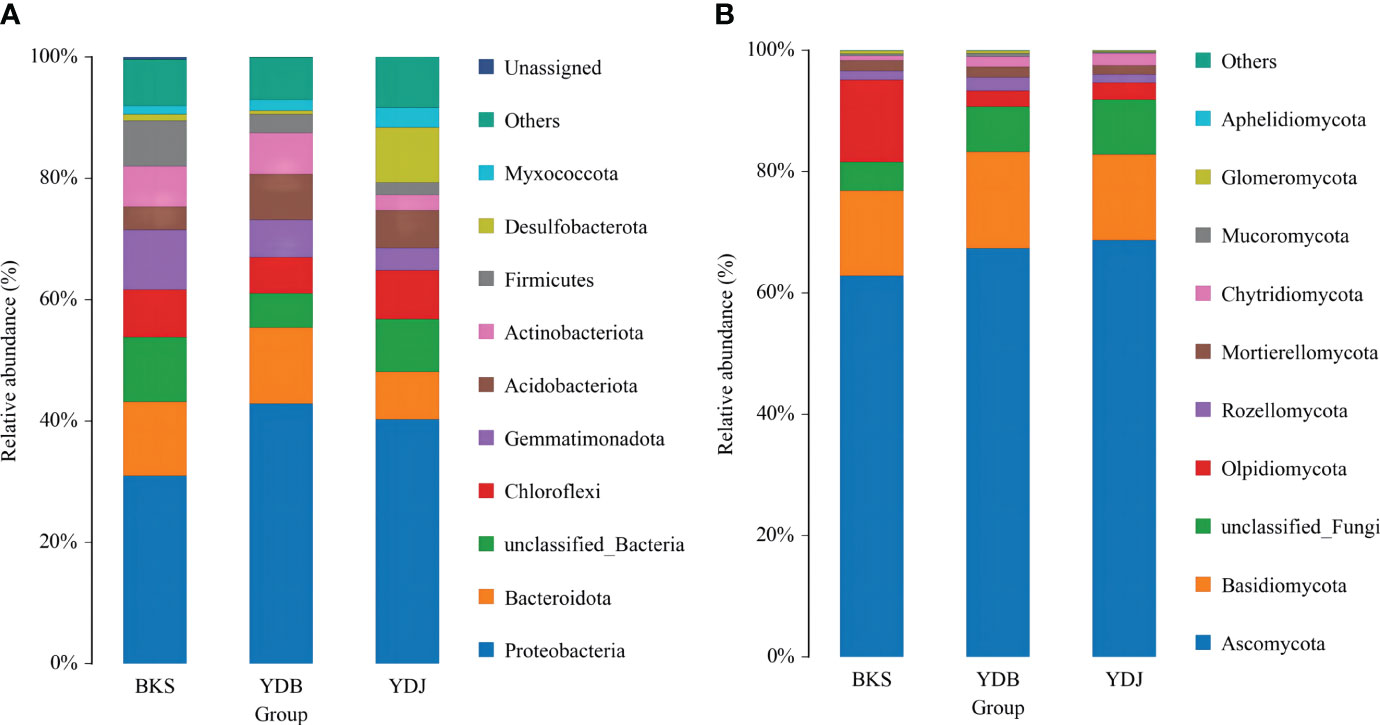
Figure 2 Relative abundance of the top 10 microbial groups at the phylum level. (A) Soil bacteria; (B) soil fungi. BKS: bare mudflat; YDB: artificial S. salsa restoration area; YDJ: natural S. salsa-growing area.
At the genus level, the top 30 microbial groups are presented in Figure 3 for bacteria. Except for the unclassified species, the Woeseia (3.1%) and Pelagibius (1.3%) were the dominant bacterial genera in YDJ group; the Limibaculum (2.8%), Halomonas (1.7%), and Lactobacillus (1.3%) were the dominant bacterial genus in YDB groups; the Lactobacillus (2.6%), Ardenticatena (1.8%), Sphingomonas (1.2%) and Rehaibacterium (1.1%) were the dominant bacterial genera in BKS groups.
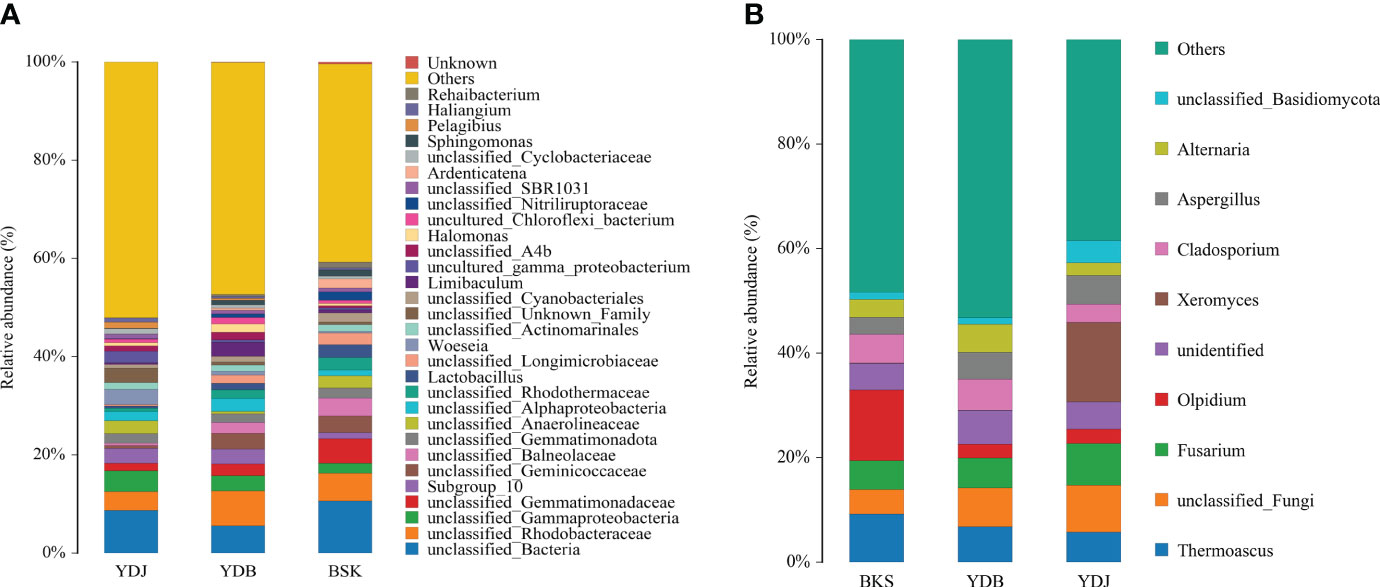
Figure 3 Relative abundance of the top 10 microbial groups at the genus level. (A) Soil bacteria; (B) soil fungi. BKS: bare mudflat; YDB: artificial S. salsa restoration area; YDJ: natural S. salsa-growing area.
For fungi, the top 10 microbial groups are presented in Figure 3. The Olpidium, Thermoascus, and Fusarium dominated in the BKS group (28.3%); Thermoascus, Cladosporium, and Fusarium dominated in the YDB group (18.4%); and Xeromyces, Fusarium, and Thermoascus dominated in the YDJ group (28.9%). Xeromyces was the most abundant genera in the YDJ (15.2%), and the Olpidium was the most abundant genera in BKS groups (13.5%).
3.3 Principal component analysis (PCA)
PCA enables the classification of multiple samples, further demonstrating the differences in species diversity among the samples. Bacterial PCA plots revealed a contribution of 25.55% for PC1 and 16.12% for PC2. In comparison, fungal PCA plots revealed a contribution of 57.69% for PC1 and 14.56% for PC2 (Figure 4). For bacteria, the YDB samples were more distant and dispersed from those in the other two groups on the axes in the two coordinate plots, indicating that the YDB group had low similarity with the other two groups in terms of bacteria composition. For fungi, the YDJ group was more distant and dispersed from the other two groups on the axes in the two coordinate plots, indicating that the YDJ group had low similarity with the other two groups in terms of fungal composition.
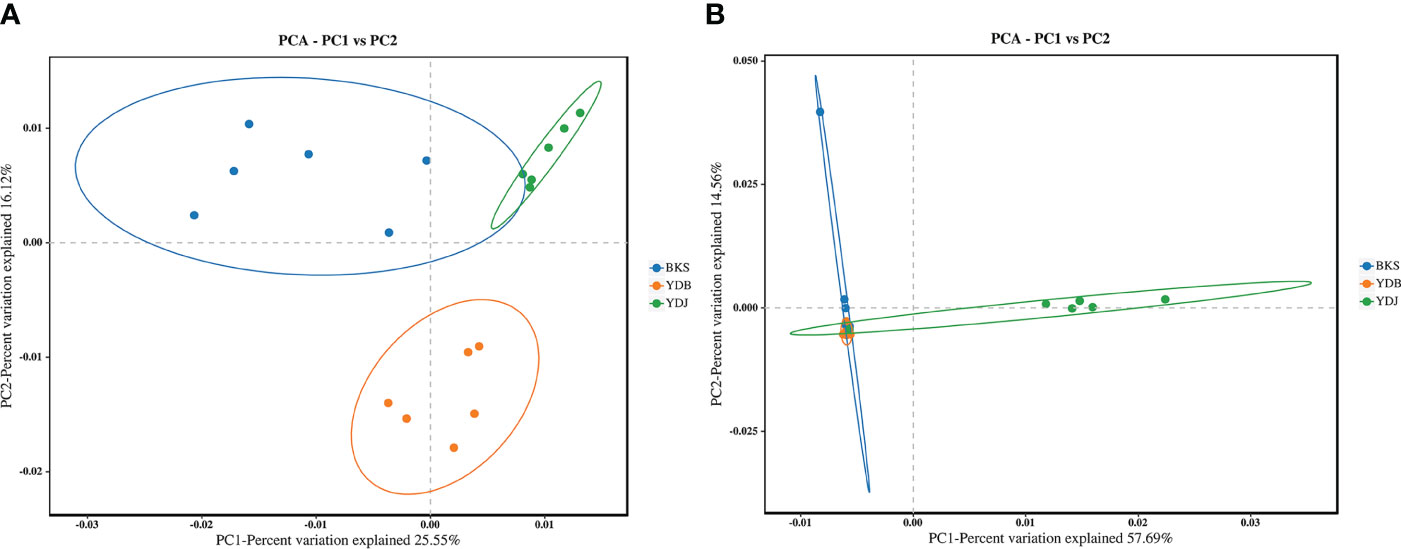
Figure 4 PCA based on the Bray–Curtis distance reveals the variation in community structure. (A) Soil bacteria; (B) soil fungi. BKS: bare mudflat; YDB: artificial S. salsa restoration area; YDJ: natural S. salsa-growing area.
3.4 Rhizosphere microbial network analysis
At the bacterial level, the molecular ecological network of the bacterial community and the leading network characteristic parameters were calculated to describe the structure of the bacterial molecular network. The R2 of the exponential distribution relationship of the three groups (BKS, YDB and YDJ) were 0.754, 0.821, and 0.697, respectively. The similarity thresholds were 0.920, 0.940, and 0.920, which aligned with the power law (Table 3). At the fungi level, the molecular ecological network of the fungal community and the leading network characteristic parameters were calculated to describe the structure of the fungal molecular network. The R2 of the exponential distribution relationship of the three groups (BKS, YDB and YDJ) were 0.743, 0.557, and 0.603, respectively. The similarity thresholds were 0.910, 0.880, and 0.910 in three groups (BKS, YDB and YDJ), which aligned with the power law (Table 4). Our result indicates that the node relationship in the constructed bacterial and fungal molecular network model is reasonable and practical and can be further analyzed.
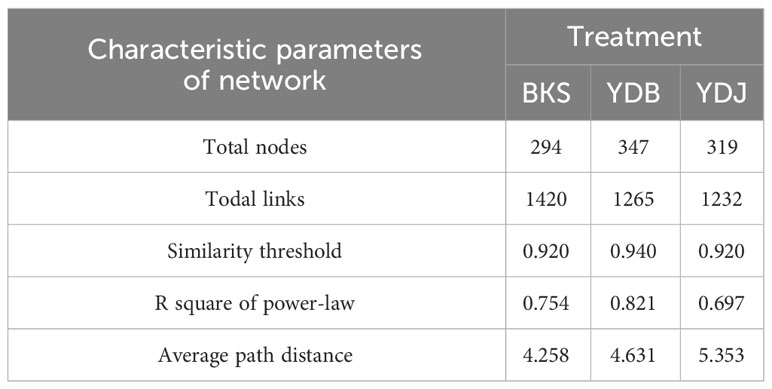
Table 3 Characteristic parameters of the molecular ecological network of soil bacterica in three groups.
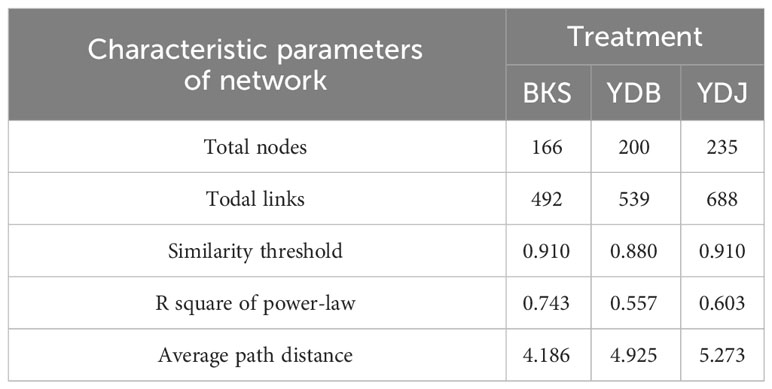
Table 4 Characteristic parameters of the molecular ecological network of soil fungi in three groups.
The total number of nodes and connections in a microbial molecular network can reflect the size of the network and the complexity of the relationships among species. This study’s BKS, YDB, and YDJ bacterial networks comprised 294, 347,319 nodes and 1420, 1265, and 1232 edges, respectively. This study’s BKS, YDB, and YDJ fungal networks contained 166, 200, and 235 nodes and 492, 539, and 688 edges, respectively. The results showed that the number of bacterial connections and total nodes and modules in BKS soil was the highest, the connectivity degree was the highest, and the interaction between species was the strongest (Figure 5). The groups of YDJ soil had the highest number of fungal connections, total number of nodes and modules, the highest connectivity degree, the most vital interaction among species, and the most complex relationship among species (Figure 6).
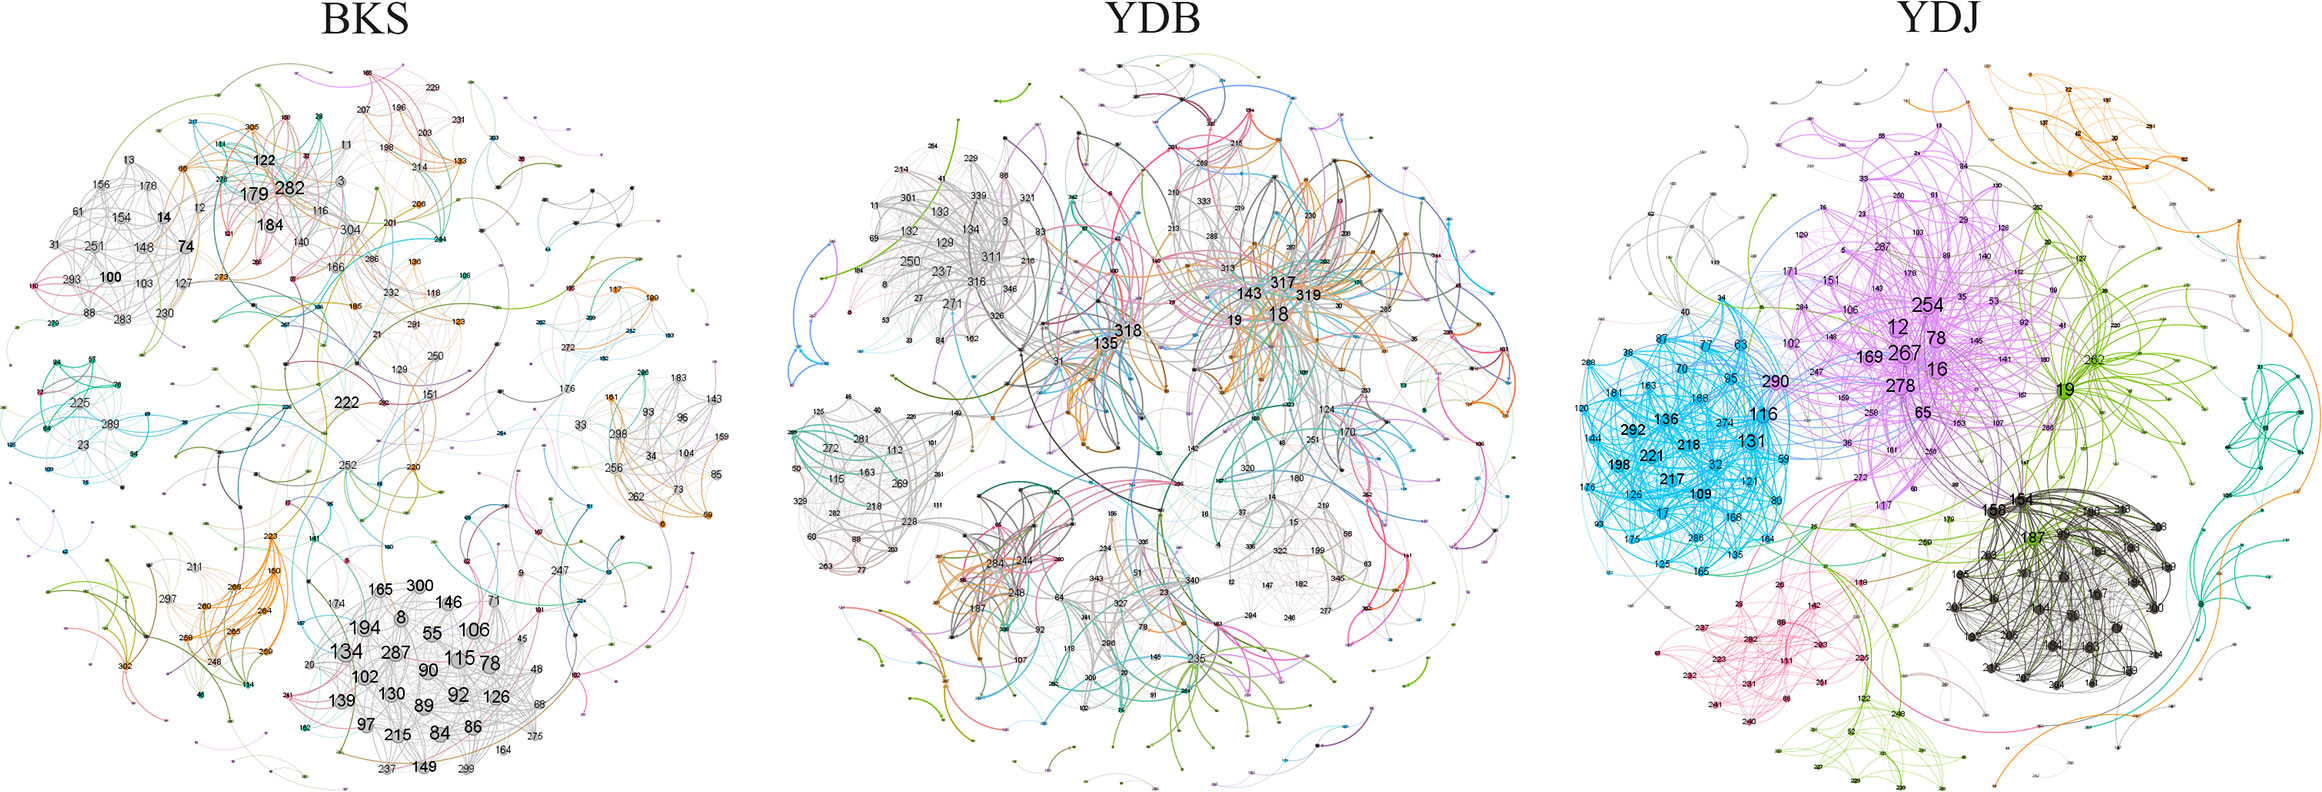
Figure 5 Molecular ecological network model of soil bacteria in different groups. Each node in the figure represents an OTU, and the lines between nodes indicate that there is a significant correlation (p < 0.05), the red lines represent positive interactions, and the green lines represent negative interactions. BKS: bare mudflat; YDB: artificial S. salsa restoration area; YDJ: natural S. salsa-growing area.
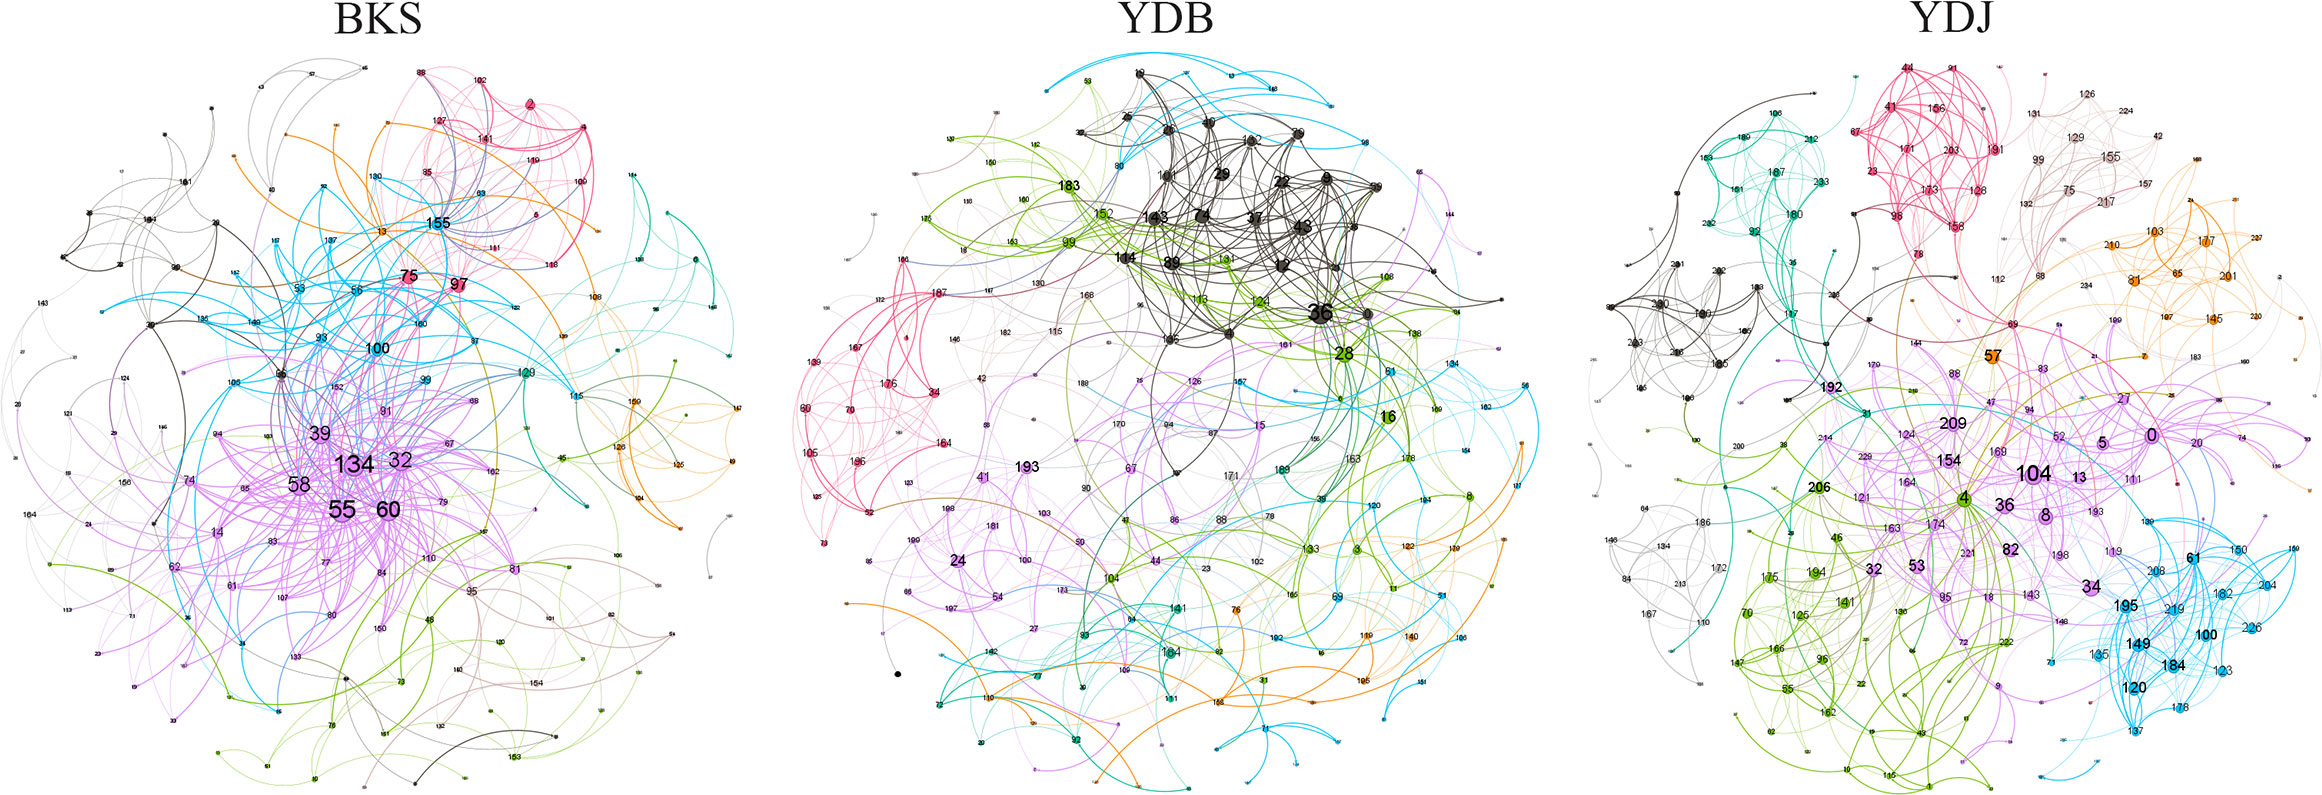
Figure 6 Molecular ecological network model of soil fungi in different groups. Each node in the figure represents an OTU, and the lines between nodes indicate that there is a significant correlation (p < 0.05), the red lines represent positive interactions, and the green lines represent negative interactions. BKS: bare mudflat; YDB: artificial S. salsa restoration area; YDJ: natural S. salsa-growing area.
3.5 Permutation multivariate analysis of variance (PERMANOVA)
R2 calculated via PERMANOVA indicates the degree of explanation of sample differences by subgroup. A larger R2 indicates a higher degree of explanation of differences by subgroup, indicating a more significant difference in subgroups. The R2 values of 0.197 (P = 0.001) in PERMANOVA for bacteria and 0.126 (P = 0.001) in PERMANOVA for fungi indicate a high and significant degree of difference among the groups (Figure 7).
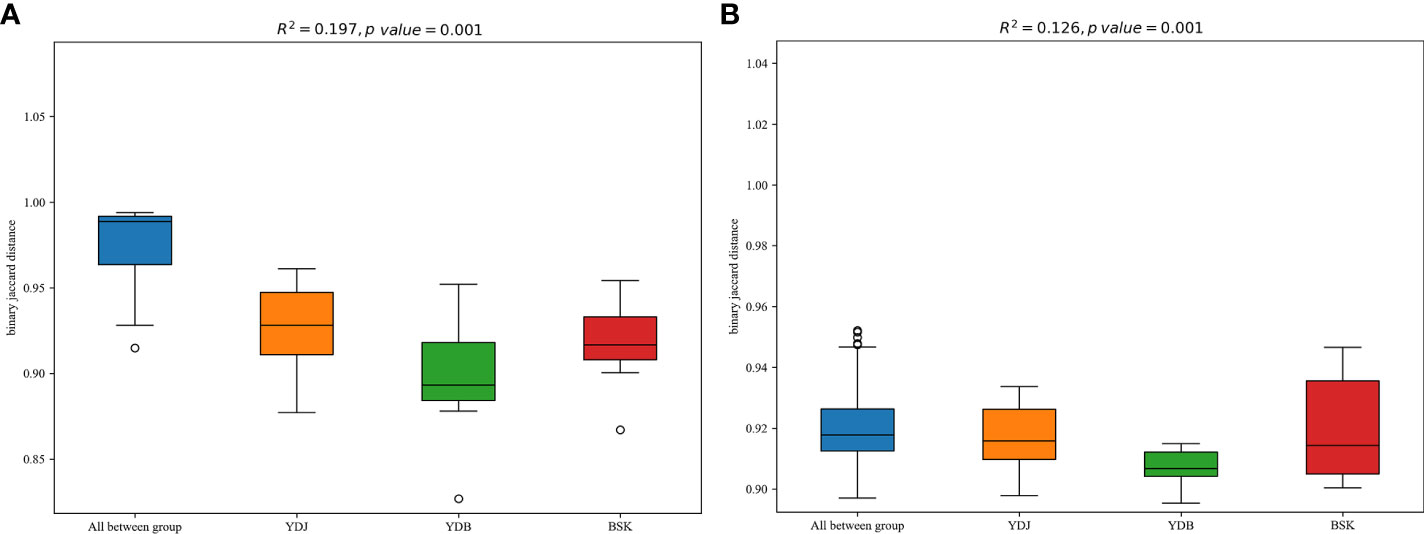
Figure 7 PERMANOVA among the different groups. (A) Soil bacteria; (B) soil fungi. BKS: bare mudflat; YDB: artificial S. salsa restoration area; YDJ: natural S. salsa-growing area.
In the present study, two soil physiochemical properties (EC and pH) of 18 samples were investigated to analyze the relationships among the groups (Figure 8). Our results found that for bacteria, pH was significantly and negatively correlated with the abundance of Acidobacteriota and Proteobacteria, whereas EC was significantly and positively correlated with the abundance of Firmicutes and negatively correlated with the abundance of Proteobacteria. For fungi, pH and EC were significantly and negatively correlated with the abundance of Chytridiomycota (Figure 9).
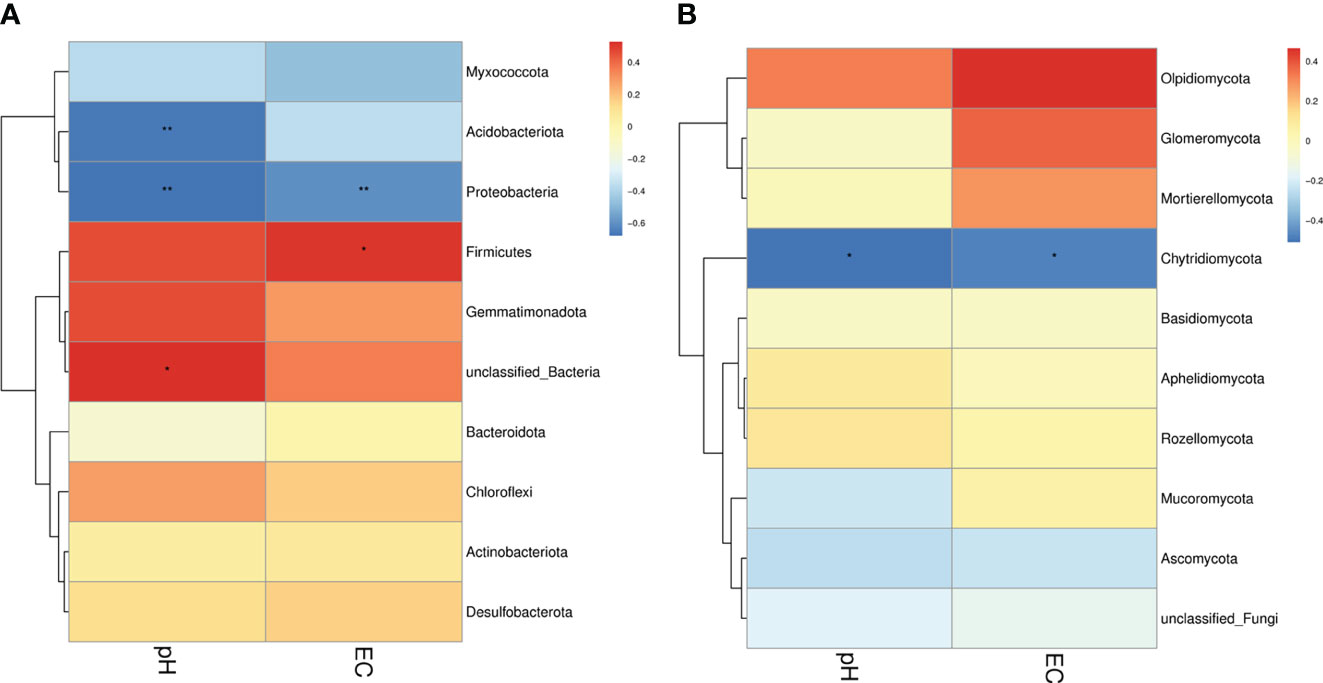
Figure 8 Correlation between soil microorganisms and soil physicochemical properties. (A) Relationship between the bacterial phylum and soil physicochemical properties. (B) Relationship between the fungal phylum and soil physicochemical properties. Different colors indicate different levels of correlation. * and ** denote statistical significance at P ≤ 0.05 and P ≤ 0.01, respectively.
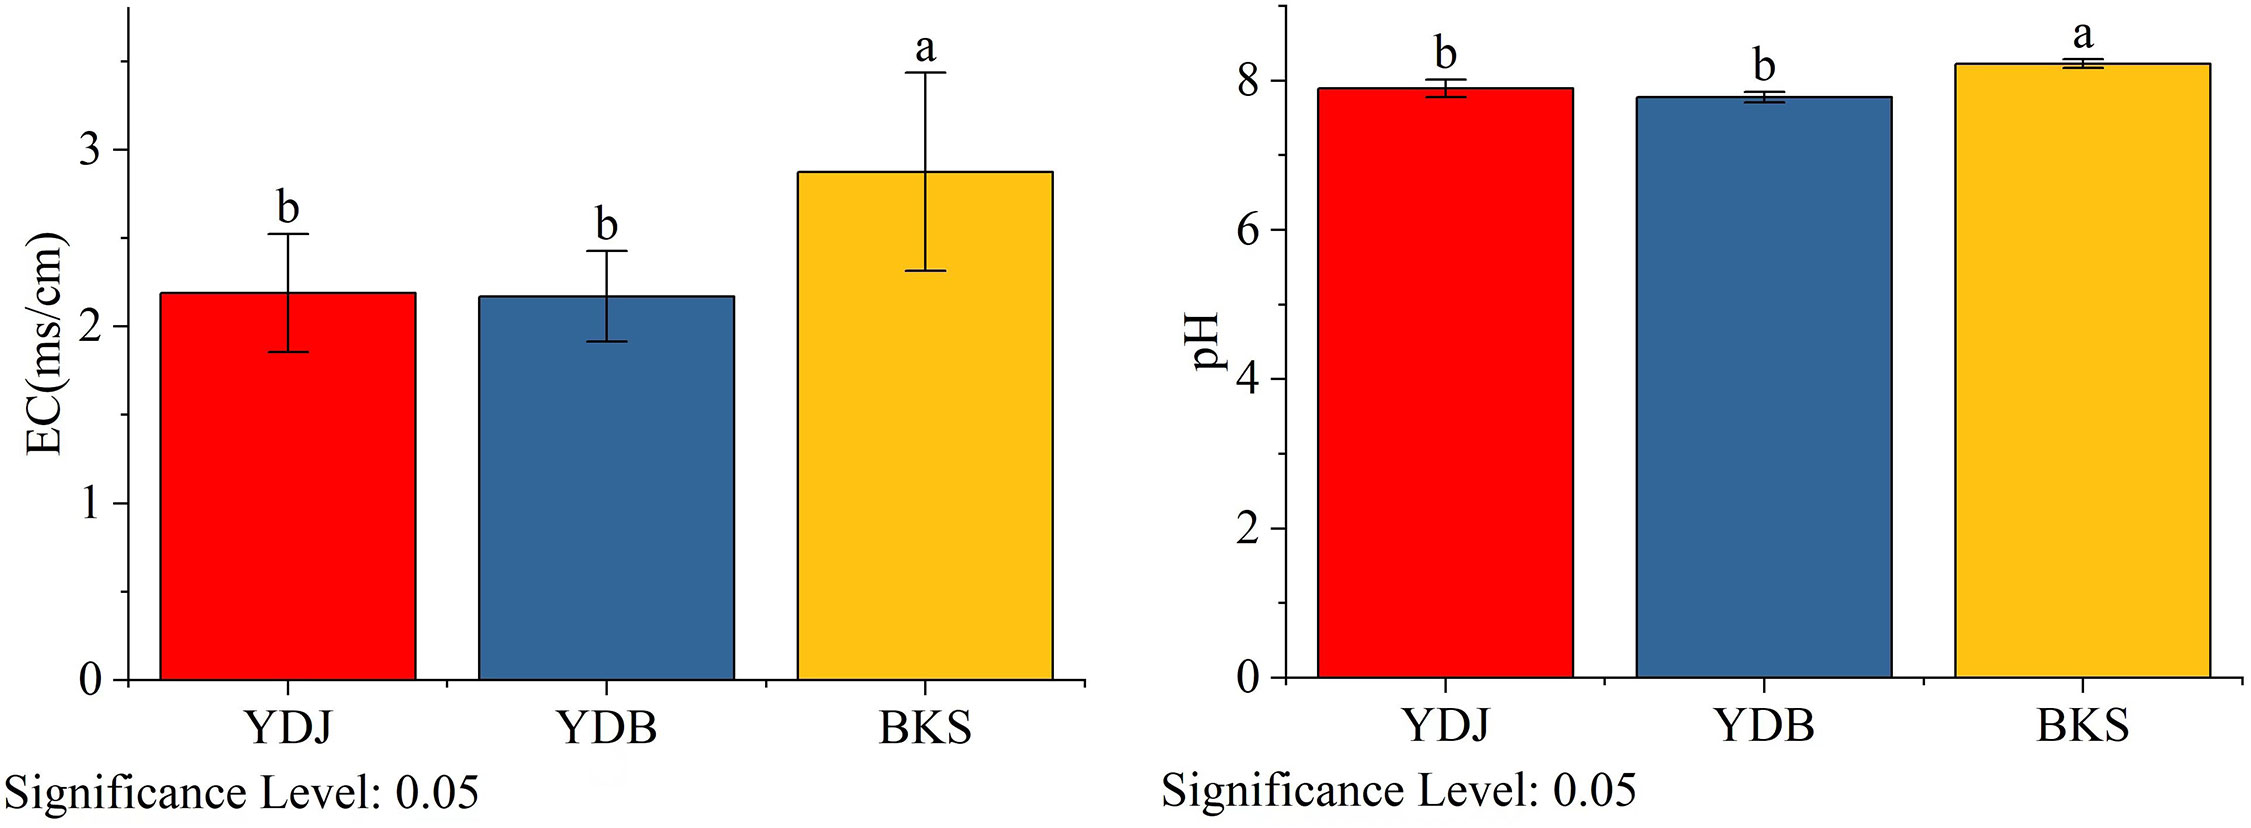
Figure 9 Analysis of soil physical and chemical properties in different groups. BKS: bare mudflat; YDB: artificial S. salsa restoration area; YDJ: natural S. salsa-growing area.
4 Discussion
Soil microorganisms are involved in several processes occurring in soil (e.g., soil energy transfer, nutrient cycling, and improvement of soil physicochemical properties). They are massive driving forces of nutrient sources and sinks in the soil ecosystem (Liang et al., 2017). They can affect humus formation, increase soil fertility, and provide nutrients to plants by decomposing organic matter (Ayangbenro et al., 2022). The formation of the rhizosphere’s microbial community is associated with plants and soil. As the primary source of rhizosphere microorganisms, plants play an important role in the stable development of rhizosphere communities (Delgado-González et al., 2022). Our results showed that most indices of microbial communities differed among the three study groups, suggesting that the existence and growth of S. salsa change microbial communities.
Regarding bacteria, the alpha diversity analysis illustrated that the abundance and diversity of soil bacteria were highest in the YDJ group. We speculated that the rhizosphere microorganisms of S. salsa in the naturally growing area had a more complex bacterial community structure. Meanwhile, fungal abundance was higher in the YDJ group than in the YDB and BSK groups, whereas fungal diversity was lower in the YDJ group than in the YDB group. The rhizosphere bacteria and fungi of S. salsa exhibited differences in complexity in the different groups. There are interactions between plants and rhizosphere bacteria. The structure of the rhizospheric microbial community is not static because it is influenced by microorganisms, host plants, and the soil environment. Therefore, the microbial community adhering to plant roots is constantly changing, thereby forming a complicated rhizospheric microbial network. The OTU results illustrated that the YDJ group had the greatest numbers of bacteria and fungi. The fungal community composition in the S. salsa rhizosphere tended to have strong similarity among the three groups, differing from the results for bacteria. The PCA results demonstrated that the YDB group had low similarity with the other two groups regarding bacterial composition. The YDJ group had low similarity with the other two groups regarding fungal composition. Some root exudates produced by plants attract fungi, bacteria, and other microorganisms in the soil to accumulate in its roots (Weidenhamer et al., 2023). These attracted microorganisms in turn promote the growth and development of the plants. Hence, the diversity of microbial communities in plant rhizosphere soil is much higher than that in nonplant rhizosphere soil.
Concerning the dominant microbial groups in the three sampling groups, Proteobacteria was the main bacterial phylum in rhizosphere soil, coinciding with the findings of previous research (Zuo et al., 2021). It can effectively promote the absorption of trace elements in soil by plants, thus enhancing the resistance of plants. Proteobacteria were also reported to play an important role in low-molecular-weight substrates in different environments (Goldfarb et al., 2011). In terms of fungi, a previous study found that Ascomycota was the predominant microflora in marine environments (Panno et al., 2013). S. salsa is mainly distributed in coastal areas, and it is deeply affected by the marine environment, which might explain the great abundance of Ascomycetes in the rhizosphere of S. salsa. The present study found that the Xeromyces were the most abundant genera in the YDJ, and the Olpidium was the most abundant genera in BKS groups. The Xeromyces can survive arid conditions and is considered one of the most adaptable species in the biological world. Previous studies found that the Olpidium species are recognized as a common fungal parasite for the roots of diverse plant species (Lay et al., 2018), while we found that the Olpidium was the most abundant genera in BKS groups. We speculated that the abundant genera of Olpidium dominant might be variations in the succession stages, and the S. salsa did not survive after the restoration (Li et al., 2023). Ecological network analysis showed that the YDJ group had the highest number of fungal connections and the most complex relationship among species. Previous studies found that higher nodes and connections indicated complex inter-species relationships and high network stability (Feng et al., 2022). The higher the soil microbial community diversity, the more stable the soil ecosystem (Feng et al., 2022). Thus, we speculated that the YDJ group had high functionality and ability to withstand external stress (Coban et al., 2022).
Our results revealed significant differences among the groups (Figure 10). A previous study found that the abundance value of biological metabolic pathways in the rhizosphere of S. salsa was higher than that in bare soil. In terms of metabolic pathway, glutathione metabolism, proteins involved in photocooperation, photosynthesis, chlorocyclohexane and chlorobenzene degradation of bacteria in rhizosphere soil were prominent, indicating that the bacterial community metabolic pathway was improved by the coverage of S. salsa (Sun et al., 2020). Regarding the top five gene families, including general function prediction, amino acid transport and metabolism, and carbohydrate transport and metabolism, genetic diversity was higher in the YDB group than in the YDJ group. Regarding translation, ribosomal structure and biogenesis, and cell wall/membrane/envelope biosynthesis, genetic diversity was higher in the YDJ group than in the YDB group.
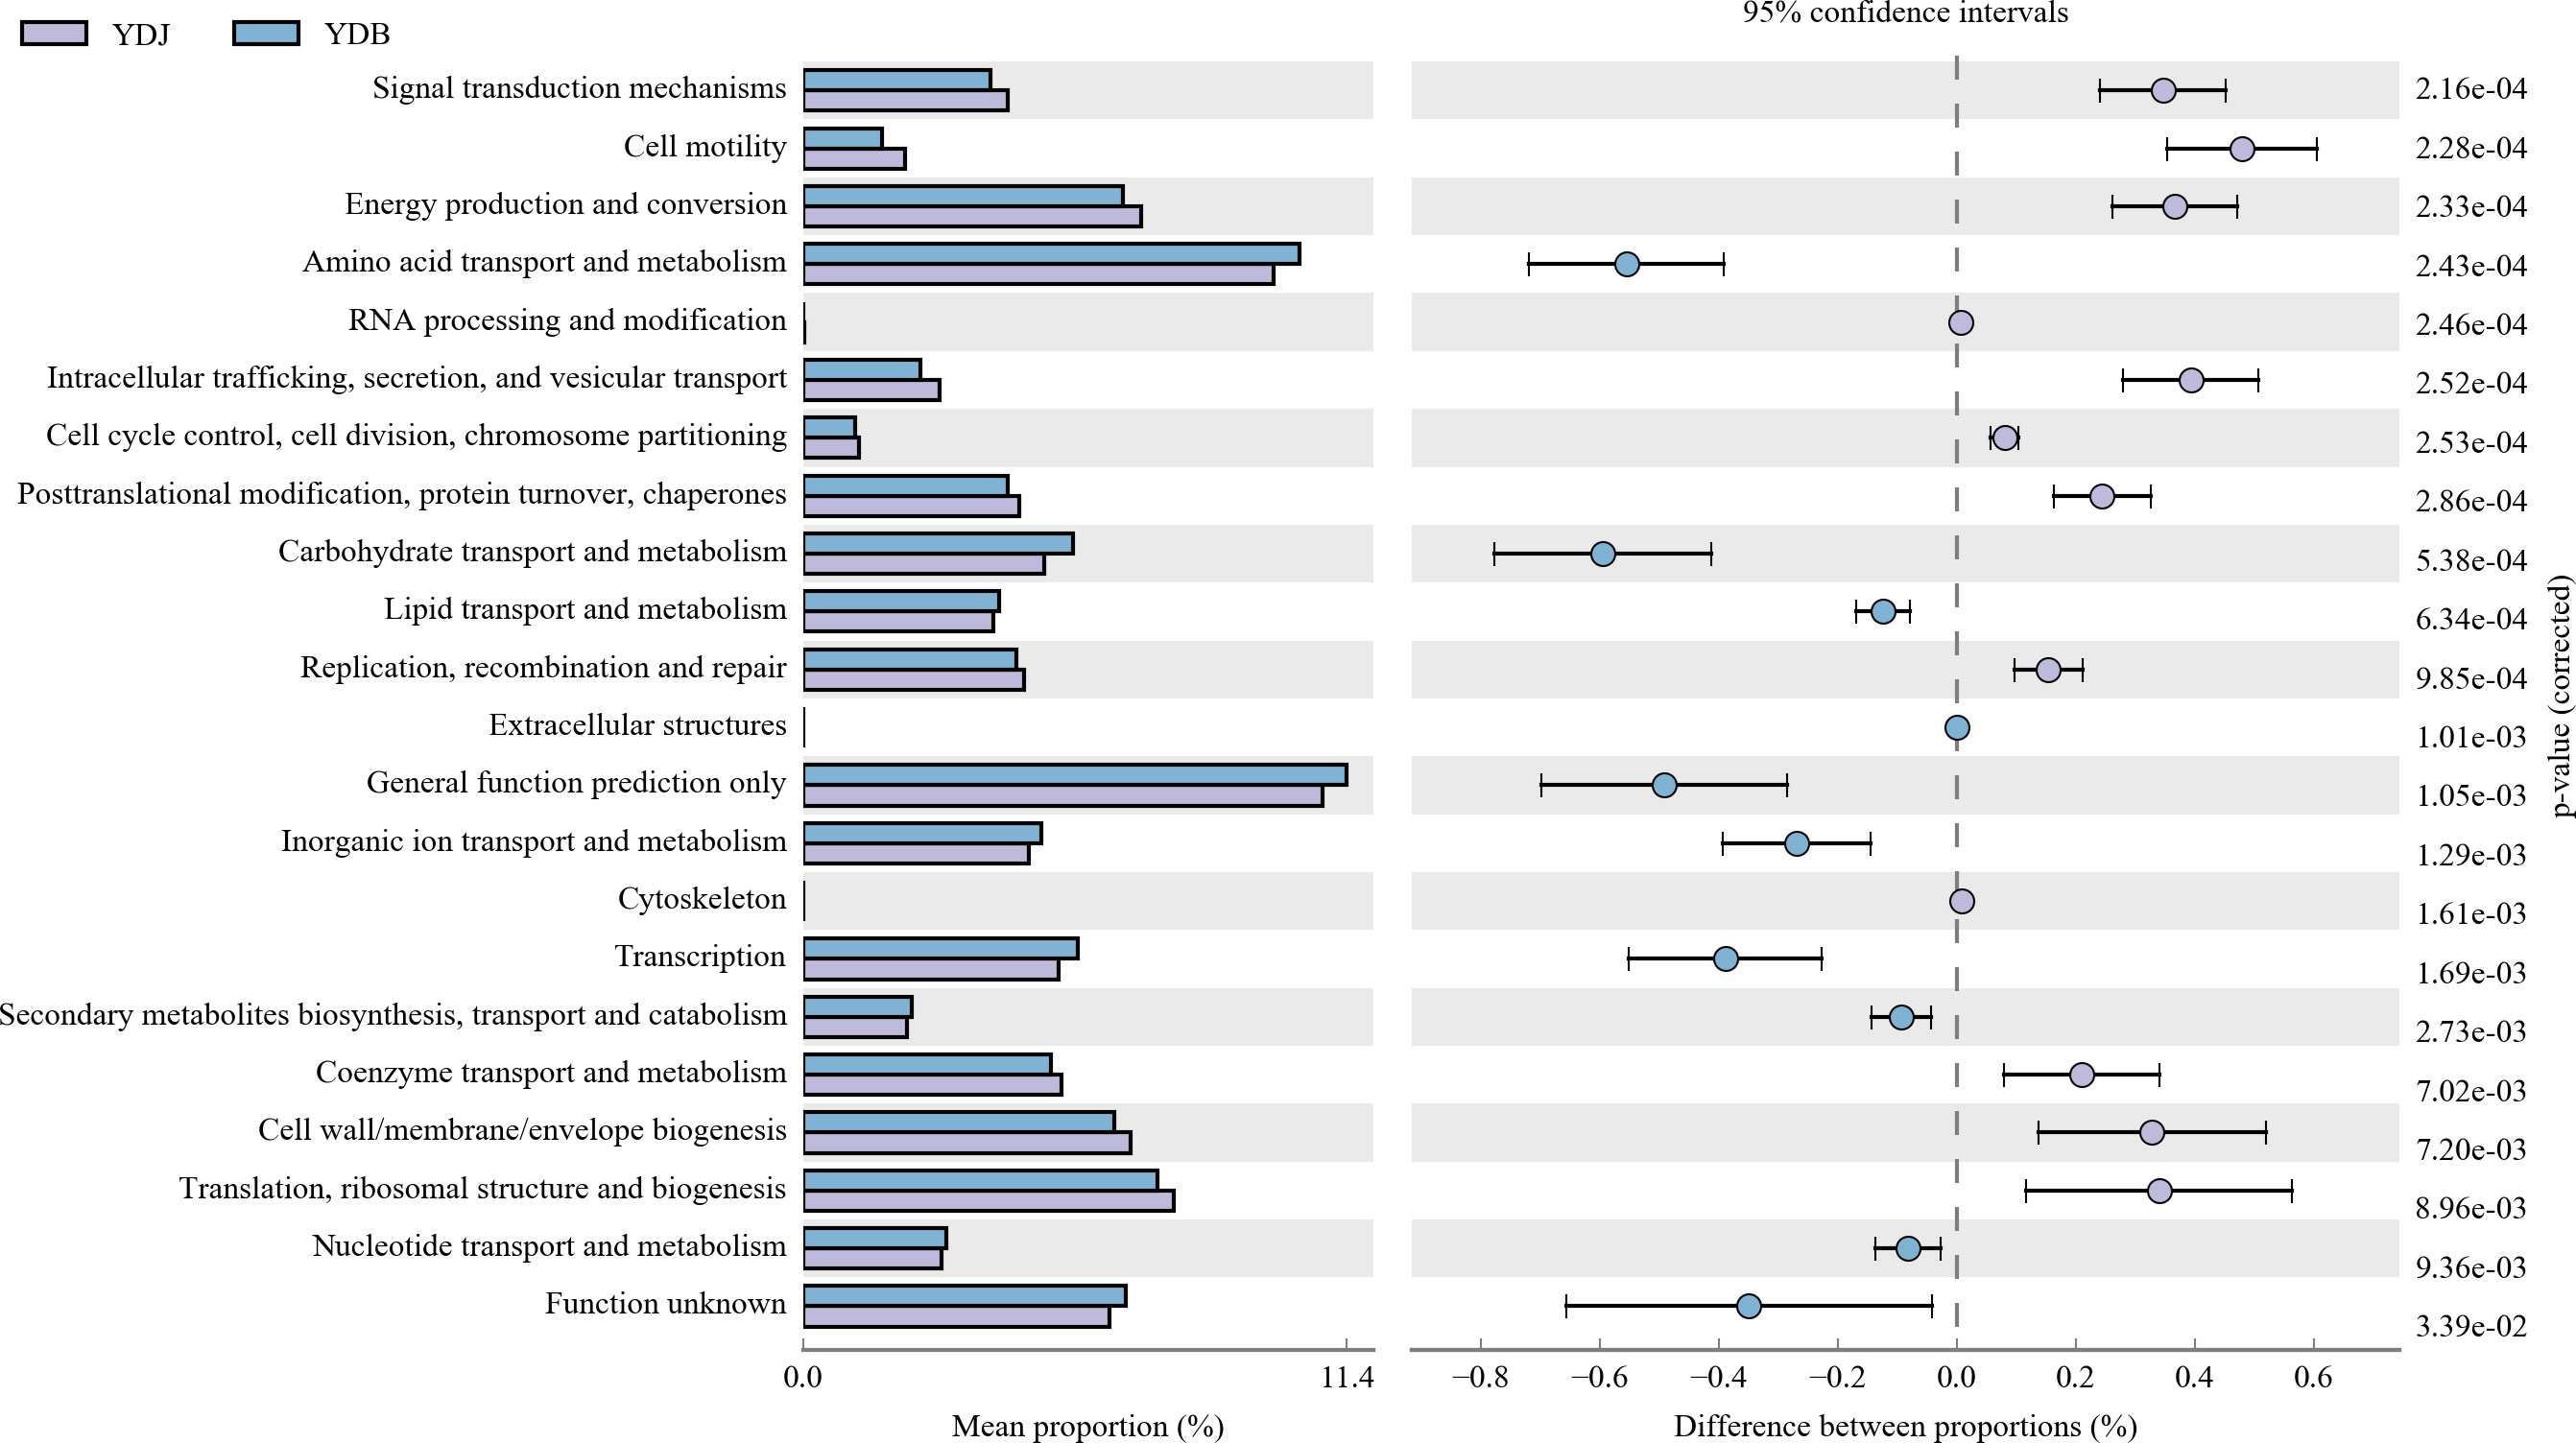
Figure 10 High relative abundance in COG functional annotation. Different colors denote different groups. Different functional parts are presented in the figure. YDB: artificial S. salsa restoration area; YDJ: natural S. salsa-growing area.
5 Conclusions
In conclusion, the S. salsa wetland in natural conditions tended to be similar to the artificial S. salsa-restoration. The composition of fungi in the S. salsa rhizosphere had greater similarities rather than that of the bacteria. Proteobacteria was observed with the highest abundance in bacterial communities, and Ascomycota, Basidiomycota, and Olpidiomycota were dominant in the fungi communities of the three groups.
Data availability statement
The datasets presented in this study can be found in online repositories. The names of the repositories and accession numbers can be found in the article.
Author contributions
HX: Writing – original draft. NL: Writing – original draft. WL: Software, Writing – original draft. HW: Writing – original draft. YS: Writing – original draft. JL: Writing – original draft. JZ: Writing – review & editing. JW: Writing – review & editing. SS: Writing – review & editing.
Funding
The author(s) declare that financial support was received for the research, authorship, and/or publication of this article. This work was supported by the Natural Science Foundation of Shandong Province (ZR2021QD082). Taishan Industrial Experts Program; Science and Technology Support Plan for Youth Innovation of Colleges and Universities in Shandong Province (2022KJ088).
Conflict of interest
The authors declare that the research was conducted in the absence of any commercial or financial relationships that could be construed as a potential conflict of interest.
Publisher’s note
All claims expressed in this article are solely those of the authors and do not necessarily represent those of their affiliated organizations, or those of the publisher, the editors and the reviewers. Any product that may be evaluated in this article, or claim that may be made by its manufacturer, is not guaranteed or endorsed by the publisher.
Supplementary material
The Supplementary Material for this article can be found online at: https://www.frontiersin.org/articles/10.3389/fevo.2024.1343672/full#supplementary-material
References
Ahkami A. H., WhiteAllen White R. A., Handakumbura P. P., Jansson C. (2017). Rhizosphere engineering: Enhancing sustainable plant ecosystem productivity. Rhizosphere. 3, 233–243. doi: 10.1016/j.rhisph.2017.04.012
Ayangbenro A. S., Chukwuneme C. F., Ayilara M. S., Kutu F. R., Khantsi M., Adeleke B. S., et al. (2022). Harnessing the rhizosphere soil microbiome of organically amended soil for plant productivity. Agronomy 12, 3179. doi: 10.3390/agronomy12123179
Bailey V. L., Fansler S. J., Smith J. L., Bolton H. (2011). Reconciling apparent variability in effects of biochar amendment on soil enzyme activities by assay optimization. Soil Biol. Biochem. 43, 296–301. doi: 10.1016/j.soilbio.2010.10.014
Bolyen E., Rideout J. R., Dillon M. R., Bokulich N. A., Abnet C. C., Al-Ghalith G. A. (2019). Reproducible, interactive, scalable and extensible microbiome data science using QIIME 2. Nat. Biotechnol. 37, 852–857. doi: 10.1038/s41587-019-0209-9
Cai F. J., Jiang F., Liu X. S., Sun K., Wang W., Zhang M. X., et al. (2021). Biochar-amended coastal wetland soil enhances growth of Suaeda salsa and alters rhizosphere soil nutrients and microbial communities. Sci. Total. Environ. 788, 147707. doi: 10.1016/j.scitotenv.2021.147707
Cai F., Pang G., Miao Y. Z., Li R. X., Li R., Shen Q. R., et al. (2017). The nutrient preference of plants influences their rhizosphere microbiome. Appl. Soil Ecol. 110, 146–150. doi: 10.1016/j.apsoil.2016.11.006
Carugati L., Gatto B., Rastelli E., Lo Martire M., Coral C., Greco S., et al. (2018). Impact of mangrove forests degradation on biodiversity and ecosystem functioning. Sci. Rep. 8, 13298. doi: 10.1038/s41598-018-31683-0
Cheng S., Yang Z., Wang M. J., Song J., Sui N., Fan H. (2014). Salinity improves chilling resistance in Suaeda salsa. Acta Physiol. Plant 36, 1823–1830. doi: 10.1007/s11738-014-1555-3
Coban O., Deyn D., Plog M. V. D. (2022). Soil microbiota as gamechangers in restoration of degraded lands. Science 375, abe0725. doi: 10.1126/science.abe0725
Delgado-González C. R., Madariaga-Navarrete A., Rodríguez-Laguna R., Capulín-Grande J., Sharma A., Islas-Pelcastre M. (2022). Microorganism rhizosphere interactions and their impact on the bioremediation of saline soils: a review. Int. J. Environ. Sci. Technol. 19, 12775–12790. doi: 10.1007/s13762-022-03930-5
Feng K., Peng. X., Zhang Z. (2022). iNAP: An integrated net-work analysis pipeline for microbiome studies. iMeta 1, e13. doi: 10.1002/imt2.13
Goldfarb K. C., Karaoz U., Hanson C. A., Santee C. A., Bradford M. A., Treseder K. K., et al. (2011). Differential growth responses of soil bacterial taxa to carbon substrates of varying chemical recalcitrance. Front. Microbiol. 2, 94. doi: 10.3389/fmicb.2011.00094
Jansson J. K., Hofmockel K. S. (2020). Soil microbiomes and climate change. Nat. Rev. Microbiol. 18, 35–46. doi: 10.1038/s41579-019-0265-7
Kim J., Kim Y., Kim Y., Kwon S., Lee S. (2009). Boosting on the functional ANOVA decomposition. Stat.]Interface 2, 361–368. doi: 10.4310/SII.2009.v2.n3.a9
Lay C. Y., Bell T. H., Hamel C., Harker K. N., Mohr R., Greer C. W. (2018). Canola root associated microbiomes in the Canadian prairies. Front. Microbiol. 9, 1188. doi: 10.3389/fmicb.2018.01188
Li Y. L., Bazghaleh N., Vail S., Mamet S. D., Siciliano S. D., Helgason B. (2023). Root and rhizosphere fungi associated with the yield of diverse Brassica napus genotypes. Rhizosphere 25, 100677. doi: 10.1016/j.rhisph.2023.100677
Li J., Zhu T., Singh B. K., Pendall E., Li B., Fang C., et al. (2021). Key microorganisms mediate soil carbon-climate feedbacks in forest ecosystems. Sci. Bull. 66, 2036–2044. doi: 10.1016/j.scib.2021.03.008
Liang C., Schimel J. P., Jastrow J. D. (2017). The importance of anabolism in microbial control over soil carbon storage. Nat. Microbiol. 2, 17105. doi: 10.1038/nmicrobiol.2017.105
Liao J. J., Dou Y. X., Yang X., An S. S. (2023). Soil microbial community and their functional genes during grassland restoration. J. Environ. Manage. 325, 116488. doi: 10.1016/j.jenvman.2022.116488
Liu F. D., Mo X., Kong W. J., Song Y. (2020). Soil bacterial diversity, structure, and function of Suaeda salsa in rhizosphere and non-rhizosphere soils in various habitats in the Yellow River Delta, China. Sci. Total. Environ. 740, 140144. doi: 10.1016/j.scitotenv.2020.140144
Martens E. C., Neumann M., Desai M. S. (2018). Interactions of commensal and pathogenic microorganisms with the intestinal mucosal barrier. Nat. Rev. Microbiol. 16, 457–470. doi: 10.1038/s41579-018-0036-x
McMurdie P. J., Holmes S. (2013). Phyloseq: an R package for reproducible interactive analysis and graphics of microbiome census data. PloS One 8, e61217. doi: 10.1371/journal.pone.0061217
Meena V. S., Meena S. K., Verma J. P., Kumar A., Aeron A., Mishra P. K., et al. (2017). Plant beneficial rhizospheric microorganism (PBRM) strategies to improve nutrients use efficiency: a review. Ecol. Eng. 107, 8–32. doi: 10.1016/j.ecoleng.2017.06.058
Panno L., Bruno M., Voyron S., Anastasi A., Gnavi G., Miserere L., et al. (2013). Diversity, ecological role and potential biotechnological applications of marine fungi associated to the seagrass Posidonia oceanica. New Biotechnol. 30, 685–694. doi: 10.1016/j.nbt.2013.01.010
Saravanakumar K., Li Y. Q., Yu C. J., Wang Q. Q., Wang M., Sun J. A., et al. (2017). Effect of Trichoderma harzianum on maize rhizosphere microbiome and biocontrol of fusarium Stalk rot. Sci. Rep. 7, 1771. doi: 10.1038/s41598-017-01680-w
Sun X., Gao C., Guo L. D. (2013). Changes in soil microbial community and enzyme activity along an exotic plant Eupatorium adenophorum invasion in a Chinese secondary forest. Chin. Sci. Bull. 58, 4101–4108. doi: 10.1007/s11434-013-5955-3
Sun J., Liu Y. H., Zuo. Y. M., Han M. L., ZHang H. W., Lyu J. J. (2020). The bacterial community structure and function of Suaeda salsa rhizosphere soil. Chin. J. Eco-Agriculture 28, 1618–1629.
Wang M. J., Qi S. Z., Zhang X. X. (2012). Wetland loss and degradation in the yellow river delta, shandong province of China. Environ. Earth Sci. 67, 185–188. doi: 10.1007/s12665-011-1491-0
Wang Y. D., Sun Q. H., Liu J. A., Wang L. S., Wu X. L., Zhao Z. Y., et al. (2022). Suaeda salsa Root-Associated Microorganisms Could Effectively Improve Maize Growth and Resistance under Salt Stress. Microbiol. Spectr. 10, 4. doi: 10.1128/spectrum.01349-22
Weidenhamer J. D., Cipollini D., Morris K., Gurusinghe S., Weston L. A. (2023). Ecological realism and rigor in the study of plant-plant allelopathic interactions. Plant Soil. 489, 1–39. doi: 10.1007/s11104-023-06022-6
Xiao N. J., Zhou A. F., Megan L., Zhou J. Z. (2022). Disentangling direct from indirect relationships in association networks. PNAS 119, e2109995119. doi: 10.1073/pnas.2109995119
Keywords: rhizosphere microorganisms, restoration, high-throughput sequencing, root, Suaeda salsa
Citation: Xu H, Li N, Li W, Wang H, Shao Y, Liu J, Zhang J, Wang J and Shang S (2024) Composition and diversity of rhizosphere microorganisms of Suaeda salsa in the Yellow River Delta. Front. Ecol. Evol. 12:1343672. doi: 10.3389/fevo.2024.1343672
Received: 24 November 2023; Accepted: 21 February 2024;
Published: 06 March 2024.
Edited by:
Fan Chen, Northwestern Polytechnical University, ChinaReviewed by:
Hao Wang, Harbin Institute of Technology, ChinaYe Yuan, Yancheng Institute of Technology, China
Copyright © 2024 Xu, Li, Li, Wang, Shao, Liu, Zhang, Wang and Shang. This is an open-access article distributed under the terms of the Creative Commons Attribution License (CC BY). The use, distribution or reproduction in other forums is permitted, provided the original author(s) and the copyright owner(s) are credited and that the original publication in this journal is cited, in accordance with accepted academic practice. No use, distribution or reproduction is permitted which does not comply with these terms.
*Correspondence: Shuai Shang, c2hhbmdzaHVhaTg5ODNAMTI2LmNvbQ==; Jun Wang, aXZ5d2FuZ2p1bkAxNjMuY29t