 João Neiva1*
 Jorge Assis1,2
 Eliza Fragkopoulou1
 Gareth A. Pearson1Peter T. Raimondi3Laura Anderson3
 Dorte Krause-Jensen4,5
 Núria Marbà6
 Andrew Want7,8Olga Selivanova9
 Masahiro Nakaoka10
 W. Stewart Grant11Brenda Konar11
 Michael Y. Roleda12,13,14Mikael K. Sejr4,5Cristina Paulino1
 Ester A. Serrão1
- 1Centre of Marine Sciences (CCMAR/CIMAR LA), Universidade do Algarve, Faro, Portugal
- 2Faculty of Bioscience and Aquaculture, Nord Universitet, Bodø, Norway
- 3Long Marine Laboratory, University of California, Santa Cruz, Santa Cruz, CA, United States
- 4Department of Ecoscience, Aarhus University, Aarhus C, Denmark
- 5Arctic Research Centre, Aarhus University, Aarhus C, Denmark
- 6Global Change Research Group, Institut Mediterrani d’Estudis Avançats (IMEDEA, CSIC-UIB), Esporles, Spain
- 7International Centre for Island Technology, Herriot-Watt University, Orkney, United Kingdom
- 8Energy and Environment Institute, University of Hull, Hull, United Kingdom
- 9Kamchatka Branch of the Pacific Geographical Institute, Far Eastern Division of the Russian Academy of Sciences (KB PGI FEB RAS), Petropavlovsk-Kamchatsky, Russia
- 10Field Science Center for Northern Biosphere, Akkeshi Marine Station, Akkeshi, Japan
- 11College of Fisheries and Ocean Sciences, University of Alaska Fairbanks, Juneau, AK, United States
- 12Department of Algae Production, Norwegian Institute of Bioeconomy Research (NIBIO), Ås, Norway
- 13Division of Food Production and Society, Norwegian Institute of Bioeconomy Research (NIBIO), Bodø, Norway
- 14The Marine Science Institute, College of Science, University of the Philippines, Quezon City, Philippines
Amphiboreal taxa are often composed of vicariant phylogroups and species complexes whose divergence and phylogeographic affinities reflect a shared history of chronic isolation and episodic trans-Arctic dispersal. Ecological filters and shifting selective pressures may also promote selective sweeps, niche shifts and ecological speciation during colonization, but these are seldom considered at biogeographical scales. Here we integrate genetic data and Ecologic Niche Models (ENMs) to investigate the historical biogeography and cohesion of the polymorphic rockweed Fucus distichus throughout its immense amphiboreal range, focusing on trans-Arctic asymmetries, glacial/interglacial dynamics, and integrity of sympatric eco-morphotypes. Populations were sampled throughout the Pacific and the Atlantic, from southern rear-edges to the high-Arctic. They were genotyped for seven microsatellites and an mtDNA spacer, and genetic diversity and structure were assessed from global to local scales. ENMs were used to compare niche divergence and magnitude of post-glacial range shifts in Pacific versus Atlantic sub-ranges. Haplotypic and genotypic data revealed distinct and seemingly isolated Pacific vs Arctic/Atlantic gene-pools, with finer-scale regional sub-structuring pervasive in the Pacific. MtDNA diversity was highly structured and overwhelmingly concentrated in the Pacific. Regionally, Alaska showed the highest intra-population diversity but the lowest levels of endemism. Some sympatric/parapatric ecotypes exhibited distinct genotypic/haplotypic compositions. Strikingly, niche models revealed higher Pacific tolerance to maximum temperatures and predicted a much more consolidated presence in the NE Atlantic. Glacial and modern ranges overlapped extensively in the Pacific, whereas the modern Atlantic range was largely glaciated or emerged during the Last Glacial Maximum. Higher genetic and ecogeographic diversity supports a primary Pacific diversification and secondary Atlantic colonization, also likely reflecting the much larger and more stable climatic refugia in the Pacific. The relic distribution and reduced ecological/morphological plasticity in the NE Atlantic are hypothesized to reflect functional trans-Arctic bottlenecks, recent colonization or competition with congeners. Within the Pacific, Alaska showed signatures of a post-glacial melting pot of eastern and southern populations. Genetic/ecotypic variation was generally not sufficiently discontinuous or consistent to justify recognizing multiple taxonomic entities, but support a separate species in the eastern Pacific, at the southern rear-edge. We predict that layered patterns of phylogeographic structure, incipient speciation and niche differences might be common among widespread low-dispersal amphiboreal taxa.
Introduction
Following the first opening of the Bering Strait at the end of the Miocene some 5 Ma ago, trans-Arctic interchanges have been regularly occurring between Pacific and Atlantic biotas (Lindstrom, 2001; Dodson et al., 2007; Nikula et al., 2007; Cánovas et al., 2011; Hardy et al., 2011; Saunders and McDevit, 2013). Throughout the long Pleistocene glaciations (starting 2.5 Ma), however, the Arctic basin and adjacent continents and shorelines were covered with perennial ice-sheets, ice-shelves and sea-ice, making them uninhabitable to coastal species (Dunton, 1992; Kaufman et al., 2004; Laakkonen et al., 2013; Neiva et al., 2018). Because of lowered sea-levels (down to −130 m; Pico et al., 2020), the Bering Strait (currently at −50 m) was also a terrestrial bridge connecting the Eurasian and American continents (Beringia). During interglacial periods, marine transgressions and seasonally ice-free marine routes briefly resume Pacific/Atlantic oceanographic connections (Dunton, 1992), but for most organisms and for most of the time, the Arctic environment remains a formidable dispersal barrier. Accordingly, most amphiboreal taxa include vicariant phylogroups and species complexes whose systematic and biogeographic affinities reflect such shared history of episodic dispersal against a general background of trans-Arctic isolation (Carr et al., 2011; Halanych et al., 2013; Neiva et al., 2018).
Past the Bering Strait and along marine Arctic routes, key traits (e.g. dispersal ecology, ability to survive extreme Arctic conditions), together with sweepstake events and historical processes, ultimately determine the pool and colonization dynamics of migrants (Hardy et al., 2011). At infra-specific levels, extreme founder events, genetic surfing, priority effects and selective filters are also predicted to result in important trans-Arctic genetic bottlenecks, but these have seldom been assessed. In the absence of detailed fossil records, species origins have been established under the assumption that older ranges contain higher and more deeply structured genetic diversity than recently colonized ranges (Wares and Cunningham, 2001; Bringloe and Saunders, 2018). Differences need careful interpretation, however, as they may also reflect long-term differences in habitat availability and connectivity (e.g. larger climatic refugia, sensu Neiva et al., 2014) between ocean basins.
Many low-dispersal marine species, notably macroalgae, show important intra-specific geographic trait variation, for instance in physiological tolerance to thermal stress (Mohring et al., 2014; Saada et al., 2016; Smolina et al., 2016; King et al., 2018; Liesner et al., 2020), that should also not be overlooked in historical contexts of colonization. If a locally-adapted regional population is the sole source in a long-distance colonization pulse, realized niche/distribution in the establishing range could potentially be a fraction of that in the original range (Holt, 2009). In the longer-term, chronic isolation and different selective pressures and environments may also promote niche shifts through allopatrically evolved environmental tolerances (e.g. thermal adaptation, fundamental niche shifts) or release/introduction to new biotic constraints (e.g. competition or predation, realized niche shifts) (Wiens and Graham, 2005; Mitchell et al., 2006). In a range of invertebrate taxa, correlative models show that (realized) niche differences between eastern Atlantic (putative source) and western Atlantic (putative post-glacial colonization) populations can be negligible (Waltari and Hickerson, 2013). It remains unassessed, however, whether niche conservatism holds for older vicariant taxa, or for highly structured marine species whose “global” niche contains distinct evolutionary lineages and multiple specialized niches among local populations.
Glacial–interglacial cycles also fuel important range shifts and dissections within oceanic basins. At peripheral range margins, populations and their genetic variation are periodically erased during glacial (high-latitude) and warmer interglacial (low-latitude) extremes. These are often associated with asynchronous range expansions (e.g. post-glacial northward colonizations) at opposite distributional boundaries (Assis et al., 2018a; Neiva et al., 2016). At more temperate latitudes, disconnected refugia may allow vicariant subpopulations to persist in the long-term, often producing divergent phylogeographic lineages. During climatic shifts, lineage redistributions lead to secondary contacts, with subsequent outcomes ranging from widespread admixture to stable genetic sectors depending on species dispersal potential and population dynamics. Among low dispersers, genetic breaks can be surprisingly sharp and stable, particularly when large habitat or oceanographic discontinuities, selfing, and strong density-barrier effects are involved (Fraser et al., 2009; Neiva et al., 2012a, 2016, 2018; Assis et al., 2016, 2018b). The stable co-existence of different lineages, particularly when matching distinct morphologic and ecotypic entities, often indicates partial to complete isolation (Tellier et al., 2011; Montecinos et al., 2012; Neiva et al., 2018).
The rockweed Fucus distichus Linnaeus 1767 (Fucales, Ochrophyta) is one of the most widespread, polymorphic and ecologically plastic members of the northern hemisphere amphiboreal marine biota (Powell, 1963; Kucera and Saunders, 2008). This seaweed is the only member of the family Fucaceae occurring on both sides of the Pacific and the Atlantic, and the one extending deepest into the Arctic. Its wide distribution and ecotypic variation have led to the use of multiple taxonomic entities, particularly in the Atlantic (reviewed in Powell, 1957, Powell, 1963). Despite morphological plasticity and even broader range of coastal and estuarine habitats (Kucera and Saunders, 2008; Neiva et al., 2012b), all forms in the NE Pacific were lumped into a single geographical taxon, F. gardneri P.C. Silva 1953. Molecular work has established the monophyly of F. distichus sensu lato and its affinity to F. serratus, but so far has consistently failed to resolve any ecotypic/geographic entity as separate species (Serrão et al., 1999; Coyer et al., 2006, 2011b; Kucera and Saunders, 2008; Cánovas et al., 2011; Laughinghouse et al., 2015). Some degree of phylogeographical structure was apparent though, e.g. discriminating Pacific vs Arctic/Atlantic ranges, with higher diversity suggesting a Pacific origin for the taxa.
Fucus distichus is regarded as a cold-adapted taxon, particularly in the Atlantic. The species undeniably thrives throughout Arctic latitudes, withstanding long periods of freezing low-light conditions and intense ice-scouring (Laughinghouse et al., 2015; Jueterbock et al., 2016). Its distribution however can extend considerably towards more temperate latitudes. In the NW Atlantic it reaches Massachusetts (Ester Serrão, personal observations) and in the NW Pacific it reaches the northern parts of the Sea of Japan (Yamada, 1980; Chernova, 2016), both around ca. 41–42° Lat. By comparison, in the NE Atlantic F. distichus (var. anceps only) occurs as small disconnected populations restricted to very exposed sites only as far south as western Ireland (ca. 52° Lat., Powell, 1957). In the NE Pacific, F. distichus occurs much farther south, almost reaching Point Conception in Central California (ca. 34.5° Lat., present study), suggesting potential niche(s) differences (or niche filling) across disparate oceanic regions.
Incomplete geographic sampling and/or low marker resolution (e.g. IGS/cox1 SSCP genotyping, Coyer et al., 2011b) have so far hindered a full appreciation of the global diversity within the F. distichus complex. The NE Pacific coast, particularly California, has never been adequately surveyed, but is hypothesized to represent a genetically-unique, rear-edge climatic refugium as in related Pelvetiopsis for which it is a center of relic biodiversity and evolutionary novelty (Neiva et al., 2017; Sousa et al., 2019). Regional phylogeographic breaks and “melting pots” resulting from post-glacial extinction/expansion dynamics and secondary contacts are also expected to have formed throughout the North Pacific and potentially in the high Arctic, but have never been adequately investigated. Finally, the co-occurrence of distinct eco-morphotypes in many shorelines (e.g. Pearson and Brawley, 1996) raises inevitable but still unanswered questions regarding potential isolating barriers and incipient speciation.
This study uses phylogeographic (mtDNA, microsatellites) and niche-modelling approaches to investigate the biogeographical history, phylogeographic structure and cohesion of polymorphic F. distichus at multiple spatial scales throughout its immense amphiboreal range. A range of related topics are examined, including 1) trans-Arctic dispersal/vicariance history, including putative origins and modern contacts; 2) potential trans-Arctic genetic/eco-geographic asymmetries; 3) signatures of potential southern hot-spots vs high-latitude melting pots; and 4) the genetic integrity of local (sympatric/parapatric) eco-types.
Materials and methods
Global phylogeography and population structure
Populations of F. distichus were sampled on both sides of the Pacific and the Arctic/Atlantic, including the understudied California rear-edge, the trans-Pacific Aleutian Arc, and the Greenland coast. At each site, tissue samples (16 < n < 24) were, whenever possible, collected every other meter along linear transects. Multiple collections were obtained at specific sites (Maine, California, Alaska) where locally distinct eco-morphotypes and/or discontinuous tidal heights were apparent. Genomic DNA was extracted from silica-dried tissue using the Nucleospin 96 Plant II kit (Macherey-Nagel, Germany). Twenty microsatellite loci previously developed for other Fucus species (Engel et al., 2003; Wallace et al., 2004; Perrin et al., 2007; Coyer et al., 2009) were amplified in a geographically diverse panel of populations to assess cross-amplification success and levels of polymorphism (data not shown). The seven most polymorphic microsatellites were selected and used to generate multi-locus genotypes for all individuals of F. distichus (see Supplementary Table S1 for details). The 23S/trnK mitochondrial intergenic spacer (mtIGS, a marker with good phylogeographic resolution in Fucus; Neiva et al., 2010, 2014; Coyer et al., 2011a; Laughinghouse et al., 2015), was screened in the same populations. Amplified fragments were run in an ABI PRISM 3130xl automated capillary sequencer (Applied Biosystems) at CCMAR, Portugal. Microsatellite alleles were manually scored in STRAND (Veterinary Genetics Laboratory, University of California, Davis; http://www.vgl.ucdavis.edu/STRand) using the 500 LIZ size standard (Applied Biosystems). Sequences were aligned and edited with GENEIOUS 4.8 (Biomatters; http://www.geneious.com).
For microsatellite data, summary statistics of genetic diversity (allele frequency, mean allelic richness [A], unbiased gene diversity [HE], observed heterozygosity [HO] and inbreeding coefficients [FIS]) were calculated with GENETIX 4.05 (Laboratoire Génome, Populations, Interactions, Université de Montpellier II; http://kimura.univ-montp2.fr/genetix) and the R package standArich v1.0 (available at http://alberto-lab.blogspot.pt/p/code.html). Pairwise population differentiation (Jost’s D, Weir and Cockerham’s Θ) was calculated with the R package DiveRsity 1.9 (Keenan et al., 2013). Genetic structure was analyzed at multiple spatial scales with STRUCTURE 2.3 (Pritchard Lab, Stanford University; http://pritchardlab.stanford.edu/structure.html) without prior population assignments. A range of assumed population cluster size (K, set sequentially from 1 to 8–12, depending on the analyses) was run 5 times using a burn-in of 500 000 iterations and a run-length of 1 × 10⁶ iterations, using the ΔK criterion (Evanno et al., 2005) to assist selection of “best” Ks. Structure analyses were complemented with factorial correspondence analyses (FCA) implemented in GENETIX.
The genealogic relationships among mtIGS haplotypes were inferred with Network 5 (Fluxus-Engineering; http://www.fluxus-engineering.com/sharenet.htm) using the median-joining algorithm, and their geographic distribution and frequency mapped. Haplotype (Hhap)and nucleotide (Θπ) diversities were estimated for each population and selected geographical regions using DNASP 6 (Julio Rozas Lab, Universitat de Barcelona; http://www.ub.edu/dnasp/), the former coding indels as single mutations and the latter discarding indels in pair-wise comparisons only.
Ecological niche modelling
Ecological niche models (ENMs) were developed with Boosted Regression Trees (BRT; Elith et al., 2008), a high-performance machine learning algorithm that automatically fits complex interactions and nonlinear relationships between predictor variables, while reducing the potential of overfitting by forcing monotonicity responses (Hofner et al., 2011) and by optimal parametrization (Elith et al., 2008). The algorithm fitted georeferenced records of occurrence against biologically meaningful predictor variables for macroalgae species (Fragkopoulou et al., 2022), namely, nutrients (as nitrate and phosphate), salinity, sea ice thickness and maximum winter and summer sea surface temperatures.
Occurrence records of F. distichus were collated from the fine-tuned dataset of marine forests (Assis et al., 2020) which integrates data from different sources (e.g. databases, literature and herbaria) and uses a flagging system to exclude potentially erroneous entries (e.g. records outside known biogeographical ranges). Because absence records were unavailable at the scale of the study, pseudo-absences were randomly generated using a 1:1 ratio with presence records, in locations with no presences recorded (Barbet-Massin et al., 2012) and limited to the biogeographical provinces (Spalding et al., 2007) where the species is known to occur, as well as their neighboring provinces. This allowed restricting pseudo-absences to regions where dispersal can potentially occur, a crucial step of ENM (Martins et al., 2021). The negative effects of spatial autocorrelation and sampling bias (e.g. regional differences in density of records) were further reduced by randomly choosing one record only from those at distances considered significantly autocorrelated, as estimated by a correlogram testing the spatial variability of predictors as a function of geographic distance (Boavida et al., 2016). Predictor variables describing sea surface conditions were obtained from Bio-ORACLE v2.1 (Assis et al., 2018c; Tyberghein et al., 2012) for near present-day conditions and for the Last Glacial Maximum (LGM).
A cross-validation (CV) framework using 10-fold latitudinal bands was implemented to tune the optimal parameter combination of BRT and to estimate the performance of the models and their potential transferability in independent data (Assis et al., 2018a; Krause-Jensen et al., 2020; Fragkopoulou et al., 2021). The “grid search” statistical method interactively tested all possible numbers of trees (range 50–1000, step 50), tree complexity (range 1–6, step 1) and learning rate (0.01, 0.005 and 0.001), by fitting occurrence records with all but one latitudinal band at a time. At each step, performance was estimated with the area under the curve (AUC). The best combination of BRT parameters was identified as that resulting in models with higher AUC in CV (Assis et al., 2018a; Krause-Jensen et al., 2020; Fragkopoulou et al., 2021). Overfitting was further controlled by forcing monotonic responses based on the expected biological effect of predictors (positive or negative) on the probability of occurrence (Hofner et al., 2011). Maximum temperatures and ice fitted negative monotonic responses, whereas nutrients and salinity fitted positive responses (e.g. Assis et al., 2018a; Fragkopoulou et al., 2021; Martins et al., 2021; Krause-Jensen et al., 2020).
ENM were performed using two approaches: (1) species modelling considering the entire amphiboreal range and (2) sub-taxon modelling (i.e. within-taxon niche structure; Assis et al., 2016), using distinct models for the Pacific and Arctic/Atlantic ranges where differences in evolutionary history, genetic composition and diversity were apparent (see results and discussion sections). Habitat suitability maps for the present and the LGM were produced with a BRT model using the optimal parameters found in CV. These maps were further reclassified to presence and absence (binomial responses) using a threshold maximizing specificity (true negative rate) and sensitivity (true positive rate; Jiménez-Valverde and Lobo, 2007).
Niche overlap between the Pacific and Arctic/Atlantic ranges was estimated with the Bayesian framework of Swanson et al. (2015). This defines the niche of each range as the 95% probability region of the multivariate environmental space defined by ENM, and determined overlap as the probability of an individual from the Pacific being found in the niche of Arctic/Atlantic, and vice-versa. Additionally, physiological tolerance limits for the Pacific and Arctic/Atlantic ranges were captured from partial dependence functions (Elith et al., 2008).
Results
Genetic analyses
A total of 31 collections of Fucus distichus (590 individuals) were sampled from 16 Pacific and 10 Arctic/Atlantic sites (Table 1), covering most of the species range in the northern hemisphere. Collections from Alaska (Pirates, Kayak) and Oregon (Bob Creek) contained a few F. spiralis L. that were easily recognizable genetically and that were excluded from analyses. Microsatellite polymorphism (fallele > 0.005) ranged between 2 and 13 alleles per locus, averaging 6.14. A total of 38 mtIGS haplotypes were detected among the 470 individuals sequenced (Table 1; Figure 1; Supplementary Table S2). A subset of 16 haplotypes (≈42%) accounted for almost 90% of the sequences, while another 14 were sampled only once. Several indels of variable size were apparent (Figure 1). Genetic diversity within populations was typically low (A ≤ 3.2; HE ≤ 0.41, mean nhap ≈ 2.15), as most populations were monomorphic (or nearly fixed) at several loci (Supplementary Figure S1, Supplementary Table S2). Nearly all populations exhibited significant heterozygote deficits. Avacha Bay (pop. 23), the only populations showing fixed heterozygosity at locus Fg25 (and hence anomalous positive FIS values), also exhibited significant heterozygote deficit when the putative duplicated locus was removed from analyses (data not shown).

Table 1 Geographic origins and genetic diversities of samples of Fucus distichus.
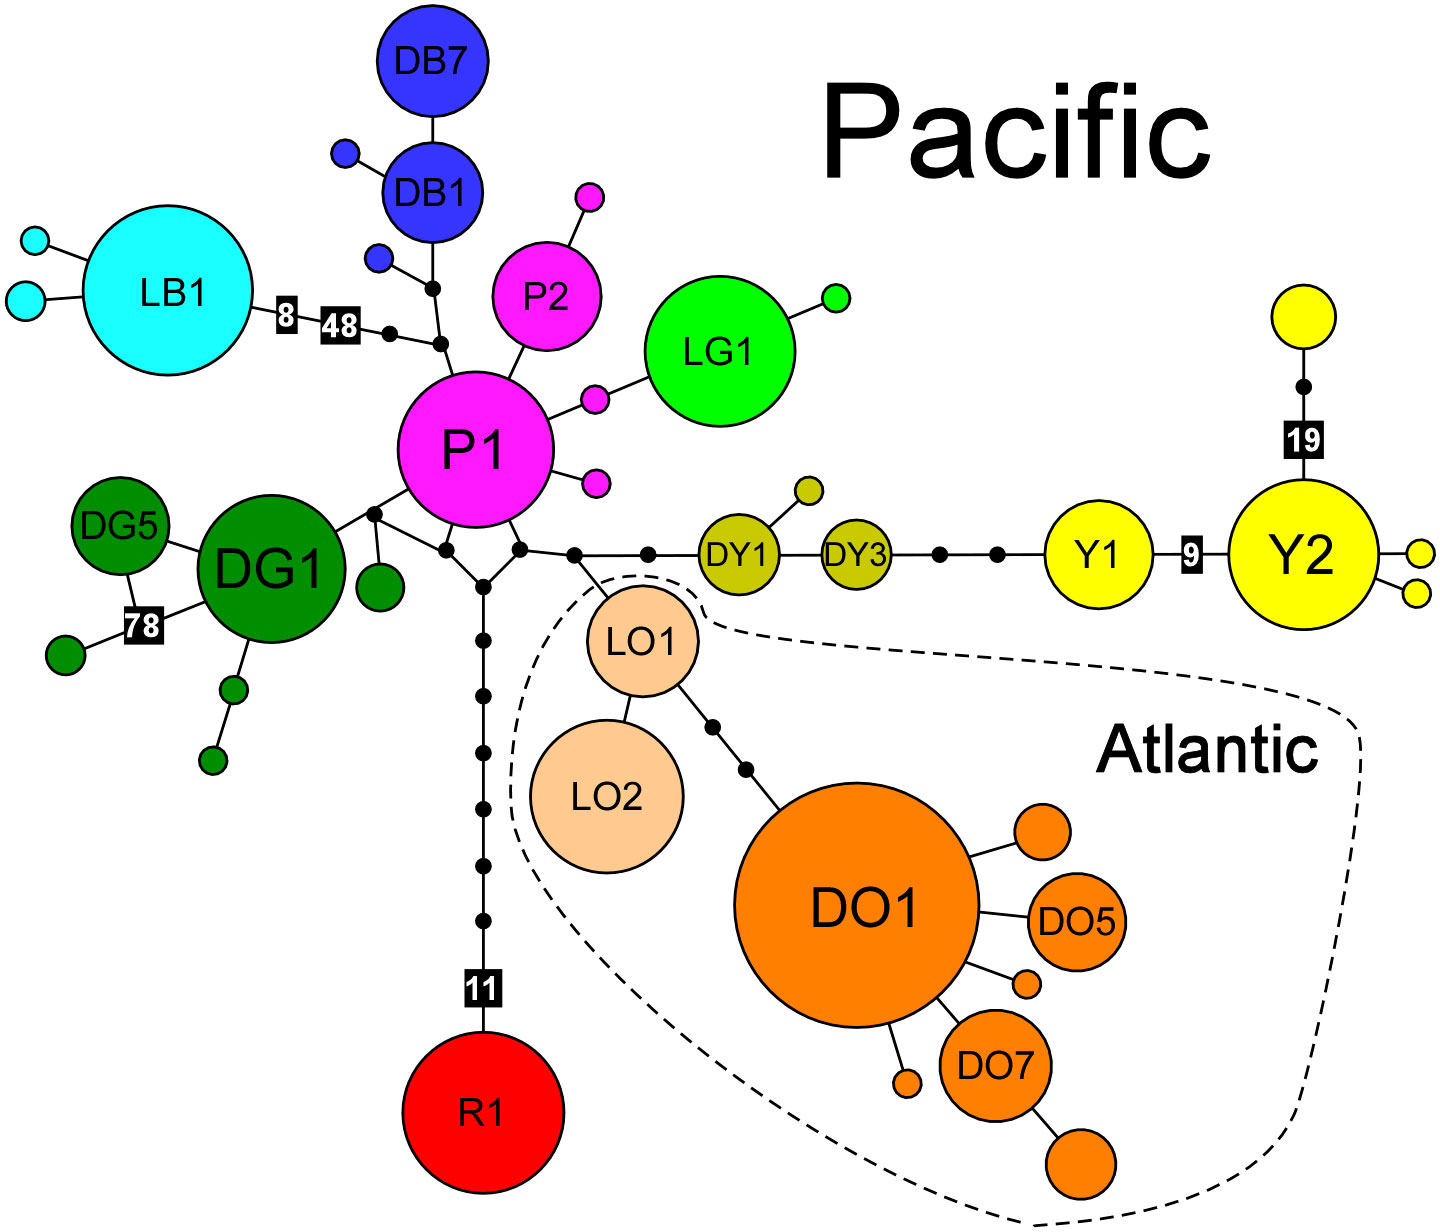
Figure 1 MtIGS haplotype network of Fucus distichus. Different colours and letter codes depict different inferred phylogeographic groups (haplogroups). Haplotypes are represented by circles sized to their frequency. Black dots represent inferred, unsampled haplotypes, whereas black boxes represent indels of variable size. Haplotype labels correspond to haplotype designation in Table 1.
F. distichus exhibited strong phylogeographic structure. MtIGS haplotypes (Genbank accession numbers PP358930–PP359399) formed a complex network of shallow haplotypic radiations corresponding to at least 10 major genetic/geographic discontinuities (Figures 1, 2). Eight of these were endemic to the Pacific and 2 were endemic to the Arctic/Atlantic, i.e. they were never found together. Atlantic haplogroups were genealogically close and they were not more differentiated from Pacific haplogroups than different Pacific haplogroups were between them. Haplogroup DO was widespread throughout both sides of the Atlantic and in the Arctic (encompassing samples originally assigned to F. distichus s.s., F. anceps, F. edentatus and F. evanescens), whereas haplogroup LO was restricted to the cold-temperate NW Atlantic (Maine and Newfoundland, Figure 2A). In Maine (populations 4 and 5), these haplogroups matched two regionally parapatric eco-types – LO corresponding to smaller forms from high-intertidal rock-pools (F. distichus s.s.-like) and DO to larger forms from the low intertidal (F. evanescens-like, Figure 2B, top right). In the NW Pacific and western Aleutians (Adak, pop. 22) only the P, DY (endemic) and Y (shared with Alaska) haplogroups were sampled. All 9 haplotypes detected there were endemic to the region and the majority was restricted to specific populations (Table 1; Supplementary Table S2). The remaining 5 haplogroups were restricted to the NE Pacific (Figure 2A). The LB, DB and DG haplogroups were present in the Mendocinian and Alaska regions, extending into the eastern Aleutians (Unalaska, pop. 21). In the Mendocinian region each haplogroup dominated successively short stretches of coastline, whereas in SE Alaska they co-occurred more extensively (together with the Y haplogroup) at local scales. Remarkably, haplotypic composition among Alaskan populations varied considerably at very local scales, such as among High- vs Low-shore collections at Pirates (Figure 2B, bottom centre). Finally, the R and LG haplogroups were endemic to the Montereyan region. In Pigeon Point (pop. 11), these haplogroups matched a priori “large” and “small” morphological assignments, respectively.
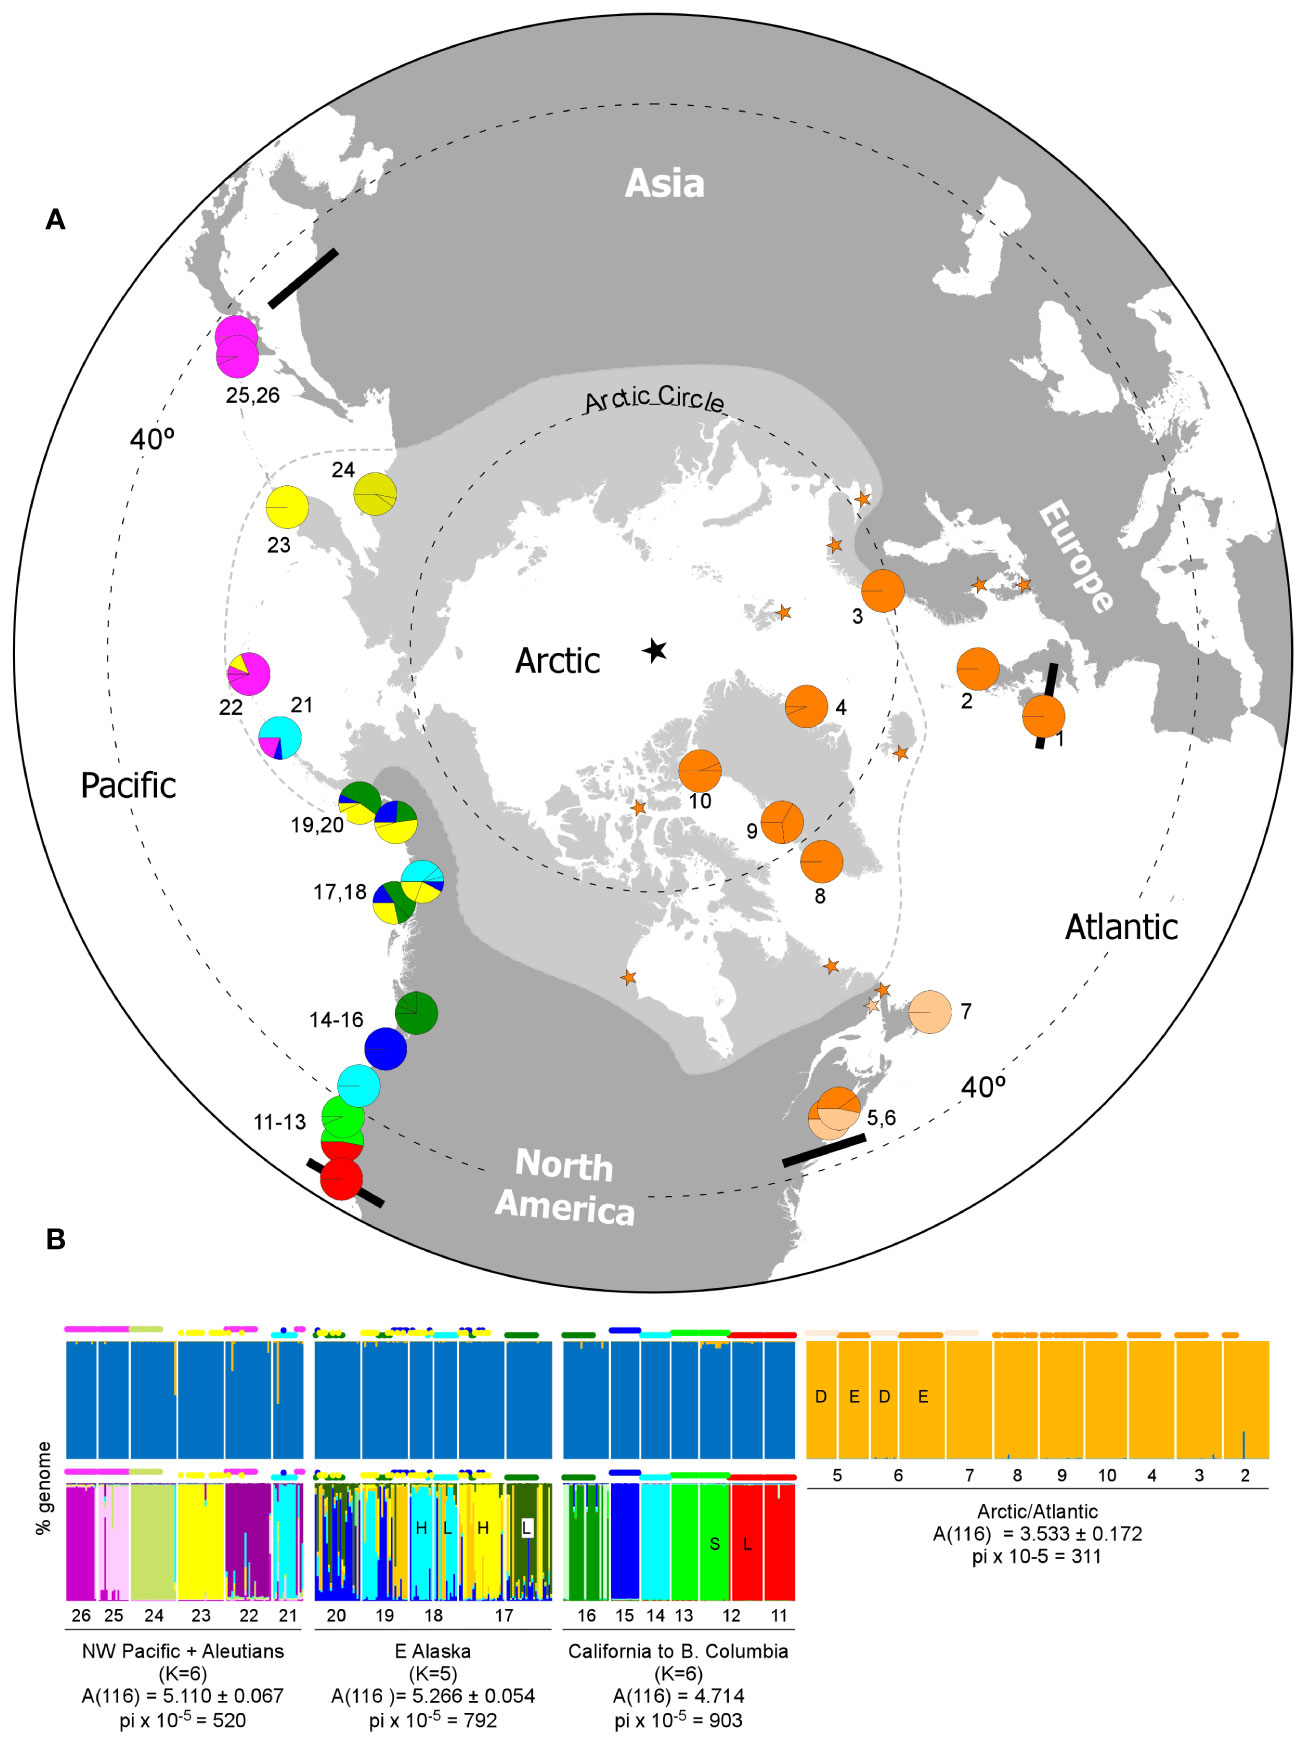
Figure 2 Global phylogeography and regional population genetic structure of Fucus distichus. (A) Geographic distributions of mtIGS haplogroups in the northern Hemisphere, with pie charts depicting haplotype/haplogroup frequencies at each sampling site (see Table 1; Figure 1 for population and haplotype IDs and colour codes). Orange stars indicate additional locations where DO and LO haplotypes were found in previous studies. The black star depicts the geographic north pole, the pale grey area the Arctic region (sub-Arctic to High-Arctic) according to the Conservation of Arctic Flora and Fauna (2010), and the bold black bars the known southern range limits. (B) Major microsatellite-based subdivisions in the northern hemisphere (top, K = 2) and in three separate regions of the north Pacific (bottom) according to Structure. Each vertical bar represents the proportions of individual multilocus genotypes assigned to each of K virtual clusters, as illustrated by the different colours, with the corresponding haplogroup on top. Population codes as in Table 1. H and L stand for High- and Low-shore bands, S and L for Small and Large ecotype, D and E for “distichus” and “edentatus” haplotypes. Standardized allelic diversity (A) and nucleotide diversity (Θπ = pi) are shown below the Structure plots for four selected regions.
Despite the relatively small global allelic diversity, the Structure analyses separated Arctic/Atlantic and Pacific genotypic clusters (Figure 2B, top) with good support (Δk = 2922; Supplementary Figure S2). This high-level subdivision was also recovered by the FCA (Supplementary Figure S3). Within the Pacific there was no support for large-scale regional subdivisions (maximum Δk < 30; Supplementary Figure S2), to some extent due to low microsatellite allelic diversity and resolution. Finer-scale regional sub-structuring was evident nevertheless when different regions were analyzed separately (Figure 2B, bottom). In the NW Pacific and W Aleutians, where most populations exhibited fixed allelic differences in at least one locus (Supplementary Figure S1), recovered genotypic clusters (K = 6, Δk = 254; Supplementary Figure S2) matched closely single populations (Figure 2B, bottom left). The same applied from California to British Columbia, where genotypic clusters (K = 6, Δk = 370; Supplementary Figure S2) again matched to a large degree specific populations or contiguous population sets (Figure 2B, bottom right). Despite local sympatry, “large” and “small” morphotypes from Pigeon Point, characterized by different R and LG haplotypes (see above), also matched distinct genotypic groups. Conversely, in SE Alaska, support for 3-5 genotypic clusters was weak (60 < Δk <90, Supplementary Figure S2), and these did not consistently match distinct haplogroups, shore-heights, or regional populations (Figure 2B, bottom centre). Structure analyses also failed to resolve the two eco-morphotypes/haplogroups from Maine (or any other set of Atlantic populations), even when analyzed alone (Δk < 100, Supplementary Figure S2).
Genetic diversity was much higher in the Pacific than in the Atlantic for both microsatellite (A(234) = 6.96 vs 3.86) and haplotypic (nhap = 29 vs 9, Θπ × 105 = 857 vs 311) data (Table 1). The Atlantic was also less diverse genetically than any of the Pacific regions considered (Figures 3A, C; Supplementary Table S3). The region between Point Conception (California) and Vancouver (British Columbia), encompassing the Montereyan and Mendocinian biogeographical regions, was (marginally) the most diverse region. Notwithstanding the occurrence of multiple, some quite divergent (e.g. R phylogroup) genetic groups, intra-population diversities were low. Pairwise differentiation, on the other hand, was often large, highlighting the depth of fine-scale spatial structure. Regional diversity in SE Alaska was not obviously larger than in the NW Pacific and western Aleutians, but consistently contained the most diverse populations in the Pacific (Figures 3A–C). Diversity was estimated for high and low shore heights at some sites (Pirates, Point Louise), thus underestimating intra-population (=site) diversity. In any case, small D values indicated relatively weak pair-wise differentiation between these diverse populations (Figure 3D). Haplotypic diversity was also large in this region, despite lacking unique haplogroups.
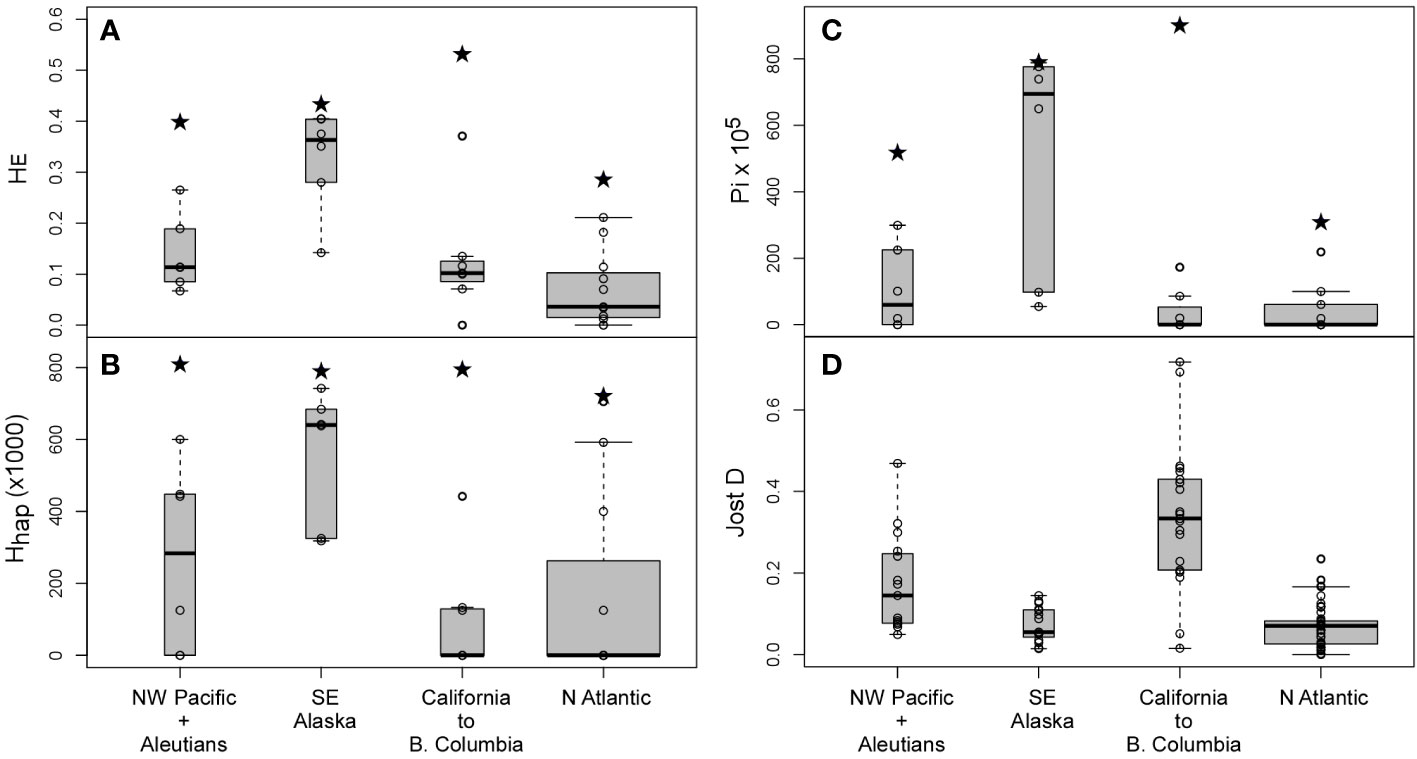
Figure 3 Regional diversity and differentiation in Fucus distichus. (A) Nei’s gene diversity (HE); (B) haplotypic diversity (Hhap); (C) nucleotidic diversity (π × 105) at population (box-plot) and regional (all individuals in each region pooled, black stars) levels; and (D) pair-wise population differentiation (Jost D) in each region. Box-plot width is proportional to no. of populations or pairwaise comparisons, and depict the median (horizontal line), the 25th and 75th percentiles (bottom and top of the box) and the minimum/maximum values (vertical dashed lines).
Ecological niche modelling
We collated 1283 unique occurrence records for the Pacific and 1015 for the Arctic/Atlantic. The ENMs retrieved high accuracy scores in independent data (i.e. in cross-validation procedure). Specifically, the model developed for the entire amphiboreal range achieved an average AUC of 0.829 ± 0.077, while the models for the Pacific and Arctic/Atlantic achieved an average AUC of 0.829 ± 0.077 and 0.848 ± 0.13, respectively. The posterior distribution of the probabilistic niche overlap metric between the Atlantic and Pacific groups was 96.24%, while the probability between the Pacific and Atlantic groups was 93.28% (Supplementary Figure S4). Despite the large niche overlap between ranges, physiological limiting points inferred from partial dependency functions differed between groups (Supplementary Table S4), with the niche of the Pacific showing greater thermal tolerance to maximum winter and summer temperatures (1.61°C and 1.86°C, respectively; Supplementary Table S4; Figure 4).
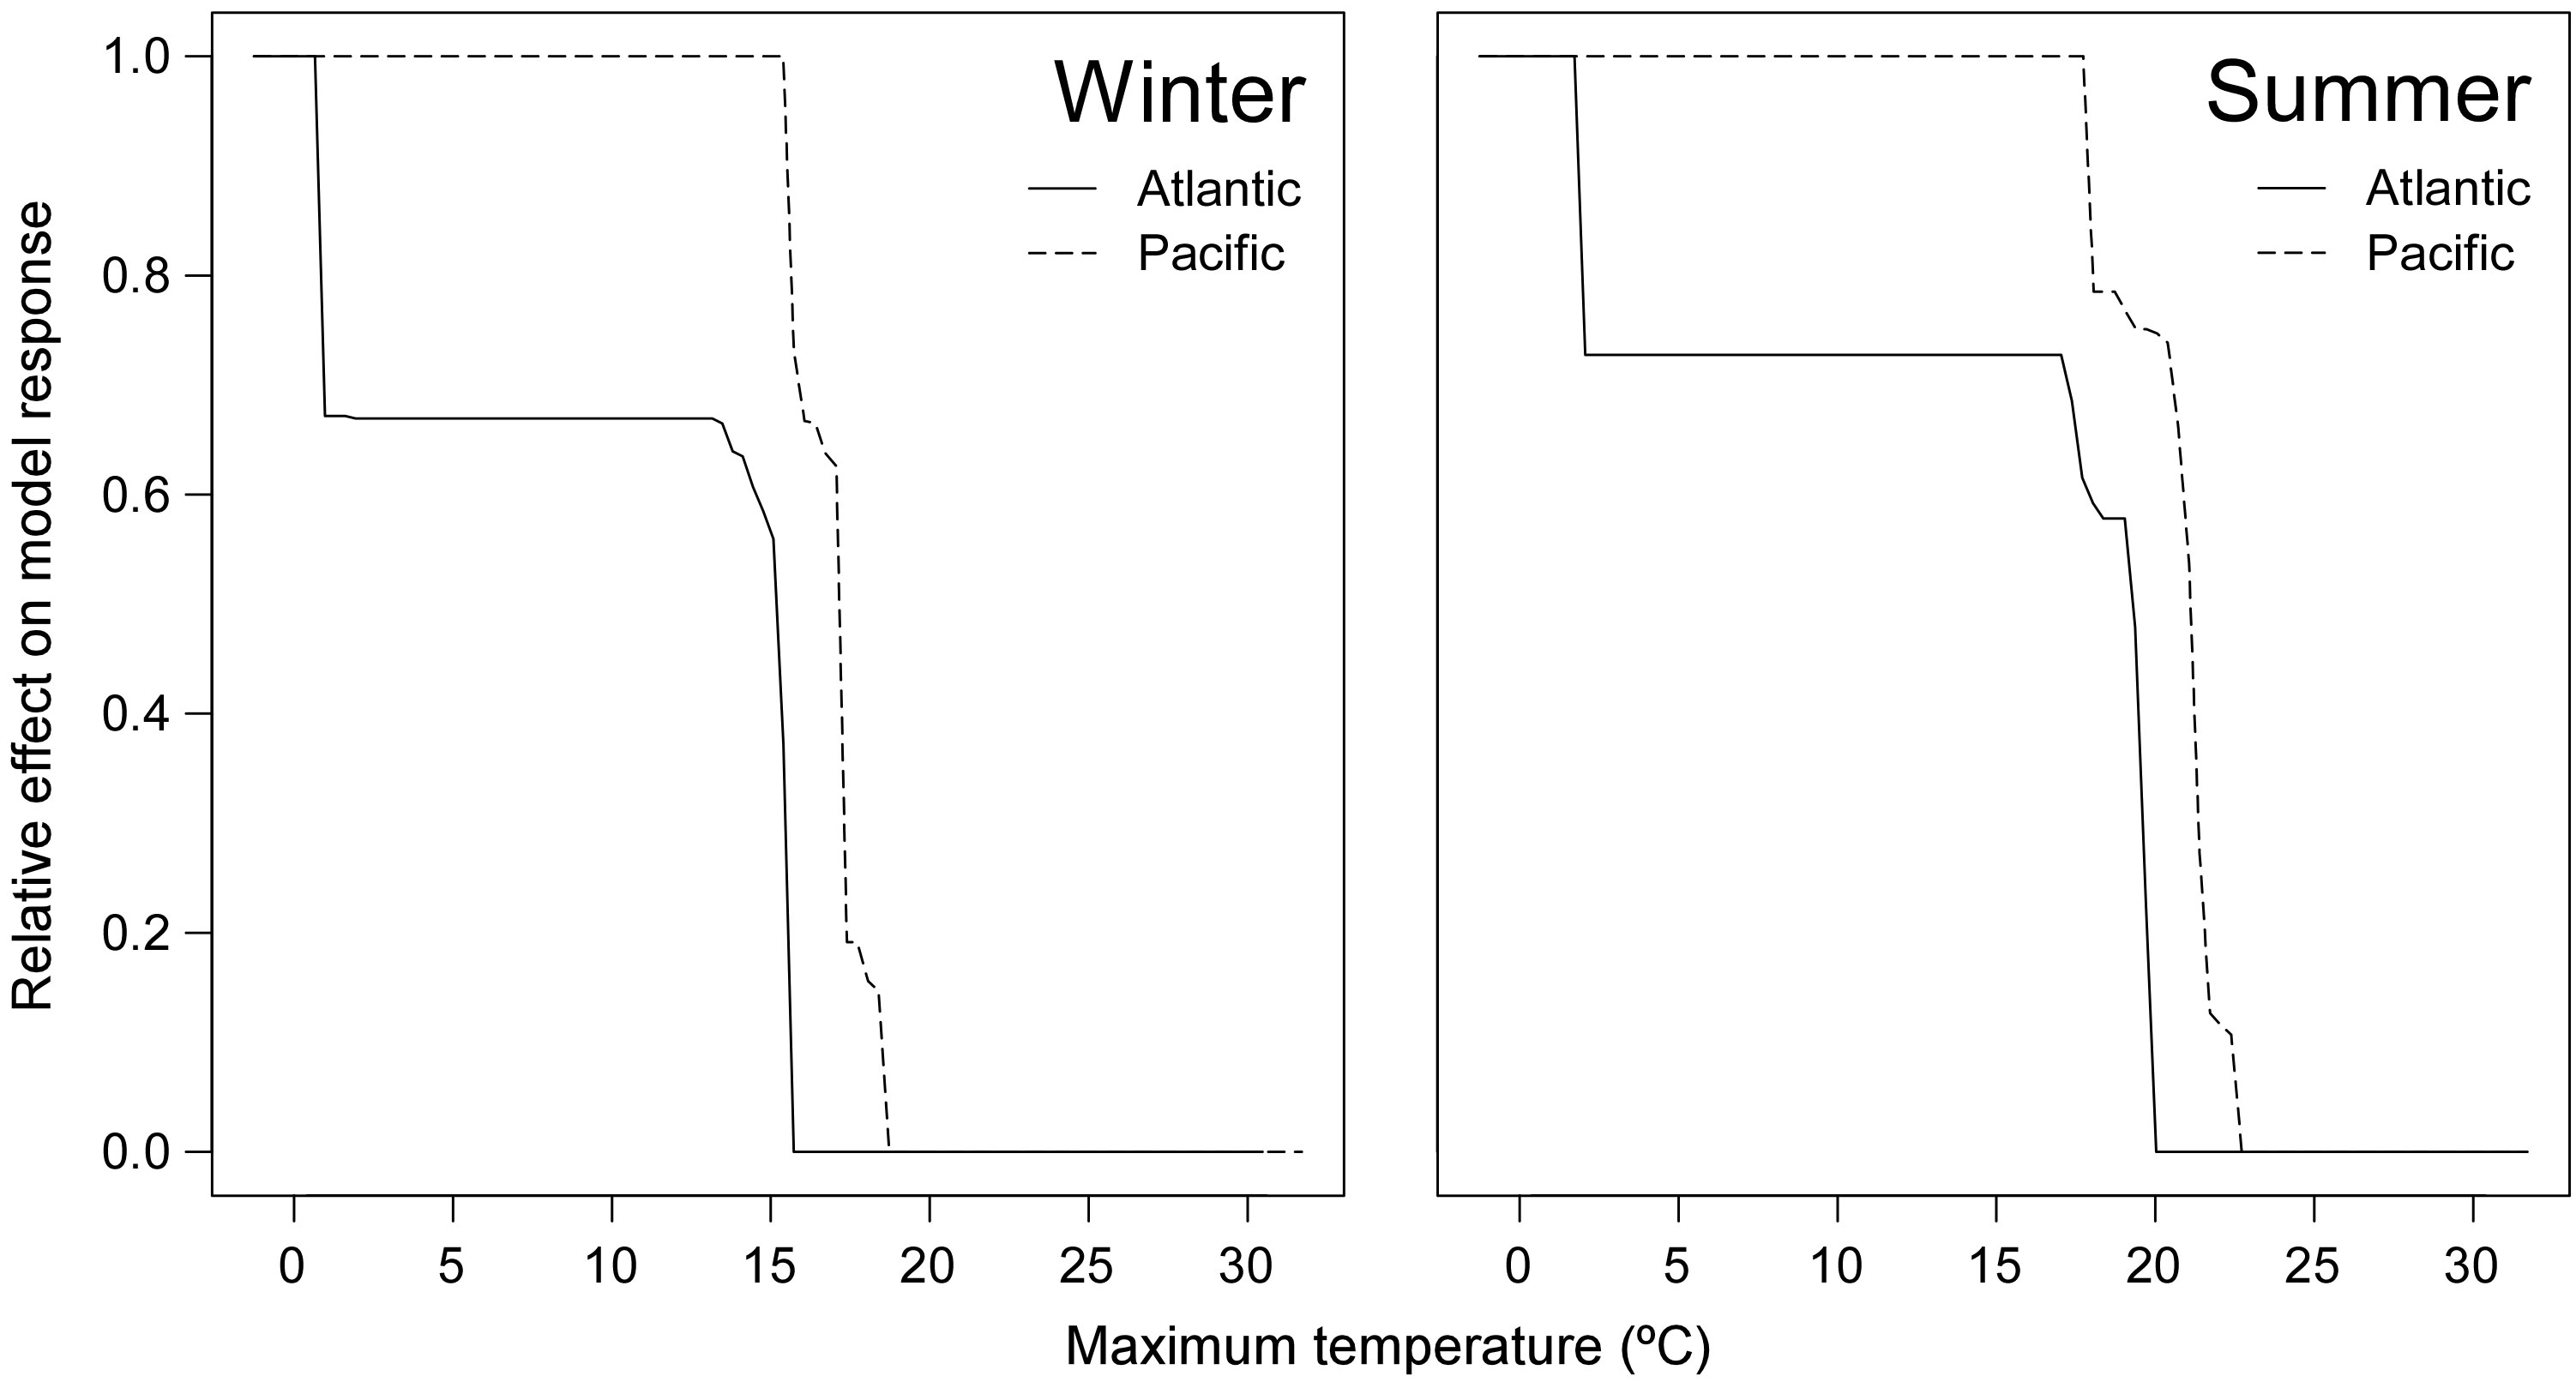
Figure 4 Partial dependency functions of Maximum Winter (left) and Summer (right) temperatures in the Atlantic (line) and Pacific (dashed line).
In the Pacific, ENMs over-estimated the distribution of F. distichus beyond known range limits in Point Conception (California) and Peter the Great Bay (Russia’s Far East), and polewards beyond the Bering Strait into the Chukchi and Beaufort Seas (Figure 5B). In the Arctic/Atlantic, the occurrence of the species was under-estimated in the Canadian Arctic in all models (Figure 5B; Supplementary Figure 5). The major mismatch however was in the NE Atlantic, where Ensemble and Pacific ENMs predicted a much more consolidated presence in the British Isles and contiguous French regions of Brittany and Normandy, as well as an isolated pocket in NW Iberia (Figure 5B; Supplementary Figure S5B). The Atlantic ENM over-predicted the occurrence of F. distichus only as far south as SW England (Cornwall; Supplementary Figure S5A). Hindcast projections supported a massive latitudinal shift in the potential distribution of F. distichus in the Atlantic between the LGM and today (Figure 5A). Suitable climatic conditions in the NW Atlantic would have been restricted to ice-free regions off Virginia to New Jersey and along the then-emerged Grand Banks of Newfoundland. In the NE Atlantic, projections indicated a much more southern and compressed distribution, between western Iberia and the periglacial palaeo-shorelines of the Celtic Sea and western British Isles. Globally, overlap between estimated local LGM and observed present-day distributions was quite restricted, as most of the modern range of F. distichus was either glaciated, emerged, or both during the LGM. According to models, latitudinal shifts were much less extensive in the North Pacific. During full glacial conditions, F. distichus could have spread from the Korean peninsula and Japan in the western Pacific, and Baja California (Mexico) in the NE Pacific, as far north as the paleo-shorelines of the Beringia Land Bridge. This massive range was probably interrupted to some extent between the eastern Aleutians and Vancouver Island (British Columbia), where the Cordilleran ice-sheet reached the coast. Globally, and unlike in the Atlantic, F. distichus still occurs throughout most of its immense glacial range. On the other hand, post-glacial poleward expansions, e.g. past the Bering Strait into the Arctic, have been much more modest.
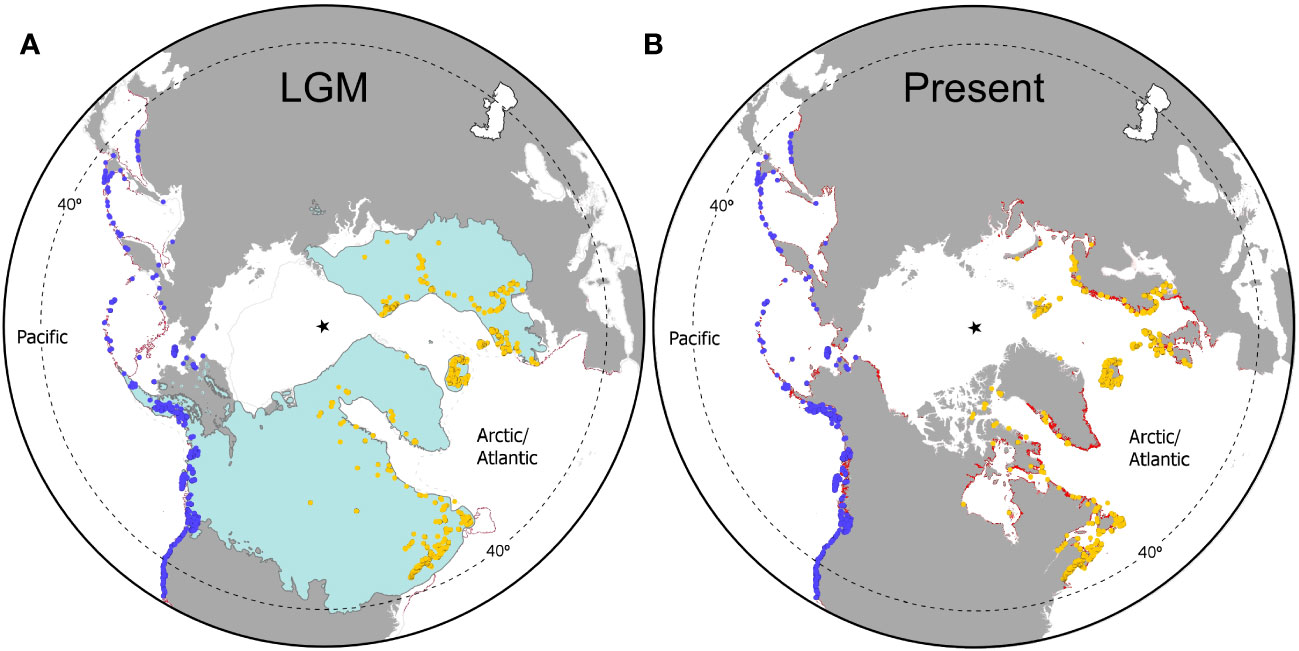
Figure 5 Ensemble-Modelled distribution of Fucus distichus across glacial cycles. (A) Projected distribution during the LGM; (B) Projected distribution in the present. Occurrence records are identified as blue (Pacific) and orange (Arctic/Atlantic) dots, modelled ranges are depicted in red, and the star depicts the geographic north pole. In the LGM map, ice-sheets are shown in blue, the thin solid grey line and the thin dashed grey line represent the regressed coastline and the approximate limits of sea-ice, respectively.
Discussion
This study represents the most comprehensive phylogeographic survey to date of a widespread amphiboreal taxon. The extensive geographical sampling on both sides of the Pacific and the Arctic/Atlantic, extending to potential climatic refugia in all temperate regions, and the integration of molecular data (complete mtIGS spacer and 7 microsatellites) with niche modelling, revealed remarkable levels of genetic differentiation at all spatial scales examined and uncovered a multitude of historical and ongoing processes contributing to phylogeographic structure in this intertidal alga.
Biogeographic history and trans-Arctic migrations
Globally, F. distichus encompasses multiple phylogeographic lineages and microsatellite genotypic clusters within which shallower genetic discontinuities were also pervasive at more local scales. Nested patterns of structuration are common among fucoid seaweeds and other low-dispersal marine organisms (e.g. kelp, direct-developing invertebrates) and typically result from complex, non-equilibrium demographic/genetic processes (e.g. contraction/expansion and isolation/secondary contact dynamics) most commonly associated with Pleistocene climatic shifts (Marko et al., 2010; Neiva et al., 2016; Assis et al., 2018b; Grant and Chenoweth, 2018, 2021; Grant and Bringloe, 2020). More striking is the unprecedented level of genetic diversity uncovered. F. distichus produced the most complex intra-specific mtIGS network recovered so far among fucoid seaweeds (Neiva et al., 2010, 2014, 2017), with haplotypic diversity comparable to that of an entire Atlantic radiation comprising 5+ species, including F. vesiculosus, F. spiralis, F. guiryi s.l (i.e. F. limitaneus and F. macroguiryi; see Almeida et al., 2022), F. virsoides and a mtDNA-introgressed lineage of F. ceranoides (Supplementary Figure S6). Fucus distichus shares its diplontic life-cycle, hermaphroditic mating system, intertidal habitats and dispersal ecology with most of these seaweeds, and was similarly severely impacted by Pleistocene climatic shifts. The exceptional phylogeographic diversity of F. distichus therefore seems to be best explained by its distinctive amphiboreal range, as large stable ranges (particularly in the Pacific, see below) offer more opportunities for allopatric divergence and lineage persistence. The greater phylogeographic diversity of circum-boreal Saccharina latissima s.l. vs NW Pacific endemic S. japonica supports this prediction (Zhang et al., 2015; Neiva et al., 2018), and additional studies may confirm the generality of the pattern.
Phylogeographic and genotypic diversities were extremely skewed towards the Pacific, supporting the view that F. distichus diversified primarily in the Pacific and that its Arctic/Atlantic range was colonized more recently (e.g. Coyer et al., 2011b). Different haplogroup compositions indicate nevertheless that Atlantic colonization pre-dates the last (de)glaciation, which is consistent with patterns of (nuclear) trans-Arctic divergence (Cánovas et al., 2011). It should be noted that Pacific and Arctic/Atlantic haplogroups were never found co-occurring throughout the Arctic basin, including along known dispersal pathways in the Canadian Arctic and eastern Greenland (Bringloe and Saunders, 2018; Neiva et al., 2018). Unlike the Atlantic side, where F. distichus post-glacial expansions reached the Canadian Arctic and Russia’s Novaya Zemlya archipelago (e.g. Lobus and Udalov, 2021, the latter not genetically confirmed), lack of reports suggest a much more limited post-glacial Pacific expansion past the Bering Strait into the adjacent Laptev, East Siberian and Beauford seas (Wulff et al., 2009; Wilce and Dunton, 2014). Limited availability of intertidal hard substrata, low summer temperatures (<5°C) and reduced salinity concentrations in some Arctic seas may help explain this asymmetry (Jueterbock et al., 2016), but the limiting factors (and actual extent) of post-glacial Arctic colonization from the Pacific should be further clarified.
It is interesting to note that most genera of brown macroalgae with amphiboreal representatives, including several large brown (e.g. Chorda, Alaria and Saccharina) and Arctic-endemic red seaweeds, are better represented (i.e. have more species) in the Pacific than in the Atlantic (Lüning, 1990; Lane et al., 2007; Sasaki and Kawai, 2007; Adey et al., 2008; Neiva et al., 2018; Bringloe et al., 2021), implying a predominant track of Pacific to Atlantic invasion. The biogeography of Fucus, however, does not suggest a primary Pacific origin. The sister genus Pelvetiopsis is composed by 4 NE Pacific-endemic species (Neiva et al., 2017), whereas all 7+ extant congeners of F. distichus are Atlantic endemics, including closely related F. serratus (F. spiralis is regarded as a recent introduction to the NE pacific (Coyer et al., 2006). The split and ensuing vicariant diversification of Fucus and Pelvetiopsis has been hypothesized to result from a trans-Arctic crossing by a common ancestor following the first opening of the Bering Strait at the Miocene/Pliocene transition ca. 5.6 Ma ago (Cánovas et al., 2011; Sousa et al., 2019). The secondary colonization of the Pacific by a F. distichus ancestor represents the most parsimonious hypothesis (Lindstrom, 2001; Cánovas et al., 2011) but is not consensual (Coyer et al., 2006; Laughinghouse et al., 2015). Alternative scenarios include a trans-Arctic split between main Fucus clades I (F. distichus/F. serratus) and II (F. vesiculosus et al.), or an earlier Pacific colonization by a F. distichus/F. serratus ancestor, in both cases involving the Atlantic colonization by (and Pacific extinction of) the F. serratus ancestor. While available data cannot answer this question, it is clear that the inferred colonization of the Atlantic represents only the latest among other trans-Arctic migrations in the evolutionary history of Fucus.
Long-term Pacific vs Atlantic ranges and niche conservatism
Another factor that likely contributed to the greater genetic diversity and differentiation of F. distichus in the North Pacific is the much wider ice-free glacial ranges, and the much greater glacial/interglacial range overlap, when compared with the Arctic/Atlantic. ENMs revealed extensive ice-free habitats suitable for F. distichus in the N Pacific during past major glaciations, from the Korean and Baja California Peninsulas to as far north as the palaeo-shorelines of Beringia. Even in the NE Pacific, where the Cordilleran ice-sheet spread along the coast and potentially created a distributional gap from British Columbia to the eastern Aleutians, suitable conditions existed from Vancouver to Point Conception (and beyond), where the endemic (and seemingly reproductively isolated) lineages R and LG were identified. Globally, and notwithstanding major climatic shifts across the last glacial/interglacial transition, available evidence supports long-term persistence of F. distichus throughout much of the core (and very wide) contemporary Pacific range. By comparison, the core distribution of F. distichus in the Atlantic overlaps extensively with regions that were under the direct influence of the LGM ice-sheets and available for colonization only at the onset of the deglaciation. The existence of a lineage unique to the NW Atlantic is in line with ENMs supporting suitable conditions just south of the Laurentide ice-sheet and along the ice-free palaeo-shorelines of the Grand Banks of Newfoundland (see also Assis et al., 2018a; Bringloe and Saunders, 2018). In the NE Atlantic, ENMs also revealed suitable habitat beyond ice-sheets from north-western British Isles to at least SW Iberia, but this putative southern glacial range is only marginally occupied today. The proximity of the glacial leading edge (just south of ice-sheet limits) and the modern trailing edge (western Ireland) necessarily translates into minimal areas of overlap (i.e. of long-term persistence), where genetic diversity could have accumulated and persisted until today.
Oddly, ENMs reveal suitable present-day climatic conditions throughout much of the British Isles and even Brittany, with Pacific models extending potential distributions as far south as northwest Iberia, i.e. much beyond its core distribution in Norway and its absolute modern range limit in Ireland. Even throughout its southern range in the British Isles, F. distichus populations are exceptionally rare and localized, and exhibit much less morphological and ecological plasticity when compared to other N Atlantic regions (e.g. Powell, 1963). Indeed, the single ecotype present – dwarf F. distichus var. anceps – is restricted to specific and disconnected sites along the western-facing coasts of Scotland and Ireland, subjected to extreme and persistent wave action, where other intertidal fucoids are scarce or absent. The species is ubiquitous throughout equivalent cold-temperate latitudes in the NE Pacific, where it nearly reaches the Southern California Bight warm-temperate eco-region (sensu Spalding et al., 2007). Most Arctic-cold temperate seaweeds with amphiboreal or amphi-Atlantic distributions (including foundational kelps such as Laminaria digitata, Alaria esculenta and Saccharina latissima, intertidal fucoids such as Ascophyllum nodosum and Fucus serratus, and red seaweeds such as Phycodrys rubens and Delesseria sanguinea) are still common in the Brittany-Ireland transition zone, and some even have relic populations in upwelling areas of NW Iberia. Most display unique gene-pools and diversity hotspots in these areas, indicating stable presence across climatic cycles (Wares and Cunningham, 2001; Maggs et al., 2008; Waltari and Hickerson, 2013).
The fragmented distribution of F. distichus in Europe could be explained by ongoing expansion from the NW Atlantic. This hypothesis is unconventional since most post-glacial trans-Atlantic migration has occurred, because of more benign glacial conditions, from East to West, but it explains some of the observations above. The steady expansion of a sheltered form of F. distichus (F. distichus var. evanescens) along the Skagerrak and Kattegat to at least Rostock in the western Baltic Sea (ca. 54° Lat.) since its mid-1890 introduction to Oslofjord (eastern Norway, presumably from northern Europe) is also compatible with this hypothesis, as it confirms suitable thermal regimes and potential for southern range expansions (Coyer et al., 2002; Dietrich and Hendrik, 2017). Atypically high rates of hybridization with F. serratus further suggest that contact between the species in this area is evolutionarily recent (Hoarau et al., 2015). Disentangling among these hypotheses – relic populations left after post-glacial contraction vs ongoing trans-Atlantic (W → E) post-glacial expansion – requires assessing whether genetic variation in the NE Atlantic is to some extent unique or chiefly a subset embedded within NW Atlantic diversity. The NE Atlantic populations, including Irish and Scottish ones, are not particularly remarkable for the studied markers, but more variable markers may be necessary to conclusively answer this question.
Perhaps other factors are playing a role. Whether pre-glacial or more recently, F. distichus may have suffered an important functional bottleneck during the NE Atlantic colonization. Migration corridors along the Canadian Arctic and Greenland require tolerance to extreme Arctic conditions and thus selective filters and gene-surfing along obligatory trans-Arctic pathways could have selected for specialized high-latitude form(s) pre-adapted to colder environments. If so, the regional NE Atlantic “niche” could be a fraction of the global species niche and its “relic” distribution along warmer British Isles (and absence further south) a reflection of it. There, its dependency for extremely exposed habitats could be explained by lower heat/desiccation stress attained in low-shore turbulent environments. The greater thermal tolerance of F. distichus in Pacific vs Atlantic ranges inferred from niche modelling (~1.8°C) is certainly compatible with this hypothesis, but empirical evidence for less thermal tolerance in the NE Atlantic range (or larger thermal tolerance in southern populations of the E Pacific) is missing entirely. Another potential factor to consider is inter-specific competition. F. distichus may be outcompeted by other intertidal fucoids toward temperate latitudes, becoming restricted to extremely exposed habitats (British Isles) or nutrient-enriched harbors (Kattegat and Western Baltic Sea) where other intertidal fucoids (and particularly low-intertidal Fucus serratus, see Jueterbock et al., 2016) are scarce or cannot establish. Intertidal fucoid communities are also represented in the southernmost areas of the NW Atlantic and NE Pacific (Silvetia, Pelvetiopsis), but are comparatively less diverse and saturated than in the temperate NE Atlantic. These contrasting hypotheses differ conceptually – they either assume fundamental or realized niche differences (Figure 6) – but both are rarely considered in marine phylogeographic literature. Comparative physiological/transcriptomic responses and reciprocal transplants, beyond the scope of this study, are likely to bring new insights, and help explain the nature of these apparent range/niche differences between the NE Atlantic and the remaining range.
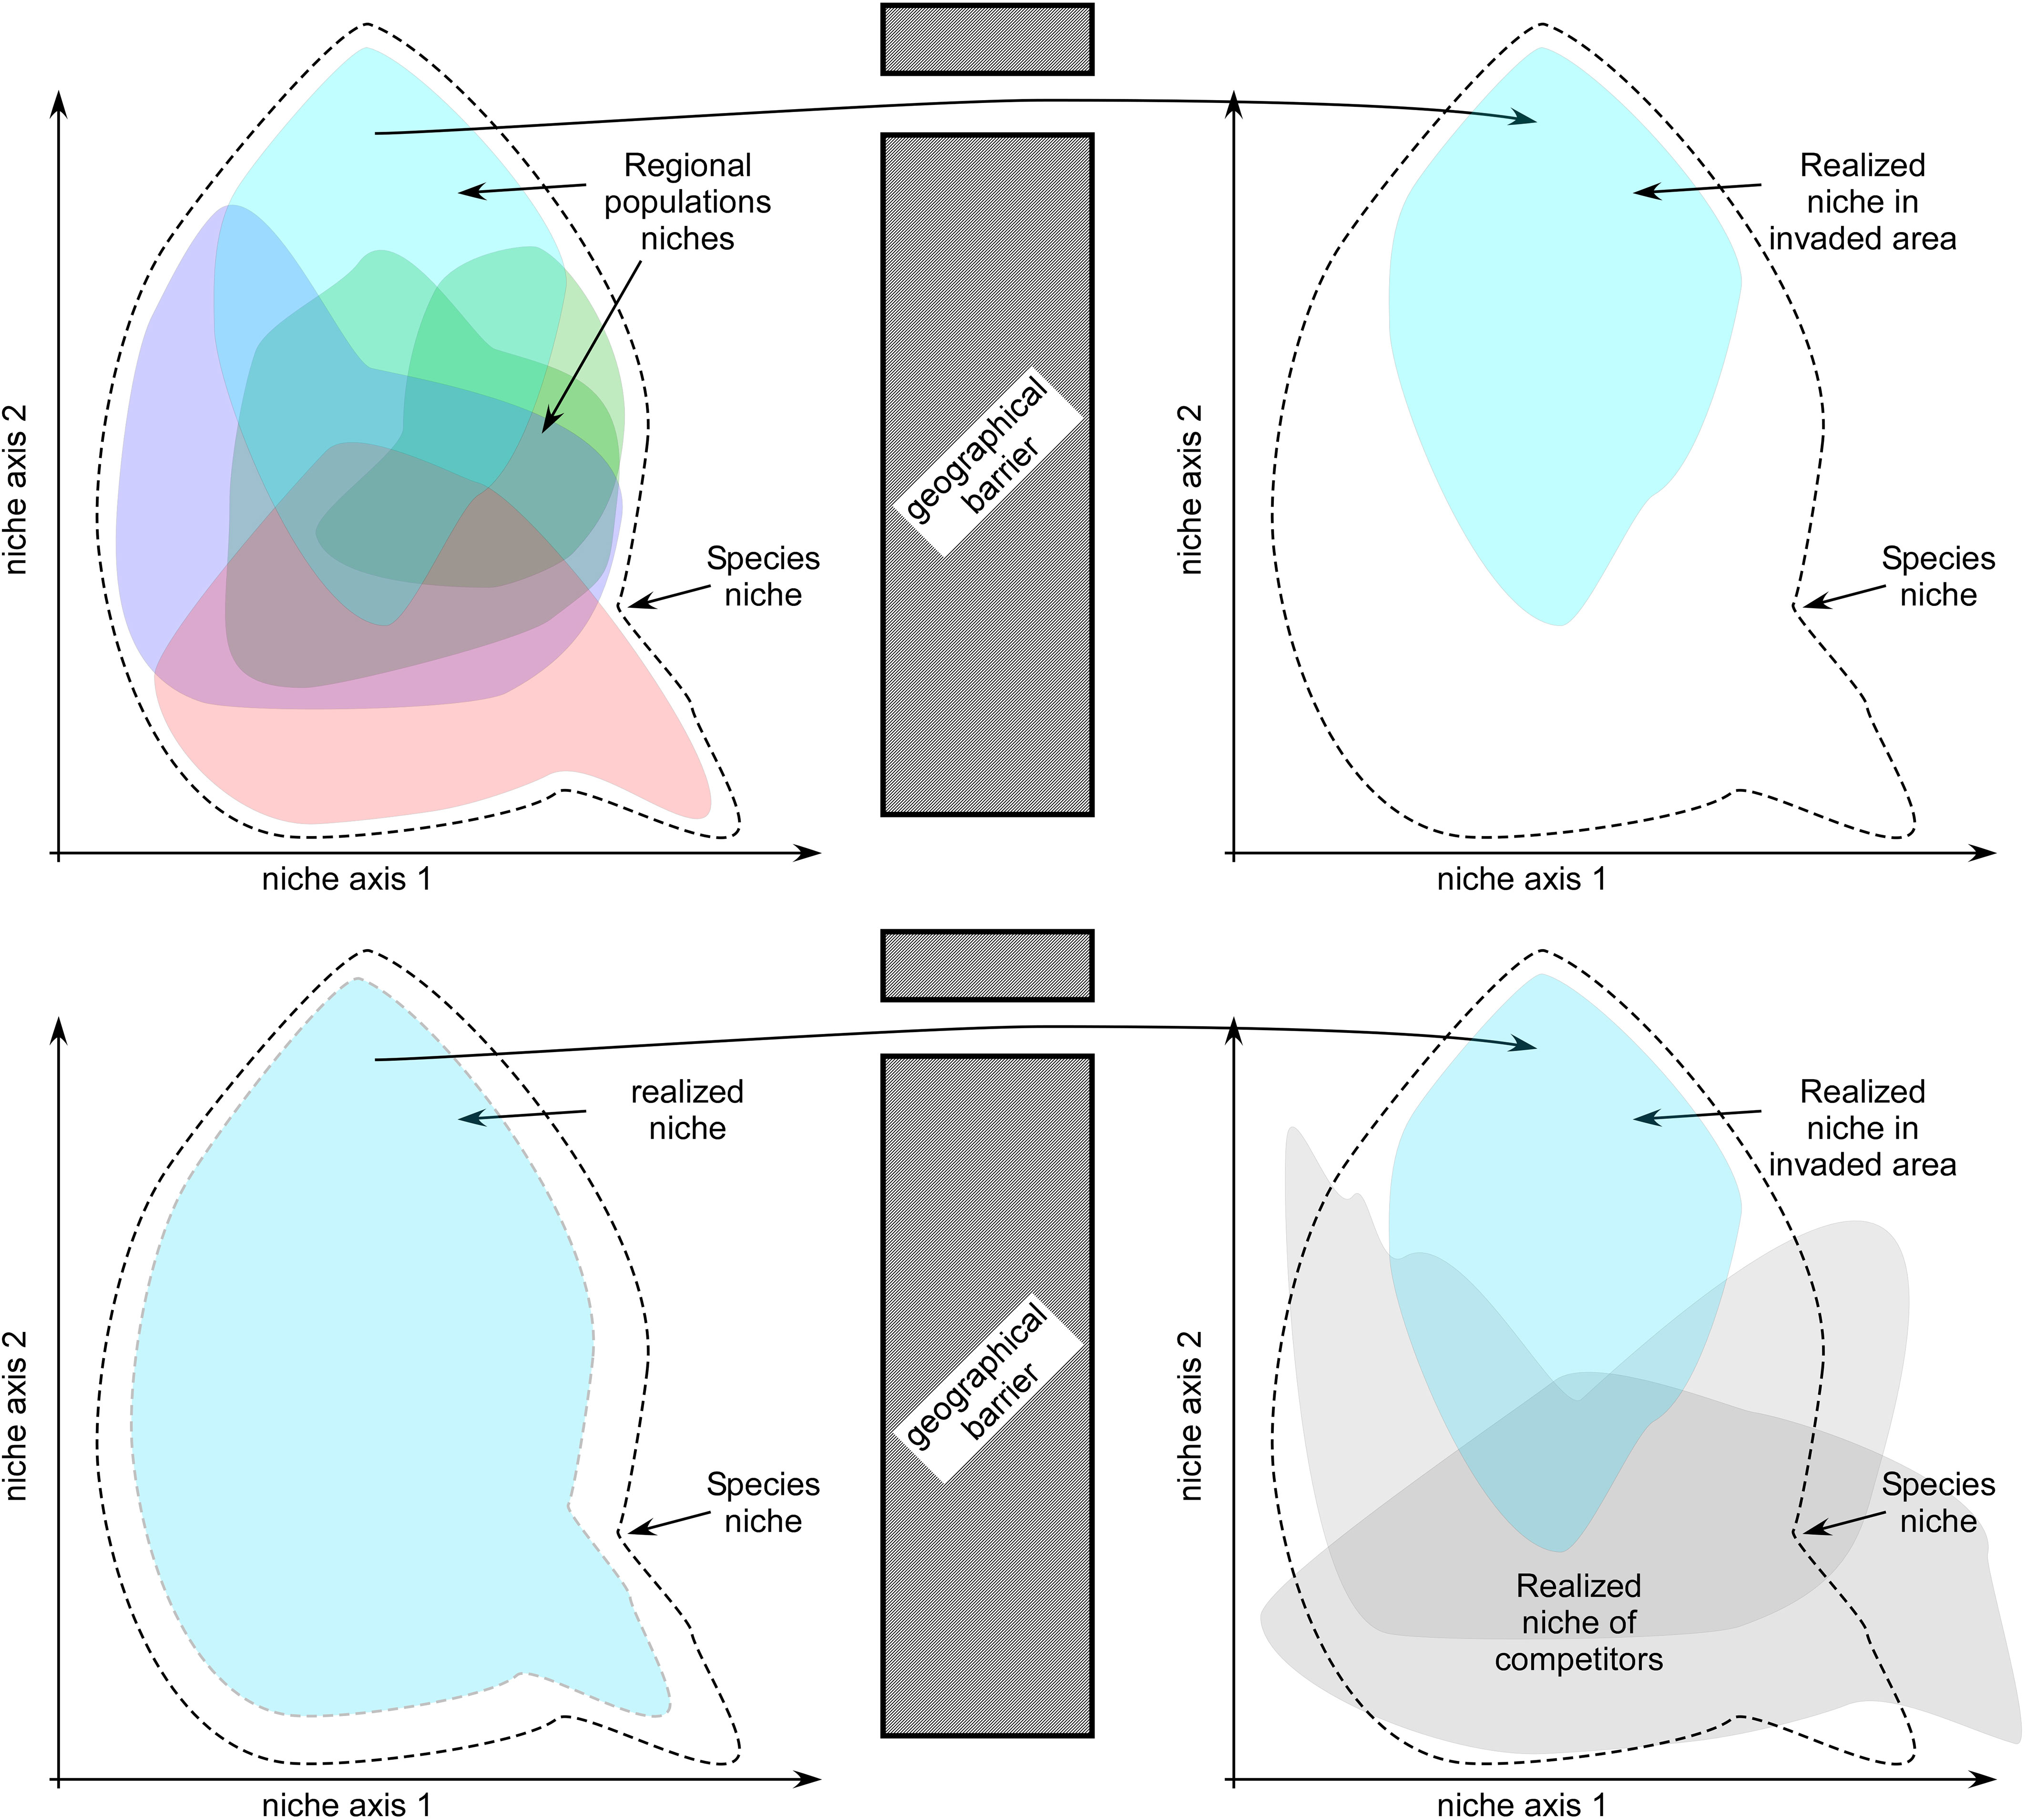
Figure 6 Conceptual models of niche contraction during colonizations. Top: Functional bottlenecks resulting from migration of a specialized population trough a narrow environmental filter/barrier (contraction of fundamental niche); Bottom: resulting from biotic constraints such as inter-specific competition in benign parts of the invaded range (contraction of realized niche).
Pacific refugia and melting pots
In the Pacific, and to a lesser extent in the Atlantic (e.g. Canadian Maritimes), the occurrence of endemic haplotypic radiations provide good indication of glacial range dissections and confirm that some lineages never expanded post-glacially much beyond past refugia. As predicted, the Montereyan region in the southernmost NE Pacific was home to two unique haplogroups (LG and R), the latter the most differentiated within the complex. At higher latitudes, but still beyond the reach of glacial ice, populations tended to be dominated by single haplogroups. For instance, between Vancouver Island and Cape Mendocino, distinct NE Pacific-endemic haplogroups dominated relatively short stretches of shoreline. Populations from Japan and Russia were also dominated by single haplogroups, some endemic to (or nearly so) the NW Pacific (P, DY). Contrastingly, in southern Alaska, NE Pacific haplogroups were locally mixed, also with the trans-Pacific Y haplogroup, resulting in the most haplotypic (and genotypic) diverse populations within F. distichus range. Alaskan populations, even when separately analyzed as high- and low- intertidal bands, also exhibited the largest observed heterozygosity. Ice-sheet reconstructions suggest that the Cordilleran ice-sheet reached the southern Alaskan coastline, presumably creating a distributional gap spanning from the eastern Aleutians to Vancouver Island. This region apparently lacks endemic haplogroups, as the ones co-occurring in the area were also found farther south or farther west. Regional diversity was also not atypically high, at least when comparing to the Montereyan/Mendocinian region, and pair-wise differentiation between populations was quite depressed, indicating weaker genetic structure and lineage sorting when compared to other regions. Finally, local populations were often composed of parapatric bands reminiscent of distinct ecotypes (even if not consistently recovered as separate entities, see next section).
Taken together, these data suggest that the Alaskan Gulf represents a melting pot where unique and more structured southern East and West Pacific sources met. Most Y and DG haplotypes samples were, however, private to this area. It remains a possibility that they are shared with contiguous, unsampled areas beyond the direct influence of the coastal ice-sheet, but if not, they could signal glacial persistence at these higher latitudes as in the kelps Alaria, Hedophyllum nigripes and Saccharina latissima (Grant and Bringloe, 2020; Grant et al., 2020; Grant and Chenoweth, 2021). The mixed evidence is compatible with a more complex scenario were F. distichus survived glacial advances in SE Alaska in a few small pockets of unglaciated shorelines, before invasion from southern and western ranges following ice-retreat – i.e. the area representing both a relic northern refugia and a post-glacial melting pot.
The Aleutian archipelago was poorly sampled but was also expected to bear signatures of recent contact between NW and NE Pacific regions. Central Aleutian Adak showed a more westerner character. This possibly reflects more benign LGM conditions, which presumably allowed survival (or at least earlier colonization) of western vs eastern Aleutians, as the latter was under the influence of the Cordilleran ice-sheet. Additional collections (analysed at a later stage and not included in this study) reveal that eastern Aleutian Islands indeed are genetically closer to the contiguous Alaskan region.
Species cohesion at local vs larger scale
In line with previous studies, molecular data failed to support traditionally recognized morpho-taxa among Atlantic F. distichus, nor, for the most part, subdividing Pacific “Fucus gardneri”. Much of the morphological variation between ecotypes has been shown to be continuous and explained by environmental factors (Powell, 1957; Rice et al., 1985; Sideman and Mathieson, 1985; Ruuskanen and Nappu, 2005), although a few common garden experiments suggest that at least some variation is heritable and not environmentally-induced (Sideman and Mathieson, 1985). In any case, eco-morphological or genetic entities were largely incongruent – some phylogroups included multiple ecotypes, and vice-versa, similar ecotypes belonged to distinct genetic lineages. In other words, at large spatial scales, F. distichus is best described as a single ecologically plastic, morphologically polymorphic and genetically structured species whose variation (genetic, morphologic, etc.) is not sufficiently discontinuous or consistent as to justify recognizing separate genetic or taxonomic entities.
Still, it remains challenging to fully capture and define the biodiversity contained within F. distichus. In some regions clearly distinct ecotypes matching distinct gene-pools co-existed at very local scales as stable sympatric/parapatric entities. This pattern seems to imply (local) isolation mechanisms and is reminiscent of incipient species (Billard et al., 2005; Neiva et al., 2018). Fucus are externally fertilizing broadcast spawners and show broad gametic compatibility, as revealed by natural hybridization/introgression between many species pairs (Coyer et al., 2002; Neiva et al., 2010). Remarkably, hybridization rates between F. distichus and F. serratus are reduced in naturally sympatric ranges when compared to recently established (19th century) contact zones, implying reinforcement, i.e. the strengthening of pre-zygotic isolating barriers in response to selection against less-fit hybrids (Hoarau et al., 2015). Local build-up of isolation among younger and less differentiated conspecific populations has also been documented in the context of range-shifts, ecological speciation and ring-species (Hopkins, 2013). Many F. distichus haplogroups evolved in allopatry and in some cases may be partially pre-adapted, as suggested in parapatric contexts, to different environmental conditions. Upon secondary contact, their local and regional integrity may be explained by limited gene-flow resulting from high selfing rates, spatial segregation and/or temporal reproductive asynchrony, potentially reinforced by reduced hybrid fitness and/or strong selection for contrasting environmental conditions (Sideman and Mathieson, 1983; Coyer et al., 2002; Billard et al., 2010; Zardi et al., 2011; Hoarau et al., 2015; Monteiro et al., 2016). In Maine, for instance, a high-intertidal tide-pool ecotype (LO haplogroup) reproduces during low-tide when it is isolated from larger, lower-shore (DO haplotype) conspecifics (Pearson and Brawley, 1996), but low microsatellite resolution prevents at present confirming their degree of reproductive isolation. Dwarf and normal-sized intertidal ecotypes from Maine have also been shown to exhibit reproductive asynchrony (Sideman and Mathieson, 1983). In Alaska, high- and low-intertidal bands often showed different haplotypic compositions, but the pattern tended to be site-specific and only weakly correlated with respective nuclear backgrounds, requiring further examination. This area was also the one where populations exhibited the largest observed heterozygosity, implying an important incidence of outcrossing. The most convincing example is perhaps that of Pigeon Point, where haplogroups R (wide-frond type) and LG (thin-frond type) co-occurred sympatrically. Despite overlapping vertical ranges and reproductive period, only a single genetic F1 hybrid was detected (assuming it is not a laboratory contamination during DNA extraction), suggesting nearly complete reproductive isolation. Ongoing analyses of nearby populations support this pattern at a regional scale. This R haplogroup is also the most divergent within the complex, so there is convincing additional ground for suspecting a separate, incipient species.
From a taxonomic perspective, this “paradox” – the existence of putatively isolated genetic entities that are relatively easy to recognize and discriminate at local scales but much harder to define (in terms of distinctive and constant morphological, ecological or genetic characters) at larger spatial scale - is problematic. Dealing with these entities may be even more complicated if reproductive isolation, as seems to be the case in some regions, is contingent and varies geographically depending on the specific genetic entities involved and/or the evolutionary and environmental contexts underlying their regional assembly. Similar studies may show that similar patterns apply to other highly-structured plastic species spanning large geographical areas regularly heavily impacted by glaciations.
Final considerations and future directions
Widespread amphiboreal marine species such as F. distichus are ideal models to investigate how climatic shifts, dispersal barriers, environmental filters and distinct biotic assemblages influence intra-specific genetic structure and niche differentiation across species ranges. Despite the unprecedented effort, a range of open questions remain that could be further addressed in future studies. First, new markers and approaches should be employed to estimate the timing of trans-Arctic migrations and secondary colonization of the Atlantic, and particularly of the NE Atlantic rear-edge, that are difficult to establish with microsatellite and mitochondrial data alone. The same applies with respect to spatially co-existing ecotypes, for which genomic data can provide much more power to clarify the actual degree of divergence and isolation and best taxonomic status, including confirming the putative cryptic species in the eastern Pacific rear-edge. As mentioned above, experimental work also seems necessary to clarify the nature of the apparent and very peculiar niche unfilling in the NE Atlantic. Finally, it is unquestionable that ongoing climatic change will translate into wider areas and windows of ice-free conditions in the near future. Deeper expansions into the high-Arctic seem inevitable and might even benefit from increased shipping along Canadian and Russian Arctic shores (Jueterbock et al., 2016). Vicariant Pacific and Atlantic lineages may eventually meet, creating an excellent biogeographic opportunity to directly investigate the fate of divergent lineages upon secondary contact (e.g. Neiva et al., 2018). These opportunities of research will not only improve our understanding of the complex biogeographical history, trans-Arctic divergence, and species cohesion in Fucus distichus, but of amphiboreal communities in general.
Data availability statement
The original contributions presented in the study are publicly available. This data can be found here: MtIGS sequences were deposited in Genbank as a PopSet alignment with accession numbers PP358930-PP359399. All relevant data described in the Material and Methods and Results sections, including microsatellite matrices, occurrence records, and niche modelling scripts are available in Figshare at https://figshare.com/articles/dataset/Global_Phylogeography_of_Fucus_distichus_scripts_and_datasets/25249981.
Author contributions
JN: Conceptualization, Data curation, Formal Analysis, Investigation, Methodology, Supervision, Writing – original draft, Writing – review & editing. JA: Conceptualization, Formal Analysis, Methodology, Validation, Writing – original draft, Writing – review & editing. EF: Methodology, Writing – original draft. GP: Conceptualization, Funding acquisition, Methodology, Writing – original draft, Writing – review & editing. PR: Conceptualization, Funding acquisition, Methodology, Resources, Writing – review & editing. LA: Data curation, Methodology, Resources, Writing – review & editing. DK-J: Data curation, Funding acquisition, Methodology, Resources, Writing – review & editing. NM: Data curation, Methodology, Resources, Writing – review & editing. AW: Funding acquisition, Investigation, Methodology, Resources, Writing – review & editing. OS: Methodology, Resources, Writing – review & editing. MN: Methodology, Resources, Writing – review & editing. WG: Investigation, Methodology, Resources, Writing – review & editing. BK: Funding acquisition, Writing – review & editing. MR: Methodology, Resources, Writing – review & editing. MS: Methodology, Resources, Writing – review & editing. CP: Data curation, Methodology, Writing – review & editing. ES: Conceptualization, Funding acquisition, Methodology, Project administration, Resources, Supervision, Writing – original draft, Writing – review & editing.
Funding
The author(s) declare financial support was received for the research, authorship, and/or publication of this article. This study was funded by the Portuguese Foundation for Science and Technology (FCT) through UIDB/04326/2020, UIDP/04326/2020 and LA/P/0101/2020, the transitory norm DL 57/2016/CP1361/CT0010 (to JN), the Individual Call to Scientific Employment Stimulus 2022.00861 (to JA), scholarships SFRH/BD/144878/2019 (to EF) and SFRH/BSAB/150485/2019 (to EAS), and projects MARFOR (Biodiversa/0004/2015), PARIS (PTDC/BIA-CBI/6515/2020) and RESTORESEAS (DivRestore/0013/2020; EU-BiodivERsA BiodivRestore-253). EAS was also funded by a Pew Marine Fellowship. Sampling along Greenland's West coast by DK-J and NM was funded by the European Unions 7th Framework Programme (“Arctic Tipping Points”, ATP, contract #226248). WG was funded by the Alaska Department of Fish and Game, Anchorage, Alaska. WG was funded by the Alaska Department of Fish and Game, Anchorage, Alaska.
Acknowledgments
The authors thank Marta Valente (CCMAR), André Silva and Diogo Brito for sequencing and genotyping work and all the people involved in sample collection. Samples from Logy Bay were kindly collected by Kyle R. Millar. DK-J and NM thank Hurtigruten’s FRAM cruise for help with sampling along the Greenland west coast. Greenland sampling was also connected with campaigns for the MarineBasis component of the Greenland Ecosystem Monitoring (GEM) Programme in Nuuk and Young Sound, which is acknowledged.
Conflict of interest
The authors declare that the research was conducted in the absence of any commercial or financial relationships that could be construed as a potential conflict of interest.
The author(s) declared that they were an editorial board member of Frontiers, at the time of submission. This had no impact on the peer review process and the final decision.
Publisher’s note
All claims expressed in this article are solely those of the authors and do not necessarily represent those of their affiliated organizations, or those of the publisher, the editors and the reviewers. Any product that may be evaluated in this article, or claim that may be made by its manufacturer, is not guaranteed or endorsed by the publisher.
Supplementary material
The Supplementary Material for this article can be found online at: https://www.frontiersin.org/articles/10.3389/fevo.2024.1356987/full#supplementary-material
Supplementary Figure S1 | Microsatellite allele frequencies in populations of Fucus distichus. Loci are separated by vertical lines, with loci names on top and allele sizes (bp) on the bottom. The presence of an allele in a population is indicated by a circle with an area proportional to its frequency.
Supplementary Figure S2 | Most probable number of genetic clusters according to STRUCTURE. Five iterations were run for each number of genetic clusters assumed (K).
Supplementary Figure S3 | Factorial component analyses of Fucus distichus genotypes, with Atlantic samples in black diamonds and Pacific samples in open triangles. Note the higher diversity of the latter.
Supplementary Figure S4 | Probability of niche overlap between the Atlantic and Pacific genetic groups (95% credible intervals displayed in dashed lines).
Supplementary Figure S5 | Habitat suitability in the Atlantic for Fucus distichus projected (A) with models built with Atlantic occurrence record data, and (B) with models built with Pacific occurrence record data. Potential ranges are depicted in black.
Supplementary Figure S6 | MtIGS haplotype networks of selected Fucoid seaweeds from the north Atlantic including Pelvetia (Neiva et al., 2014), Fucus (Neiva et al., 2010; Neiva et al., unpublished), and Pelvetiopsis (Neiva et al., 2017).
References
Adey W. H., Lindstrom S. C., Hommersand M. H., Muller K. M. (2008). The biogeographic origin of arctic endemic seaweeds: A thermogeographic view. J. Phycology 44, 1384–1394. doi: 10.1111/j.1529-8817.2008.00605.x
Almeida S. C., Neiva J., Sousa F., Martin N., Cox C. J., Melo-Ferreira J., et al. (2022). A low-latitude species pump: Peripheral isolation, parapatric speciation and mating-system evolution converge in a marine radiation. Mol. Ecol. 31, 4797–4817. doi: 10.1111/mec.16623
Assis J., Araújo M. B., Serrão E. A. (2018a). Projected climate changes threaten ancient refugia of kelp forests in the North Atlantic. Global Change Biol. 24, e55–e66. doi: 10.1111/gcb.13818
Assis J., Coelho N. C., Lamy T., Valero M., Alberto F., Serrão E. A. (2016). Deep reefs are climatic refugia for genetic diversity of marine forests. J. Biogeography 43, 833–844. doi: 10.1111/jbi.12677
Assis J., Fragkopoulou E., Frade D., Neiva J., Oliveira A., Abecasis D., et al. (2020). A fine-tuned global distribution dataset of marine forests. Sci. Data 7, 119. doi: 10.1038/s41597-020-0459-x
Assis J., Serrão E. A., Coelho N. C., Tempera F., Valero M., Alberto F. (2018b). Past climate changes and strong oceanographic barriers structured low - latitude genetic relics for the golden kelp Laminaria ochroleuca. J. Biogeography 45, 2326–2336. doi: 10.1111/jbi.13425
Assis J., Tyberghein L., Bosh S., Verbruggen H., Serrão E. A., De Clerck O. (2018c). Bio-ORACLE v2.0: extending marine data layers for bioclimatic modelling. Global Ecol. Biogeograph. doi: 10.1111/geb.12693
Barbet-Massin M., Jiguet F., Albert C. H., Thuiller W. (2012). Selecting pseudo-absences for species distribution models: how, where and how many? Methods Ecol. Evol. 3, 327–338. doi: 10.1111/j.2041-210X.2011.00172.x
Billard E., Daguin C., Pearson G. A., Serrão E. A., Engel C., Valero M. (2005). Genetic isolation between three closely related taxa: Fucus vesiculosus, F. spiralis and F. ceranoides (Phaophyceae). J. Phycology 41, 900–905. doi: 10.1111/j.0022-3646.2005.04221.x
Billard E., Serrão E. A., Pearson G. A., Destombe C., Valero M. (2010). Fucus vesiculosus and spiralis species complex: a nested model of local adaptation at the shore level. Mar. Ecol. Prog. Ser. 405, 163–174. doi: 10.3354/meps08517
Boavida J., Assis J., Silva I., Serrão E. A. (2016). Overlooked habitat of a vulnerable gorgonian revealed in the Mediterranean and Eastern Atlantic by ecological niche modelling. Sci. Rep. 6, 36460. doi: 10.1038/srep36460
Bringloe T. T., Saunders G. W. (2018). Mitochondrial DNA sequence data reveal the origins of postglacial marine macroalgal flora in the Northwest Atlantic. Mar. Ecol. Prog. Ser. 589, 45–58. doi: 10.3354/meps12496
Bringloe T. T., Zaparenkov D., Starko S., Grant W. S., Vieira C., Kawai H., et al. (2021). Whole-genome sequencing reveals forgotten lineages and recurrent hybridizations within the kelp genus Alaria (Phaeophyceae). J. Phycology 57, 1721–1738. doi: 10.1111/jpy.13212
Cánovas F. G., Mota C. F., Serrão E. A., Pearson G. A. (2011). Driving south: a multi-gene phylogeny of the brown algal family Fucaceae reveals relationships and recent drivers of a marine radiation. BMC Evol. Biol. 11, 371. doi: 10.1186/1471-2148-11-371
Carr C. M., Hardy S. M., Brown T. M., Macdonald T. A., Hebert P. D. N. (2011). A tri-oceanic perspective: DNA barcoding reveals geographic structure and cryptic diversity in Canadian polychaetes. PloS One 6. doi: 10.1371/journal.pone.0022232
Chernova E. N. (2016). The biogeochemical background and trace metal accumulation by brown algae of the genus Fucus in coastal waters of the Sea of Japan, the Sea of Okhotsk, and the White Sea. Russian J. Mar. Biol. 42, 87–96. doi: 10.1134/S1063074016010053
Conservation of Arctic Flora and Fauna. (2010). Arctic biodiversity trends 2010: selected indicators of change. Available online at: https://wedocs.unep.org/20.500.11822/8670.
Coyer J. A., Hoarau G., Beszteri B., Pearson G., Olsen J. L. (2009). Expressed sequence tag-derived polymorphic SSR markers for Fucus serratus and amplification in other species of Fucus. Mol. Ecol. Resour. 9, 168–170. doi: 10.1111/j.1755-0998.2008.02406.x
Coyer J. A., Hoarau G., Costa J. F., Hogerdijk B., Serrão E., Billard E., et al. (2011a). Evolution and diversification within the intertidal brown macroalgae Fucus spiralis/F. vesiculosus species complex in the North Atlantic. Mol. Phylogenet. Evol. 58, 283–296. doi: 10.1016/j.ympev.2010.11.015
Coyer J. A., Hoarau G., Oudot-Le Secq M.-P., Stam W. T., Olsen J. L. (2006). A mtDNA-based phylogeny of the brown algal genus Fucus (Heterokontophyta; Phaeophyta). Mol. Phylogenet. Evol. 39, 209–222. doi: 10.1016/j.ympev.2006.01.019
Coyer J. A., Hoarau G., Van Schaik J., Luijckx P., Olsen J. L. (2011b). Trans-Pacific and trans-Arctic pathways of the intertidal macroalga Fucus distichus L. reveal multiple glacial refugia and colonizations from the North Pacific to the North Atlantic. J. Biogeography 38, 756–771. doi: 10.1111/jbi.2011.38.issue-4
Coyer J. A., Peters A. F., Hoarau G., Stam W. T., Olsen J. L. (2002). Hybridization of the marine seaweeds, Fucus serratus and Fucus evanescens (Heterokontophyta: Phaeophyceae) in a 100-year-old zone of secondary contact. Proc. R. Soc. B / Biol. Sci. 269, 1829–1834. doi: 10.1098/rspb.2002.2093
Dietrich A., Hendrik S. (2017). Fucus evanescens or Fucus edentatus? Taxonomic problems with a non-indigenous species, which arrived at the coast of Mecklenburg-Vorpommern. Rostock. Meeresbiolog. Beitr. 27, 117–125.
Dodson J. J., Tremblay S., Colombani F., Carscadden J. E., Lecomte F. (2007). Trans-Arctic dispersals and the evolution of a circumpolar marine fish species complex, the capelin (Mallotus villosus). Mol. Ecol. 16, 5030–5043. doi: 10.1111/j.1365-294X.2007.03559.x
Dunton K. H. (1992). Arctic biogeography: the paradox of the marine benthic fauna and flora. Trends Ecol. Evol. 7, 183–189. doi: 10.1016/0169-5347(92)90070-R
Elith J., Leathwick J. R., Hastie T. (2008). A working guide to boosted regression trees. J. Anim. Ecol. 77, 802–813. doi: 10.1111/j.1365-2656.2008.01390.x
Engel C. R., Brawley S. H., Edwards K. J., Serrao E. (2003). Isolation and cross-species amplification of microsatellite loci from the fucoid seaweeds Fucus vesiculosus, F. serratus and Ascophyllum nodosum (Heterokontophyta, Fucaceae). Mol. Ecol. Notes 3, 180–182. doi: 10.1046/j.1471-8286.2003.00390.x
Evanno G., Regnaut S., Goudet J. (2005). Detecting the number of clusters of individuals using the software STRUCTURE: A simulation study. Mol. Ecol. 14, 2611–2620. doi: 10.1111/j.1365-294X.2005.02553.x
Fragkopoulou E., Serrão E. A., Horta P. A., Koerich G., Assis J. (2021). Bottom trawling threatens future climate refugia of rhodoliths globally. Front. Mar. Sci. 7, 1–11. doi: 10.3389/fmars.2020.594537
Fragkopoulou E., Serrão E. A., De Clerck O., Costello M. J., Araújo M. B., Duarte C. M., et al. (2022). Global biodiversity patterns of marine forests of brown macroalgae. Global Ecol. Biogeography 31, 636–648. doi: 10.1111/geb.13450
Fraser C. I., Nikula R., Spencer H. G., Waters J. M. (2009). Kelp genes reveal effects of subantarctic sea ice during the Last Glacial Maximum. Proc. Natl. Acad. Sci. USA 106, 3249–3253. doi: 10.1073/pnas.0810635106
Grant W. S., Bringloe T. T. (2020). Pleistocene ice ages created new evolutionary lineages, but limited speciation in Northeast Pacific Winged Kelp. J. Heredity 111, 593–605. doi: 10.1093/jhered/esaa053
Grant W. S., Chenoweth E. (2021). Phylogeography of sugar kelp: Northern ice-age refugia in the Gulf of Alaska. Ecol. Evol. 11, 4670–4687. doi: 10.1002/ece3.7368
Grant W. S., Lydon A., Bringloe T. T. (2020). Phylogeography of split kelp Hedophyllum nigripes: northern ice-age refugia and trans-Arctic dispersal. Polar Biol. 43, 1829–1841. doi: 10.1007/s00300-020-02748-6
Halanych K. M., Vodoti E. T., Sundberg P., Dahlgren T. G. (2013). Phylogeography of the horse mussel Modiolus modiolus. J. Mar. Biol. Assoc. United Kingdom 93, 1857–1869. doi: 10.1017/S0025315413000404
Hardy S. M., Carr C. M., Hardman M., Steinke D., Corstorphine E., Mah C. (2011). Biodiversity and phylogeography of Arctic marine fauna: Insights from molecular tools. Mar. Biodiversity 41, 195–210. doi: 10.1007/s12526-010-0056-x
Hoarau G., Coyer J. A., Giesbers M. C. W. G., Jueterbock A., Olsen J. L. (2015). Pre-zygotic isolation in the macroalgal genus Fucus from four contact zones a tale of reinforcement? R. Soc. Open Sci. 2, 140538. doi: 10.1098/rsos.140538
Hofner B., Müller J., Hothorn T. (2011). Monotonicity-constrained species distribution models. Ecology 92 (10), 1895–1901. doi: 10.1890/10-2276.1
Holt R. D. (2009). Bringing the Hutchinsonian niche into the 21st century: Ecological and evolutionary perspectives. Proc. Natl. Acad. Sci. 106, 19659–19665. doi: 10.1073/pnas.0905137106
Hopkins R. (2013). Minireview reinforcement in plants. New Phytol. 197, 1095–1103. doi: 10.1111/nph.12119
Jiménez-Valverde A., Lobo J. M. (2007). Threshold criteria for conversion of probability of species presence to either–or presence–absence. Acta Oecolog. 31, 361–369. doi: 10.1016/j.actao.2007.02.001
Jueterbock A., Smolina I., Coyer J. A., Hoarau G. (2016). The fate of the Arctic seaweed Fucus distichus under climate change: an ecological niche modeling approach. Ecol. Evol. 6, 1712–1724. doi: 10.1002/ece3.2001
Kaufman D. S., Ager T. A., Anderson N. J., Anderson P. M., Andrews J. T., Bartlein P. J., et al. (2004). Holocene thermal maximum in the western Arctic (0-180°W). Quaternary Sci. Rev. 23, 529–560. doi: 10.1016/j.quascirev.2003.09.007
Keenan K., Mcginnity P., Cross T. F., Crozier W. W., Prodöhl P. A. (2013). DiveRsity: An R package for the estimation and exploration of population genetics parameters and their associated errors. Methods Ecol. Evol. 4, 782–788. doi: 10.1111/2041-210X.12067
King N. G., McKeown N. J., Smale D. A., Moore P. J. (2018). The importance of phenotypic plasticity and local adaptation in driving intraspecific variability in thermal niches of marine macrophytes. Ecography 41, 1469–1484. doi: 10.1111/ecog.03186
Krause-Jensen D., Archambault P., Assis J., Bartsch I., Bischof K., Filbee-Dexter K., et al. (2020). Imprint of climate change on Pan-Arctic marine vegetation. Front. Mar. Sci. 7, 1–27. doi: 10.3389/fmars.2020.617324
Kucera H., Saunders G. W. (2008). Assigning morphological variants of Fucus (Fucales, Phaeophyceae) in Canadian waters to recognized species using DNA barcoding. Botany 86, 1065–1079. doi: 10.1139/B08-056
Laakkonen H. M., Lajus D. L., Strelkov P., Väinölä R. (2013). Phylogeography of amphi-boreal fish: tracing the history of the Pacific herring Clupea pallasii in North-East European seas. BMC Evolutionary Biol. 13, 67. doi: 10.1186/1471-2148-13-67
Lane C. E., Lindstrom S. C., Saunders G. W. (2007). A molecular assessment of northeast Pacific Alaria species (Laminariales, Phaeophyceae) with reference to the utility of DNA barcoding. Mol. Phylogenet. Evol. 44, 634–648. doi: 10.1016/j.ympev.2007.03.016
Laughinghouse H. D., Müller K. M., Adey W. H., Lara Y., Young R., Johnson G. (2015). Evolution of the northern rockweed, Fucus distichus, in a regime of glacial cycling: implications for benthic algal phylogenetics. PlosOne 10, e0143795. doi: 10.1371/journal.pone.0143795
Liesner D., Fouqueau L., Valero M., Roleda M. Y., Pearson G. A., Bischof K., et al. (2020). Heat stress responses and population genetics of the kelp Laminaria digitata (Phaeophyceae) across latitudes reveal differentiation among North Atlantic populations. Ecol. Evol. 10, 9144–9177. doi: 10.1002/ece3.6569
Lindstrom S. C. (2001). The Bering Strait connection: dispersal and speciation in boreal macroalgae. J. Biogeography 28, 243–251. doi: 10.1046/j.1365-2699.2001.00529.x
Lobus N. V., Udalov A. A. (2021). The chemical composition of brown algae laminaria digitata (Hudson) J.V. Lamouroux 1893 and Fucus distichus (Linnaeus 1767) from the bays of the novaya zemlya archipelago (the kara sea). Russian J. Mar. Biol. 47, 407–412. doi: 10.1134/S1063074021050096
Lüning K. (1990). Seaweeds: their environment, biogeography, and ecophysiology (Revised ed) (New York: Wiley).
Maggs C. A., Castilho R., Foltz D., Henzler C., Jolly M. T., Kelly J., et al. (2008). Evaluating signatures of glacial refugia for north atlantic benthic marine taxa. Ecology 89, 108–122. doi: 10.1890/08-0257.1
Marko P. B., Hoffman J. M., Emme S. A., Mcgovern T. M., Keever C. C., Cox L. N. (2010). The ‘ Expansion – Contraction ‘ model of Pleistocene biogeography : rocky shores suffer a sea change? Mol. Ecol. 19 (1), 146–169. doi: 10.1111/mec.2009.19.issue-1
Martins M. R., Assis J., Abecasis D. (2021). Biologically meaningful distribution models highlight the benefits of the Paris agreement for demersal fishing targets in the North Atlantic Ocean. Glob. Ecol. Biogeogr. 30 (8), 1643–1656. doi: 10.1111/geb.13327
Mitchell C. E., Agawal A. A., Bever J. D., Gilbert G. S., Ruth A., Klironomos J. N., et al. (2006). Biotic interactions and plant invasions. Ecol. Lett. 9, 726–740. doi: 10.1111/j.1461-0248.2006.00908.x
Mohring M. B., Wernberg T., Wright J. T., Connell S. D., Russell B. D. (2014). Biogeographic variation in temperature drives performance of kelp gametophytes during warming. Mar. Ecol. Prog. Ser. 513, 85–96. doi: 10.3354/meps10916
Montecinos A., Broitman B. R., Faugeron S., Haye P., Tellier F., Guillemin M.-L. (2012). Species replacement along a linear coastal habitat: phylogeography and speciation in the red alga Mazzaella laminarioides along the south east Pacific. BMC Evolutionary Biol. 12, 97. doi: 10.1186/1471-2148-12-97
Monteiro C. A., Paulino C., Jacinto R., Serrão E. A., Pearson G. A. (2016). Temporal windows of reproductive opportunity reinforce species barriers in a marine broadcast spawning assemblage. Sci. Rep. 6, 29198. doi: 10.1038/srep29198
Neiva J., Assis J., Fernandes F., Pearson G. A., Serrão E. A. (2014). Species distribution models and mitochondrial DNA phylogeography suggest an extensive biogeographical shift in the high-intertidal seaweed Pelvetia canaliculata. J. Biogeography 41, 1137–1148. doi: 10.1111/jbi.12278
Neiva J., Hansen G. I., Pearson G. A., Vliet M. S., Maggs C. A., Serrão E. A. (2012a). Fucus cottonii (Fucales, Phaeophyceae) is not a single genetic entity but a convergent salt-marsh morphotype with multiple independent origins. Eur. J. Phycology 47, 461–468. doi: 10.1080/09670262.2012.736536
Neiva J., Paulino C., Nielsen M. M., Krause-Jensen D., Saunders G. W., Assis J., et al. (2018). Glacial vicariance drives phylogeographic diversification in the amphi-boreal kelp Saccharina latissima. Sci. Rep. 8, 1112. doi: 10.1038/s41598-018-19620-7
Neiva J., Pearson G. A., Valero M., Serrão E. A. (2010). Surfing the wave on a borrowed board: range expansion and spread of introgressed organellar genomes in the seaweed Fucus ceranoides L. Mol. Ecol. 19, 4812–4822. doi: 10.1111/j.1365-294X.2010.04853.x
Neiva J., Pearson G. A., Valero M., Serrão E. A. (2012b). Fine-scale genetic breaks driven by historical range dynamics and ongoing density-barrier effects in the estuarine seaweed Fucus ceranoides L. In BMC Evolutionary Biol. 12, 78. doi: 10.1186/1471-2148-12-78
Neiva J., Serrão E. A., Anderson L., Raimondi P. T., Martins N., Gouveia L., et al. (2017). Cryptic diversity, geographical endemism and allopolyploidy in NE Pacific seaweeds. BMC Evolutionary Biol. 17, 30. doi: 10.1186/s12862-017-0878-2
Neiva J., Serrão E. A., Assis J., Pearson G. A., Coyer J. A., Olsen J. L., et al. (2016). “Climate oscillations, range shifts and phylogeographic patterns of north atlantic fucaceae,” in Seaweed phylogeography - adaptation and evolution of seaweeds under environmental change. Eds. Hu Z.-M., Fraser C., ed. 1. (Springer Netherlands), 279–308.
Nikula R., Strelkov P., Väinölä R. (2007). Diversity and trans-arctic invasion history of mitochondrial lineages in the North Atlantic Macoma balthica complex (Bivalvia: Tellinidae). Evolution 61, 928–941. doi: 10.1111/j.1558-5646.2007.00066.x
Pearson G. A., Brawley S. H. (1996). Reproductive ecology of Fucus distichus (Phaeophyceae): An intertidal alga with successful external fertilization. Mar. Ecol. Prog. Ser. 143, 211–223. doi: 10.3354/meps143211
Perrin C., Daguin C., Vliet M., Van De, Engel C. R., Pearson G. A., et al. (2007). Implications of mating system for genetic diversity of sister algal species: Fucus spiralis and Fucus vesiculosus (Heterokontophyta, Phaeophyceae). Eur. J. Phycology 42, 219–230. doi: 10.1080/09670260701336554
Pico T., Mitrovica J. X., Mix A. C. (2020). Sea level fingerprinting of the Bering Strait flooding history detects the source of the Younger Dryas climate event. Sci. Adv. 6, eaay2935. doi: 10.1126/sciadv.aay2935
Powell H. T. (1957). Studies in the genus Fucus L. II. Distribution and ecology of forms of Fucus distichus L. Emend. Powell in Britain and Ireland. J. Mar. Biol. Assoc. UK 36, 663–693. doi: 10.1017/S0025315400025923
Powell H. T. (1963). Speciation in the genus Fucus L., and related genera. Systematics Assoc. Publ. 5, 63–67.
Rice E. L., Kenchington T. J., Chapman A. R. O. (1985). Intraspecific geographic-morphological variation patterns in Fucus distichus and F. evanescens. Mar. Biol. 88, 207–215. doi: 10.1007/BF00397168
Ruuskanen A. T., Nappu N. P. (2005). Morphological differences in Fucus gardneri between two shores with equal cartographic exposure values but different levels of wave action. Annales Botanici Fennici 42, 27–33.
Saada G., Nicastro K. R., Jacinto R., McQuaid C. D., Serrão E. A., Pearson G. A., et al. (2016). Taking the heat: distinct vulnerability to thermal stress of central and threatened peripheral lineages of a marine macroalga. Diversity Distributions 22, 1060–1068. doi: 10.1111/ddi.12474
Sasaki H., Kawai H. (2007). Taxonomic revision of the genus Chorda (Chordaceae, Laminariales) on the basis of sporophyte anatomy and molecular phylogeny. Phycologia 46, 10–21. doi: 10.2216/06-06.1
Saunders G. W., McDevit D. C. (2013). DNA barcoding unmasks overlooked diversity improving knowledge on the composition and origins of the Churchill algal flora. BMC Ecol. 13, 9. doi: 10.1186/1472-6785-13-9
Serrão E. A., Alice L. A., Brawley S. H. (1999). Evolution of the Fucaceae (Phaeophyceae) inferred from nrDNA-ITS. J. Phycology 35, 382–394. doi: 10.1046/j.1529-8817.1999.3520382.x
Sideman E. J., Mathieson A. C. (1983). Ecological and genecological distinctions of a high intertidal dwarf form of Fucus distichus (L.) Powell in New England. J. Exp. Mar. Biol. Ecol. 72, 171–188. doi: 10.1016/0022-0981(83)90142-9
Sideman E. J., Mathieson A. C. (1985). Morphological variation within and between natural populations of non-tide pool Fucus distichus (Phaeophyta) in New England. J. Phycology 21, 250–257. doi: 10.1111/j.0022-3646.1985.00250.x
Smolina I., Kollias S., Jueterbock A., Coyer J. A., Hoarau G. (2016). Variation in thermal stress response in two populations of the brown seaweed, Fucus distichus, from the Arctic and subarctic intertidal. R. Soc. Open Sci. 3, 150429. doi: 10.1098/rsos.150429
Sousa F., Neiva J., Martins N., Jacinto R., Anderson L., Raimondi P. T., et al. (2019). Increased evolutionary rates and conserved transcriptional response following allopolyploidisation in brown algae. Evolution 73, 59–72. doi: 10.1111/evo.2019.73.issue-1
Spalding M. D., Fox H. E., Allen G. R., Davidson N., Ferdaña Z. A., Finlayson M. A. X., et al. (2007). Marine ecoregions of the world: A bioregionalization of coastal and shelf areas. BioScience 57, 573–583. doi: 10.1641/B570707
Swanson H. K., Lysy M., Power M., Stasko A. D., Johnson J. D., Reist J. D. (2015). A new probabilistic method for quantifying n-dimensional ecological niches and niche overlap. Ecology 96 (2), 318–324. doi: 10.1890/14-0235.1
Tellier F., Tapia J., Faugeron S., Destombe C., Valero M. (2011). The Lessonia nigrescens species complex (Laminariales, Phaeophyceae) shows strict parapatry and complete reproductive isolation in a secondary contact zone. J. Phycology 47, 894–903. doi: 10.1111/jpy.2011.47.issue-4
Tyberghein L., Verbruggen H., Pauly K., Troupin C., Mineur F., De Clerck O. (2012). Bio-ORACLE: a global environmental dataset for marine species distribution modelling. Global Ecol. Biogeograph. 21, 272–281. doi: 10.1111/j.1466-8238.2011.00656.xv
Wallace A. L., Klein A. S., Mathieson A. C. (2004). Determining the affinities of salt marsh fucoids using microsatellite markers: evidence of hybridization and introgression between two species of fucus (Phaeophyta) in a maine estuary. J. Phycology 40, 1013–1027. doi: 10.1111/j.1529-8817.2004.04085.x
Waltari E., Hickerson M. J. (2013). Late Pleistocene species distribution modelling of North Atlantic intertidal invertebrates. J. Biogeography 40, 249–260. doi: 10.1111/j.1365-2699.2012.02782.x
Wares J. P., Cunningham C. W. (2001). Phylogeography and historical ecology of the North Atlantic intertidal. Evolution 55, 2455–2469. doi: 10.1111/j.0014-3820.2001.tb00760.x
Wiens J. J., Graham C. H. (2005). Niche conservatism: integrating evolution, ecology, and conservation biology. Annu. Rev. Ecology Evolution Systematics 36, 519–539. doi: 10.1146/annurev.ecolsys.36.102803.095431
Wilce R. T., Dunton K. H. (2014). The boulder Patch (North Alaska, Beaufort Sea) and its benthic algal flora. Arctic 67, 43–56. doi: 10.14430/arctic4360
Wulff A., Iken K., Quartino M. L., Al-Handal A., Wiencke C., Clayton M. N. (2009). Biodiversity, biogeography and zonation of marine benthic micro- and macroalgae in the Arctic and Antarctic. Botanica Marina 52, 491–507. doi: 10.1515/BOT.2009.072
Yamada I. (1980). Instructions for use Benthic marine algal vegetation along the coasts of Hokkaido , with special reference to the vertical distribution. Journ. Fac. Sci. Hokkaido Univ. Ser. V (Botany) 12, 11–98.
Zardi G. I., Nicastro K. R., Canovas F., Costa J. F., Serrão E. A., Pearson G. A. (2011). Adaptive traits are maintained on steep selective gradients despite gene flow and hybridization in the intertidal zone. PloS One 6, e19402. doi: 10.1371/journal.pone.0019402
Keywords: intertidal, climate-driven range shifts, cryptic species, functional bottleneck, genetic hotspots and melting pots, niche unfilling, trans-Arctic phylogeography
Citation: Neiva J, Assis J, Fragkopoulou E, Pearson GA, Raimondi PT, Anderson L, Krause-Jensen D, Marbà N, Want A, Selivanova O, Nakaoka M, Grant WS, Konar B, Roleda MY, Sejr MK, Paulino C and Serrão EA (2024) Trans-Arctic asymmetries, melting pots and weak species cohesion in the low-dispersal amphiboreal seaweed Fucus distichus. Front. Ecol. Evol. 12:1356987. doi: 10.3389/fevo.2024.1356987
Received: 16 December 2023; Accepted: 20 March 2024;
Published: 18 April 2024.
Edited by:
Christophe William Vieira, Jeju National University, Republic of KoreaReviewed by:
Antonio Flores-Moya, University of Malaga, SpainKathryn Schoenrock, University of Galway, Ireland
Narongrit Muangmai, Kasetsart University, Thailand
Copyright © 2024 Neiva, Assis, Fragkopoulou, Pearson, Raimondi, Anderson, Krause-Jensen, Marbà, Want, Selivanova, Nakaoka, Grant, Konar, Roleda, Sejr, Paulino and Serrão. This is an open-access article distributed under the terms of the Creative Commons Attribution License (CC BY). The use, distribution or reproduction in other forums is permitted, provided the original author(s) and the copyright owner(s) are credited and that the original publication in this journal is cited, in accordance with accepted academic practice. No use, distribution or reproduction is permitted which does not comply with these terms.
*Correspondence: João Neiva, am1uZWl2YUB1YWxnLnB0