 Yu-qian Shen
 Xiao Yi
 Meng Chen1,2
- 1State Key Laboratory of Urban and Regional Ecology, Research Centre for Eco-Environmental Sciences, Chinese Academy of Sciences, Beijing, China
- 2College of Resources and Environment, University of Chinese Academy of Sciences, Beijing, China
The ability of an ecosystem to provide services differs from its actual consumption and use by human society. Overuse of ecosystems can degrade ecosystems. In order to evaluate the supply capacity and use status of the ecosystem in Miyun County, so as to better apply the ecosystem services to different policies and management, the supply and use of 10 types of ecosystem services in Miyun County were calculated by using value indicators, namely potential gross ecosystem product (GEP) and actual gross ecosystem product. The results show that: (1) In 2020, potential gross ecosystem product of Miyun County is 254.32 billion yuan, and actual gross ecosystem product is 53.28 billion yuan, accounting for 21% of the potential gross ecosystem product. (2) Among all kinds of ecosystem services, the contribution of water conservation services in potential gross ecosystem product is the highest, and the contribution of climate regulation services in actual gross ecosystem product is the highest. (3) The contribution of wetland was the highest in potential gross ecosystem product, while the contribution of forest was the highest in actual gross ecosystem product. (4) Natural ecosystem area and vegetation coverage are the main factors affecting potential gross ecosystem product, while actual gross ecosystem product is mainly affected by GDP and population. (5) By studying the potential supply and actual use of ecosystem services, we evaluated and distinguished between the services that ecosystem could produce and the services that were actually used by humans, and compared the supply capacity and actual use to assess the sustainability of ecosystem services, in order to formulate different policies and management measures for gross ecosystem product surplus and deficit regions. Potential gross ecosystem product could provide data support for the assessment of ecological protection benefits. Actual gross ecosystem product could be included in the system of national accounts, and as a standard for ecological compensation and ecological trading. Confusing potential supply and actual use in policy application would affect the effect of policy implementation, and distinguishing them could ensure policy implementation. The relative size of the relationship between the two could reflect the present and future levels of human well-being in a region. Both together provided management basis and policy-making support for guiding regional ecological protection and sustainable development.
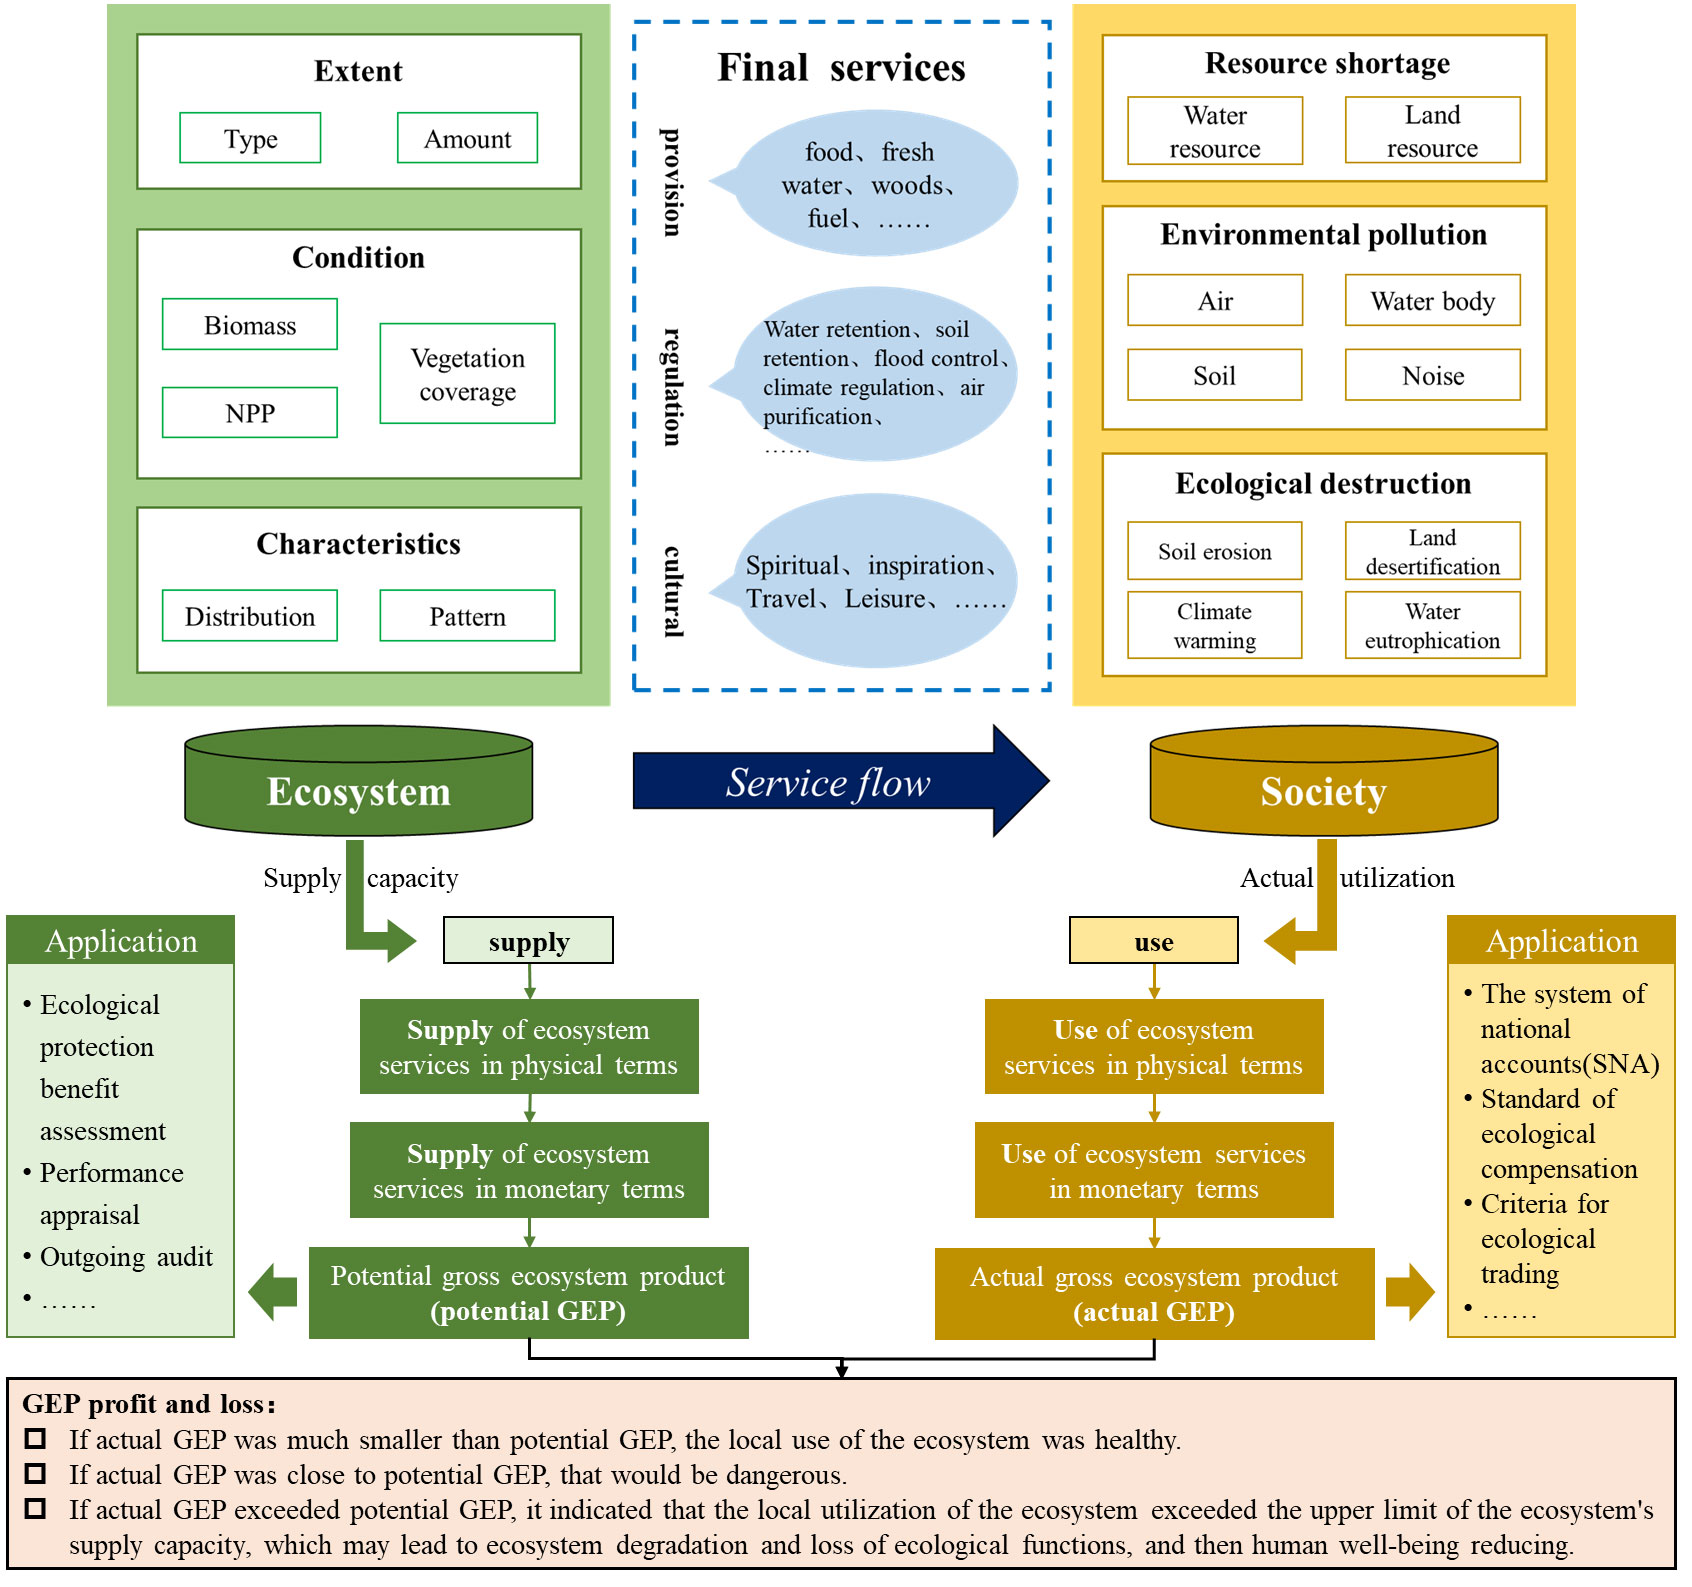
Graphical Abstract
Highlights
● Compared the supply capacity and use status of ecosystem services in Miyun County.
● Potential gross ecosystem product represents the extent and condition of ecosystem, while actual gross ecosystem product represents local population and economic conditions.
● Potential gross ecosystem product is mainly affected by natural ecosystem area and vegetation coverage. Actual gross ecosystem product is mainly affected by GDP and population.
● When the actual gross ecosystem product exceeded the local potential gross ecosystem product, it indicated that the utilisation of the ecosystem by the local human society exceeded its capacity threshold, which would reduce the supply capacity of the ecosystem and thus affected the future ability of the ecosystem to provide for human well-being.
1 Introduction
The term “ecosystem services” was formally proposed in the early 1970s (Holdren and Ehrlich, 1974), and the Millennium Ecosystem Assessment (MA 2005) defined it as the benefits people obtain from the ecosystem (Zhao et al., 2007). Many studies on ecosystem services have been conducted since then, and preliminary research results have been documented (Li et al., 2022). Monetisation and quantification of ecosystem services have gradually garnered attention to assess the contribution of ecosystems to human welfare and guide the application of ecology in economic decision-making (Bayon, 2004; EC, 2008; Peterson et al., 2010; Roces-Díaz et al., 2015). However, because of the complex transfer process of ecosystem services from natural ecosystems to social and economic systems, the same terms have often been understood and applied differently, resulting in ambiguity in the concepts. For one example, the concept of ecosystem services proposed by Villamagna et al. (2013) distinguishes supply (ability to provide services) from use (depending on supply and demand). In contrast, the System of Environmental-economic Accounting—Ecosystem Accounting (SEEA EA) manual equates the supply of an ecosystem with its use (United Nations, 2021). Another example is Crossman et al. (2013) who have mixed-use and demand in the same term (often referred to as “demand”). Nevertheless, in mapping and assessing ecosystems and their services (MAES) action, the European Union distinguishes between use and demand for ecosystem services (European Union, 2020). Because the definitions in these studies do not correspond, we have synthesised these concepts into three categories: supply, demand, and use (Figure 1). We define the supply of ecosystem services as the ability of the ecosystem to provide services sustainably under existing ecosystem status and management conditions, regardless of human needs (Gómez-Baggethun et al., 2010; Haines-Young and Potschin, 2010; Burkhard et al., 2012; van Oudenhoven et al., 2012; Maes et al., 2016), such as the ability of the ecosystem to provide water retention services. Demand refers to the number of services that society requires or expects (Fisher et al., 2009; Villamagna et al., 2013; Maes et al., 2016; Goldenberg et al., 2017; Chaplin-Kramer et al., 2019), such as the number of water retention services. Use was determined based on the spatial relationship between supply and demand (Maes et al., 2016; European Commission et al., 2020; European Union, 2020: Vallecillo et al., 2019), which refers to the number of services obtained and utilised by human society from the ecosystem, such as the total amount of water used in personal or economic activities. The supply of ecosystem services directly depends on regional ecological integrity, which is influenced by human actions and decisions such as land cover change, land use, and technological progress. Similarly, the use of ecosystem services is influenced by policies, population dynamics, economic factors, cultural norms, and governance influence. Therefore, the supply and use of ecosystem services must be distinguished and accounted for to guide the formulation of relevant policies for ecological restoration and protection (Curran and de Sherbinin, 2004). Nevertheless, in previous assessments of ecosystem services, most did not distinguish between supply and use, instead choosing only one or the other in ecological studies or economic statistics applications (van Jaarsveld et al., 2005; McDonald, 2009; García-Llamas et al., 2018; European Union, 2020). For example, Song and Ouyang (2020) took Qinghai Province as an example to research the potential gross ecosystem product (GEP), accounting for an ecological benefit assessment. The United Nations Cooperation Project (NCAVES) calculated the actual gross ecosystem product of Guangxi and Guizhou in China based on the SEEA framework in 2016 (NBS China UNSD and UNEP, 2021), while the EU MAES report accounted for ecosystem services ‘ supply and use (European Union, 2020). However, in its accounting, the functional quantity index cannot be compared horizontally but only vertically. The supply and use of ecosystem services are interconnected and interact with each other, just like ecosystems and socioeconomic systems. These concepts must be connected for horizontal comparison to reflect the local ecosystem background and human utilisation of ecosystem services and formulate reasonable management policies.
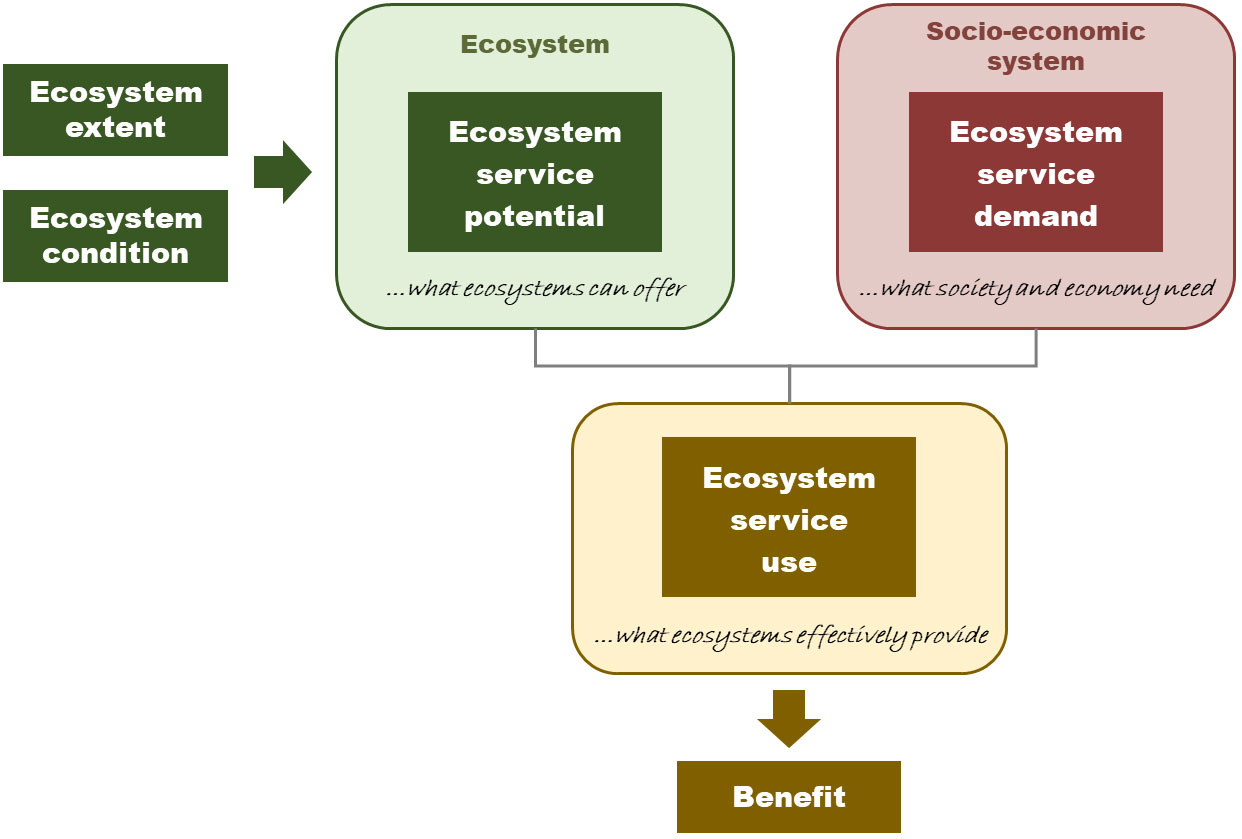
Figure 1 Scheme of the ecosystem services indicators [modified from EC et al. (2020)].
The value quantity of ecosystem services is more widely used than the functional quantity because it converts different types of services into common weights before measuring them to facilitate horizontal comparison and comprehensive evaluation (Costanza et al., 1997; Boyd and Banzhaf, 2007). In 2013, Ouyang et al. (2013) from the Chinese Academy of Sciences proposed the concept of gross ecosystem product. In 2021, the United Nations released the first international standard, the SEEA-EA manual, which cited the concept of gross ecosystem product at an international level (United Nations, 2021). The following year, the National Bureau of Statistics of China and the National Development and Reform Commission jointly issued the Standard for Accounting of the Total Value of Ecosystem Products (Trial) by referring to the SEEA-EA manual, emphasising the accounting of ecosystem services used by human beings (National Development and Reform Commission, 2022). The 2013 concept emphasises the supply capacity of ecosystem services, while the 2021 concept emphasises the actual utilisation of ecosystem services by humans. The different emphasis of gross ecosystem product concepts also reflects the different focus of people in different fields: supply and use.
In summary, this study selected value indicators to calculate the supply and use of ecosystem services, namely potential and actual gross ecosystem product, to evaluate and compare the supply capacity and actual use of ecosystem services in Miyun County horizontally. In this study, we aimed to comprehensively understand the interdependence between the ecosystem and human society in Miyun County and provide decision-making support and policy guidance for ecological protection and sustainable development. Potential gross ecosystem product reflected the functional status of the ecosystem, which provided data support for its ecological protection benefit assessment, performance appraisal and outgoing audit of local leading cadres. Actual gross ecosystem product reflected the actual benefits of human society, which could be included in the system of national accounts(SNA), and as a standard for ecological compensation and criteria for ecological trading. Both together provided management basis and policy-making support for guiding regional ecological protection and sustainable development.
2 Materials and methods
2.1 Study area
Miyun County is located northeast of Beijing (40°13′–40°47′ N and 116°39′–117°30′ E). It is flanked by the Pinggu, Shunyi, and Huairou Counties of Beijing in the southeastern to northwestern regions and Hebei Province in the northern and eastern regions. With a total area of approximately 2229.45 km2, it is the largest county in Beijing (Figure 2).
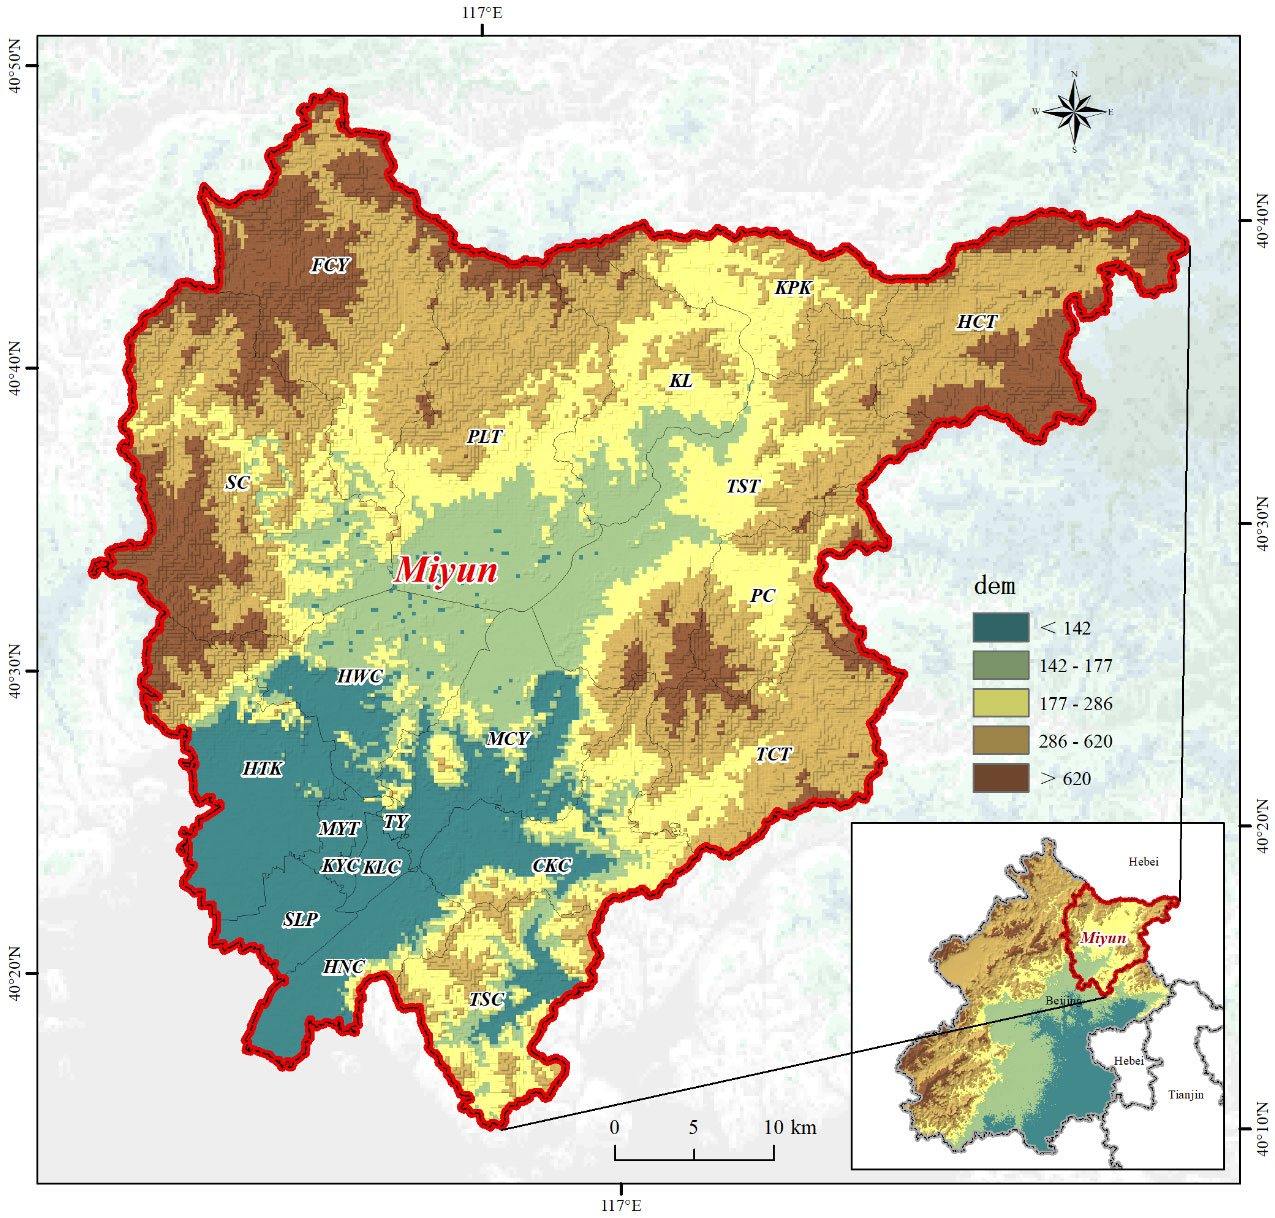
Figure 2 Geographical location of the study area. Blue indicated low altitude and brown indicated high altitude. The red line was the border of Miyun County, and the black labels represented the 20 townships in Miyun County respectively.
Miyun belongs to the Yanshan Mountains and North China Plain junction, and mountains surround the terrain of the entire area on three sides (north, east, and west). The Miyun area has a warm temperate monsoon continental semi-humid and semi-arid climate with four seasons and apparent changes in dry, wet, cold, and warm conditions. The annual average temperature is 6–19°C; the frost-free period is about 150 d; and precipitation mainly falls from June to August. The precipitation distribution generally decreases from southeast to northwest, with an average annual of 300–700 mm rainfall per year.
In 2020, the main ecosystem types in Miyun County were forests (41.6%) and shrubs (22.9%), followed by farmlands (21.9%) and wetlands (6.6%). Natural ecosystems (forests, shrubs, grasslands, and wetlands) account for 72.4% of the total area of Miyun County. The quality of the ecosystem in Miyun County is high, and natural resources are abundant (Figure 3).
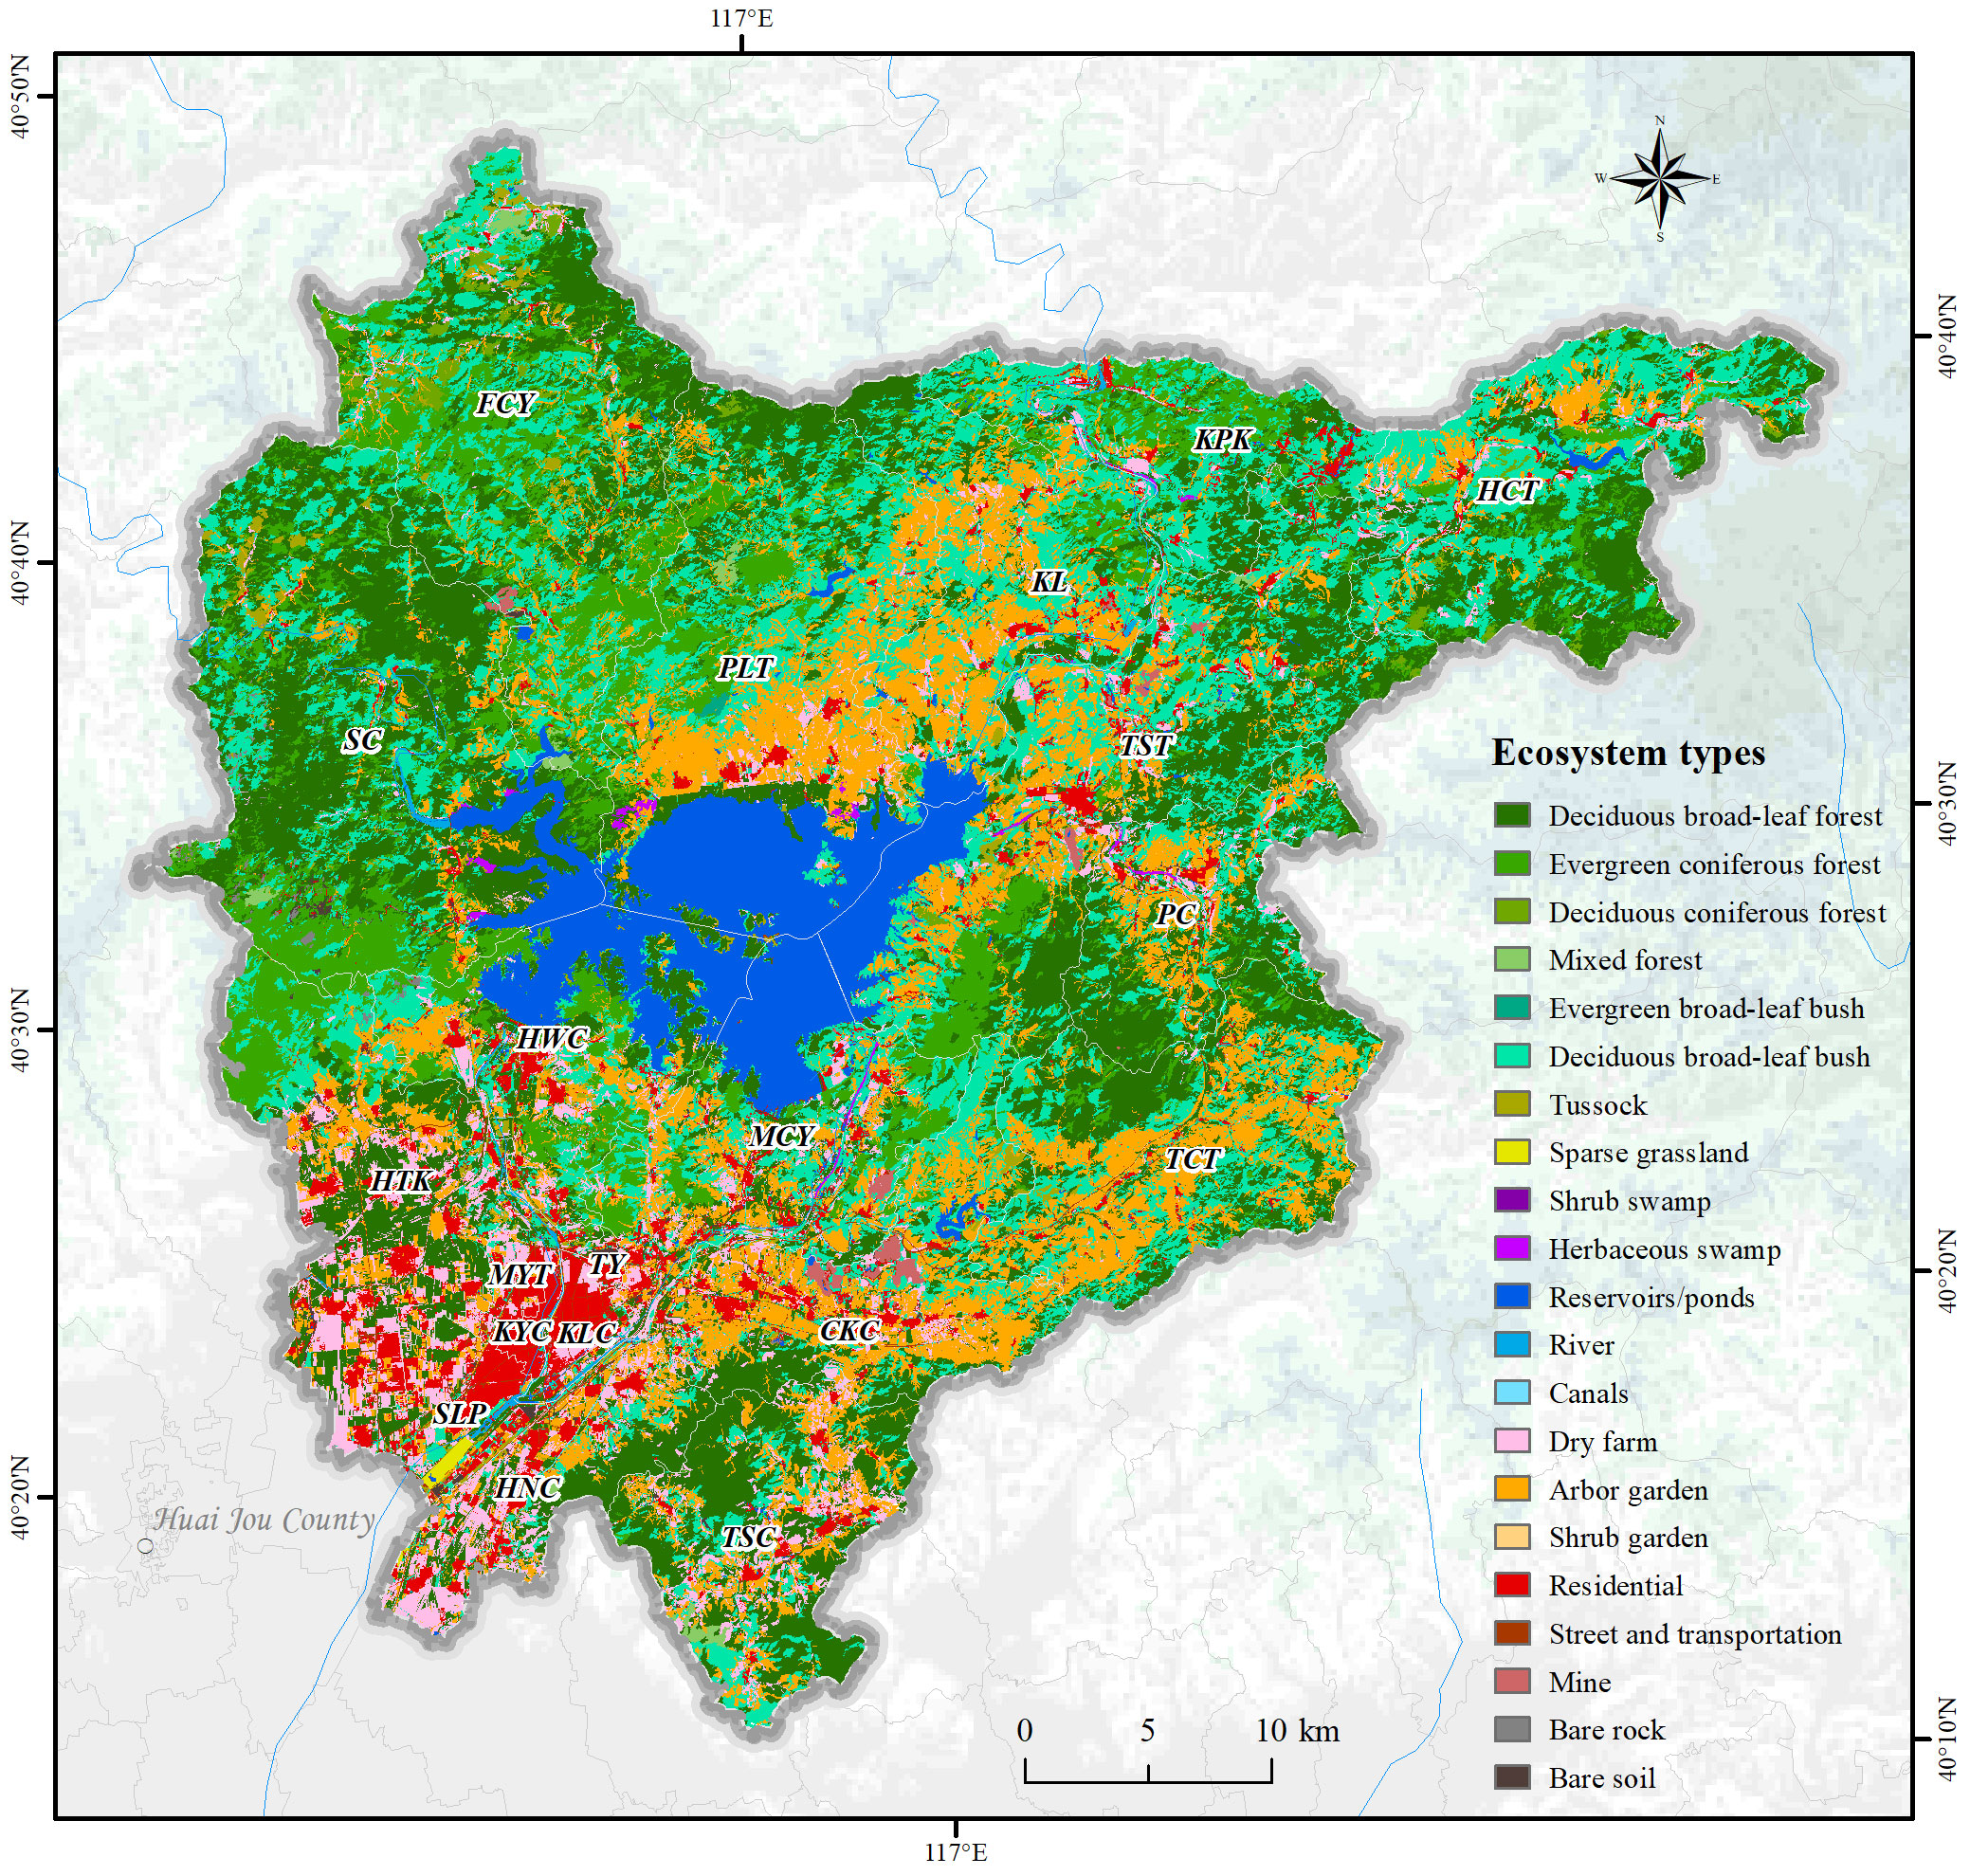
Figure 3 Ecosystem types distribution of the study area (10m resolution ratio). The black labels represented the 20 townships in Miyun County respectively.
2.2 Data sources
The data from 2020 was used in this study for gross ecosystem product calculation, and various data sources, including statistical and geospatial data, were integrated into this study. Statistical data were obtained from the statistical survey information of the Miyun County Ecological Environment Bureau, Water Bureau, Meteorological Bureau, Cultural and Tourism Bureau, other industry departments, and the Miyun Statistical Yearbook. Ecosystem classification, vegetation coverage, biomass, evapotranspiration, and other geospatial data were obtained from the Institute of Remote Sensing and Digital Earth, Chinese Academy of Sciences, with 10, 250, 250, and 500 m data resolutions. Rainfall data (Peng et al., 2019) were obtained from the National Earth System Science Data Center (http://www.geodata.cn) at a resolution of 1 km.
2.3 Methods
The gross ecosystem product accounting of Miyun County includes three categories: material supply, regulation service, and cultural service. Material supply includes crop supply services. Regulation services include seven types of services: water retention, soil retention, flood control, carbon sequestration, air purification, water purification, and climate regulation. Cultural services include nature-based tourism, recreation, and leisure. For these ten types of services, the potential (Ouyang et al., 2013) and actual gross ecosystem product (National Development and Reform Commission, 2022) were calculated, and the accounting indicators are listed in Table 1.
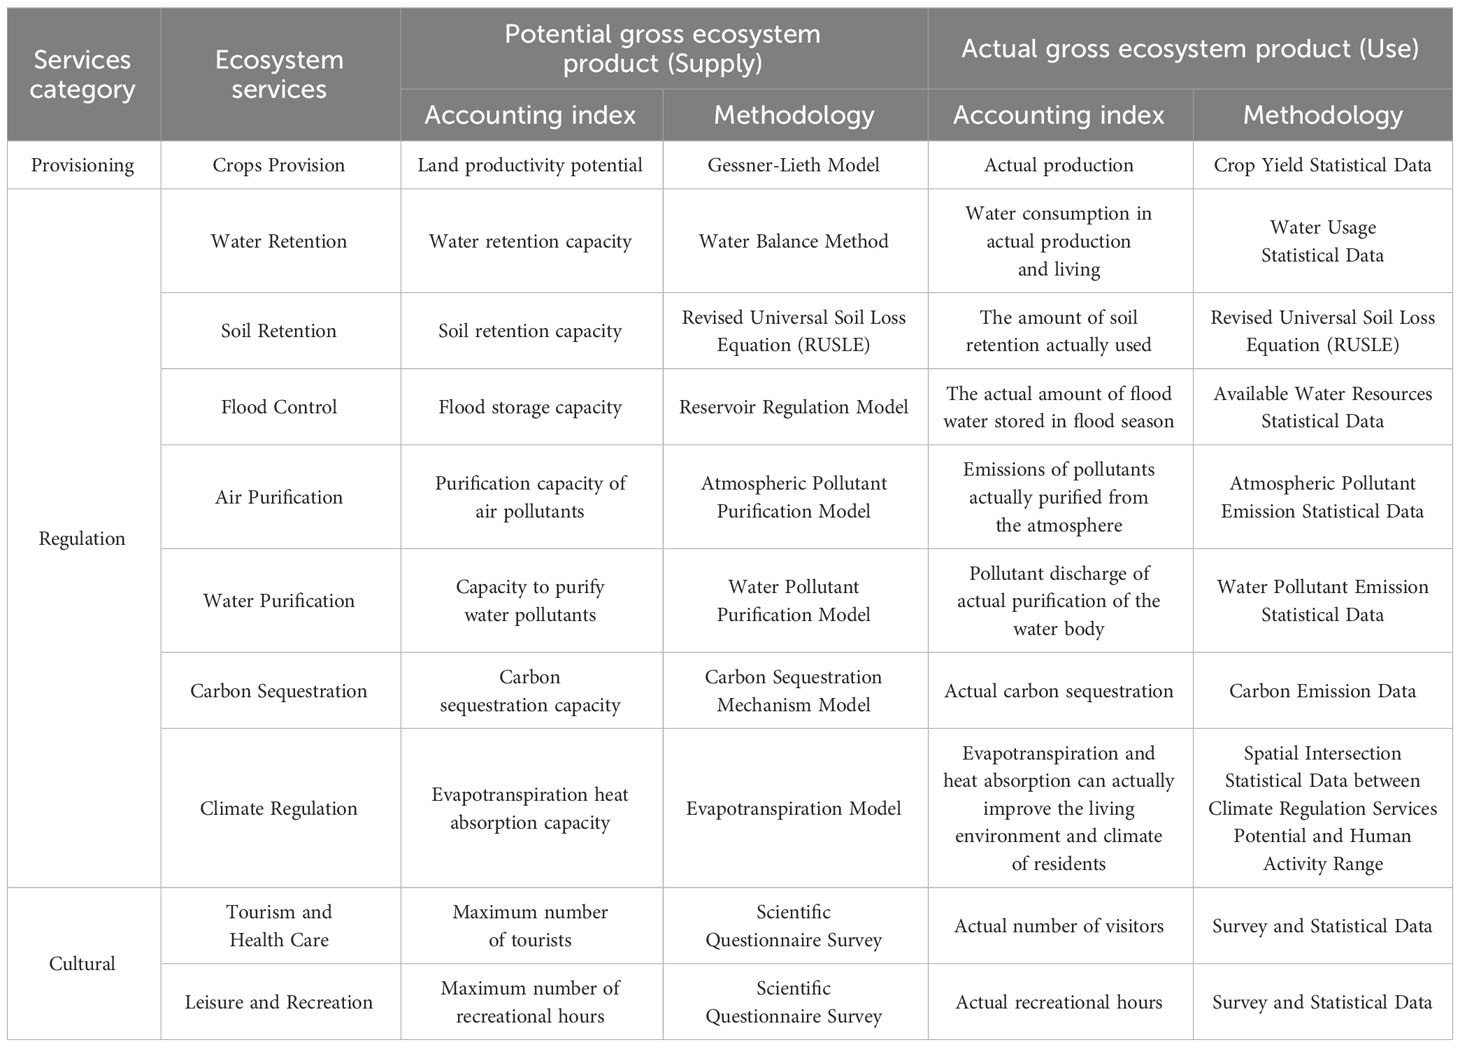
Table 1 Ecosystem products accounting indicators.
Bivariate correlation analysis was used to assess the degree of association between pairs of variables. According to the search results of the Web of Science (WOS), core set = “ecosystem service*” and “driving force*”, the factors with the highest use frequency and no repetition were selected. Because of minimal spatial variation in climate factors such as precipitation and temperature in Miyun, these factors were not included in the analysis. Finally, the natural ecosystem area, built-up area, vegetation coverage, normalised difference vegetation Index (NDVI), slope, digital elevation model (dem), total population, and GDP were selected for the driving force analysis.
3 Results
The potential gross ecosystem product for Miyun County was 254.32 billion yuan in 2020 (Table 2). Among all the ecosystem services, the water retention service contributed the most (119.5 billion yuan), accounting for 47% of the potential gross ecosystem product in Miyun County, followed by the natural landscape (52.16 billion yuan). Wetland ecosystems were the main contributors to water retention services. The value of ecosystem services provided by wetlands was almost 4.5 times that provided by the other areas (per unit area) combined (Figures 4, 5A).
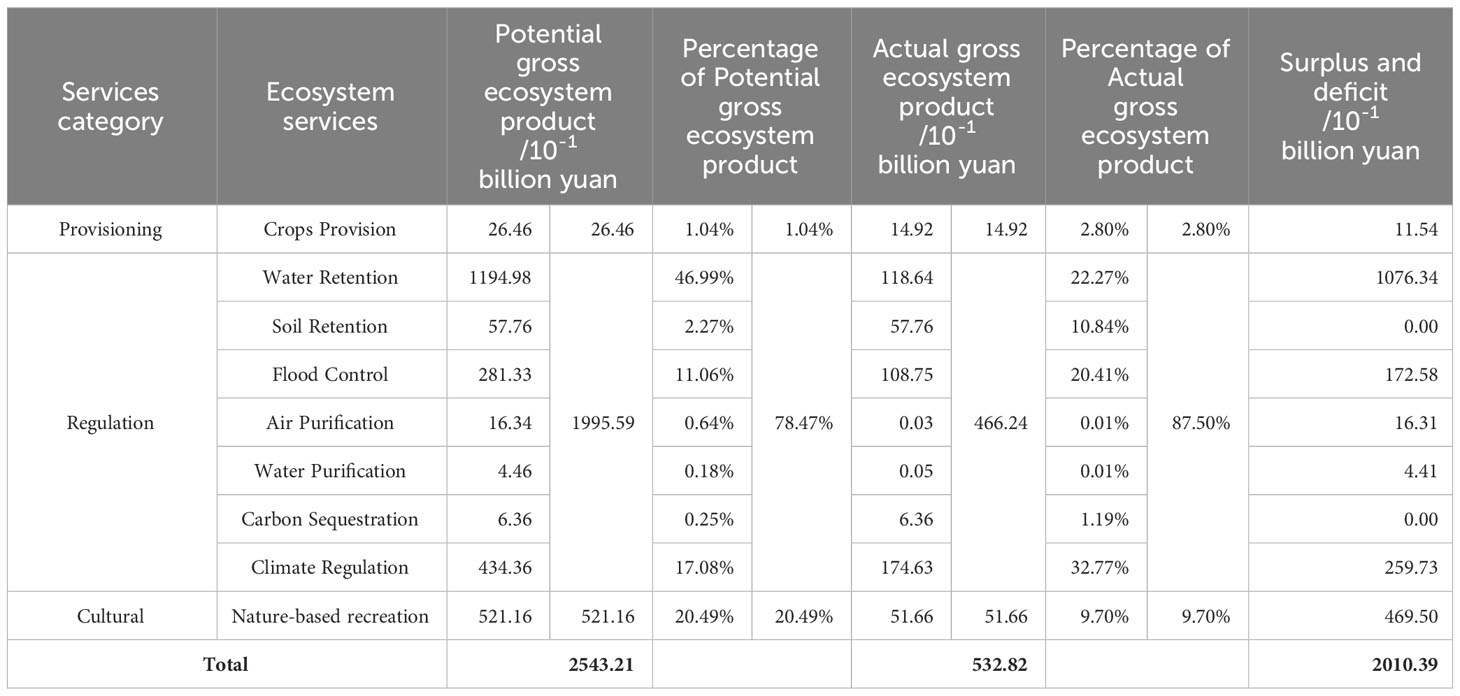
Table 2 Potential and actual gross ecosystem product in Miyun.
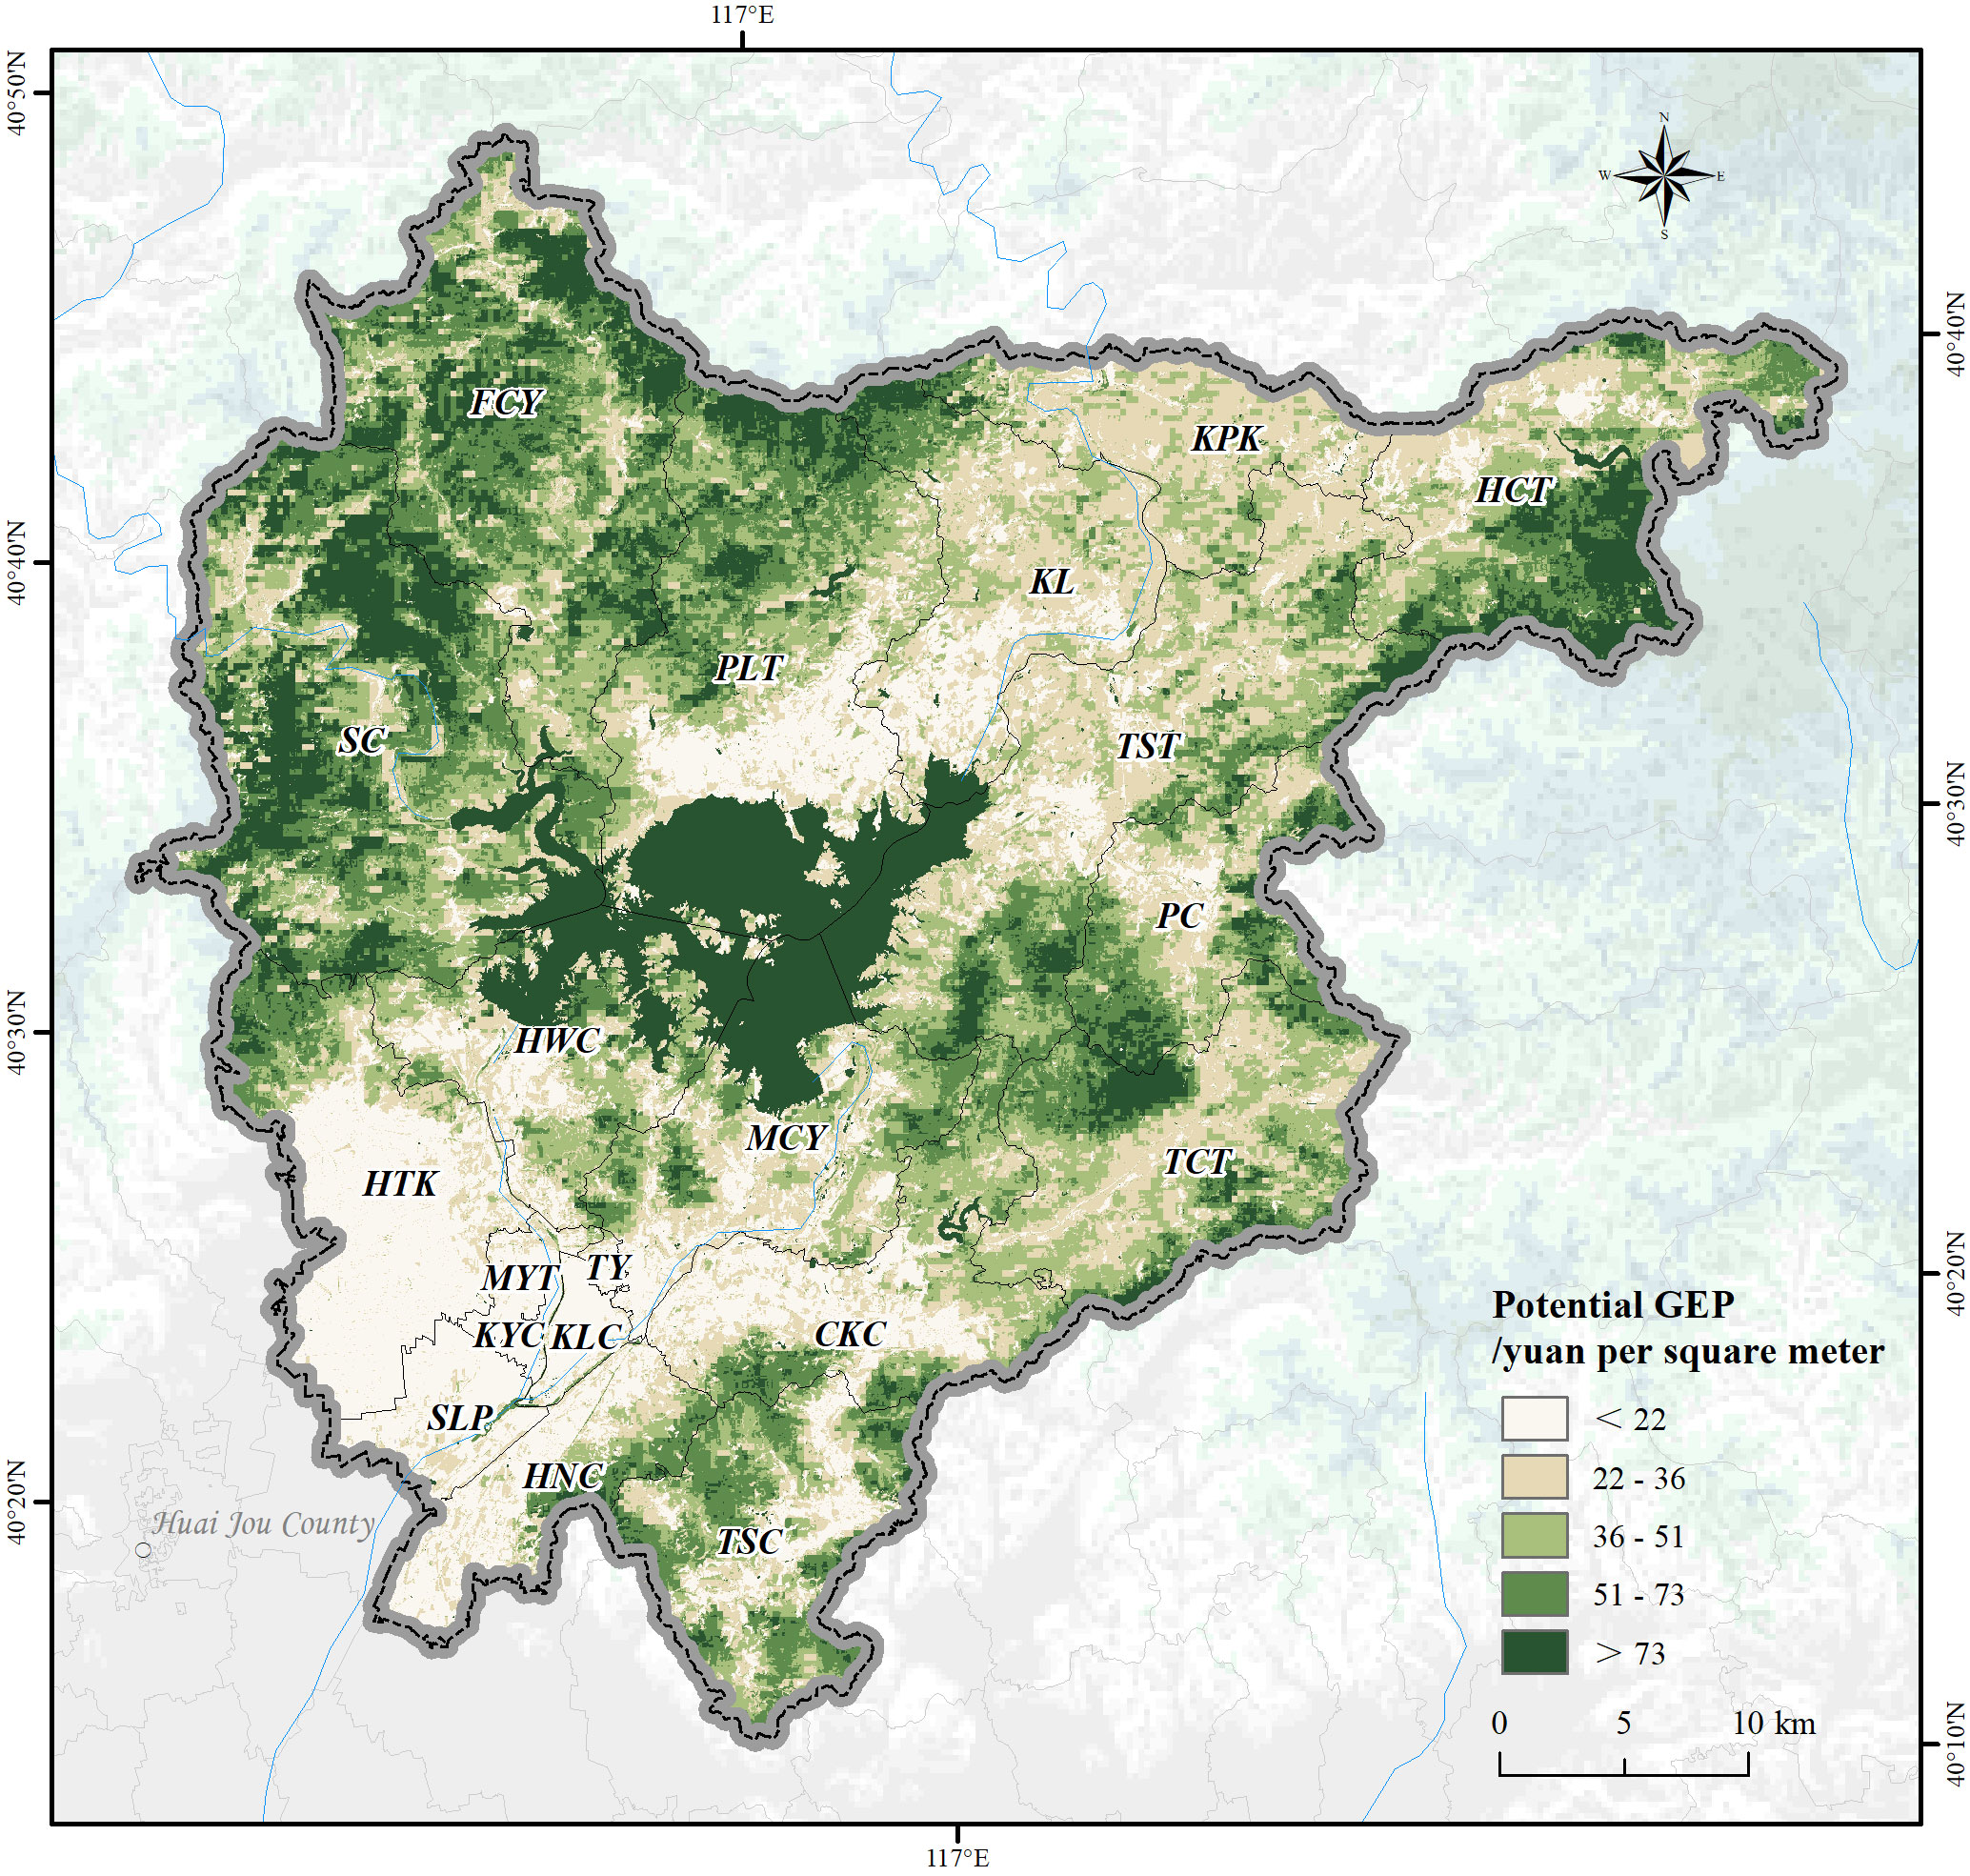
Figure 4 Spatial pattern of potential gross ecosystem product in Miyun County (10m resolution ratio). The darker the green, the higher the value of potential gross ecosystem product. The black labels represented the 20 townships in Miyun County respectively.
The actual gross ecosystem product in Miyun County was 53.28 billion yuan. Among all kinds of ecosystem services, the contribution of climate regulation service was the highest (17.46 billion yuan), accounting for 32.8% of the actual gross ecosystem product in Miyun County, followed by the water retention service (11.86 billion yuan). Forest ecosystems contributed the most to climate regulation. The value of ecosystem services contributed by wetlands per unit area was the highest at 96 yuan/m2 (Figure 5B).
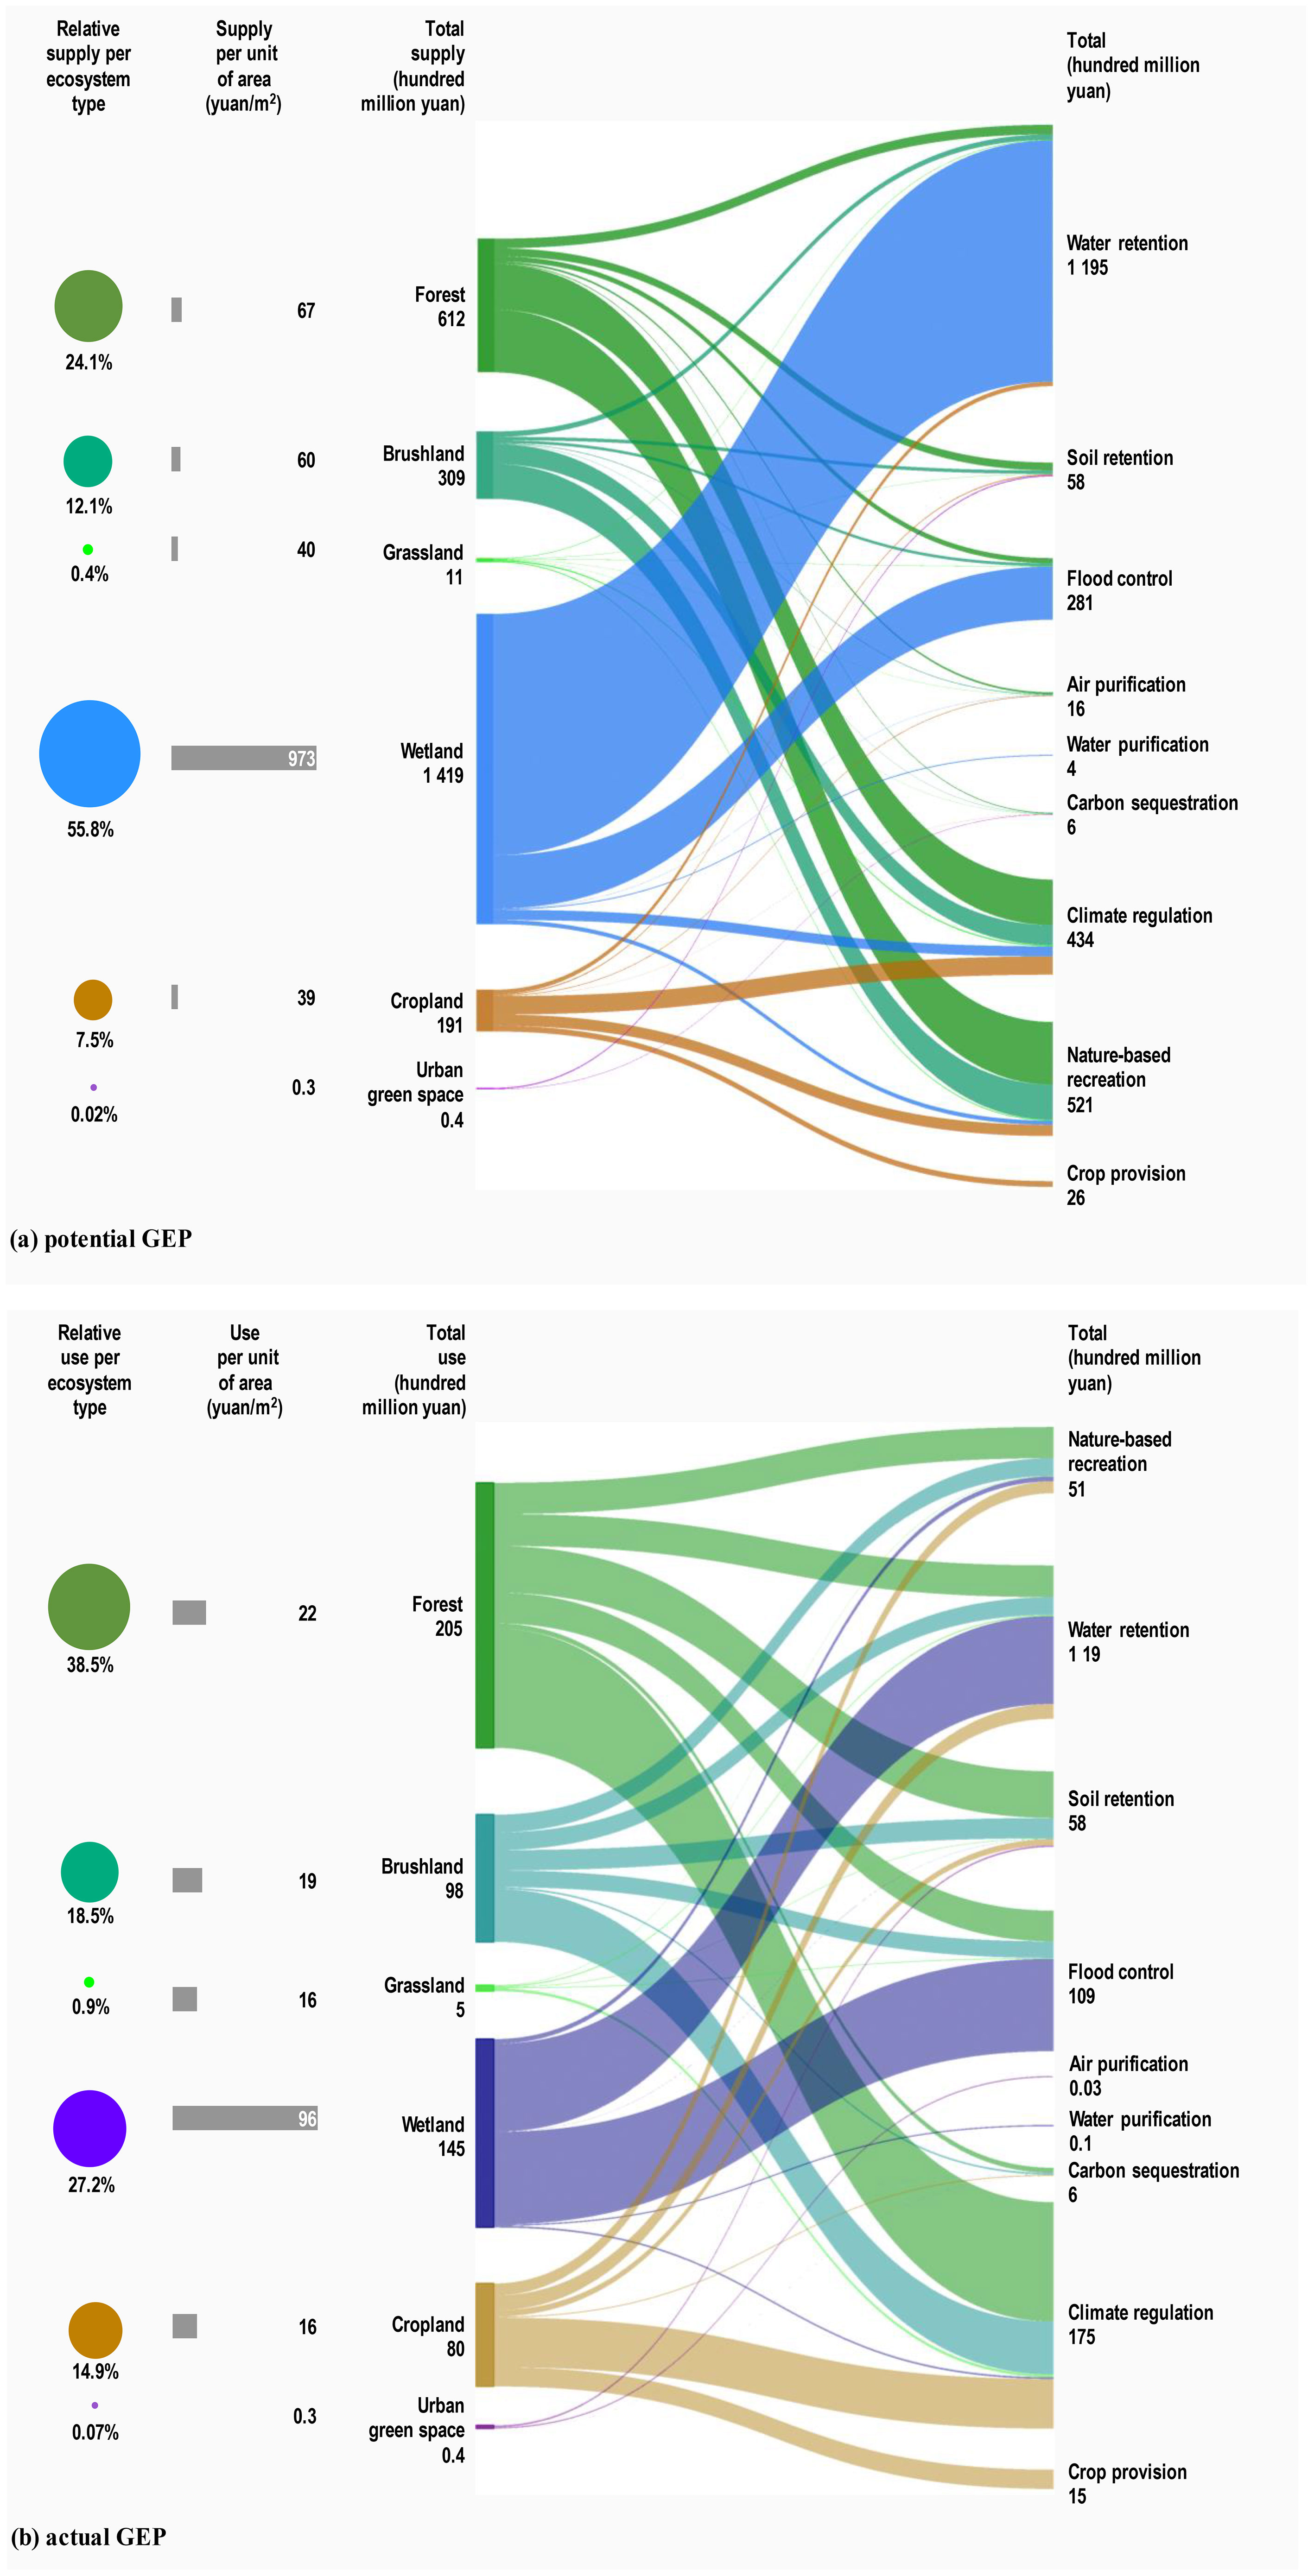
Figure 5 (A) Potential gross ecosystem product composition of the ecosystem in Miyun County. The circle showed the percentage of potential gross ecosystem product contributed by each ecosystem type. The bar chart showed the potential gross ecosystem product value per unit area of each ecosystem type. The Sankey chart showed the total value of each ecosystem service provided by each ecosystem type in the potential gross ecosystem product; (B) Actual gross ecosystem product composition of the ecosystem in Miyun County. The circle showed the percentage of actual gross ecosystem product contributed by each ecosystem type. The bar chart showed the actual gross ecosystem product value per unit area of each ecosystem type. The Sankey chart showed the total value of each ecosystem service provided by each ecosystem type in the actual gross ecosystem product.
Among all types of ecosystems in Miyun County, wetlands contributed the most to the potential gross ecosystem product (141.92 billion yuan), followed by forests (61.19 billion yuan) and urban ecosystems (0.4 million yuan). Forests contributed the most to the actual gross ecosystem product (20.49 billion yuan), followed by wetlands (14.47 billion yuan). The contribution of urban ecosystems to the actual gross ecosystem product were the same as its contribution to the potential gross ecosystem product (0.4 billion yuan). Although the demand in urban ecosystems was theoretically high, owing to its low supply capacity, the ecosystem services provided by urban ecosystems were utilised by residents and contributed to the actual gross ecosystem product (Figure 6).
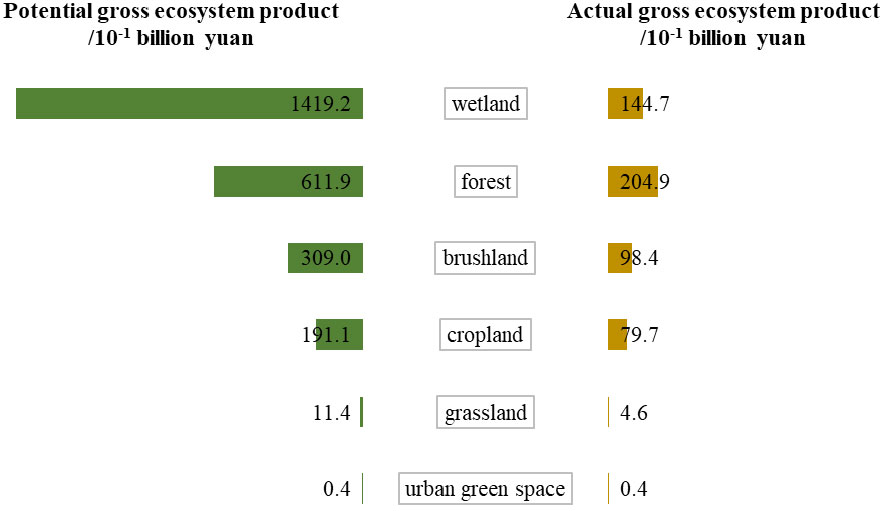
Figure 6 Potential and actual gross ecosystem product of different ecosystems in Miyun County. The green bars represented the potential gross ecosystem product for each ecosystem, and the brown bars represented the actual gross ecosystem product for each ecosystem. The longer the bar, the larger the value.
The spatial distribution patterns of potential gross ecosystem product In Miyun exhibited apparent spatial heterogeneity. The potential gross ecosystem product was high in the Northwestern region and the surrounding areas of the Miyun Reservoir. Areas with high values of ecosystem services were affected mainly by the Miyun Reservoir and Chaobai River systems, with rich vegetation, high water retention and climate regulation service values, and relatively complete ecological functions. Therefore, the supply potential was high. The potential gross ecosystem product was low in the southwestern region, mainly distributed around the economic centre of Miyun County. Water and vegetation areas were small because of the extensive distribution of construction land. Therefore, the supply potential of ecosystem services was low (Figure 7).
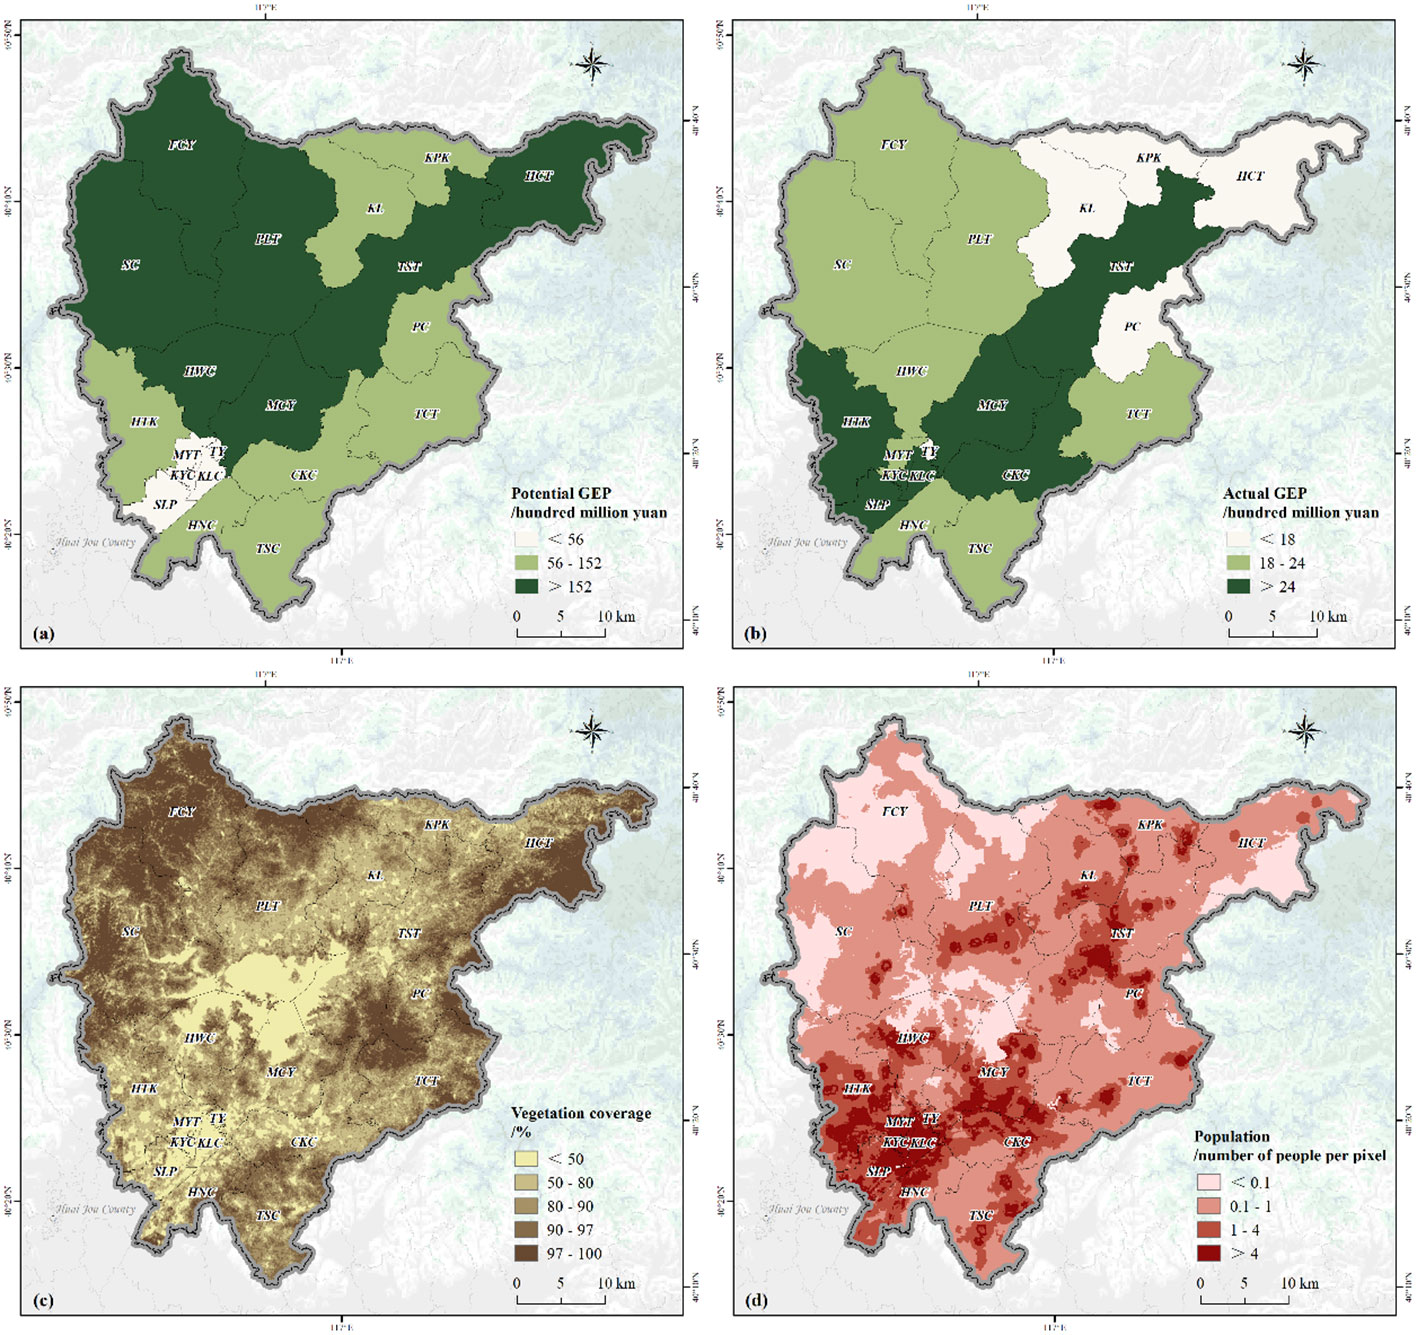
Figure 7 (A) Potential gross ecosystem product in Miyun; (B) Actual gross ecosystem product in Miyun; (C) Vegetation coverage in Miyun; (D) Population distribution in Miyun. The spatial distribution pattern of actual gross ecosystem product was affected by the supply potential of ecosystem and the demand distribution of human society. However, research on the framework of ecosystem services is still in its initial and conceptual stages, and the feedback mechanism between spatial attribute characteristics and location, such as the spatial flow path, flow, and degree of ecosystem service use, is still poorly understood. Therefore, we can only compare the actual gross ecosystem product value through the geographical distribution of 20 townships in Miyun County. The darker the colour, the higher the value. From these four maps, potential gross ecosystem product was similar to the distribution of high and low areas of vegetation cover, and actual gross ecosystem product was similar to the distribution of high and low areas of population (the spatial distribution we used to represent demand).
The distribution pattern of the actual gross ecosystem product In the Miyun area also exhibited obvious spatial heterogeneity. High actual gross ecosystem product was primarily associated with the southwestern region. This is due to the rapid economic and social development, high levels of regional economic development, dense populations, and high intensities of ecosystem service use. Areas with low actual gross ecosystem product were mainly distributed in the northeast. Owing to their low degree of development and utilisation, poor regional accessibility, and low population, the intensity of the use of ecosystem services was low.
The difference between the potential and actual gross ecosystem product in Miyun tended to be lower in the southern region and higher in the central and northern regions. With regards to the spatial distribution, gross ecosystem product surplus areas were mainly distributed in the northwestern regions with an excellent ecological environment and relatively low population density. In the southwestern regions, the regional economic development speed is fast, the construction land area is large, and the ecological resource utilisation intensity is high. Consequently, the potential supply of ecosystem services could not meet the needs of residents, as reflected in the gross ecosystem product deficit (Figure 8).
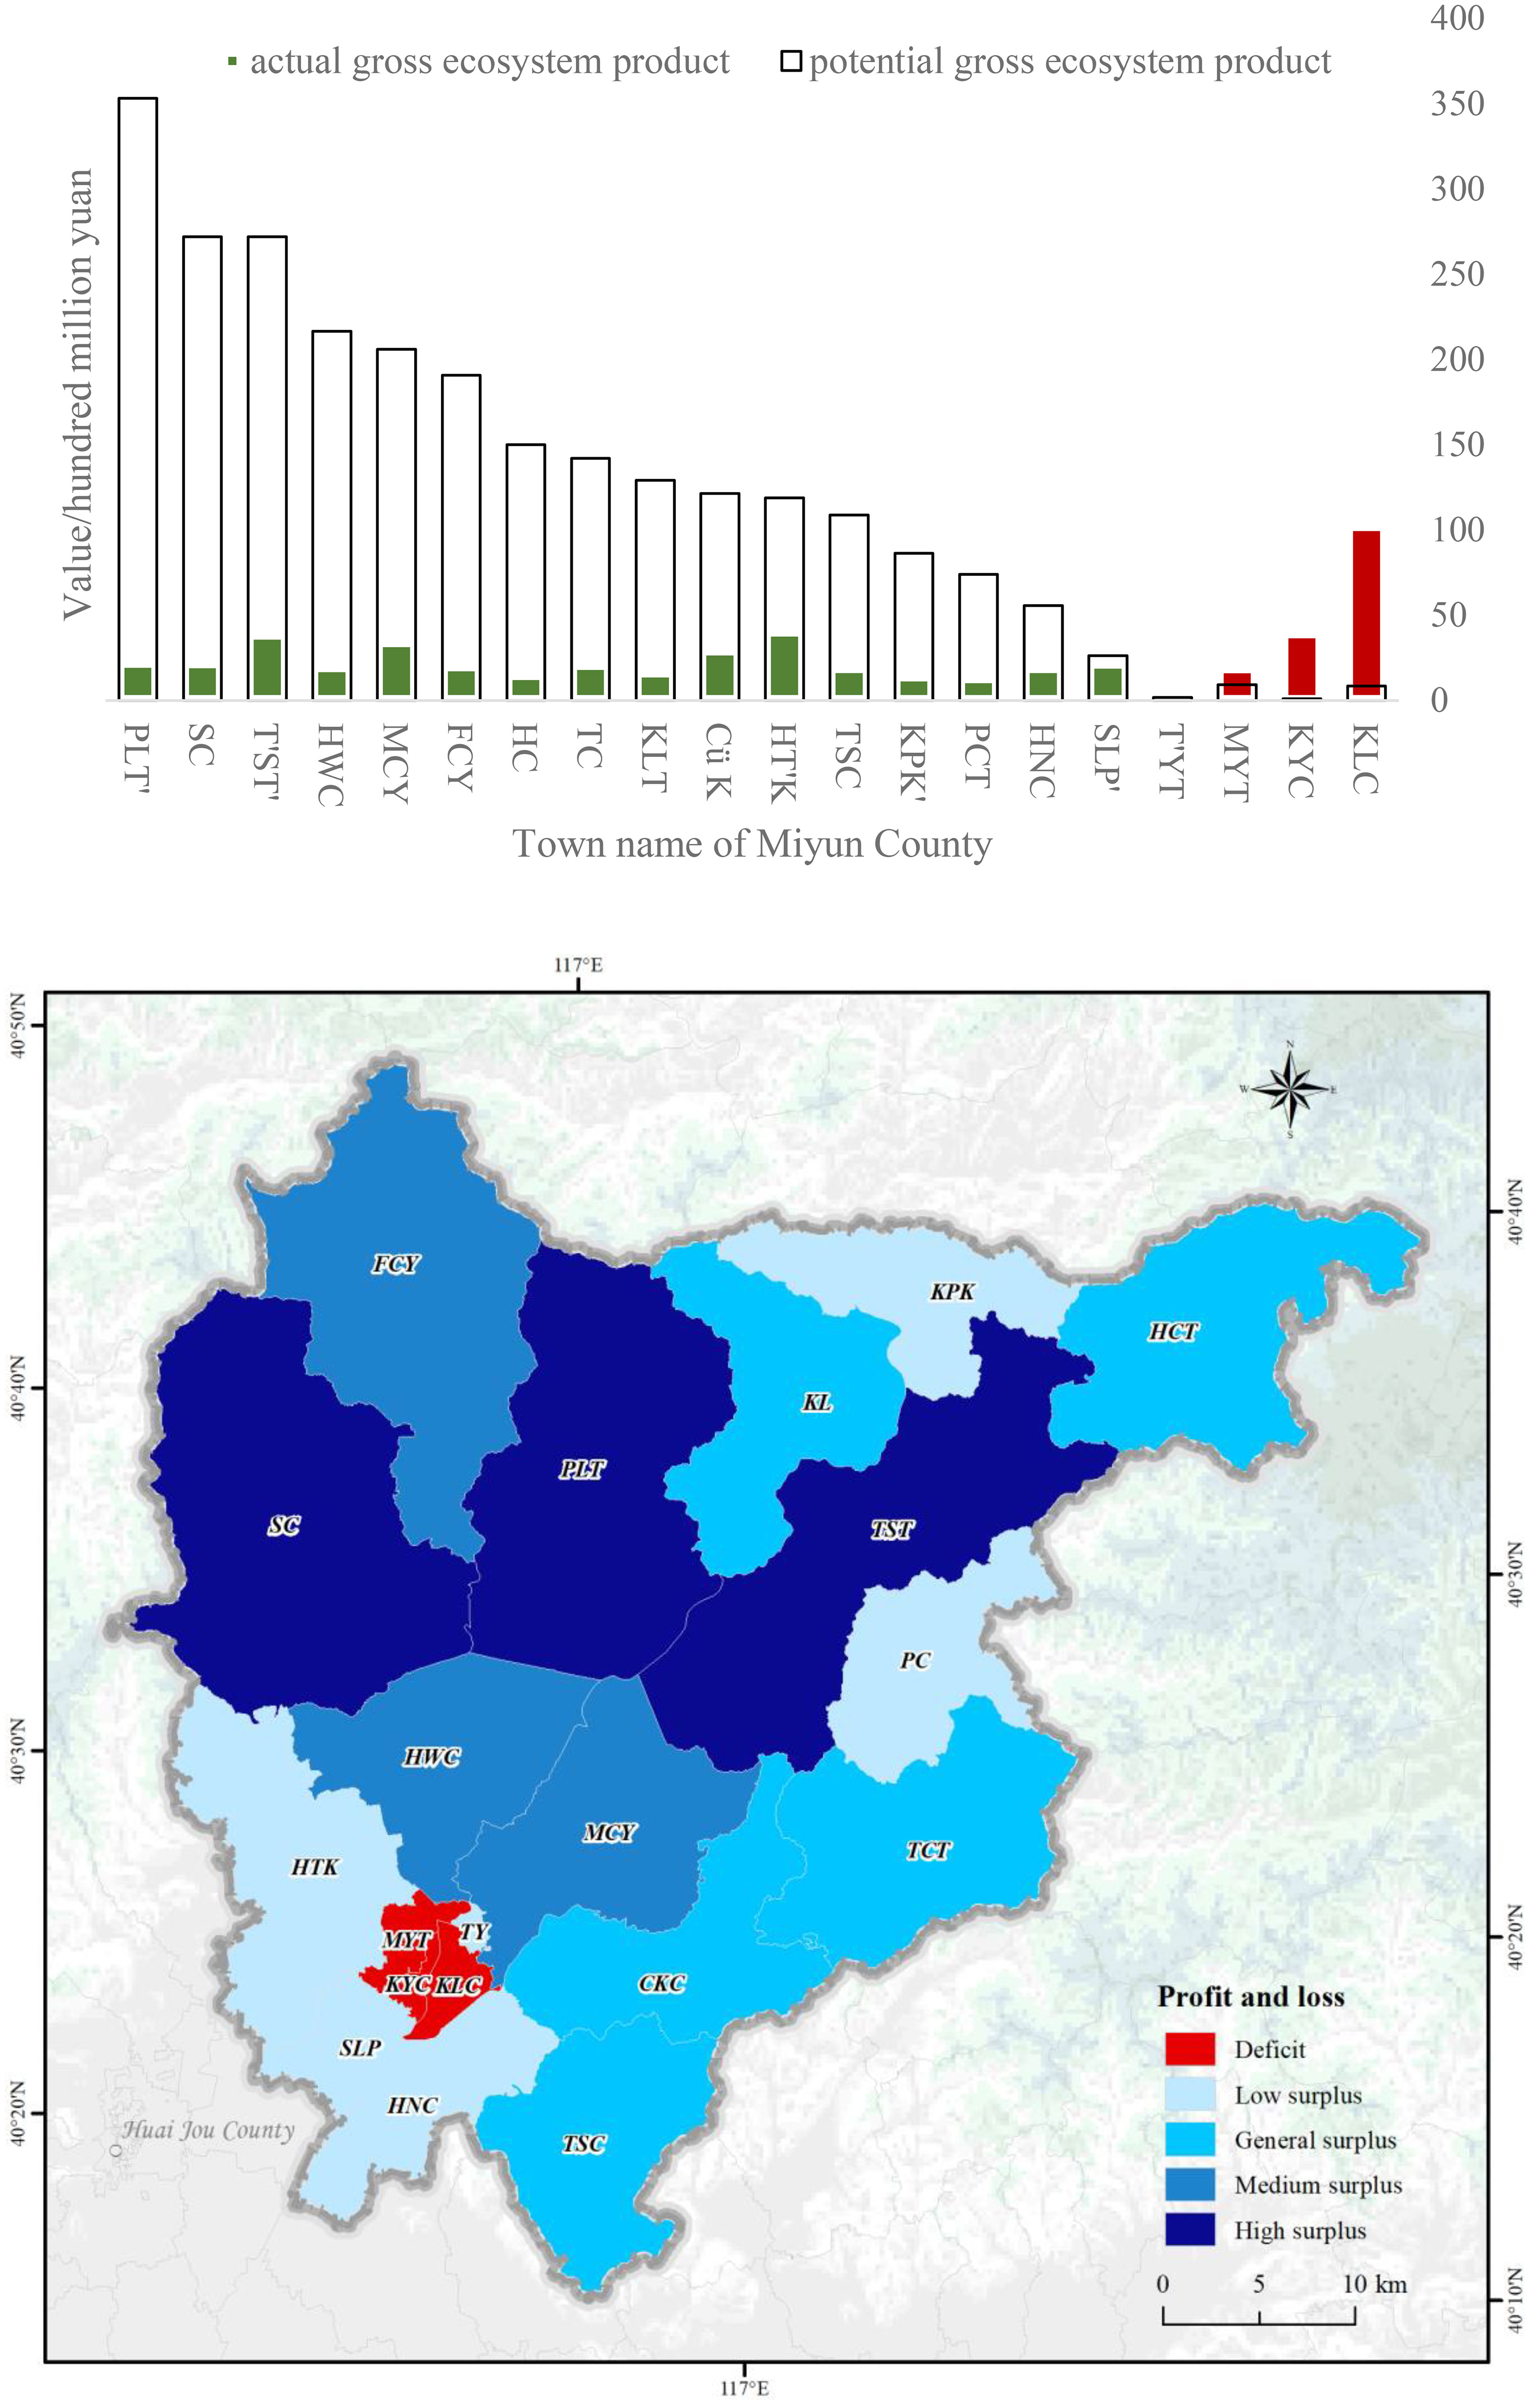
Figure 8 Supply-use profit and loss of each township in Miyun County. In the bar chart above, the hollow pillar indicated the potential gross ecosystem product. The solid green pillar indicated the actual gross ecosystem product, which did not exceed its potential gross ecosystem product. The solid red pillar indicated the actual gross ecosystem product, which did exceed its potential gross ecosystem product. In the space below, red represented the supply-use deficit (i.e. potential gross ecosystem product minus actual gross ecosystem product less than 0). Blue indicated a supply-use surplus (i.e., potential gross ecosystem product minus actual gross ecosystem product greater than 0), and the darker the blue, the greater the surplus.
For natural ecosystems (forests, shrubs, grasslands, and wetlands), the potential gross ecosystem product was positively correlated with the actual gross ecosystem product (R2 = 0.61). It follows that, within natural ecosystems, the greater the supply intensity of ecosystem services, the higher the use intensity. However, due to the intensity of human interference, farmlands, towns, and bare land did not show correlations between actual and potential gross ecosystem product. Correlation analysis between the driving factors and the potential and actual gross ecosystem product showed that the natural ecosystem area (R2 = 0.88) and vegetation coverage (R2 = 0.73) were the main factors affecting potential gross ecosystem product in Miyun County. The GDP (R2 = 0.84) and population (R2 = 0.82) were the main factors affecting actual gross ecosystem product in Miyun County (Figure 9).
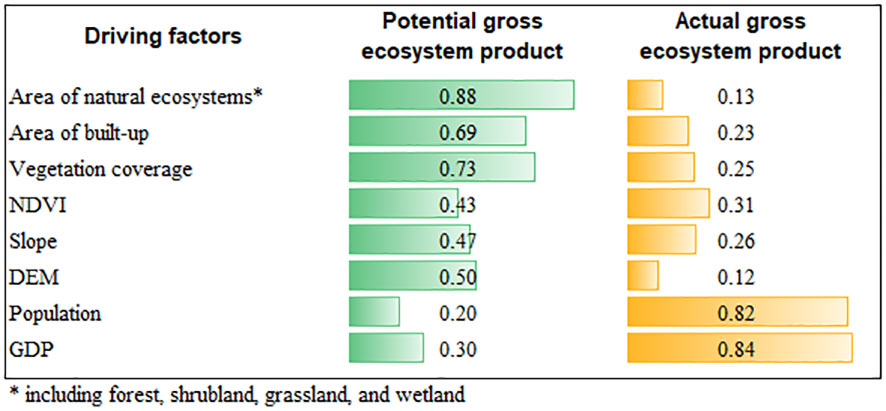
Figure 9 Correlation coefficient of the driving factors.
4 Discussion
In 2020, the potential gross ecosystem product of Miyun County was 254.32 billion yuan, and the actual gross ecosystem product was 53.28 billion yuan, approximately 21% of the potential gross ecosystem product. Water retention services had a higher supply capacity among all the ecosystem services, whereas climate regulation services were more useful to people. Among all types of ecosystems, wetlands had the highest supply capacity for ecosystem services, which reflects the importance of wetland ecosystems in Miyun County. This is especially true for reservoirs in the supply of ecosystem services. The areas centred around and close to the Miyun Reservoir are rich in water resources and fishery products, and have strong climate regulation ability, which brings high tourism and cultural value. As a result, the potential gross ecosystem product of the reservoir around the bank and the supply potential were high, differing substantially from the high-deficit areas outside the bank. The actual gross ecosystem product accounted for only 21% of the potential gross ecosystem product, indicating that the overall intensity of the local use of ecosystem services is relatively low compared with the potential service supply. The difference between the potential and actual gross ecosystem product show the scope of vast exploitable space for water retention and natural landscape services in Miyun County. Therefore, local governments should consider further rational development and utilisation of ecological resources such as promoting local water resource utilisation and tourism development under a sustainable model and achieve a “win-win situation” between the social economy and the ecological environment. The potential gross ecosystem product in the Miyun area positively correlated with the actual gross ecosystem product of natural ecosystems, which means that the greater the supply intensity of ecosystem services, the higher the use intensity. This correlation also suggested that the availability of ecosystem services was one of the factors promoting their use. Thus, increasing the supply of ecosystem services through increased investment in protecting and maintaining ecosystems will directly benefit people, which was consistent with a study done by Aziz (2023).
When the use of an area exceeded its local supply (actual gross ecosystem product > potential gross ecosystem product), it indicated that the utilisation of the ecosystem by the local human society exceeded the threshold of its ability to provide ecosystem services, and when the utilisation of ecosystem services by human beings increased, it often comes at the cost of the ecosystem service potential, which could result in ecosystems being unable to continue to meet human demand for services, reducing the ecosystem’s contribution to human well-being (EC, 2008). Therefore, when formulating policies, local governments should focus on strengthening the protection of the wetland ecological environment and maintaining its advantages. In regions with medium to high surplus, the government can encourage ecotourism and the development of ecological products to boost local economic growth, raise awareness about ecosystem services, and promote their utilisation. By introducing ecotourism initiatives and supporting local ecological products, residents can be encouraged to actively safeguard and utilise ecosystem services. For areas with general or low surplus, the government should focus on ecological restoration and protection, enhancing ecosystem stability and capacity through activities such as vegetation restoration, wetland conservation, and water source protection. Additionally, promoting ecological agriculture and forestry, adopting eco-friendly practices, and enhancing ecosystem service supply in farmlands and forests are essential. In deficit areas where natural ecosystems are scarce, the government can invest in building ecological infrastructure like wetland parks, green spaces, and nature reserves to boost ecosystem service supply. These efforts not only enhance ecosystem services but also improve environmental quality and residents’ quality of life. Implementing resource taxation and fees in deficit areas can curb overuse, encouraging more efficient resource utilisation. Establishing strict land development controls can limit damage to ecosystems and prevent overuse of services. It is crucial for the government to institute ecological compensation and incentive mechanisms across Miyun County to reward effective ecosystem management. By economically rewarding major ecosystem service providers, excessive consumers can be motivated to preserve and enhance ecosystem services effectively.
Potential gross ecosystem product could be used as the basis for ecological protection benefit assessment and government performance assessment. Actual gross ecosystem product could be included in the system of national accounts (SNA), and also could be used as a standard for ecological compensation and criteria for ecological trading. In our study, the supply and use of ecosystem services were distinguished and compared to fully understand the interdependence between the ecosystem and economic society in Miyun County. Simultaneously, value indicators were selected to compare potential and actual gross ecosystem product horizontally to understand the overall supply potential of ecosystem services and the relative situation of human use in the study area, providing a reference for decision-making.
This study has some limitations. From the perspective of ecosystem service flow, three components — supply, flow path, and demand — must be considered. Research on the framework of ecosystem services is still in its initial and conceptual stages, and the feedback mechanism between spatial attribute characteristics and location, such as the spatial flow path, flow, and degree of ecosystem service use, is still poorly understood. Although the total value of the supply and use of ecosystem services in Miyun County was calculated in this study, the spatial flow path of ecosystem services has not been determined. Therefore, we could not determine the flow direction of their supply and use and, thus, could not establish their spatial distribution or connection. Future studies could further explore the flow paths and ranges of ecosystem services between regions. Emphasis should be placed on applied research regarding ecosystem service flow, exploring the coupled relationship between ecosystems and human welfare, and promoting the continuous improvement of human welfare.
Data availability statement
The original contributions presented in the study are included in the article/Supplementary Material. Further inquiries can be directed to the corresponding author.
Author contributions
Y-qS: Conceptualization, Data curation, Formal analysis, Investigation, Methodology, Resources, Visualization, Writing – original draft, Writing – review & editing. XY: Formal analysis, Funding acquisition, Investigation, Methodology, Project administration, Supervision, Validation, Writing – review & editing. MC: Data curation, Investigation, Resources, Writing – original draft. Z-yO: Conceptualization, Investigation, Project administration, Supervision, Writing – review & editing.
Funding
The author(s) declare financial support was received for the research, authorship, and/or publication of this article. This work was supported by the Regional Potential and Final Ecosystem Products Accounting Methods (grant numbers: 2022YFF1301802).
Acknowledgments
The authors are grateful to the editor and reviewers for their careful and valuable suggestions.
Conflict of interest
The authors declare that the research was conducted in the absence of any commercial or financial relationships that could be construed as a potential conflict of interest.
Publisher’s note
All claims expressed in this article are solely those of the authors and do not necessarily represent those of their affiliated organizations, or those of the publisher, the editors and the reviewers. Any product that may be evaluated in this article, or claim that may be made by its manufacturer, is not guaranteed or endorsed by the publisher.
Supplementary material
The Supplementary Material for this article can be found online at: https://www.frontiersin.org/articles/10.3389/fevo.2024.1367768/full#supplementary-material
References
Aziz T. (2023). Terrestrial protected areas: Understanding the spatial variation of potential and realised ecosystem services. J. Environ. Manage 326, 0301–4797. doi: 10.1016/j.jenvman.2022.116803
Bayon R. (2004). Making environmental markets work: Lessons from early experience with sulphur, carbon, wetlands, and other related markets (Locarno, Switzerland: Forest Trends). Available at: http://hdl.handle.net/10919/66848.
Boyd J., Banzhaf S. (2007). What are ecosystem services? The need for standardised environmental accounting units. Ecol. Econ. 63, 616–626. doi: 10.1016/j.ecolecon.2007.01.002
Burkhard B., Kroll F., Nedkov S., Müller F. (2012). Mapping ecosystem service supply, demand and budgets. Ecol. Indic. 21, 17–29. doi: 10.1016/j.ecolind.2011.06.019
Chaplin-Kramer R., Sharp R., Weil C., Benett E. M., Pascual U., Arkema K. K., et al. (2019). Global modelling of nature’s contributions to people. Science 366(6462), 255–258. doi: 10.1126/science.aaw3372
Costanza R., d'Arge R., de Groot R., Farber S., Grassos M., Hannon B., et al. (1997). The value of the world’s ecosystem services and natural capital. Nature 387(6630), 253–260. doi: 10.1038/387253a0
Crossman N. D., Burkhard B., Nedkov S., Willemen L., Petz K., Palomo I., et al. (2013). A blueprint for mapping and modelling ecosystem services. Ecosyst. Serv. 4, 4–14. doi: 10.1016/j.ecoser.2013.02.001
Curran S. R., de Sherbinin A. (2004). Completing the picture: The challenges of bringing “consumption” into the population-environment equation. Popul. Environ. 26, 107–131. doi: 10.1007/s11111-004-0837-x
European Commission, Joint Research Centre, Maes J., Teller A., Erhard M., et al. (2020). Mapping and assessment of ecosystems and their services – An EU wide ecosystem assessment in support of the EU biodiversity strategy – Supplement (indicator fact sheets). doi: 10.2760/519233
European Union (2020). Mapping and assessment of ecosystems and their services: An EU ecosystem assessment.
Fisher B., Turner R. K., Morling P. (2009). Defining and classifying ecosystem services for decision making. Ecological economics. 68 (3), 643–653. doi: 10.1016/j.ecolecon.2008.09.014
García-Llamas P., Geijzendorffer I. R., García-Nieto A. P., Calvo N., Suarez-Seoane S., Cramer W. (2018). Impact of land cover change on ecosystem service supply in mountain systems: A case study in the Cantabrian Mountains (NW of Spain). Reg. Environ. Change. 19, 529–542. doi: 10.1007/s10113-018-1419-2
Goldenberg R., Kalantari Z., Cvetkovic V., Mrtberg U., Deal B., Destouni G. (2017). Distinction, quantification and mapping of potential and realised supply-demand of flow-dependent ecosystem services. Sci. Total Environ. 593–594, 599–609. doi: 10.1016/j.scitotenv.2017.03.130
Gómez-Baggethun E., de Groot R. D., Lomas P. L., Montes C. (2010). The history of ecosystem services in economic theory and practice: From early notions to markets and payment schemes. Ecol. Econ. 69, 1209–1218. doi: 10.1016/j.ecolecon.2009.11.007
Haines-Young R., Potschin M. (2010). “The links between biodiversity, ecosystem services and human well-being,” in Ecosystem Ecology: A New Synthesis. Eds. Raffaelli D., Frid C. (Cambridge University Press, Cambridge), 110–139. doi: 10.1017/CBO9780511750458.007
Holdren J. P., Ehrlich P. R. (1974). Human population and the global environment. Am. Sci. 62, 282–292.
Li Z. Y., Li S. P., Cao Y. G., Wang S. F., Liu S. H., Zhang Z. J. (2022). Ecosystem product supply and demand: Basic connotation and practical application. J. Agric. Resour. Environ. 39, 456–466. doi: 10.13254/j.jare.2021.0683
Maes J., Crossman N. D., Burkhard B. (2016). “Mapping ecosystem services,” In: (Routledge Handbook of Ecosystem Services). Eds. Potschin P., Haines-Young R., Fish R., Turner R. K. (Routlegde, London), 188–204. doi: 10.4324/9781315775302
McDonald R. (2009). Ecosystem service demand and supply along the urban-to-rural gradient. J. Conserv. Plan. 5, 1–14.
Millennium Ecosystem Assessment (2005). Ecosystems and human well-being: synthesis (Washing DC: Island Press).
National Development and Reform Commission, International Bureau of Statistics Accounting (2022). Standards for total value of ecological products (Beijing: People’s Publishing House).
Ouyang Z. Y., Hua Z., Ping Y. (2013). Ideas and measures for establishing ecological compensation mechanism in China. J. Ecol. 33(03), 686–692. doi: 10.5846/stxb201310092428
Peng S., Ding Y., Liu W., Li Z. (2019). 1 km monthly temperature and precipitation dataset for China from 1901 to 2017. Earth Syst. Sci. Data 11, 1931–1946. doi: 10.5194/essd-11-1931-2019
Peterson M. J., Hall D. M., Feldpausch-Parker A. M., Peterson T. R. (2010). Obscuring ecosystem function with an application of the ecosystem services concept. Conserv. Biol. 24, 113–119. doi: 10.1111/j.1523-1739.2009.01305.x
Roces-Díaz J. V., Díaz-Varela R. A., Álvarez-Álvarez P., Recondo C., Díaz-Varela E. R. (2015). A multiscale analysis of ecosystem services supply in the NW Iberian Peninsula from a functional perspective. Ecol. Indic. 50, 24–34. doi: 10.1016/j.ecolind.2014.10.027
Song C. S., Ouyang Z. Y. (2020). Research on gross ecosystem product accounting of ecosystem gross domestic product for ecological benefit assessment: a case study of Qinghai province. Acta Ecologica Sin. 40, 3207–3217.
United Nations. (2021). System of environmental-economic accounting—Ecosystem accounting (SEEA EA). White cover publication pre-edited text subject to Off. editing. Available at: https://seea.un.org/ecosystem-accounting.
Vallecillo S., La Notte A., Ferrini S., Maes J. (2019). How ecosystem services are changing: An accounting application at the EU level. Ecosyst. Serv. 40, 101044. doi: 10.1016/j.ecoser.2019.101044
van Jaarsveld A. S., Biggs R., Scholes R. J., Bohensky E., Reyers B., Lynam T., et al. (2005). Measuring conditions and trends in ecosystem services at multiple scales: The Southern African Millennium Ecosystem Assessment (SAfMA) experience. Philos. Trans. R. Soc Lond. B Biol. Sci. 360, 425–441. doi: 10.1098/rstb.2004.1594
van Oudenhoven A. P. E., Petz K., Alkemade R., Hein L., de Groot R. S. (2012). Framework for systematic indicator selection to assess effects of land management on ecosystem services. Ecol. Indic. 21, 110–122. doi: 10.1016/j.ecolind.2012.01.012
Villamagna A. M., Angermeier P. L., Bennett E. M. (2013). Capacity, pressure, demand, and flow: A conceptual framework for analysing ecosystem service provision and delivery. Ecol. Complex. 15, 114–121. doi: 10.1016/j.ecocom.2013.07.004
Keywords: ecosystem service, supply, use, eco-sustainability, policy-making
Citation: Shen Y-q, Yi X, Chen M and Ouyang Z-y (2024) Gross ecosystem product accounting in Miyun County: the supply and use of ecosystem services. Front. Ecol. Evol. 12:1367768. doi: 10.3389/fevo.2024.1367768
Received: 09 January 2024; Accepted: 20 March 2024;
Published: 05 April 2024.
Edited by:
Yixin Zhang, Soochow University, ChinaCopyright © 2024 Shen, Yi, Chen and Ouyang. This is an open-access article distributed under the terms of the Creative Commons Attribution License (CC BY). The use, distribution or reproduction in other forums is permitted, provided the original author(s) and the copyright owner(s) are credited and that the original publication in this journal is cited, in accordance with accepted academic practice. No use, distribution or reproduction is permitted which does not comply with these terms.
*Correspondence: Xiao Yi, eGlhb3lpQHJjZWVzLmFjLmNu