 Néstor Pérez-Méndez1*
 Sebastián Echeverría-Progulakis1,2
 Raül Llevat1
 Carles Alcaraz2
 Maite Martínez-Eixarch2
 Mar Catala-Forner1
- 1IRTA, Sustainable Field Crops, Centre d’Amposta, Amposta, Catalonia, Spain
- 2IRTA, Marine and Continental Waters, Centre de La Ràpita, La Ràpita, Catalonia, Spain
Global change is eroding freshwater biodiversity at higher rates than in any other ecosystem, potentially entailing a parallel degradation of ecosystem functions such as the predation function. However, the relationships between biodiversity and predation effectiveness remain poorly explored in freshwater ecosystems, largely due to the unavailability of easy-to-apply methods that allow to characterize the predation function under real-field conditions. Here we proposed the chironomid sentinel cards as a fast, reliable, and standardized method to estimate predation rates in aquatic ecosystems. Briefly, by easily gluing a set of commercially available chironomid larvae to a plastic card and offering them to aquatic predators during a timelapse we can quantify removal rates, and hence the predation function. As an indicator of the usefulness of the method, we additionally assessed whether the use of chironomid sentinel cards allows to link the estimated predation rates to three descriptors of predator assemblages: i) taxa richness, ii) Hill evenness, and iii) abundance of aquatic predators. To do that, we combined a thorough sampling of aquatic macroinvertebrate predators with a large deployment of chironomid sentinel cards across 12 flooded rice fields during three different stages of the rice phenological cycle. Our results show that the three biodiversity indexes were positively related to the predation rate estimates, highlighting the sensibility of the method to changes in predator assemblages. We therefore conclude that the methodology is suitable to assess potential biodiversity-predation links under field aquatic conditions. We advocate to use the chironomid sentinel cards as an easy-to-apply, fast, and standardized method that allows comparisons of predation effectiveness across different shallow freshwater ecosystems.
1 Introduction
Freshwater ecosystems illustrate the paradigm of the accelerated rates of biodiversity loss that the planet is facing, as species declines are far greater than in any of the most threaten terrestrial ecosystems (Sala et al., 2000; Dudgeon et al., 2006; Tickner et al., 2020). This alarming biodiversity crisis is usually coupled with important changes in ecological interactions that often result in ecosystem malfunction (Hooper et al., 2012). Despite the importance of understanding the biodiversity-functionality links for decision-making in freshwater ecosystem conservation plans, the scientific literature is markedly biased towards terrestrial ecosystems (Mazor et al., 2018; Williams-Subiza and Epele, 2021). This could largely result from a reduced availability of easy-to-apply tools aimed at quantifying the functionality of aquatic habitats. Therefore, there is an urgent need to develop new methods or adapt existing terrestrial tools to aquatic conditions to advance our understanding of biodiversity-functionality relationships in freshwater ecosystems.
Predation is a key ecological function mediated by a broad range of predatory animals that helps maintaining and shaping the structure and composition of biological communities through trophic cascades (Estes et al., 2011). In addition, predation mediated by insect predators in agricultural systems is a key ecosystem service valued in more than $5.5 billion annually in the US alone (Losey and Vaughan, 2006; Naranjo et al., 2015). Even though the great importance of predators in both natural and agricultural ecosystems, quantification of the predation function under field conditions is still challenging (Furlong and Zalucki, 2010; Zalucki et al., 2015; Gathman, 2020). This is especially true in freshwater ecosystems such as shallow wetlands, ponds or rice agricultural lands, as illustrated by the fact that most evidences on the role of aquatic predators result from mesocosm experiments where preys are offered to predators under controlled conditions (e.g., Shaalan and Canyon, 2009; Greig et al., 2013). However, mesocosms fail at incorporating the ecological complexity that occur in real field-scale conditions, thus sometimes result in simplified or misleading conclusions when assessing potential outcomes of predator-prey interactions (Carpenter, 1996). Therefore, it is desirable to develop easy-to-apply methodologies to estimate the predation effectiveness in real field conditions. This would allow to assess more accurately the potential relationship between the diversity of aquatic predators and the predation functionality.
Different methods have been used to estimate the predation function under field conditions in terrestrial systems including direct and video recorded observations, gut content analyses, exclusion experiments, and the use of prey sentinel cards (Macfadyen et al., 2015). The latter consists in assessing the removal rate of prey items that are offered to predators during a standardized time frame. Preys are usually offered by attaching the prey items to a support (e.g., cardboards or plastic cards) which is then installed in the field to allow the removal by different types of predators. Considering that the use of sentinel preys is among the most easy-to-apply, fast and reliable methods to estimate predation rates, it is surprising how its use has been mostly restricted to terrestrial ecosystems (Lövei and Ferrante, 2017). Here we adapted this sentinel prey methodology to aquatic conditions and evaluated its capability to estimate predation rates in freshwater habitats.
When using the sentinel prey methodology in terrestrial studies there is a high flexibility in the type of prey items used, including different organisms (e.g., beetles, bugs, moths, etc.) and ontogenetic stages (e.g., eggs, larvae or adults) (Lövei and Ferrante, 2017). In addition, previous research in terrestrial systems have used live, dead or even fake plasticine preys, all of them providing pros and cons (Boetzl et al., 2020; Nagy et al., 2020; Roeder et al., 2023). Here we advocated to use dead chironomid larvae as target sentinel preys because they are i) a staple food item of most aquatic predators (Armitage, 1995), ii) a ubiquitously distributed group in freshwater ecosystems worldwide (Pinder, 1995), and iii) commercially available as fish food in aquarium stores. In addition, the chironomid larvae is a harmful pest in flooded rice farming (Nwilene et al., 2017; Pérez-Méndez et al., 2020, 2023), therefore assessing the efficiency of the assemblage of aquatic predators in controlling larvae populations has also important implications for agricultural management (Pérez-Méndez et al., 2023). In this study, we performed a in situ field experiment to i) present the use of chironomid sentinel cards as a fast, easy-to-apply, and standardized methodology to estimate predation rates under field conditions and ii) evaluate whether it is a proper method to link the diversity and abundance of aquatic predators with predation rates (i.e., a proxy of the predation function) in freshwater ecosystems.
2 Methods
2.1 Study system
The study was performed in the Ebro Delta (Tarragona, NE Spain; 40° 39’ N; 0° 46’E), a region dominated by a rice-monoculture agricultural matrix that occupies around 65% (21,125 ha) of the territory. Freshwater macroinvertebrate communities are highly diverse in rice fields of the Ebro Delta, including a broad range of aquatic predators that live associated to the water layer (Pérez-Méndez et al., 2023). The most abundant groups are dive and water scavenger beetles (Fam. Dytiscidae and Hydrophilidae), dragonfly and damselfly nymphs (Libellulidae and Coenagrionidae, respectively) and several families of water bugs (e.g., Corixidae and Notonectidae) (Pérez-Méndez et al., 2023). All these organisms have been previously reported as predators of chironomid larvae (Chironomidae), which have a strong negative impact on rice production resulting from high rates of seed herbivory during the crop establishment stage (Català et al., 2013; Pérez-Méndez et al., 2023).
2.2 Experimental design
We performed the experiment in summer 2021 (June-September) in 12 rice paddies that were evenly distributed across the experimental area and spaced at least 250 m from each other. Freshwater macroinvertebrates were sampled in each field throughout the whole rice cycle in three different months (June, July, September) (N = 36). Briefly, we used a sweep net of 500 μm mesh size to collect aquatic macroinvertebrates both from the water column and the sediment (approximately 1-cm of the layer). Samples were labelled and stored in 70% ethanol until lab processing. All aquatic macroinvertebrate predators were identified to the genus/species levels, except for flies that were identified to the family level (see Pérez-Méndez et al., 2023 for details about sampling and identification procedures).
Each macroinvertebrate sampling was combined with the use of chironomid sentinel preys attached to 12 x 15 cm plastic cards, which are commercially available at this standard size, to estimate the predation rates of chironomids. Specifically, 25 individual dead chironomid larvae (tribe Chironomini), which are commonly sold in aquarium stores, were glued by the posterior parapods of the body to each card (Figure 1). Overall, each single card is assembled in approximately 5 minutes. A total of 3 cards were fixed using two wooden sticks per card in each experimental field below the water, at the soil surface level (Figure 1; Supplementary Video 1). Sentinel cards were distributed equidistantly (50 m of distance) within each rice field to account for potential within-field variation in larvae predation. Chironomids were exposed to predators during 1 h, after which the predation status of each individual larvae (i.e., non-predated = 0; predated = 1) was assessed (Supplementary Video 2). Overall, we installed a total of 105 cards including 2700 chironomid larvae. In addition, to confirm that chironomid loss during the experiment was due to predation by macroinvertebrates and not by other non-controlled factors, in the last sampling month we also installed one exclusion card in each experimental field (N = 12 cards). We prevented the access of macroinvertebrates to the cards by using an exclusion net, thus confirming that all chironomids remained intact after 1 h of exposure (Supplementary Figure S1).
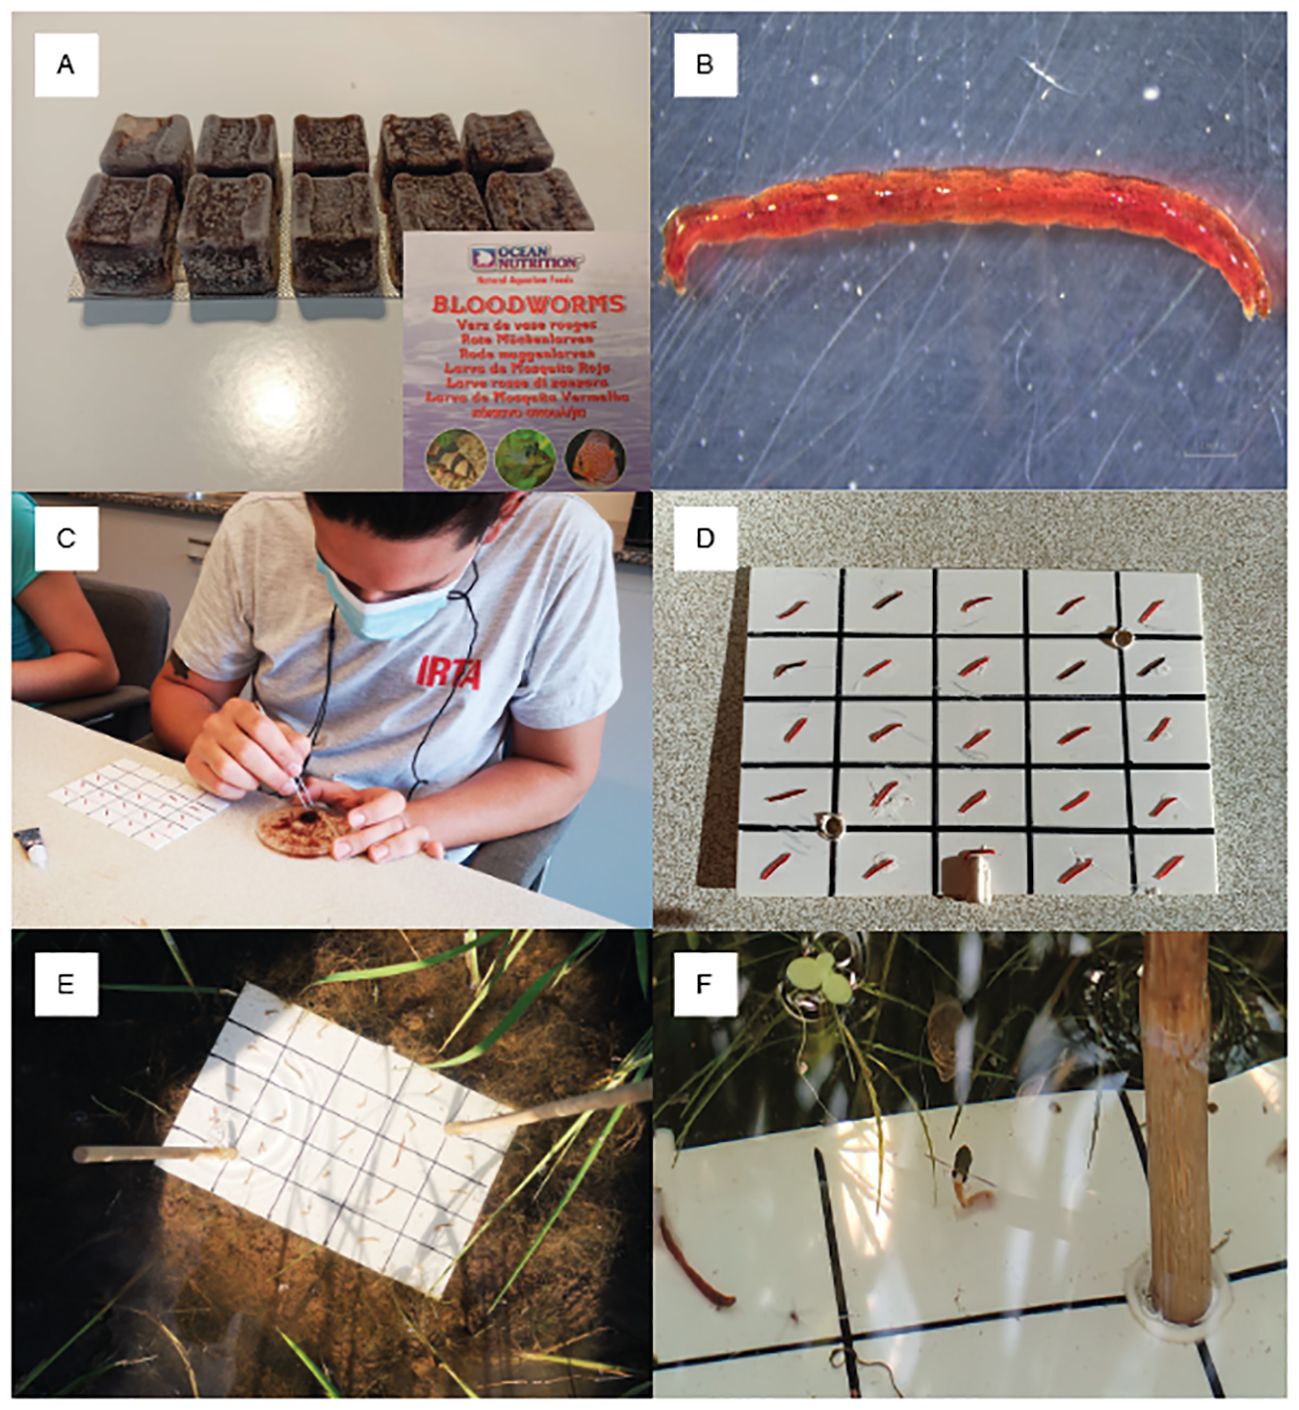
Figure 1. Laboratory preparation and field deployment of chironomid sentinel cards: Commercially available chironomid larvae (Tribe Chironomini) as frozen fish food (A) Details of a chironomid larvae (B) Attachment of dead chironomid larvae in the plastic cards (C) Chironomids cards with the 25 larvae before field deployment (D) Chironomid card installed in the rice field. Note that it is below the water layer at the soil level (E). Photogram of the video #1 that has been attached as Supplementary Material (Supplementary Material 1), in which an aquatic bug (Fam. Corixidae) is sucking a chironomid larvae (F).
2.3 Statistical analyses
To assess whether the diversity of aquatic predators was related to the effectiveness of larvae predation (i.e., predation rates) we firstly estimated taxa richness and Hill evenness (Chao et al., 2014) for each sampled rice field across monthly surveys (Pérez-Méndez et al., 2023). Both diversity indexes are complementary and are usually linked with ecosystem functionality and stability (Hillebrand et al., 2008). We applied a Generalized Linear Mixed Model (GLMM) in which we used the predation status as binomial response variable, where the number of successes (i.e., predated larvae) and the number of failures (i.e., non-predated larvae) were modeled. The initial model included the taxa richness, the Hill evenness, and the abundance of predators as covariates. In addition, we initially included the interaction between the three abovementioned covariates and the ordinal sampling date. However, since the inclusion of the ordinal sampling date gave a very high Variance Inflated Factor (VIF > 25), we removed it from the final model, which also included the identity of the field as a random factor and a binomial distribution of the errors.
R software (R Core Team, 2023) was used for data analysis and visualization in both analyses. The following R libraries were used: i) iNext R package for estimating the diversity indexes (Hill numbers) (Hsieh et al., 2016), ii) tydiverse for data manipulation and data visualization (Wickham et al., 2019), iii) glmmTMB for data modelling (Brooks et al., 2017), iv) emmeans for mean estimations (Lenth, 2024), and v) performance for estimating the coefficients of determination (R2) and for detecting potential collinearity issues among model variables (Lüdecke et al., 2021). We accounted for potential patterns in model residuals across all models (e.g., non-normal distribution or heteroscedasticity) by using the simulateResiduals function of the R DHARMa R library (Hartig, 2020).
3 Results and discussion
We sampled a total of 11,897 aquatic predator individuals, belonging to 17 different macroinvertebrate families. Specifically, we sampled 3 families of Coleoptera (Dytiscidae, Hydrophilidae, and Noteridae), 6 families of Heteroptera (Corixidae, Gerridae, Mesoveliidae, Notonectidae, Pleidae, and Veliidae), 3 families of Odonata (Aeshnidae, Coenagrionidae, and Libellulidae) and 5 families of Diptera (Ceratopogonidae, Dolichopodidae, Rhagionidae, Sciomyzidae, and Stratiomiyidae). The assemblage was dominated by Sigara sp. (Corixidae), Bidessus sp (Dytiscidae), and Ischnura elegans, which together accounted for 89% of overall sampled individuals, while the remaining 11% was represented by 22 additional taxa (Supplementary Table S1). Sampled rice fields hosted very contrasting assemblages in terms of taxa richness (range: 1 – 14), Hill evenness (range: 1.0 – 3.9) and predator abundance (range: 10 – 4557), which allowed us to assess the importance of the predator assemblage diversity in explaining predation rate variation.
A first demonstration of the usefulness of sentinel prey methods to indicate the real performance of the predation function in natural field conditions is to link the estimated predation rates to the diversity of predator assemblages (Boetzl et al., 2020). The results of our experiment, in which we quantified predation rates from 105 deployed cards, showed a marked positive effect of both taxa richness (χ2 = 21.0, p < 0.001; Figure 2A) and Hill evenness (χ2 = 84.8, p < 0.001; Figure 2B) of aquatic predator assemblages on predation rates. This suggests that the positive influence of macroinvertebrate diversity on predation rates could be mediated by an increased functional complementarity among predator species (Straub and Snyder, 2008; Northfield et al., 2010). However, the positive effect of predator abundance (χ2 = 11.7, p < 0.001; Figure 2C) suggests that removal rates can be also explained by a mere density effect (Menalled et al., 1999; Greenop et al., 2019). Both diversity and density effects are perfectly compatible as shown in previous studies performed in terrestrial systems (Griffiths et al., 2008). Predation rate estimates obtained with this method could be slightly overestimated as they can incorporate removal events mediated by poor efficient predators or even scavengers. For example, we observed some removal events mediated by scavenger snails (pers. obs.), a phenomenon also observed in terrestrial sentinel cards (Nagy et al., 2020; Gardarin et al., 2023). To overcome this limitation, the deployment of cards could be accompanied, when visibility allows, by videorecording devices or focal censuses that allow us to better assess the identity and relevance of the different aquatic predators (Supplementary Video 1). As far as we know this is the first study where a link between the diversity of the assemblages of aquatic predators and the performance of the predation function is assessed under field conditions in a shallow freshwater ecosystem. It is important to note that our methodology is specifically designed to be applied in shallow aquatic habitats, as the logistic needed to install the sentinel cards in deeper aquatic environments could limit its applicability.
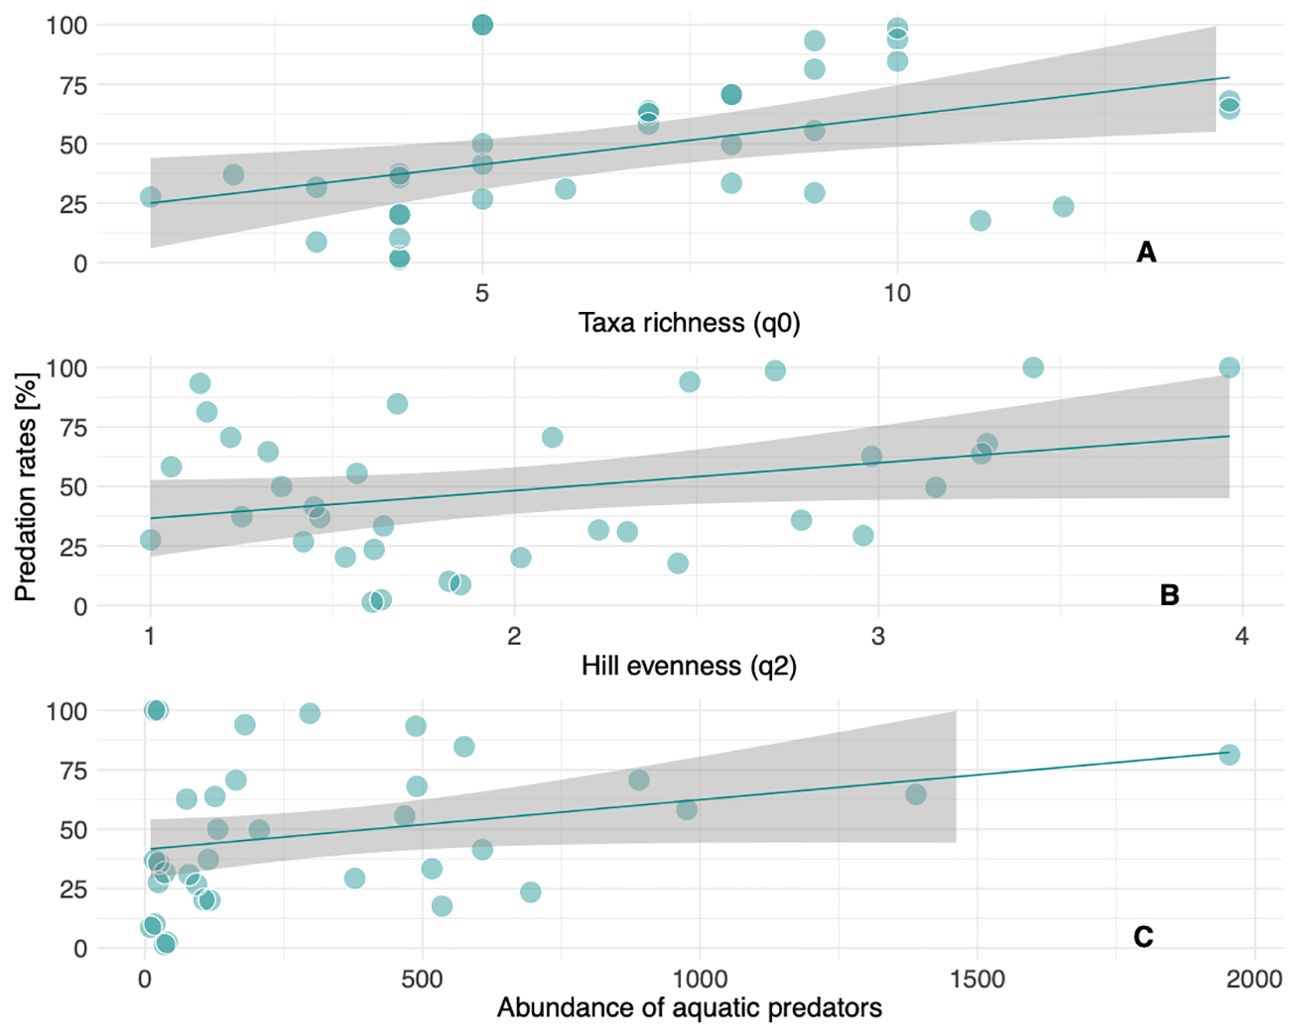
Figure 2. Relationships between the observed predation rates (%) and taxa richness (A), Hill evenness (B), and abundance of predators (C).
4 Conclusions
The development of easy-to-apply methods is essential to improve and facilitate the assessment of potential links between biodiversity and ecosystem functioning, especially in increasingly degraded environments such as many shallow freshwater ecosystems. Here we have adapted to aquatic conditions a widely used method in terrestrial ecology to estimate predation rates mediated by aquatic benthic organisms. Interestingly, it can also serve as a decision-making tool for semiaquatic crops (e.g., rice agroecosystems) as it allows to explore the relationships between field management, the effects on the communities of natural enemies and biological pest control provisioning (e.g., Pérez-Méndez et al., 2023). Given that chironomid larvae (Chironomus sp.) are i) a common prey item of a broad range of aquatic predator groups, ii) a ubiquitous worldwide distributed group, and iii) available commercially in aquarium stores, we advocate to use them as a standardized sentinel prey. The simplicity, rapidity, low-cost and standardization of the method facilitate its replicability across large spatiotemporal scales, allowing the comparison of predation rates across different freshwater ecosystems and biomes. Therefore, by applying the chironomid sentinel card methodology we hope to promote the research on the potential links between the aquatic biodiversity and the predation function in freshwater ecosystems.
Data availability statement
The datasets presented in the study are included in the Supplementary Material.
Ethics statement
The manuscript presents research on animals that do not require ethical approval for their study.
Author contributions
NP-M: Conceptualization, Data curation, Formal analysis, Funding acquisition, Investigation, Methodology, Visualization, Writing – original draft, Writing – review & editing. SE-P: Data curation, Investigation, Methodology, Writing – review & editing. RL: Investigation, Methodology, Writing – review & editing. CA: Conceptualization, Investigation, Methodology, Writing – review & editing. MM-E: Investigation, Writing – review & editing. MC-F: Funding acquisition, Writing – review & editing.
Funding
The author(s) declare financial support was received for the research, authorship, and/or publication of this article. This work was supported by the Agencia Estatal de Investigación of the Ministerio de Ciencia e Innovación from Spain PID2020-118650RR-C31 and PID2023-151621OR-I00, funded by MICIU/AEI/10.13039/501100011033 and FEDER, EU MICIU/AEI/10.13039/501100011033. Néstor Pérez-Méndez was granted with a Ramón y Cajal Fellowship (RYC2021-033599-I) funded by MCIN/AEI/10.13039/501100011033 and by the European Union NextGenerationEU/PRTR.
Acknowledgments
We acknowledge the technical staff that help in data collection: Juan Blas Fernández, Oriol Ferré, Andrea Bertomeu, Eva Pla, Nùria Tomàs, and Idoia Mas.
Conflict of interest
The authors declare that the research was conducted in the absence of any commercial or financial relationships that could be construed as a potential conflict of interest.
Publisher’s note
All claims expressed in this article are solely those of the authors and do not necessarily represent those of their affiliated organizations, or those of the publisher, the editors and the reviewers. Any product that may be evaluated in this article, or claim that may be made by its manufacturer, is not guaranteed or endorsed by the publisher.
Supplementary material
The Supplementary Material for this article can be found online at: https://www.frontiersin.org/articles/10.3389/fevo.2024.1439859/full#supplementary-material
References
Armitage P. D. (1995). “Chironomidae as food,” in The Chironomidae: Biology and ecology of non-biting midges. Eds. Armitage P. D., Cranston P. S., Pinder L. C. V. (Springer Netherlands, Dordrecht), 423–435. doi: 10.1007/978-94-011-0715-0_17
Boetzl F. A., Konle A., Krauss J. (2020). Aphid cards – Useful model for assessing predation rates or bias prone nonsense? J. Appl. Entomol 144, 74–80. doi: 10.1111/jen.12692
Brooks M., Kristensen K., Van Benthem K. J., Magnusson A., Berg C. W., Nielsen A., et al. (2017). glmmTMB balances speed and flexibility among packages for zero-inflated generalized linear mixed modeling. R J. 9, 378. doi: 10.32614/RJ-2017-066
Carpenter S. R. (1996). Microcosm experiments have limited relevance for community and ecosystem ecology. Ecology 77, 677–680. doi: 10.2307/2265490
Català M., del M., Tomàs N., Pla E. (2013). Cómo cuantificar los quironómidos ({Díptera}: {Chironomidae}) en un arrozal: descripción de un método sencillo, rápido y fiable. Phytoma 250, 100–103.
Chao A., Chiu C.-H., Jost L. (2014). Unifying species diversity, phylogenetic diversity, functional diversity, and related similarity and differentiation measures through hill numbers. Annu. Rev. Ecology Evolution Systematics 45, 297–324. doi: 10.1146/annurev-ecolsys-120213-091540
Dudgeon D., Arthington A. H., Gessner M. O., Kawabata Z.-I., Knowler D. J., Lévêque C., et al. (2006). Freshwater biodiversity: importance, threats, status and conservation challenges. Biol. Rev. 81, 163. doi: 10.1017/S1464793105006950
Estes J. A., Terborgh J., Brashares J. S., Power M. E., Berger J., Bond W. J., et al. (2011). Trophic downgrading of planet Earth. Science 333, 301–306. doi: 10.1126/science.1205106
Furlong M. J., Zalucki M. P. (2010). Exploiting predators for pest management: the need for sound ecological assessment: Exploiting predators for pest management. Entomologia Experimentalis Applicata 135, 225–236. doi: 10.1111/j.1570-7458.2010.00988.x
Gardarin A., Capowiez Y., Teulé J.-M., Wetzel G., Hedde M. (2023). Assessing ground predation by invertebrates in crops: camera observations clarify the relevance of aphid cards and coleopteran sentinel prey. Basic Appl. Ecol. 71, 111-118, S1439179123000385. doi: 10.1016/j.baae.2023.07.002
Gathman J. P. (2020). Do predators structure wetland macroinvertebrate assemblages? Different effects of mudminnows and dragonfly nymphs in field experiments. Wetlands 40, 143–152. doi: 10.1007/s13157-019-01169-4
Greenop A., Cecelja A., Woodcock B. A., Wilby A., Cook S. M., Pywell R. F. (2019). Two common invertebrate predators show varying predation responses to different types of sentinel prey. J. Appl. Entomology 143, 380–386. doi: 10.1111/jen.12612
Greig H. S., Wissinger S. A., McIntosh A. R. (2013). Top-down control of prey increases with drying disturbance in ponds: a consequence of non-consumptive interactions? J. Anim. Ecol. 82, 598–607. doi: 10.1111/1365-2656.12042
Griffiths G. J. K., Wilby A., Crawley M. J., Thomas M. B. (2008). Density-dependent effects of predator species-richness in diversity-function studies. Ecology 89, 2986–2993. doi: 10.1890/08-0685.1
Hartig F. (2020). DHARMa: Residual Diagnostics for Hierarchical (Multi-Level / Mixed) Regression Models. R package version 0.4.7, Available online at: https://github.com/florianhartig/dharma.
Hillebrand H., Bennett D. M., Cadotte M. W. (2008). Consequences of dominance: a review of evenness efects on local and regional ecosystem processes. Ecology 89, 1510–1520. doi: 10.1890/07-1053.1
Hooper D. U., Adair E. C., Cardinale B. J., Byrnes J. E. K., Hungate B. A., Matulich K. L., et al. (2012). A global synthesis reveals biodiversity loss as a major driver of ecosystem change. Nature 486, 105–108. doi: 10.1038/nature11118
Hsieh T. C., Ma K. H., Chao A. (2016). iNEXT: an R package for rarefaction and extrapolation of species diversity (H ill numbers). Methods Ecol. Evol. 7, 1451–1456. doi: 10.1111/2041-210X.12613
Lenth R. (2024). emmeans: Estimated Marginal Means, aka Least-Squares Means. R package version 1.10.5-0900001, Available online at: https://github.com/rvlenth/emmeans.
Losey J. E., Vaughan M. (2006). The economic value of ecological services provided by insects. BioScience 56, 311. doi: 10.1641/0006-3568(2006)56[311:TEVOES]2.0.CO;2
Lövei G. L., Ferrante M. (2017). A review of the sentinel prey method as a way of quantifying invertebrate predation under field conditions: Measuring predation pressure by sentinel prey. Insect Sci. 24, 528–542. doi: 10.1111/1744-7917.12405
Lüdecke D., Ben-Shachar M., Patil I., Waggoner P., Makowski D. (2021). performance: an R package for assessment, comparison and testing of statistical models. JOSS 6, 3139. doi: 10.21105/joss.03139
Macfadyen S., Davies A. P., Zalucki M. P. (2015). Assessing the impact of arthropod natural enemies on crop pests at the field scale: Impact of arthropod natural enemies. Insect Sci. 22, 20–34. doi: 10.1111/1744-7917.12174
Mazor T., Doropoulos C., Schwarzmueller F., Gladish D. W., Kumaran N., Merkel K., et al. (2018). Global mismatch of policy and research on drivers of biodiversity loss. Nat. Ecol. Evol. 2, 1071–1074. doi: 10.1038/s41559-018-0563-x
Menalled F. D., Lee J. C., Landis D. A. (1999). Manipulating carabid beetle abundance alters prey removal rates in corn fields. Biocontrol 43, 441–456. doi: 10.1023/A:1009946004251
Nagy R. K., Schellhorn N. A., Zalucki M. P. (2020). Fresh, frozen or fake: A comparison of predation rates measured by various types of sentinel prey. J. Appl. Entomol 144, 407–416. doi: 10.1111/jen.12745
Naranjo S. E., Ellsworth P. C., Frisvold G. B. (2015). Economic value of biological control in integrated pest management of managed plant systems. Annu. Rev. Entomol. 60, 621–645. doi: 10.1146/annurev-ento-010814-021005
Northfield T. D., Snyder G. B., Ives A. R., Snyder W. E. (2010). Niche saturation reveals resource partitioning among consumers. Ecol. Lett. 13, 338–348. doi: 10.1111/j.1461-0248.2009.01428.x
Nwilene F., Stout M., Hadi B., Freitas T., others (2017). Rice insect pests and their management (Burleigh Dodds Science Publishing).
Pérez-Méndez N., Martínez-Eixarch M., Llevat R., Mateu D., Marrero H. J., Cid N., et al. (2023). Enhanced diversity of aquatic macroinvertebrate predators and biological pest control but reduced crop establishment in organic rice farming. Agriculture Ecosyst. Environ. 357, 108691. doi: 10.1016/j.agee.2023.108691
Pérez-Méndez N., Pla E., Tomàs N., Bertomeu A., Ferré O., Català-Forner M. (2020). Márgenes verdes como estrategia para favorecer la diversidad de enemigos naturales de plagas en el cultivo del arroz. Ecología Austral 30, 465–471. doi: 10.25260/EA.20.30.3.0.1122
Pinder L. C. V. (1995). “The habitats of chironomid larvae,” in The Chironomidae: Biology and ecology of non-biting midges. Eds. Armitage P. D., Cranston P. S., Pinder L. C. V. (Springer Netherlands, Dordrecht), 107–135. doi: 10.1007/978-94-011-0715-0_6
R Core Team. (2023). “R: A language and environment for statistical computing,” in R foundation for statistical computing (R Foundation for Statistical Computing, Vienna, Austria).
Roeder K. A., Dorland M. S., Daniels J. D. (2023). Importance of color for artificial clay caterpillars as sentinel prey in maize, soybean, and prairie. Entomologia Exp. Applicata 171, 68–72. doi: 10.1111/eea.13251
Sala O. E., Chapin F. S., Armesto J. J., Berlow E., Bloomfield J., Dirzo R., et al. (2000). Global biodiversity scenarios for the year 2100. Science 287, 1770–1774. doi: 10.1126/science.287.5459.1770
Shaalan E. A.-S., Canyon D. V. (2009). Aquatic insect predators and mosquito control. Trop. Biomedicine 26, 223–261.
Straub C. S., Snyder W. E. (2008). Increasing enemy biodiversity strengthens herbivore suppression on two plant species. Ecology 89, 1605–1615. doi: 10.1890/07-0657.1
Tickner D., Opperman J. J., Abell R., Acreman M., Arthington A. H., Bunn S. E., et al. (2020). Bending the curve of global freshwater biodiversity loss: an emergency recovery plan. BioScience 70, 330–342. doi: 10.1093/biosci/biaa002
Wickham H., Averick M., Bryan J., Chang W., McGowan L., François R., et al. (2019). Welcome to the tidyverse. J. Open Source Software 4, 1686. doi: 10.21105/joss.01686
Williams-Subiza E. A., Epele L. B. (2021). Drivers of biodiversity loss in freshwater environments: A bibliometric analysis of the recent literature. Aquat. Conserv. 31, 2469–2480. doi: 10.1002/aqc.3627
Keywords: aquatic predators, biodiversity, ecosystem functioning, natural enemies, macroinvertebrates, pest control, rice, wetlands
Citation: Pérez-Méndez N, Echeverría-Progulakis S, Llevat R, Alcaraz C, Martínez-Eixarch M and Catala-Forner M (2024) Chironomid sentinel cards: an easy-to-apply method for assessing predation rates freshwater (agro)ecosystems. Front. Ecol. Evol. 12:1439859. doi: 10.3389/fevo.2024.1439859
Received: 28 May 2024; Accepted: 08 November 2024;
Published: 05 December 2024.
Edited by:
Lei Xu, Chinese Academy of Fishery Sciences (CAFS), ChinaReviewed by:
Davide Taurozzi, Roma Tre University, ItalyDjuradj Milosevic, University of Niš, Serbia
Mariana Menegat, Federal University of Rio Grande, Brazil
Copyright © 2024 Pérez-Méndez, Echeverría-Progulakis, Llevat, Alcaraz, Martínez-Eixarch and Catala-Forner. This is an open-access article distributed under the terms of the Creative Commons Attribution License (CC BY). The use, distribution or reproduction in other forums is permitted, provided the original author(s) and the copyright owner(s) are credited and that the original publication in this journal is cited, in accordance with accepted academic practice. No use, distribution or reproduction is permitted which does not comply with these terms.
*Correspondence: Néstor Pérez-Méndez, bmVzdG9yLnBlcmV6QGlydGEuY2F0