 Jiuhe Bu
 Tao Wang
- School of Environmental Science and Engineering, Wuxi University, Wuxi, Jiangsu, China
Rivers are critical to ecological and societal sustainability, yet human activities like urbanization, industrialization, and agricultural runoff increasingly threaten their ecological health. This study investigates the ecological health of six major rivers in Dalian City, China, focusing on the relationships between aquatic biological communities and environmental factors. A total of 168 phytoplankton species, 110 zooplankton species, and 102 macrozoobenthos species were identified. The key environmental factors influencing these communities included pH, dissolved oxygen, ammonium nitrogen, total phosphorus, and altitude. Using an entropy-weighted set pair analysis model, spatial variations in river ecosystem health were evaluated. Monitoring sites S12 and S15 exhibited good health conditions, while sites S4, S8, and S17 were rated as poor (Grade IV), and S7 was severely polluted (Grade V). Other sites showed borderline health (Grade III). This research provides valuable insights for improving river ecosystem management and biodiversity conservation in Dalian City, offering a scientific basis for addressing water quality and ecological challenges.
Highlights
● The relationship between river biomes and environmental factors was studied by multivariate analysis;
● A river ecological health assessment model for Dalian City was established;
● Entropy weight method and set pair analysis method were used to assess river health.
1 Introduction
Rivers are essential components of the natural environment, acting as vital lifelines for both ecological systems and human societies (Chen et al., 2022a; Islam et al., 2024). In addition to these direct functions, rivers play a key role in nutrient cycling, sediment transport, and ecosystem services, such as flood regulation and water purification (Withers and Jarvie, 2008; Rattan et al., 2017). However, increasing human activities are placing escalating pressures on rivers, threatening their ecological health and sustainability. Urbanization, industrialization, agricultural runoff, and climate change have collectively led to habitat degradation, water quality decline, and biodiversity loss (Bryan et al., 2018; Wu et al., 2024). These challenges highlight the urgent need for effective strategies to assess and manage the health of river ecosystems. The concept of river ecological health has garnered significant attention in recent decades as researchers, policymakers, and conservationists work to balance development with environmental sustainability (Blue, 2018; Ding et al., 2022; Dong et al., 2022; Cai et al., 2023a). River health refers to the ability of a river system to maintain its ecological integrity and function while providing ecosystem services to both human and non-human communities. To assess river health, scientists utilize a combination of physical, chemical, and biological indicators. Although chemical and physical indicators provide valuable insights into river conditions, biological indicators are particularly effective in reflecting long-term ecological changes. Aquatic biological communities, such as phytoplankton, zooplankton, and macroinvertebrates, are highly sensitive to environmental disturbances and are considered reliable indicators of river health (Vugteveen et al., 2006; Stefanidis et al., 2023; Zhang et al., 2024).
Commonly used methods for assessing river health include the Analytic Hierarchy Process (AHP), Factor Analysis, Matter-Element Model, Grey Relational Analysis, Artificial Neural Networks (ANN), and Set Pair Analysis (SPA) (Vollmer et al., 2016; Yang et al., 2023; Kholodkevich, 2024). These methods are utilized to perform comprehensive evaluations of multi-indicator systems. The selection of indicators generally includes detailed metrics such as water quantity, water quality, aquatic organisms, physical structure, and riparian zone conditions. It is important to note that river health assessment methods are often customized to address the specific conditions of individual rivers. This tailoring ensures a more objective and accurate evaluation of the health status of each river type. As a result, the methods have distinct evaluation targets and defined scopes of applicability. In accordance with river management requirements, these methodologies are designed to account for the unique characteristics and management needs of particular river systems, allowing for precise and practical health assessments.
Despite significant advances in river health assessment methodologies, challenges persist, particularly in applying existing frameworks to urban rivers, which are shaped by distinct hydrological, ecological, and anthropogenic dynamics (Guimarães et al., 2021; Rowiński et al., 2022). Urban rivers are often under compounded pressures due to their proximity to human activities, making them highly vulnerable to pollution, flow alterations, and habitat fragmentation (Zhang et al., 2015, Zhang et al., 2023; Chen et al., 2022b). These challenges are particularly relevant in the context of rapidly urbanizing regions like Northern Chinese City. These rivers are shaped by the unique geographical and climatic conditions of Northern Chinese cities. Previous research on the region’s rivers has largely focused on water quality and hydrology, with comparatively little attention given to the biological communities that support river ecosystem functions. This gap impedes the development of effective management strategies and limits our ability to accurately assess the ecological health of these rivers. Moreover, existing river health assessment methods often overlook the specific conditions of these rivers, highlighting the need for tailored evaluation frameworks.
This study aims to address these shortages by employing advanced analytical techniques to investigate the relationships between aquatic biological communities and environmental factors in rivers of a typical northern city. Specifically, the research utilizes multivariate analysis methods to explore the distribution patterns of phytoplankton, zooplankton, and macroinvertebrates, along with their interactions with environmental variables. These analyses provide insights into the ecological dynamics of river systems and deepen our understanding of the factors influencing river health. In addition to biological analysis, the study proposes a novel river health assessment framework that integrates multiple dimensions of river ecology, including water quality, quantity, and aquatic biodiversity. The framework also evaluates river health in the study area using set pair analysis.
2 Study area and data source
Dalian is located in the southern part of the Liaodong Peninsula, China (38°43’–40°10’N, 120°58’–123°31’E), covering an area of 12,573.85 km² and with a population of 7.54 million in 2023. It is bordered to the north by the Northeast China Plain and the Inner Mongolia Autonomous Region, and connects Bohai Bay to the Shandong Peninsula across the sea. Often referred to as the “gateway to Beijing and Tianjin” and the “window to Northeast China”, Dalian plays a key role in the region’s economic and cultural exchange. Dalian is a typical water-stressed coastal city in China, with an average annual water resource availability of about 3.1 billion m³. In 2023, the per capita water resources were only 495 m³, approximately 16.5% of the global average (3,000 m³). The six major rivers are the primary surface water sources, accounting for over 90% of the total surface water supply in the city. The exploitation rates of these rivers are very high, with some approaching or exceeding 40%.
As the Northeast Asian International Shipping Center and the largest coastal port city in northeastern China, Dalian’s economy is rapidly developing. However, with increasing water consumption driven by economic growth and decreasing runoff due to climate change and other factors, ensuring sufficient water for river ecosystems and maintaining their health has become an increasingly challenging issue.
In this study, the six main rivers were selected for investigation (Biliu river, Fuzhou river, Dasha river, Yingna river, Zhuang river, Dengsha river). For each river, three or four representative sample sites were chosen, covering the upstream, midstream, and downstream sections. A total of 19 sample sites were selected based on water quality, water volume, and sewage outlets. Water quality and aquatic biodiversity data were collected in October 2023, while other data were obtained from the Dalian Statistical Yearbook. The location information and environmental conditions of 19 sampling points are shown in Figure 1 and Supplementary Table S1.
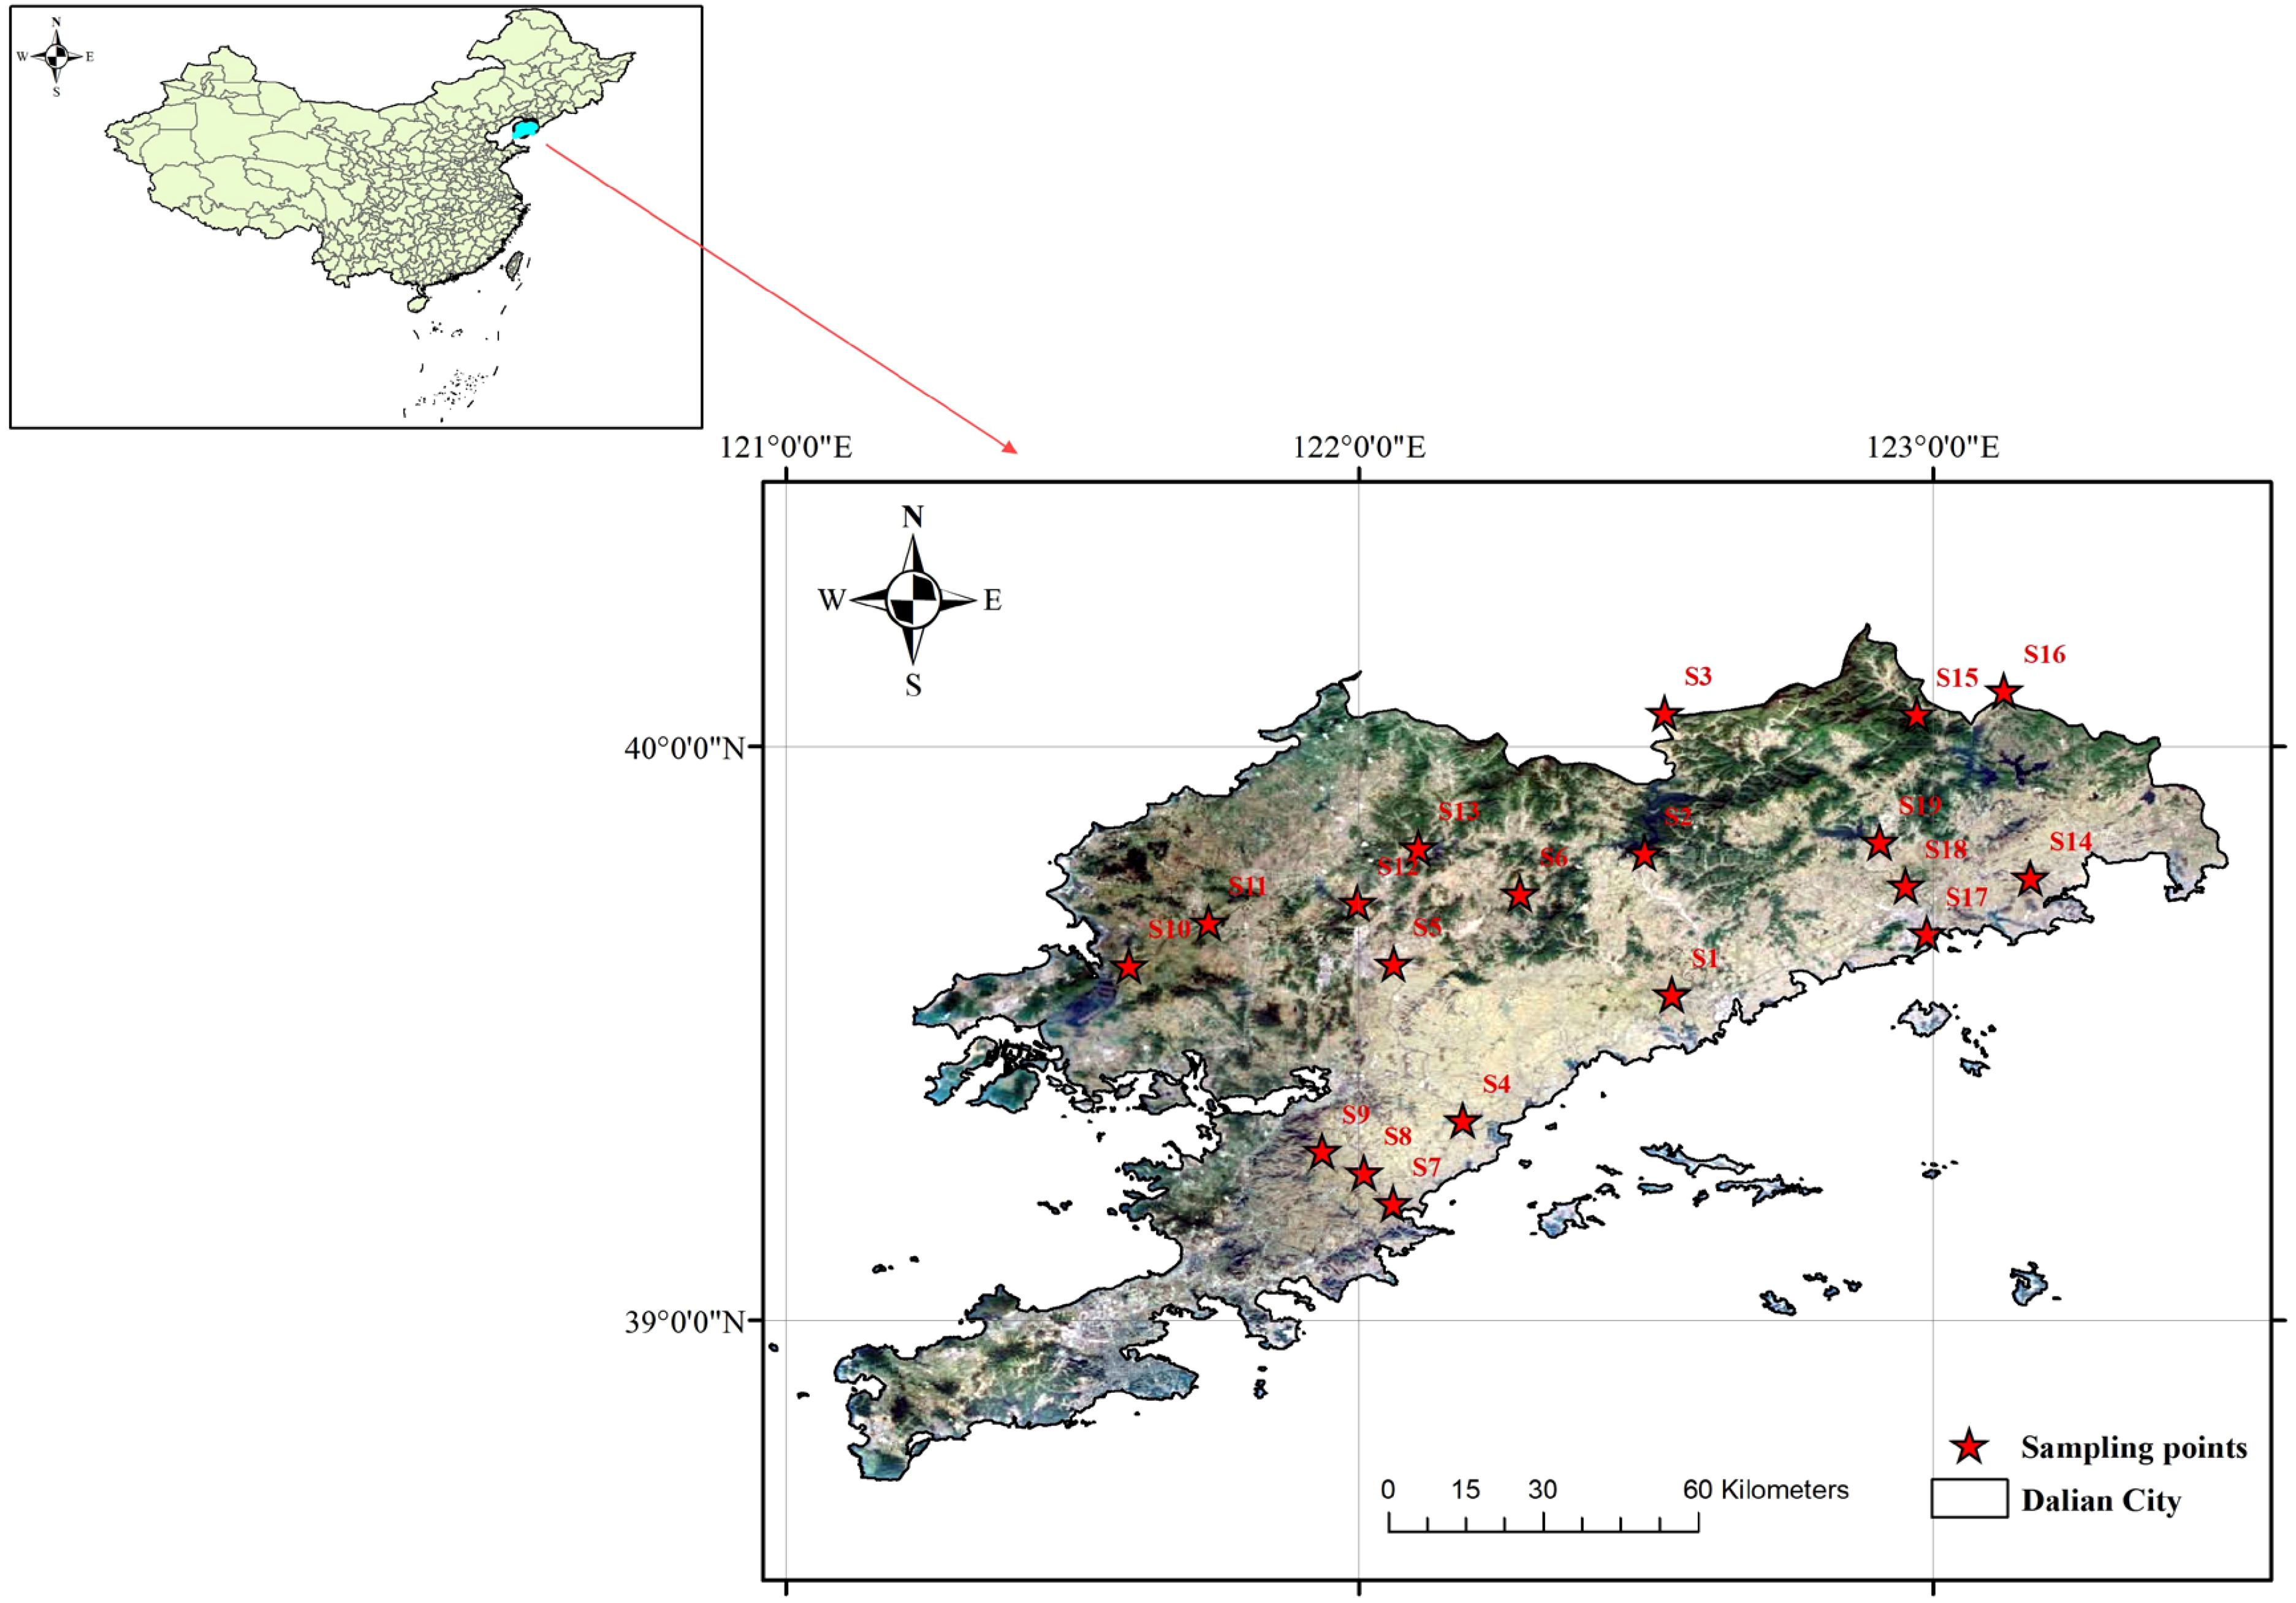
Figure 1. Geographic location of Dalian city.
3 Methodology
This study evaluates the river health of the research area by integrating water quality and aquatic ecosystem monitoring data. A comprehensive river health assessment index system was developed, and the evaluation was conducted using multivariate statistical analysis, the entropy weight method, and set pair analysis. The detailed workflow is illustrated in Figure 2. It is important to note that the monitoring data presented in this paper primarily cover autumn, particularly October. As a result, the analysis does not account for variations in water ecological health and its influencing factors across different seasons. The results and discussions are based on the autumn scenario. However, some analyses that are not season-dependent will be further explored in the paper.
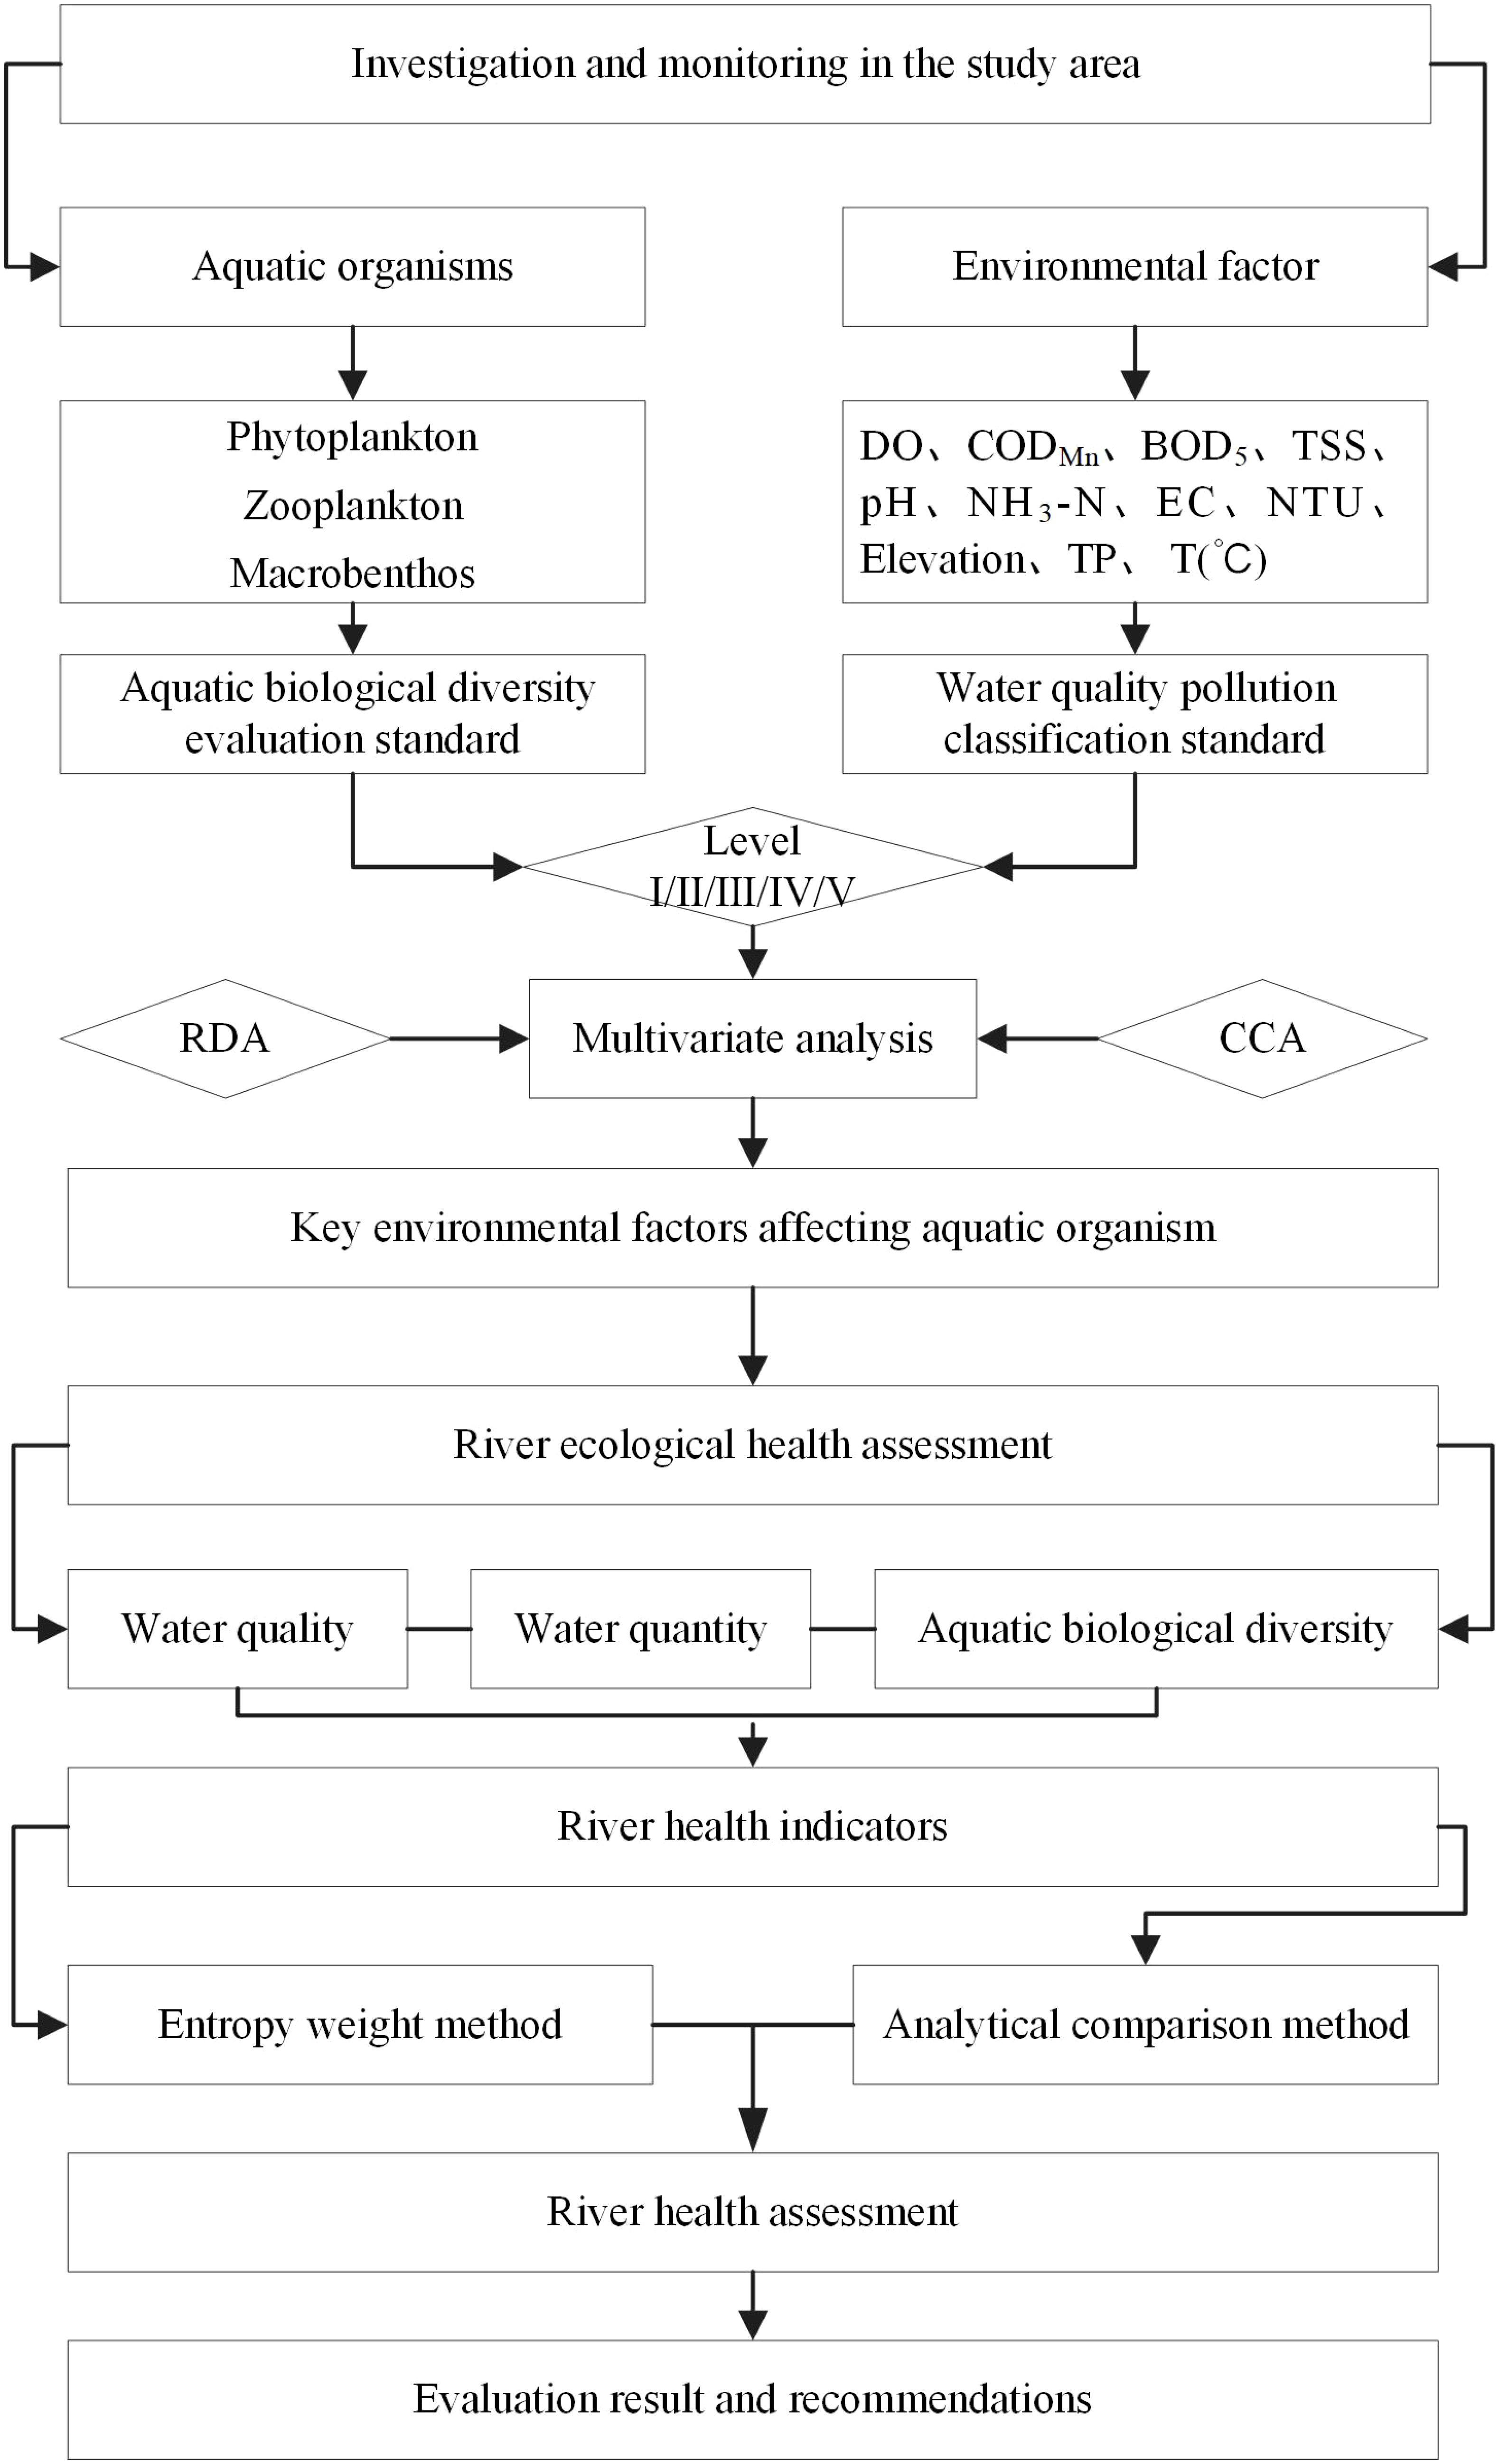
Figure 2. The technical flowchart.
3.1 River health indicators
Considerable research has been conducted on river ecosystem health evaluation. However, due to the unique characteristics of the rivers in Dalian, existing index systems are not suitable for assessing river health in this region. Therefore, an index system tailored to the specific ecological and environmental conditions of Dalian’s rivers needs to be developed.
Through investigation and analysis, the primary issues affecting the rivers in Dalian have been identified as water quality deterioration, reduced water quantity, and a decline in biological diversity. Considering the independence and clarity of the indicators, data availability, and findings from other studies, factors such as water quality, water quantity, and aquatic biodiversity were selected to reflect the overall health of the rivers (Table 1).
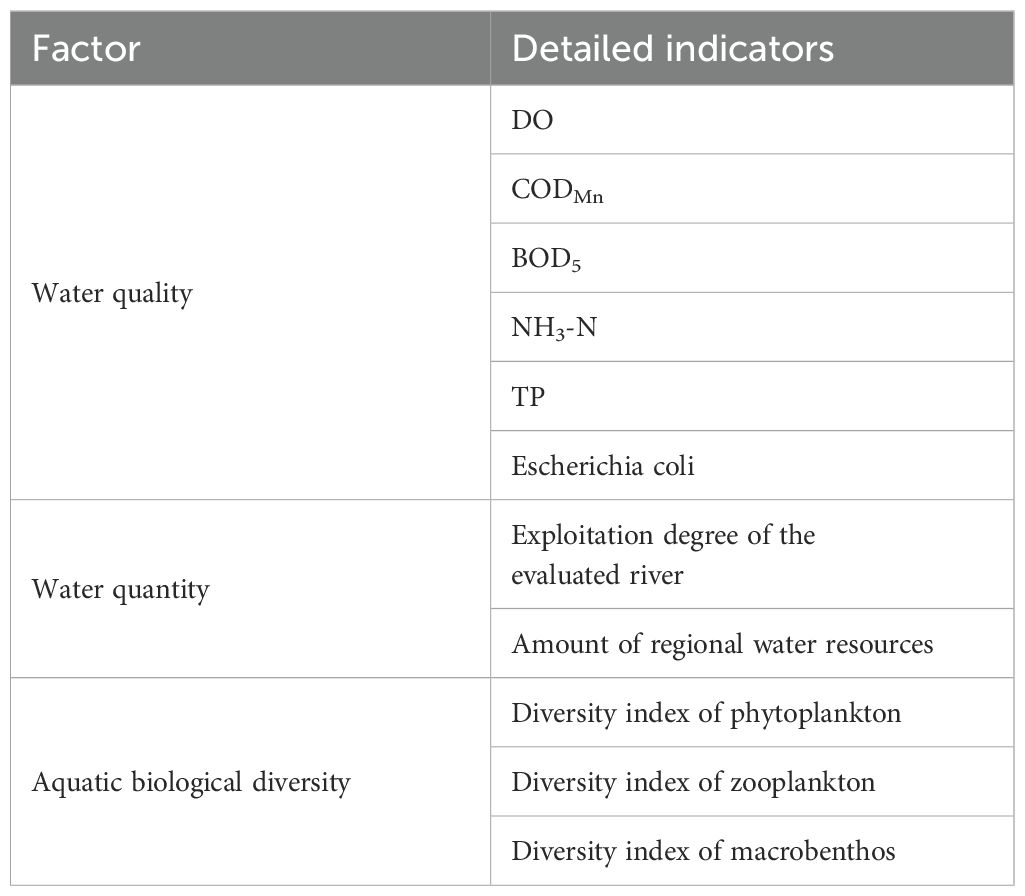
Table 1. Assessment indicator system of river health.
3.2 Evaluation standard
On the basis of The surface water environment quality standards GB3838-2002, the water quality pollution classification standard is shown in Table 2.
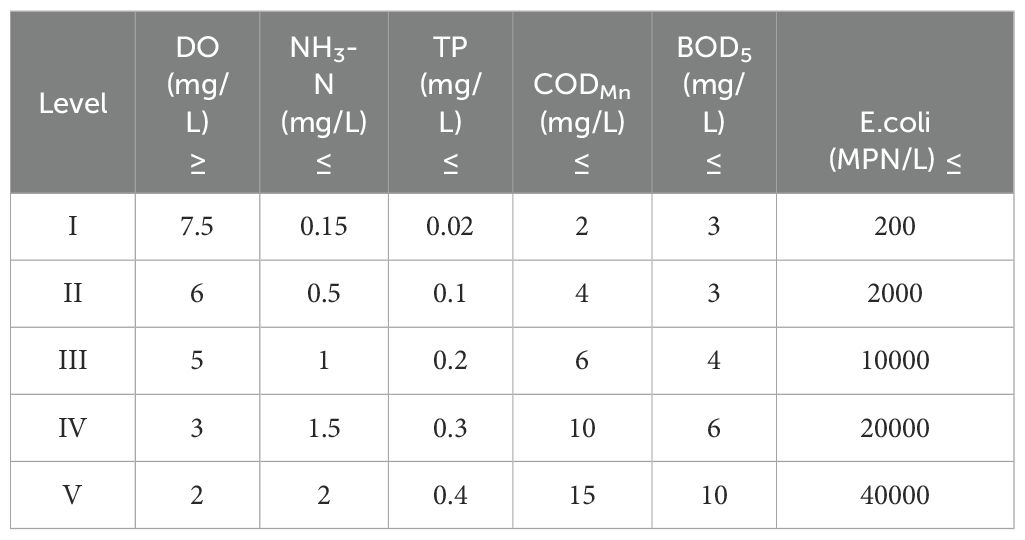
Table 2. Water quality pollution classification standard.
The threshold of the exploitation degree of rivers should be determined based on the theory of human-water harmony, this approach ensures that the exploitation can meet the reasonable demands of the economy and society, while also promoting the sustainable development of water resources and river ecosystems (Meng et al., 2009; Wang et al., 2022; Liu et al., 2024). An exploitation degree that is either too high or too low does not align with the requirements for river health. Internationally, the generally accepted reasonable limit for river exploitation is between 30% and 40%. Even with optimal use of rain and flood resources, the exploitation degree should not exceed 60%.
The conceptual model for evaluating river exploitation degree is shown in Figure 3. The model follows a parabolic structure, with the optimal exploitation range set at 30–40%. Exploitation levels above 60% or below 0% receive a score of 0. Based on this scoring system, river health is categorized as follows: 100–80 corresponds to Grade I; 80–60 to Grade II; 60–40 to Grade III; 40–20 to Grade IV; and 20–0 to Grade V. This classification enables a detailed assessment of river health, aligning with management goals.
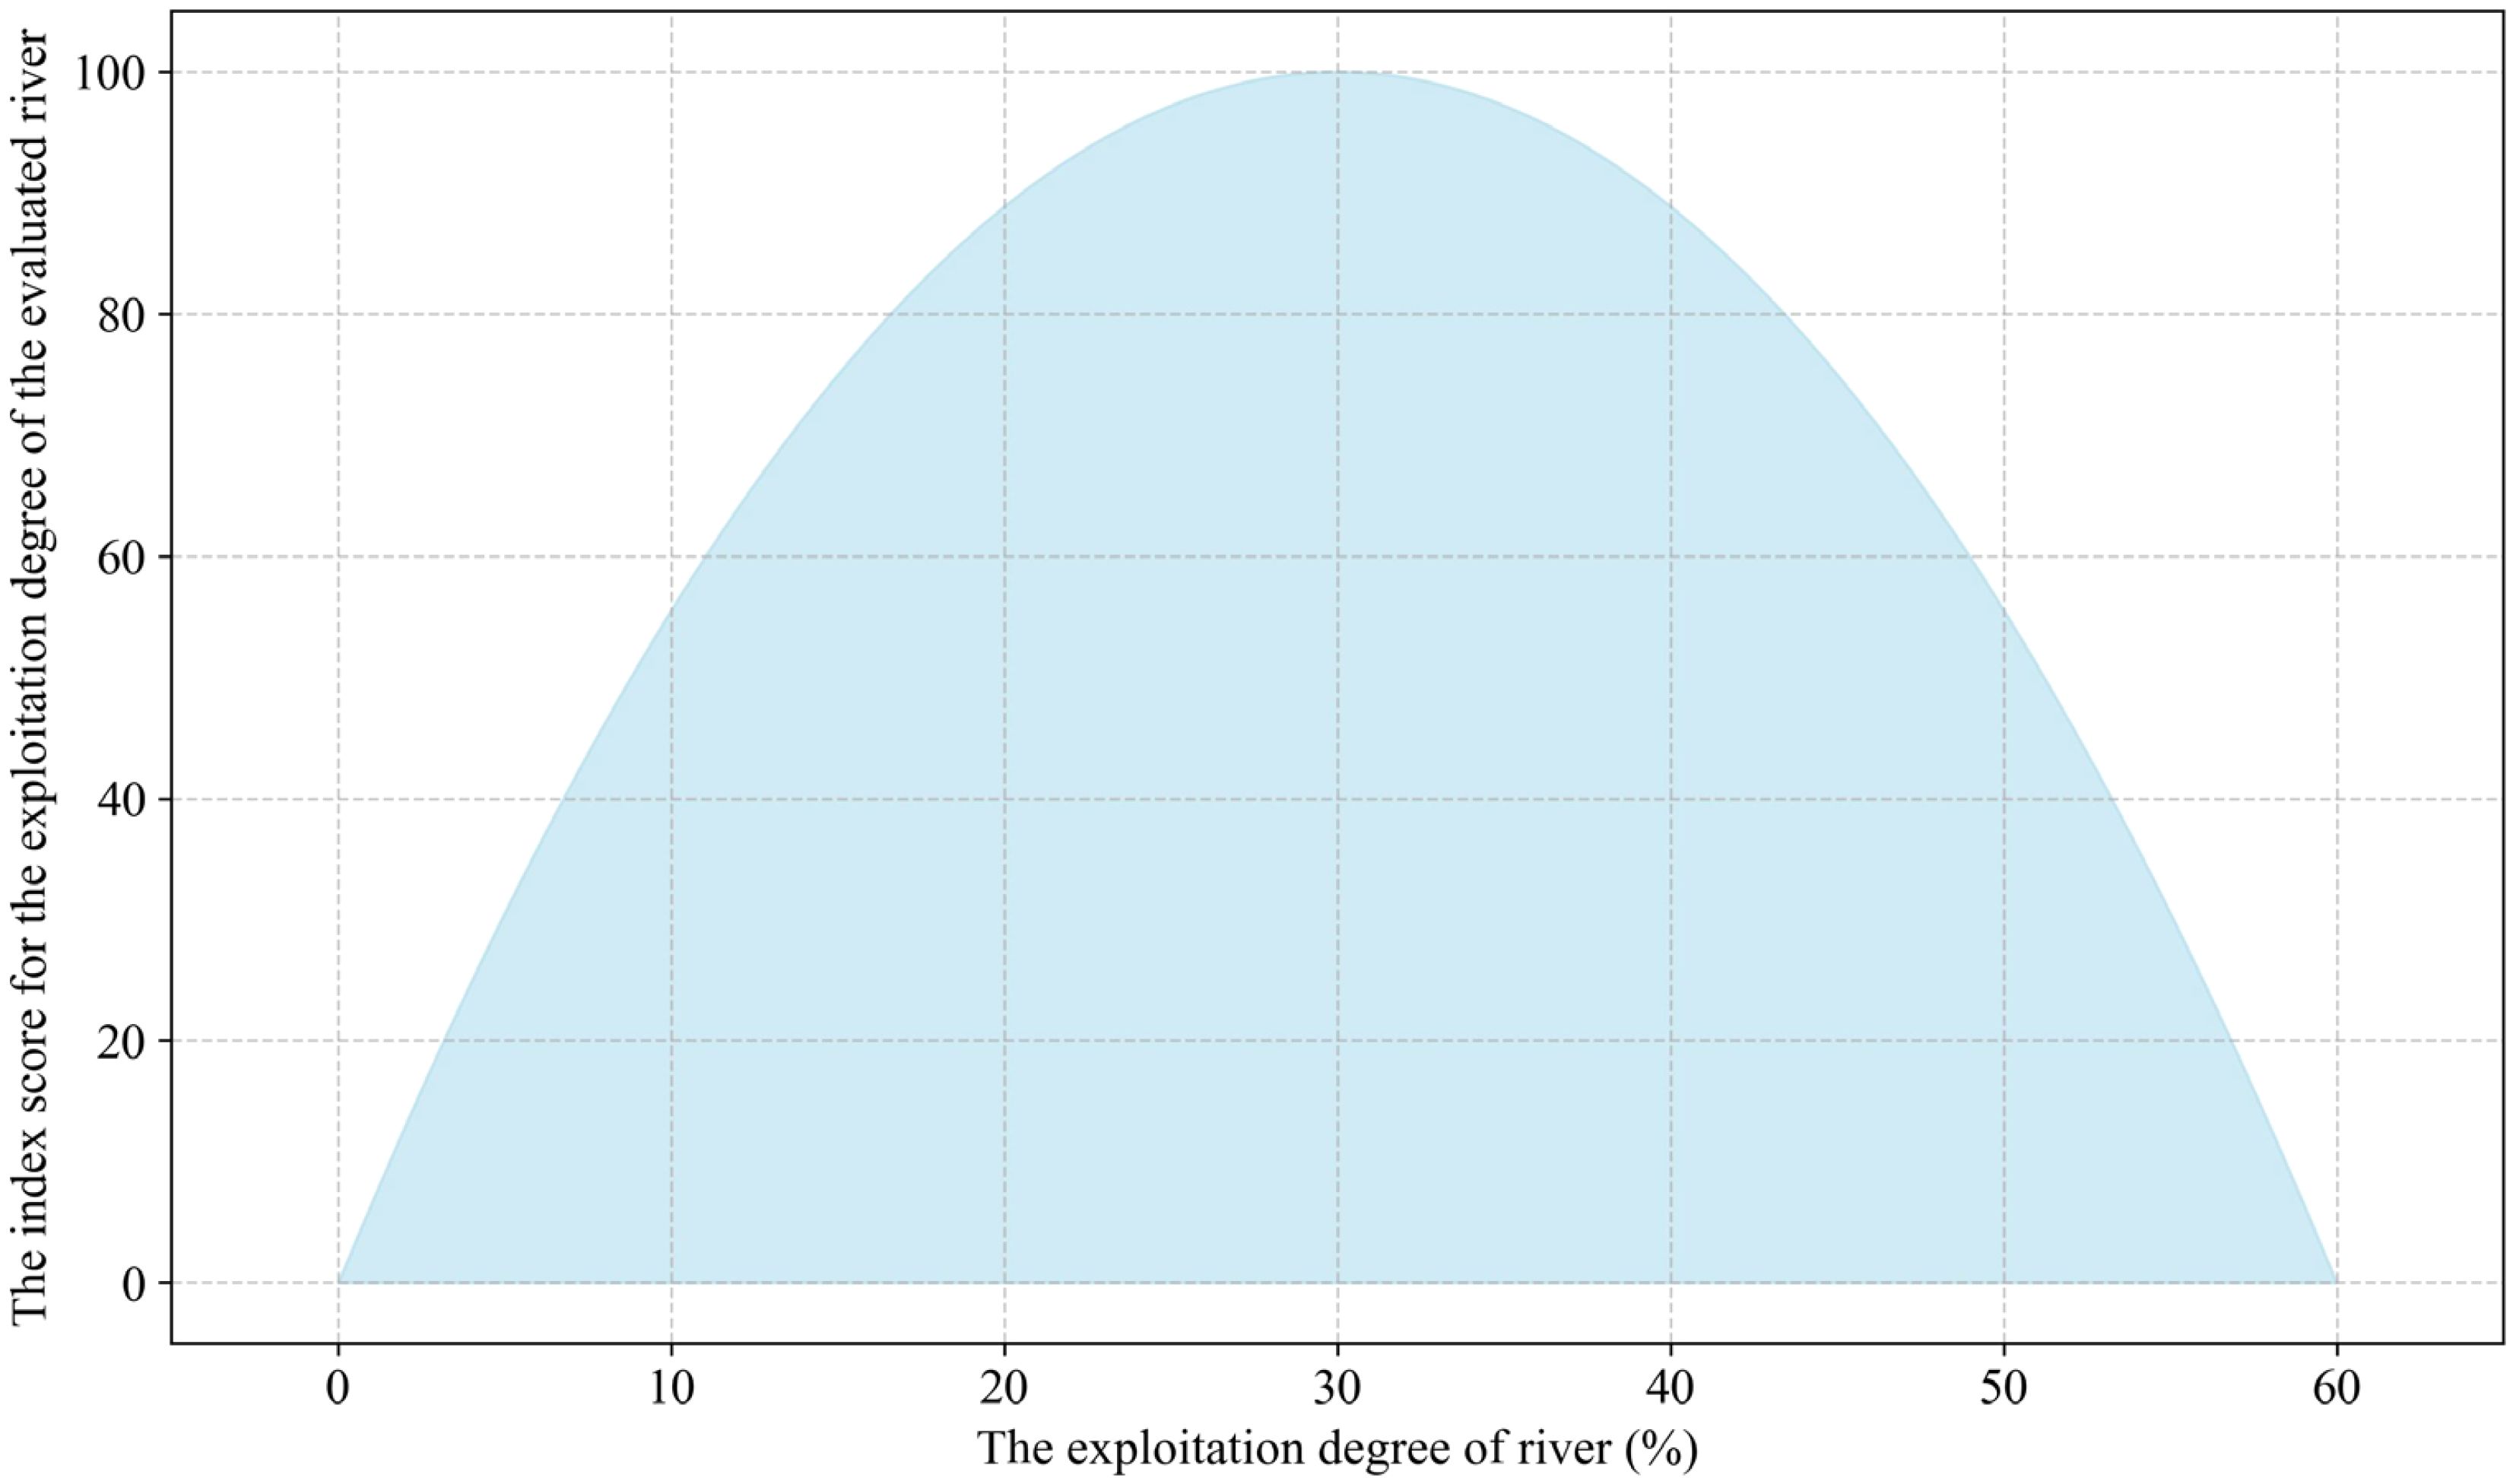
Figure 3. The conceptual model of index score for the exploitation degree of the evaluated river.
The health status of the river is evaluated by calculating the biological diversity index, using established evaluation standards for the index. The diversity indices include the Shannon-Wiener diversity index (H), Pielou evenness index (E), and Margalef index (M). The calculation formulas for each index are shown below:
where S is the total number of species appeared in each sample point; N is the total number of individuals in each point; ni is the number of i specie.
The evaluation standard of each aquatic biological diversity index is shown on Table 3.
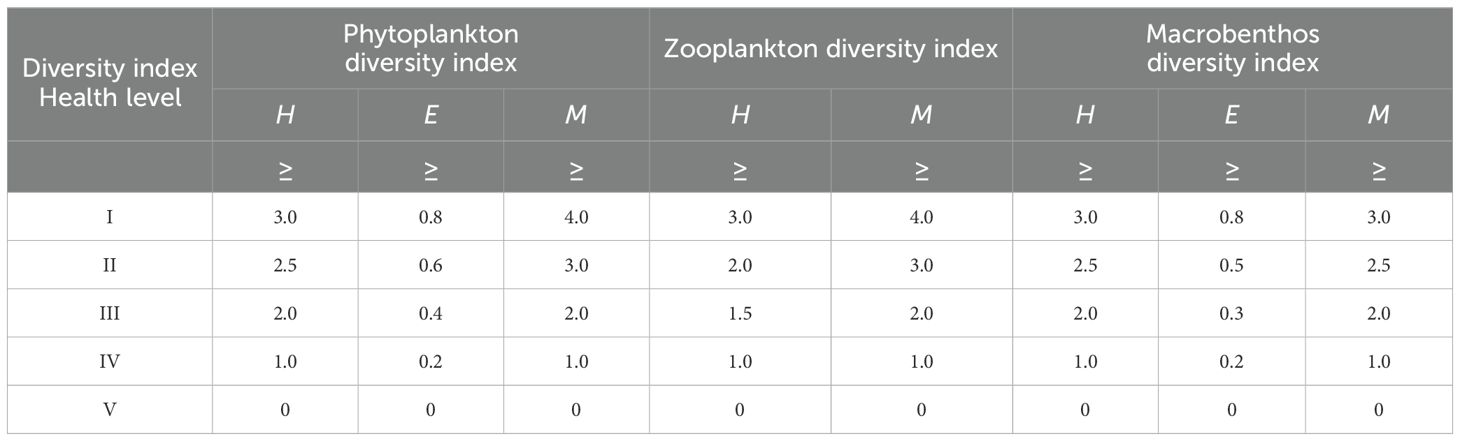
Table 3. Evaluation standard of aquatic biological diversity index.
3.3 Evaluation methodology
Assessing river ecological health is inherently complex due to the ambiguous nature of river health and the often conflicting interactions among its various components. To address these challenges, this study combines set pair analysis and entropy methods, offering a robust framework for analyzing and resolving the complexities of river health evaluation.
3.3.1 Set pair analysis method of river ecosystem health evaluation
When using set pair analysis to evaluate river ecosystem health, based on the river ecosystem health evaluation index system constructed by the researcher, the river’s health can be categorized into five grades. Assume that there are A evaluated indices in Grade I, B1, B2, B3 evaluated indices in Grades II, III, and IV, respectively, and C evaluated indices in Grade V. According to set pair analysis theory, the connection degree of each evaluated sample is calculated as:
By comparing the connection degree of a, b1, b2, b3 and c, the preliminary difference level of the evaluated samples can be determined. Further set pair analysis is then conducted to identify the similarities, differences, and oppositions of evaluation index values compared to the evaluation standards, for indicators that correlates positively with standard, the connection degree is determined as:
For indicators that correlates negatively with standard, the connection degree is determined as:
where m is the number of evaluation sample; n is the number of evaluation index; x is the measured value; S1、S2、S3、S4、S5 represent the upper limit of I~V level standard respectively.
3.3.2 The entropy weight method to determine the weight coefficient of the evaluation indexes
The weight of an index reflects its influence on the overall river ecosystem health. In this study, the entropy weight method was used to determine the weight coefficients of the evaluation indices. In information theory, entropy measures the degree of disorder or uncertainty in a system, and can quantify the amount of information. An index providing more information has a smaller entropy value, indicating lower disorder and a greater role in the final decision. Therefore, the entropy weight method is applied to calculate the weight coefficients of the evaluation indices. The main computational steps are as follows:
1. Assuming there are m evaluation objects, each evaluation objects have n evaluation indexes, the judgment matrix R is:
where m is the number of evaluation sample; n is the number of evaluation index; rst is the measured value.
2. Normalize the judgment matrix R, the element of the normalized matrix B is:
where rmax、rmin are the most satisfying and the most dissatisfied value respectively (the bigger the better or the smaller the better) of different things in the same assessment index.
3. According to the traditional conception of entropy, the entropy value of each evaluation index is:
where , When fst=0, .
4. The entropy weight of each evaluation index is:
where is entropy weight, is the entropy value of each evaluation index.
3.3.3 River ecosystem health evaluation model based on entropy weight and set pair analysis
According to the index weight vector W and the connection degree µm and µmn, the evaluation model based on entropy weight and set pair analysis is:
where is the comprehensive connection degree of evaluation sample m, t is the number of evaluation index.
Normalize all components in each , the final connection degree of each evaluated sample can be get.
Finally the evaluated sample level can be get according to the following formula, the evaluated sample belong to l level based on hl.
where y1=a, y2=b1, y3=b2, y4=b3, y5=c;λ is confidence coefficient, the general value is in [0.5, 0.7]. The evaluate result is more reliable if λ is bigger.
4 Results
4.1 Analysis of river water ecological status
4.1.1 River water quality condition
Based on water quality monitoring results and the “Environmental Quality Standards for Surface Water” (GB3838-2002), the water quality of major rivers in Dalian was assessed using a single-factor evaluation method. The analysis of the results, presented in Table 4, shows that most rivers in Dalian fall within Class III or below. The primary pollutants are ammonia nitrogen and total phosphorus. BOD5 levels at various sampling points range from Class I to Class IV, while CODMn levels also vary between Class I and Class IV, indicating significant differences across the sites. Additionally, the water quality at sampling points S5, S8, S9, and S10 is classified as Class V.
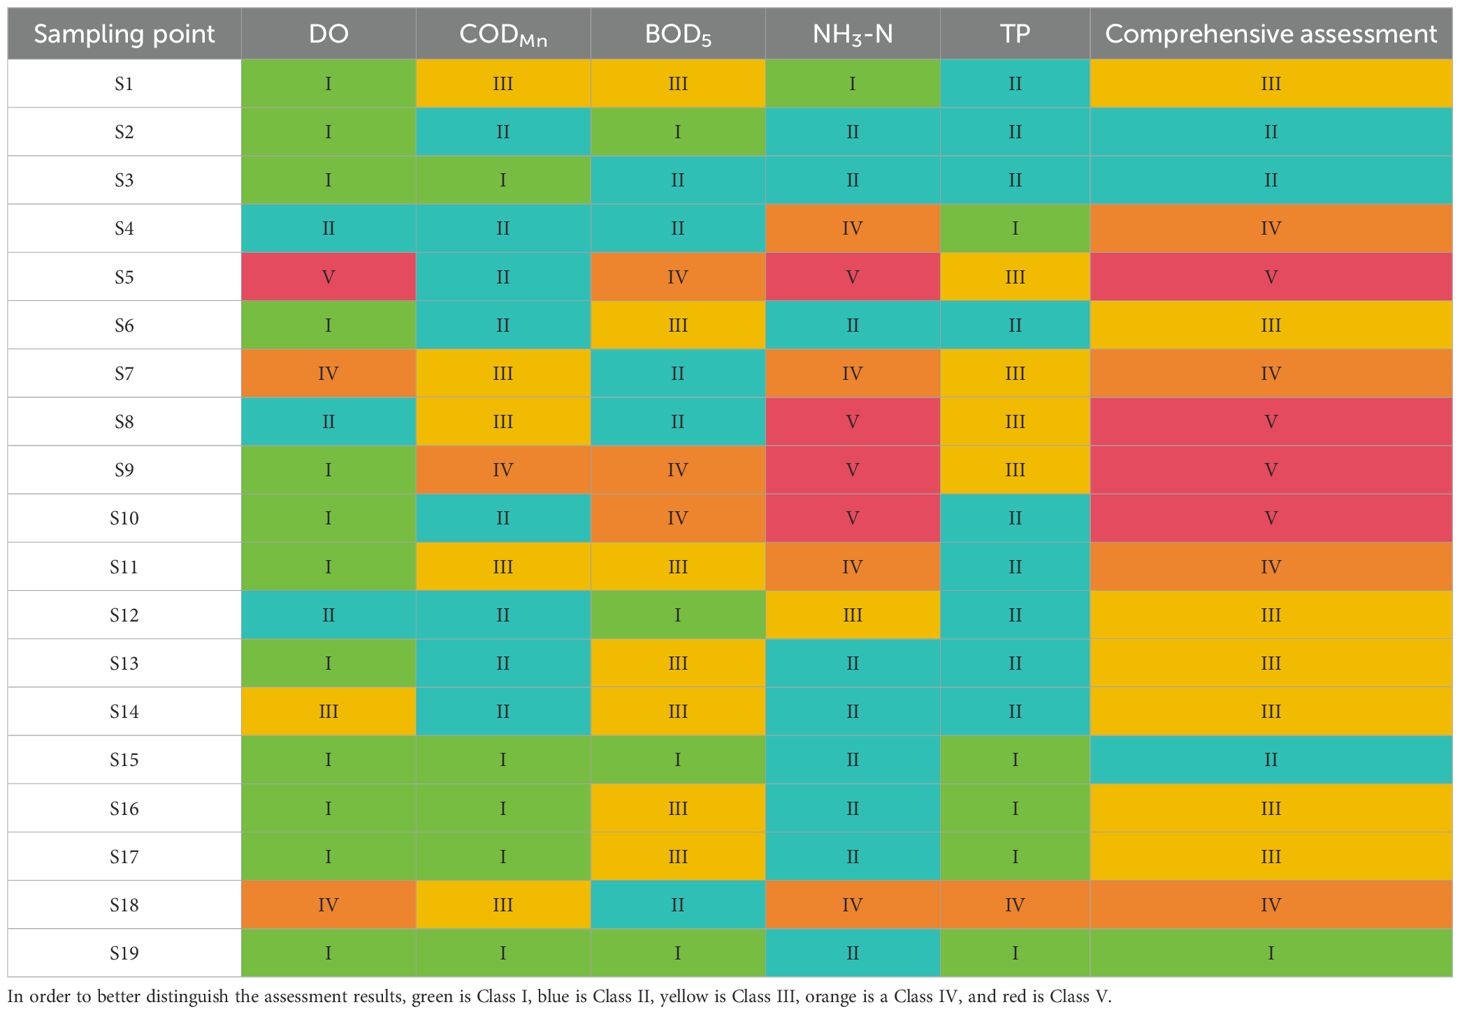
Table 4. Results of single factor and comprehensive evaluation of river water quality.
4.1.2 River biological condition
Phytoplankton: A total of 168 phytoplankton species were identified during the aquatic ecological survey of six major rivers in Dalian, encompassing 19 sampling sites. These included 91 species of Bacillariophyta (54.17%), 39 species of Chlorophyta (23.21%), 13 species of Euglenophyta (7.74%), 3 species each of Cryptophyta, Xanthophyta, and Chrysophyta (1.79% each), 15 species of Cyanophyta (8.93%), and 1 species of Pyrrophyta (0.60%). The spatial distribution of phytoplankton, illustrated in Figure 4, demonstrates significant spatial variability. Overall, Bacillariophyta and Chlorophyta were dominant in most sampling sites, while Cyanophyta dominated in specific locations such as S1 and S17.
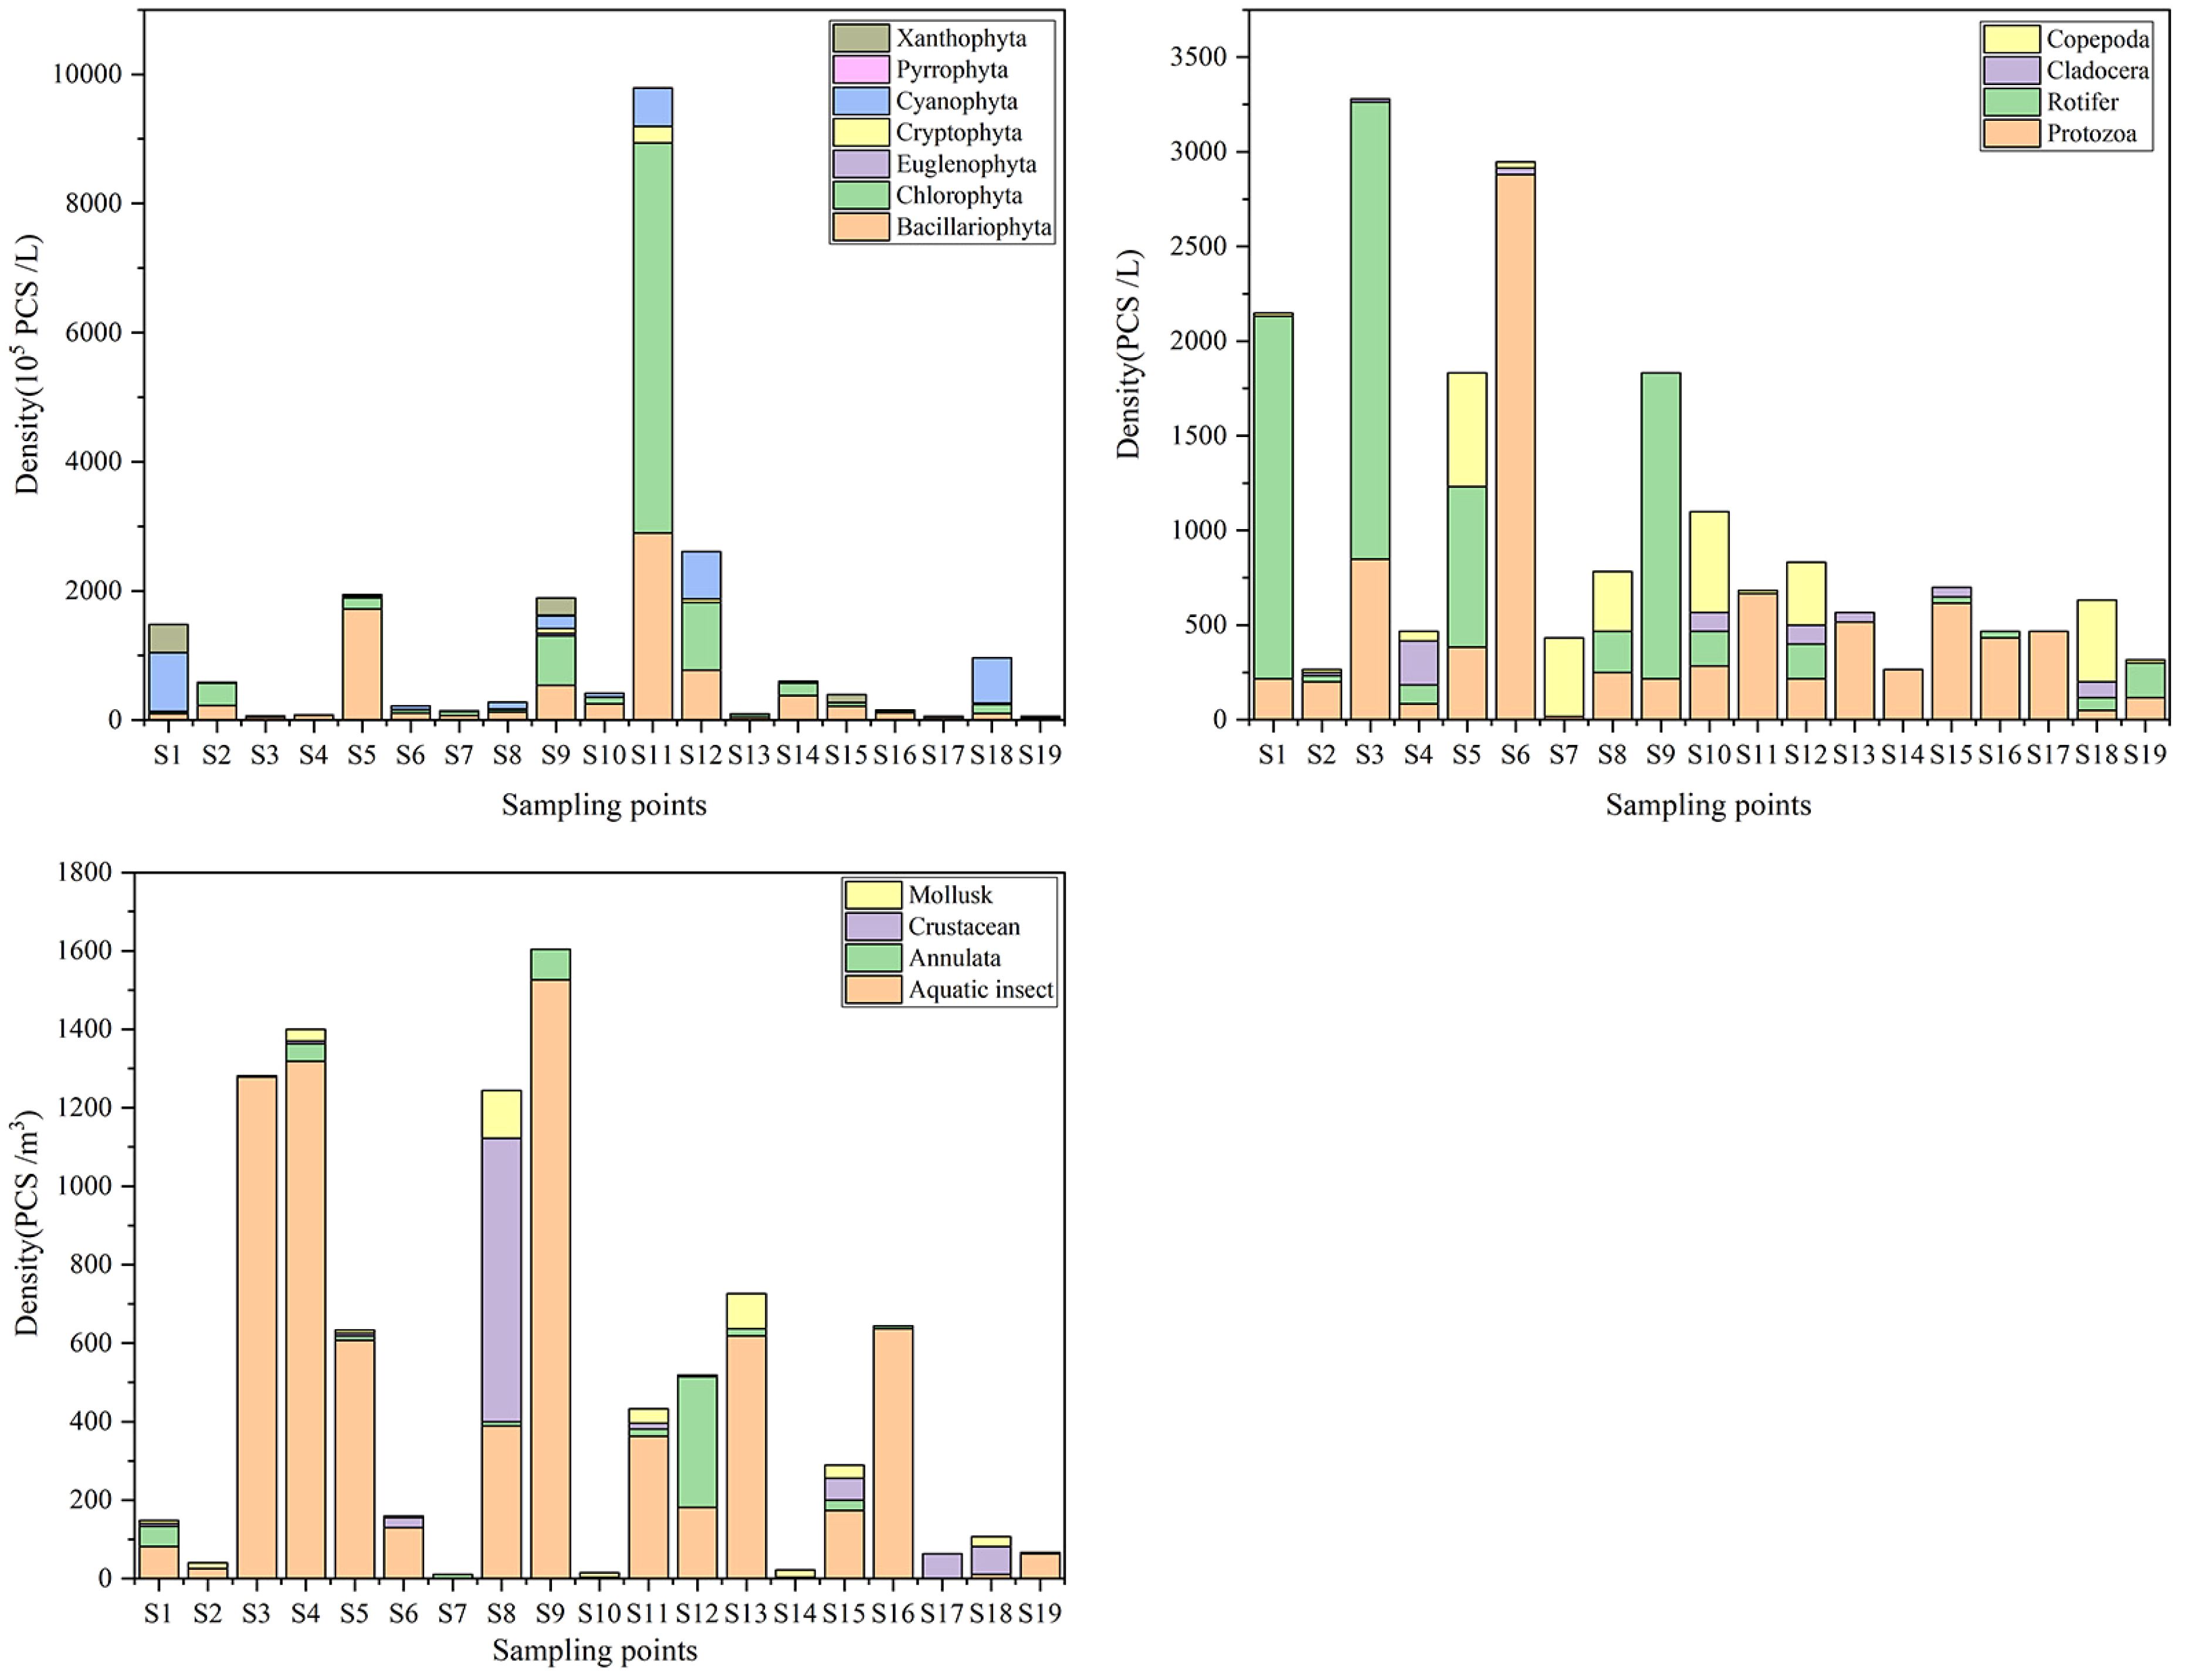
Figure 4. The aquatic organisms density at sampling sites.
Zooplankton: A total of 110 zooplankton species were identified, comprising 35 species of Protozoa (47.8%), 42 species of Rotifera (40.3%), 20 species of Cladocera (10.4%), and 13 species of Copepoda (16.4%). As shown in Figure 4, zooplankton displayed evident spatial distribution differences. Protozoa were predominant in most sampling sites, while Copepoda were mainly found near coastal sampling sites, such as S4, S10, and S17.
Macrozoobenthos: The survey identified 102 species of macrozoobenthos, including 70 species of aquatic insects (68.63%), 6 species of crustaceans (5.88%), 10 species of annelids (9.8%), and 16 species of mollusks (15.69%). The spatial distribution of macrozoobenthos, depicted in Figure 4, also exhibited significant spatial differences.
Table 5 presents the species count of phytoplankton, along with the Shannon-Wiener diversity index (H), Pielou’s evenness index (E), Margalef richness index (M), and their evaluations as per diversity index standards for each sampling site. The highest phytoplankton species count was recorded at S4 with 27 species, whereas the lowest counts, of 11 species each, were at S18 and S19. The diversity indices closely mirrored species richness, with cleaner sites demonstrating higher richness. For instance, the indices at S3—H (2.62), E (0.93), M (3.84)—were the highest among all sites, indicating the best water quality when assessed via phytoplankton. Conversely, the lowest values for these indices (H: 1.02; E: 0.38; M: 1.78) were observed at S1, where Xanthophyta was the predominant group.
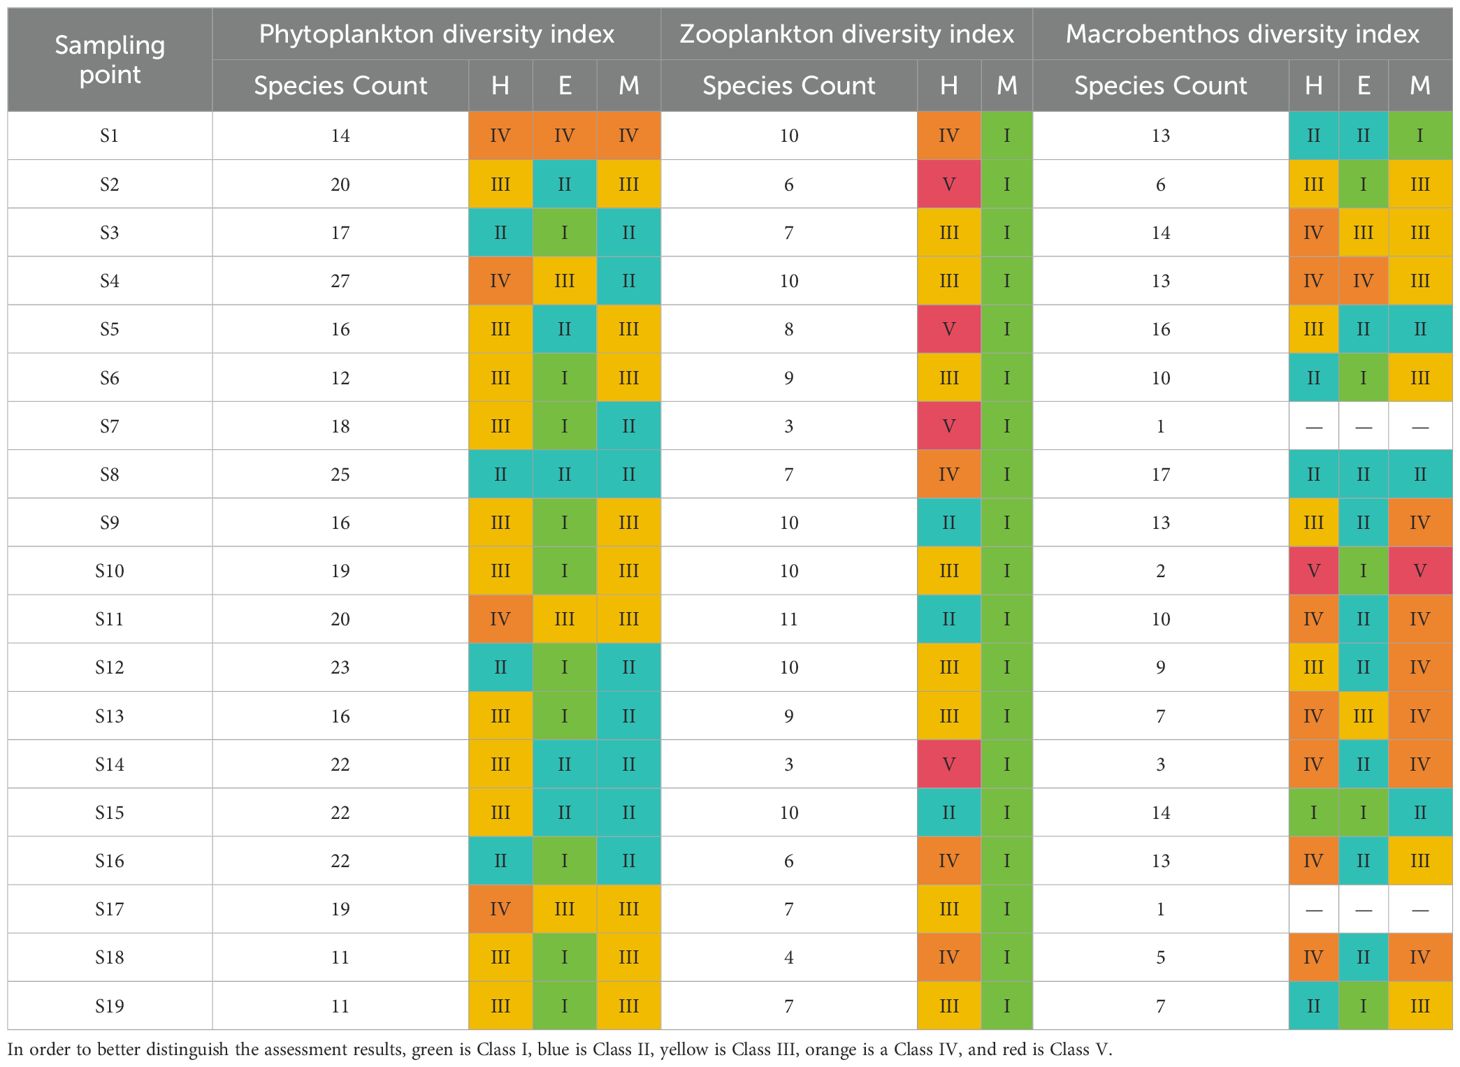
Table 5. Assessment results of aquatic biodiversity index at different sampling sites.
The species number, density, biomass, Shannon-Wiener diversity index (H), and Margalef richness index (M) of zooplankton at each sampling point are shown in Table 5. The zooplankton species number was highest at S11, with 11 species, and lowest at S14 and S7, with only 3 species each. The diversity indices generally reflected a pattern similar to species richness, with cleaner sites exhibiting higher species richness. For example, S11 had the highest H value (2.31) and M value (10.11), with 12 species identified, indicating that S11’s water quality, based on zooplankton evaluation, was the best in the study area. In contrast, S7 exhibited the lowest biodiversity indices (H: 0.43; M: 10.87), with just three species observed.
Table 5 presents the species number, Shannon-Wiener diversity index (H), Pielou evenness index (E), Margalef richness index (M), and evaluation results for benthic macroinvertebrates at each sampling site. The results indicate that sites S1 and S15 were lightly polluted. However, the dominant species at these sites were not sensitive, with only a few Ephemeroptera species observed. At S1, the most abundant species were Glyptotendipes cauliginellus and Limnodrilus hoffmeisteri, while Cardina denticulata sinensis dominated at S15. Sites with moderate pollution had the highest species diversity, with dominant species appearing more frequently and abundantly. These species were primarily moderately pollution-tolerant taxa, including Limnodrilus hoffmeisteri. Sites with heavy or severe pollution, mainly near river mouths, were dominated by highly pollution-tolerant species such as Chironomidae larvae and oligochaetes, as well as moderately tolerant species like Radix ovata. Notably, only one species was recorded at S7, where the proximity to a steel mill discharge resulted in high conductivity, negatively affecting benthic macroinvertebrate survival.
4.2 Relationship between river biomes and environmental factors
Figure 5 presents the results of the redundancy analysis (RDA), illustrating the relationships between phytoplankton or sampling sites and environmental factors. The horizontal and vertical axes represent the first and second ordination axes, respectively. The correlation coefficient between the first and second axes is zero, indicating that the ordination results are reliable.
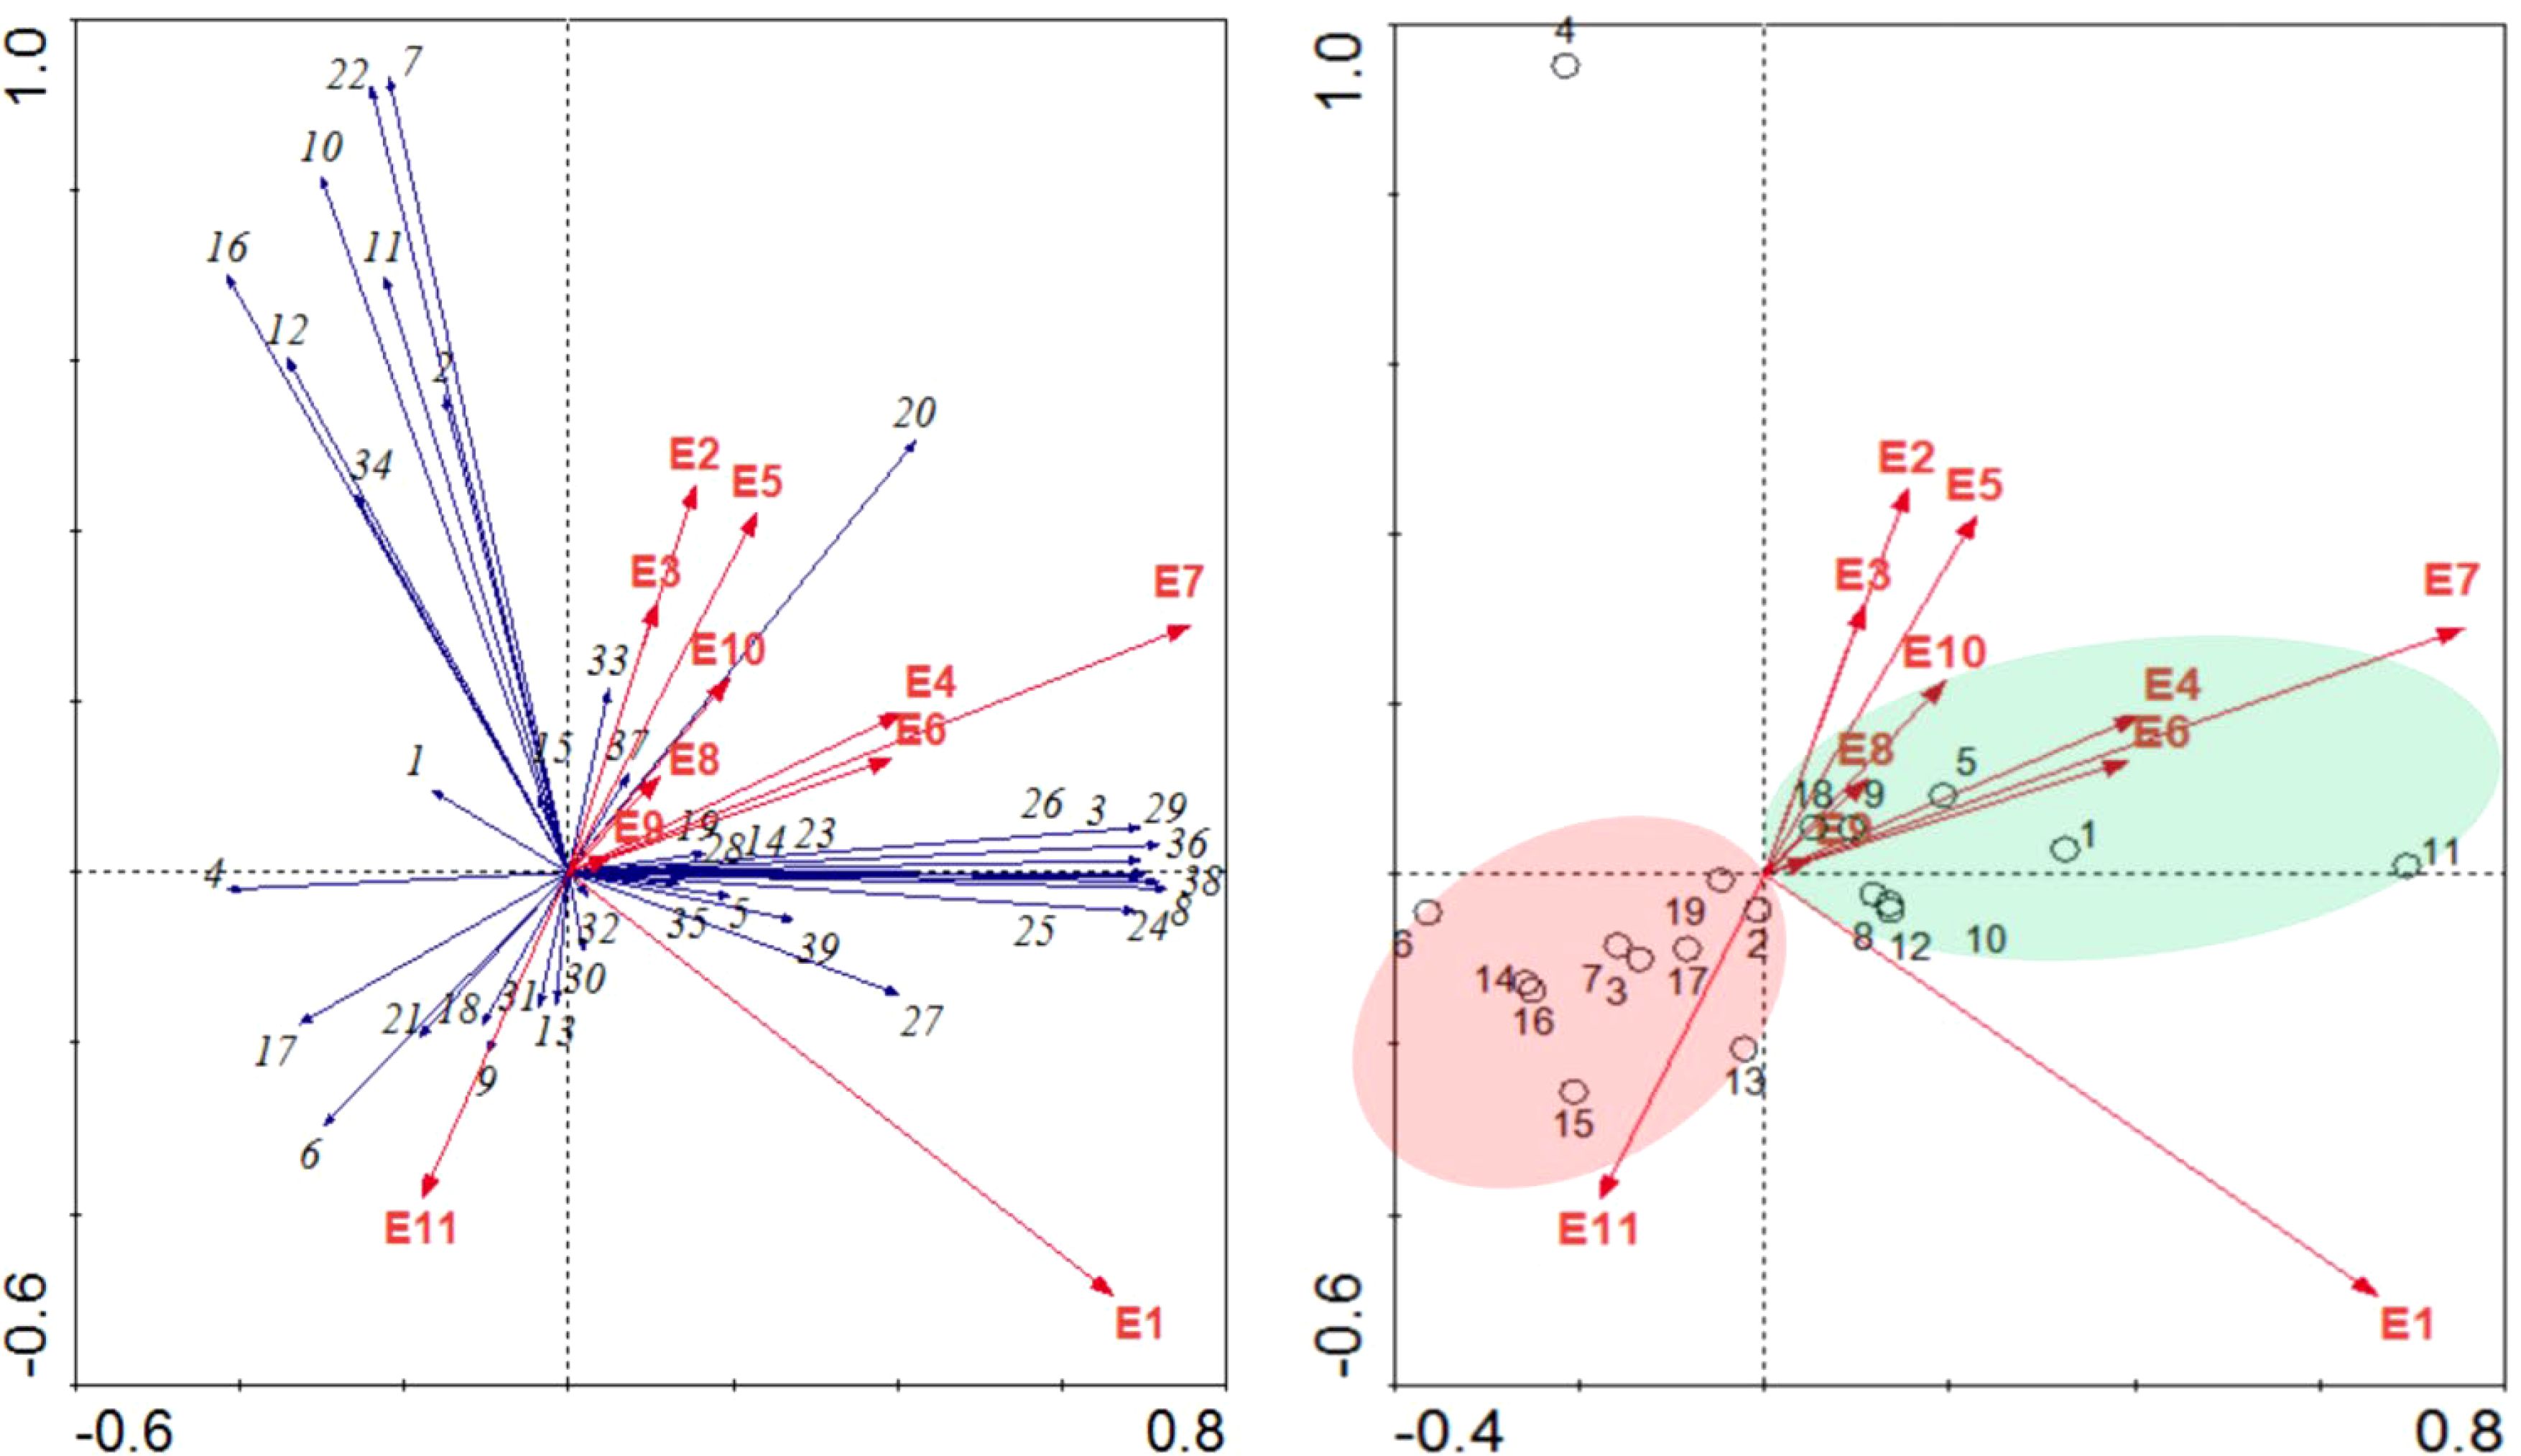
Figure 5. RDA analysis of phytoplankton species density and environmental factors in major rivers of Dalian City (Red arrow represents environmental factors, blue arrow represents species, and circle represents sampling point E1: DO; E2: NH3-N; E3: TP; E4: CODMn; E5: BOD5; E6: T(℃); E7: pH; E8: EC; E9: TDS; E10: Turbidity; E11: Altitude).
From the left panel, species in the upper-left corner (species types are listed in Appendix), including (2), (7), (10), (11), (12), (16), (22), and (34), are positively correlated with ammonia nitrogen (E2), BOD5 (E5), and total phosphorus (E3), while negatively correlated with dissolved oxygen (E1). Other environmental factors have minimal impact on these species. In contrast, species near the horizontal axis on the right, such as (3), (8), (24), (25), (26), (29), (36), and (38), show positive correlations with dissolved oxygen (E1) and pH (E7). Altitude (E11) significantly affects species like (6), (17), and (20). From the right panel, sampling sites in the first quadrant show high similarity and are mainly influenced by altitude (E11), while those in the third quadrant are strongly correlated with pH (E7).
The RDA analysis results indicate that the correlation between the first axis and pH (r = 0.537) is the highest, while the second axis correlates most strongly with dissolved oxygen (r = 0.4498). This suggests that pH and dissolved oxygen are the primary factors influencing the phytoplankton community structure in major rivers of Dalian. Additionally, ammonia nitrogen, total phosphorus, BOD5, and altitude also exert significant influence on the phytoplankton community.
Figure 6 presents the results of the canonical correspondence analysis (CCA), illustrating the relationships between zooplankton species, sampling sites, and environmental factors (species details are listed in Appendix). The left panel shows that species within the red circle, including (4), (8), (9), (10), (12), (13), (14), are closely associated with altitude (E11). In contrast, species in the green circle, such as (1), (2), (3), (5), (6), and (7), are positively correlated with ammonia nitrogen (E2) and conductivity (E8), indicating minimal distributional variation. Species like (11) are sensitive to pH (E7).
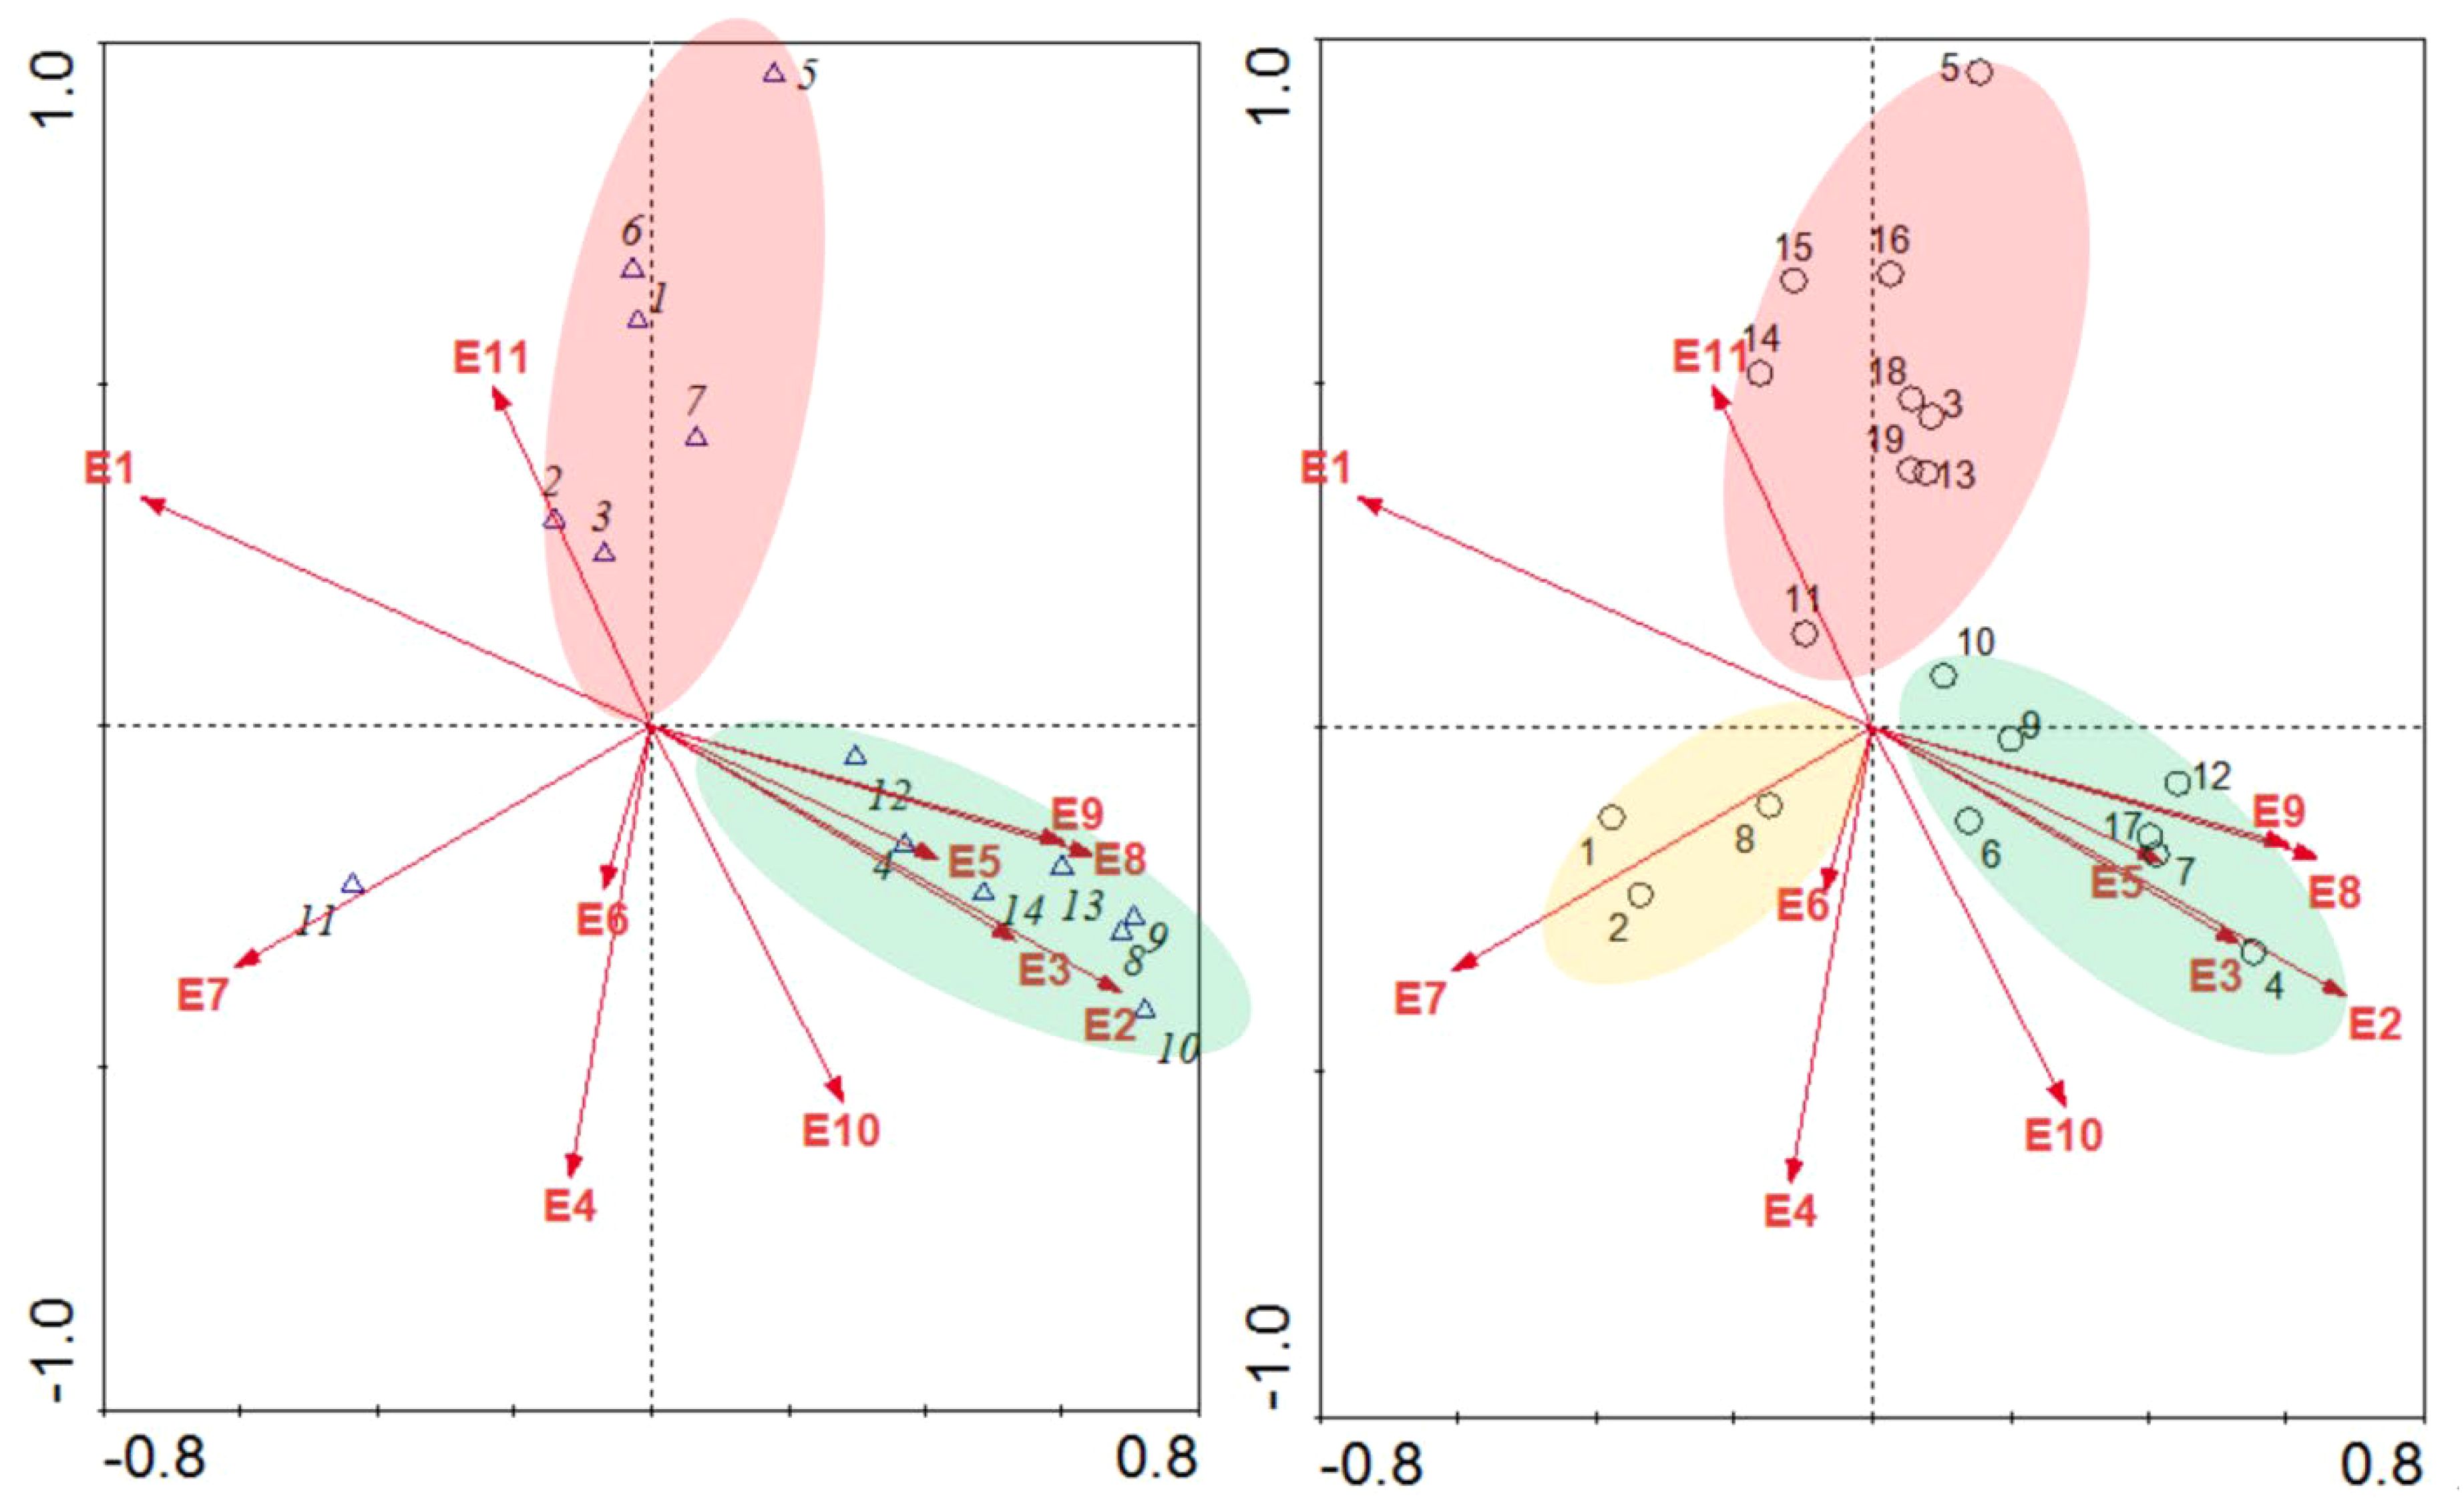
Figure 6. CCA analysis of zooplankton species density and environmental factors in major rivers of Dalian City.
The right panel reveals that sampling sites in the red circle are mainly influenced by altitude (E11), while those in the green circle are primarily affected by ammonia nitrogen (E2). Sites in the yellow circle are most influenced by pH (E7).
The CCA analysis results reveal that the first ordination axis is most strongly correlated with dissolved oxygen (r = -0.7291) and ammonia nitrogen (r = 0.6702), while the second axis is primarily associated with COD (r = -0.6386). These findings suggest that dissolved oxygen, ammonia nitrogen, and COD are the key environmental factors shaping the zooplankton community structure in the major rivers of Dalian.
Figure 7 presents the canonical correspondence analysis (CCA) results, elucidating the relationships between macroinvertebrate communities, sampling sites, and environmental factors. The analysis confirms the reliability of the ordination results, as the correlation coefficient between the first and second axes is zero.
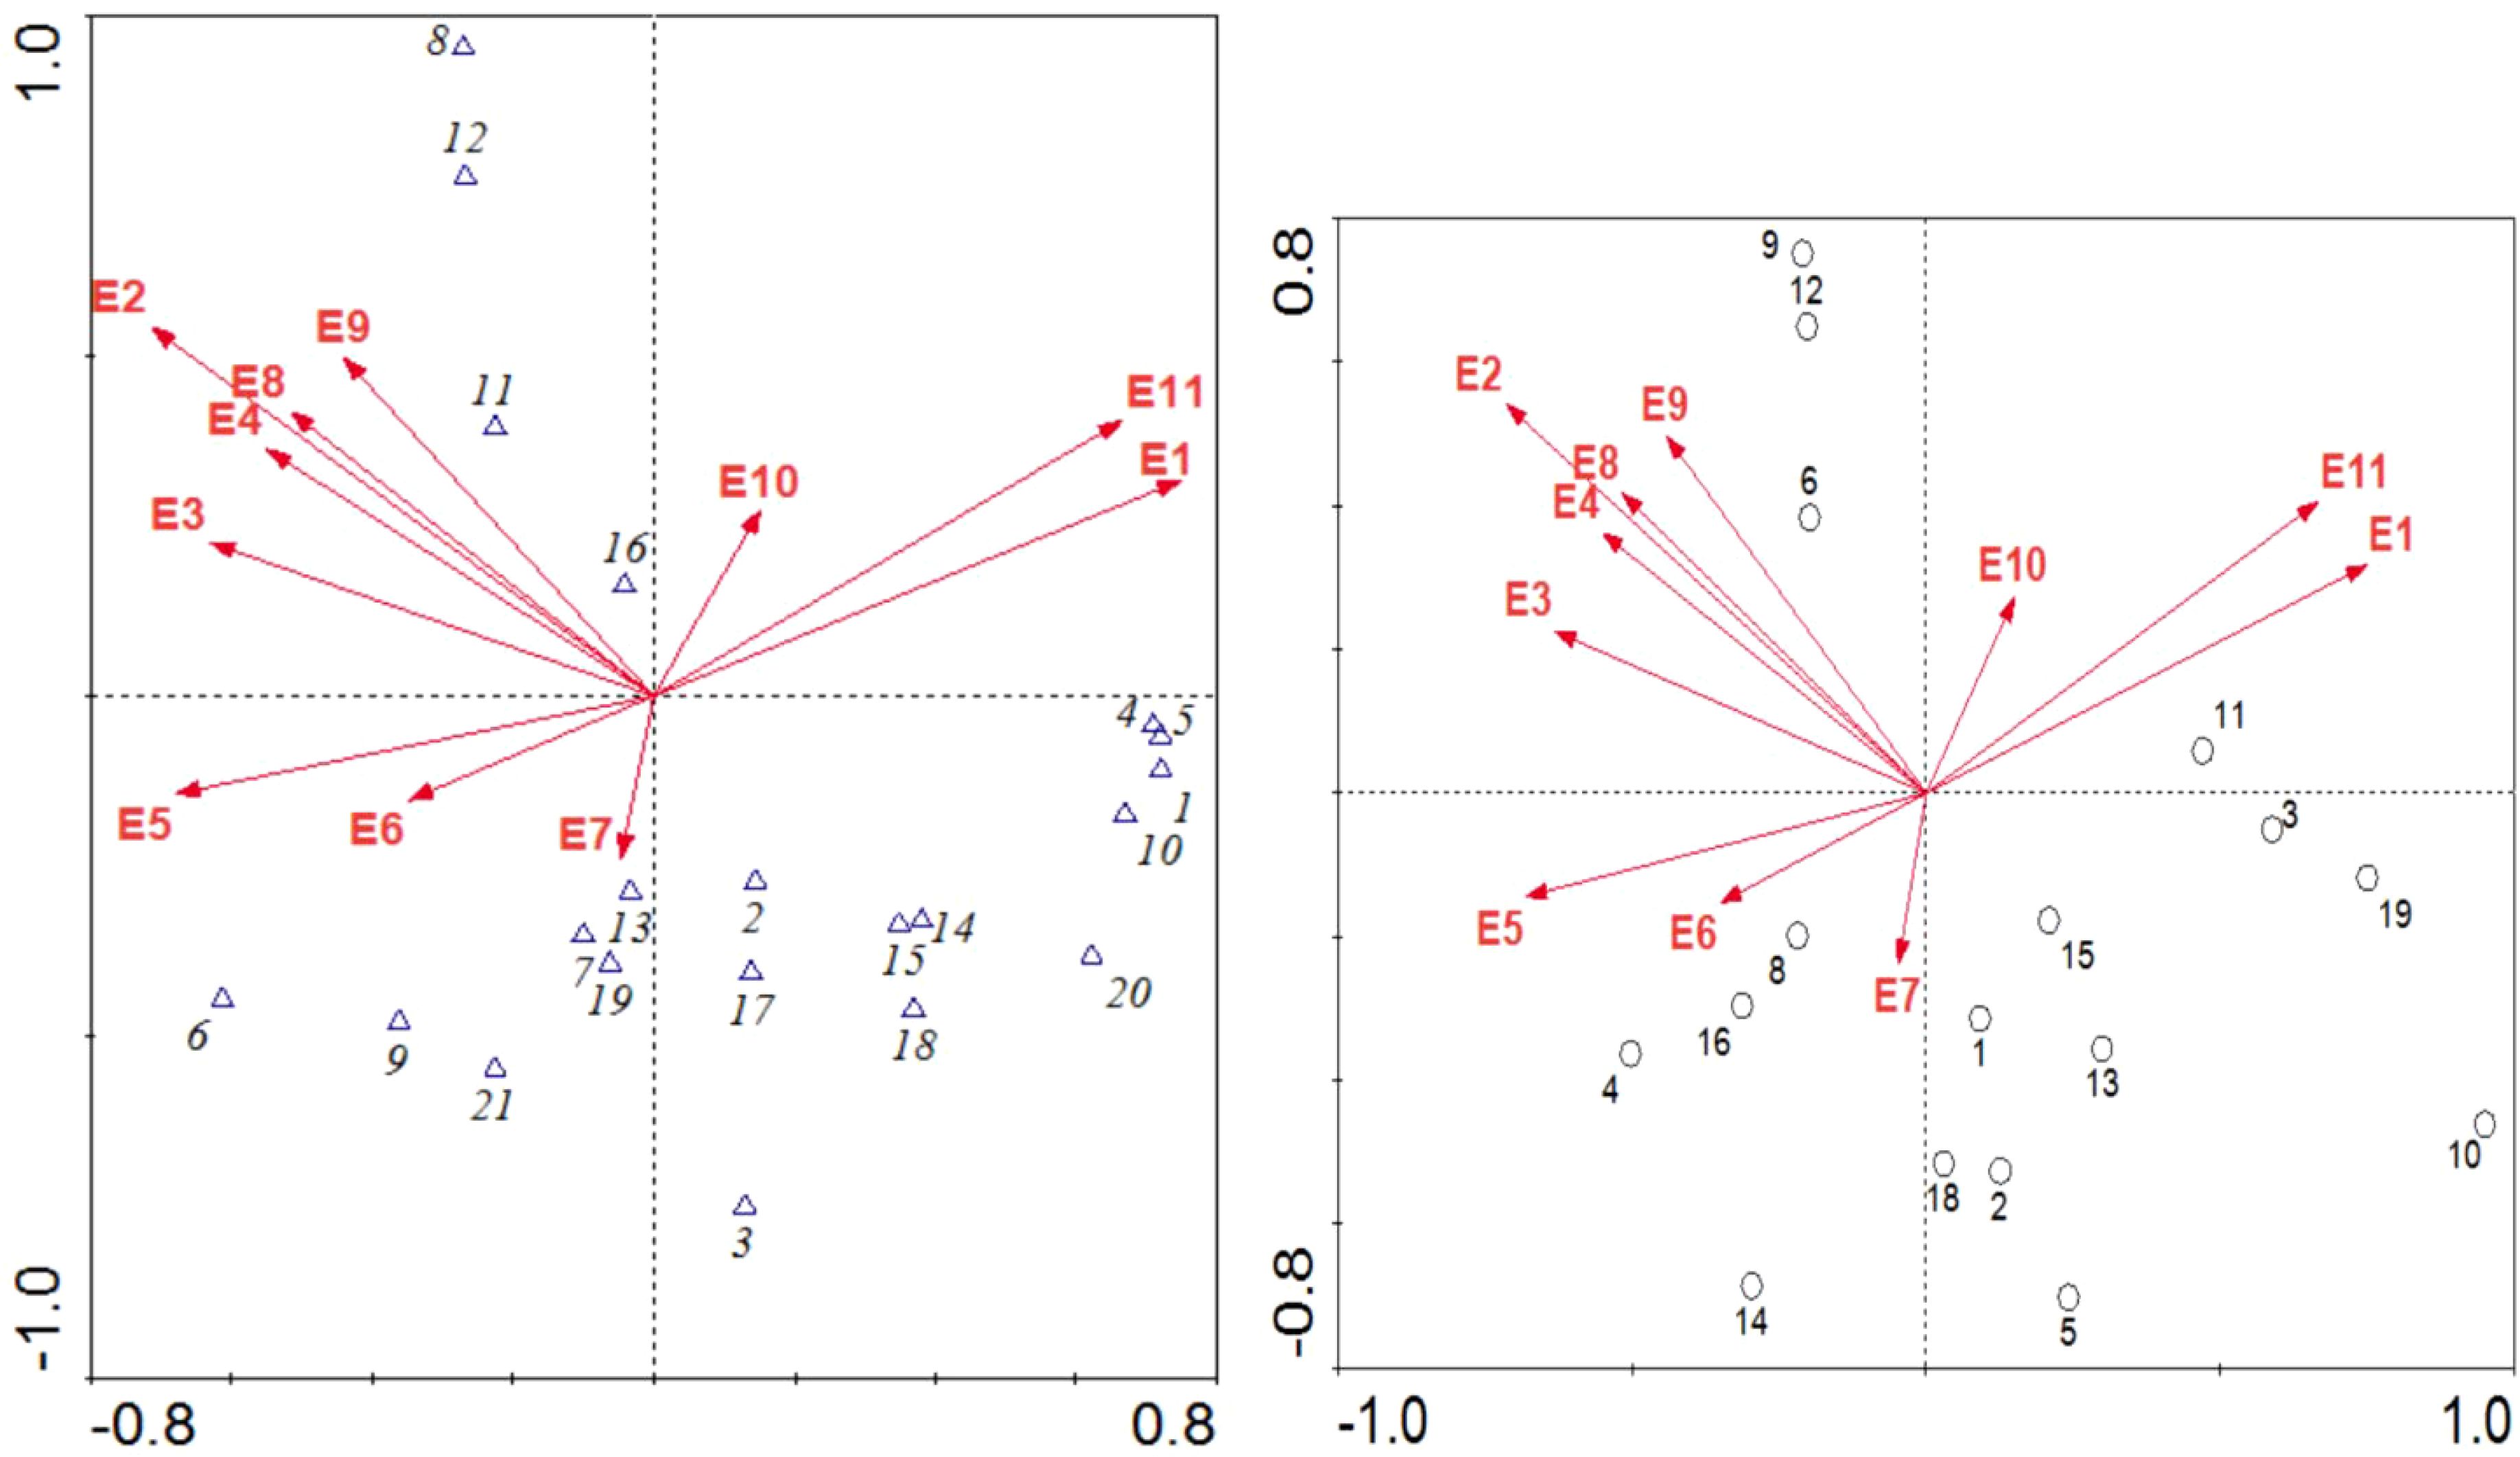
Figure 7. CCA analysis of macrobenthic species density and environmental factors in major rivers of Dalian City.
The CCA results indicate that the first ordination axis shows strong correlations with dissolved oxygen (r = 0.7432), ammonia nitrogen (r = -0.7084), and total phosphorus (r = -0.6259). Meanwhile, the second axis is most significantly correlated with ammonia nitrogen (r = 0.5314). These findings highlight that dissolved oxygen, ammonia nitrogen, and total phosphorus are the primary environmental factors influencing the community structure of macroinvertebrates in the major rivers of Dalian.
4.3 Comprehensive assessment of river ecological health
Using the entropy weighting method, the weights of various evaluation indicators are determined (Table 6):
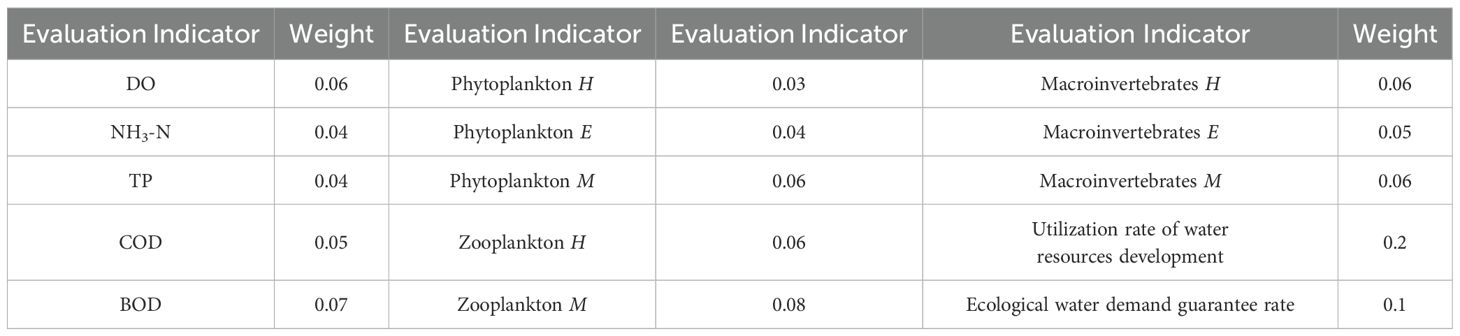
Table 6. Indicator weight.
The ecological health of six rivers in Dalian was assessed using river health evaluation methods and an established indicator system. First, the evaluation indicator values from various monitoring sections were compared to river health classification standards to preliminarily assess the health status of each section through set pair analysis correlation degrees. Based on the confidence criterion formula with a λ value of 0.7, the health grades of river sections were determined. The results, presented in Table 7, show that sections S12 and S15 have relatively good health conditions. In contrast, sections S4, S8, and S17 are classified as Grade IV, indicating poor health, while section S7 is categorized as Grade V, representing severe pollution. Other sections fall under Grade III, indicating a critical health state.
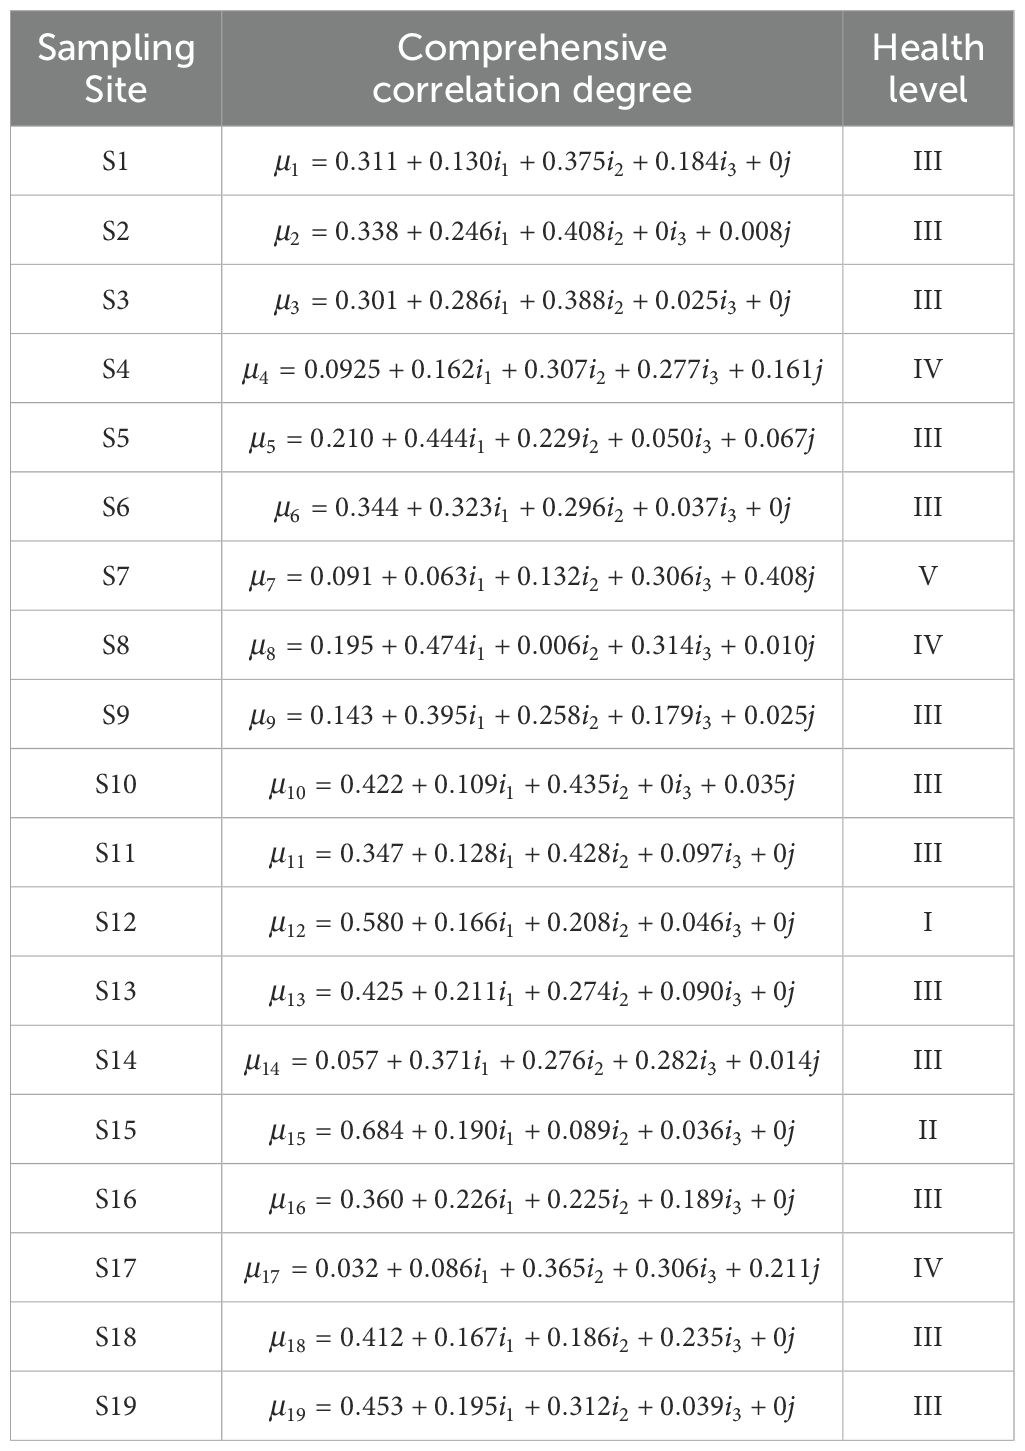
Table 7. Comprehensive correlation degree and health grade of river samples.
5 Discussion
The study revealed that pH and dissolved oxygen are the primary factors influencing phytoplankton communities in the major rivers of Dalian. Previous research has demonstrated a significant positive correlation between algal primary productivity and pH levels (Yu et al., 2022), with pH variations influencing the growth and distribution of phytoplankton (Raven and Beardall, 2021). Nitrogen and phosphorus, essential nutrients in aquatic ecosystems, serve as fundamental elements for phytoplankton growth and play critical roles in the development of aquatic organisms. Studies have identified nitrogen and phosphorus as key limiting factors for the structure and distribution of phytoplankton communities (Liu et al., 2021; Lin, 2023).
Dissolved oxygen and BOD5 are effective indicators of organic pollution in water bodies, while dissolved oxygen, ammonia nitrogen, and COD significantly impact zooplankton communities in Dalian’s major rivers. Zooplankton communities are also influenced by conductivity and altitude, where conductivity reflects ion concentrations and salinity levels—factors that affect individual growth and the spatial-temporal distribution of zooplankton (Bandara et al., 2021; Yi et al., 2024). Furthermore, factors such as pH, dissolved oxygen, ammonia nitrogen, total phosphorus, BOD5, and altitude indirectly affect zooplankton communities through trophic interactions, as zooplankton feed on phytoplankton.
Multivariate analysis reveals that, in comparison to phytoplankton and zooplankton, the correlations between macrozoobenthos and environmental factors are weaker. This difference can likely be attributed to the distinct habitat characteristics of macrozoobenthos, which reside in benthic environments where sediment conditions play a more prominent role than water quality parameters. Unlike planktonic organisms, whose distributions are primarily influenced by water column properties such as temperature, nutrient concentrations, and light availability, benthic organisms are more closely tied to the physical and chemical conditions of the substrate. These conditions, such as sediment texture, organic matter content, and redox potential, are critical in shaping the health and distribution of macrozoobenthos.
The research primarily focuses on the natural ecological factors that influence river health, yet it does not fully account for the profound impact of human societal activities. For river ecosystems to thrive sustainably, both natural ecological conditions and external anthropogenic pressures must be considered. Human activities, particularly land-use changes, urbanization, and industrialization, can lead to increased pollution, altered hydrological regimes, and habitat degradation, all of which exacerbate the challenges faced by river ecosystems. Thus, achieving a harmonious balance between environmental protection and socio-economic development is paramount. In Dalian, several challenges, such as high pollutant loads, water scarcity, and sedimentation problems, hinder the health of river ecosystems. To address these issues, the following countermeasures and recommendations are proposed, incorporating both ecological restoration and human-centered solutions:
Developing Alternative Water Sources: To reduce the dependency on river water and ensure the maintenance of ecological water requirements, the development of alternative water sources is critical (Cai et al., 2023b). Unconventional water resources, such as rainwater harvesting and seawater desalination, can supplement the existing water supply. By integrating rainwater collection systems into urban infrastructure and promoting seawater desalination for non-potable uses, Dalian can diversify its water supply sources, thus reducing stress on river systems.
Enhancing Water Resource Efficiency: Increasing the efficiency of water resource use is another crucial strategy for reducing the pressure on river ecosystems (Yasmeen et al., 2023). This can be achieved by improving sewage treatment infrastructure, advancing wastewater recycling technologies, and promoting industrial water reuse. For example, municipal wastewater treatment plants should be upgraded to higher treatment standards, enabling the safe reuse of treated wastewater for irrigation and industrial processes. Furthermore, industries should be encouraged to implement closed-loop water recycling systems to minimize freshwater consumption and reduce pollutant discharge.
Scientific Pollution Management: Effective pollution management requires a data-driven approach that incorporates the ecological carrying capacity of different regions (Li et al., 2023). Implementing rational pollution discharge allocations, based on scientific research into the water environmental carrying capacity of Dalian’s rivers, can help balance ecological protection with industrial and municipal growth. This approach involves identifying the maximum pollutant load each river segment can support without compromising its ecological health. Additionally, research on the sources, types, and impacts of pollutants (e.g., nutrients, heavy metals, and microplastics) will be critical in developing targeted pollution control strategies.
In conclusion, sustainable management of river ecosystems in Dalian requires a multifaceted approach that integrates ecological, technological, and policy solutions. By focusing on both natural ecological restoration and human-centered interventions, Dalian can improve its river health while also supporting continued urban and industrial development. Through the development of alternative water sources, the promotion of water-use efficiency, and scientific pollution management, the city can address the pressing challenges facing its rivers and foster long-term ecological sustainability. Future research should continue to explore the dynamic relationship between human activities and river health, incorporating both natural and social science perspectives to inform more effective environmental management strategies.
6 Conclusion
This study investigates the health of six major rivers in Dalian City by analyzing aquatic biodiversity and key environmental factors. The research utilized multivariate analysis to identify critical factors influencing phytoplankton, zooplankton, and macrozoobenthos communities. Additionally, a comprehensive river ecosystem health evaluation system was developed, integrating baseline data and relevant research. Using entropy-weighted set pair analysis, we assessed ecological health variations across different monitoring sites, offering valuable insights into river management and biodiversity conservation.
The main conclusions are as follows:
1. A total of 168 phytoplankton species were identified in Dalian’s rivers, with Bacillariophyta (diatoms) and Chlorophyta (green algae) as the dominant taxa. The primary factors influencing phytoplankton communities were pH and dissolved oxygen, with additional effects from ammonium nitrogen, total phosphorus, biochemical oxygen demand (BOD5), and altitude.
2. A total of 110 zooplankton species were recorded, with protozoa and freshwater rotifers as the dominant groups. Key factors affecting zooplankton communities included dissolved oxygen, ammonium nitrogen, and CODMn, alongside notable influences from conductivity and altitude.
3. A total of 102 macrozoobenthos species were identified, with Tubificidae (oligochaetes) and moderately pollution-tolerant aquatic insects as dominant taxa. Dissolved oxygen, ammonium nitrogen, and total phosphorus were the main factors influencing macrozoobenthos communities.
4. Rivers at monitoring sites S12 and S15 exhibited relatively good ecological health, while sites S4, S8, and S17 were classified as Grade IV, indicating poor ecological health. Site S7 was classified as Grade V, reflecting severe pollution. Other sites were classified as Grade III, indicating borderline health status.
Despite these findings, several limitations highlight the need for further research. The study was based on a single survey, which did not account for seasonal variations. Future research should include long-term monitoring to better understand temporal dynamics. Moreover, the river health assessment model focused primarily on hydrological and environment factors and did not fully incorporate socio-economic aspects, suggesting a need for a more holistic approach in future evaluations.
Data availability statement
The original contributions presented in the study are included in the article/Supplementary Material. Further inquiries can be directed to the corresponding author.
Author contributions
JB: Writing – original draft, Writing – review & editing, Conceptualization, Funding acquisition, Methodology. TW: Data curation, Software, Validation, Writing – review & editing. TX: Data curation, Software, Validation, Writing – review & editing.
Funding
The author(s) declare financial support was received for the research, authorship, and/or publication of this article. This research was funded by the Natural Science Foundation of Jiangsu Province (BK20230174), the Foundation of Basic Science (Natural Science) research in Jiangsu Province (22KJB570008), and Wuxi University Research Start-up Fund for Introduced Talents (552424056).
Acknowledgments
We would like to extend special thanks to the editor and the reviewers for their valuable comments in greatly improving the quality of this research.
Conflict of interest
The authors declare that the research was conducted in the absence of any commercial or financial relationships that could be construed as a potential conflict of interest.
Generative AI statement
The author(s) declare that no Generative AI was used in the creation of this manuscript.
Publisher’s note
All claims expressed in this article are solely those of the authors and do not necessarily represent those of their affiliated organizations, or those of the publisher, the editors and the reviewers. Any product that may be evaluated in this article, or claim that may be made by its manufacturer, is not guaranteed or endorsed by the publisher.
Supplementary material
The Supplementary Material for this article can be found online at: https://www.frontiersin.org/articles/10.3389/fevo.2024.1533380/full#supplementary-material
References
Bandara K., Varpe Ø., Wijewardene L., Tverberg V., Eiane K. (2021). Two hundred years of zooplankton vertical migration research. Biol. Rev. 96, 1547–1589. doi: 10.1111/brv.12715
Blue B. (2018). What’s wrong with healthy rivers? Promise and practice in the search for a guiding ideal for freshwater management. Prog. Phys. Geography: Earth Environ. 42, 462–477. doi: 10.1177/0309133318783148
Bryan B. A., Gao L., Ye Y., Sun X., Connor J. D., Crossman N. D., et al. (2018). China’s response to a national land-system sustainability emergency. Nature 559, 193–204. doi: 10.1038/s41586-018-0280-2
Cai F., Hu Z., Jiang B., Ruan W., Cai S., Zou H. (2023a). Ecological health assessment with the combination weight method for the river reach after the retirement and renovation of small hydropower stations. Water 15, 355. doi: 10.3390/w15020355
Cai Y., Wu J., Shi S. Q., Li J., Kim K.-H. (2023b). Advances in desalination technology and its environmental and economic assessment. J. Cleaner Production 397, 136498. doi: 10.1016/j.jclepro.2023.136498
Chen D., Zhao Q., Jiang P., Li M. (2022a). Incorporating ecosystem services to assess progress towards sustainable development goals: A case study of the Yangtze River Economic Belt, China. Sci. Total Environ. 806, 151277. doi: 10.1016/j.scitotenv.2021.151277
Chen S. S., Kimirei I. A., Yu C., Shen Q., Gao Q. (2022b). Assessment of urban river water pollution with urbanization in East Africa. Environ. Sci. pollut. Res. 29, 40812–40825. doi: 10.1007/s11356-021-18082-1
Ding R., Yu K., Fan Z., Liu J. (2022). Study and application of urban aquatic ecosystem health evaluation index system in river network plain area. IJERPH 19, 16545. doi: 10.3390/ijerph192416545
Dong M., Liu M., Yin L., Zhou J., Sun D. (2022). Concept and practices involved in comprehensive river control based on the synergy among flood control, ecological restoration, and urban development: A case study on a valley reach of luanhe river in a semiarid region in north China. Water 14, 1413. doi: 10.3390/w14091413
Guimarães L. F., Teixeira F. C., Pereira J. N., Becker B. R., Oliveira A. K. B., Lima A. F., et al. (2021). The challenges of urban river restoration and the proposition of a framework towards river restoration goals. J. Cleaner Production 316, 128330. doi: 10.1016/j.jclepro.2021.128330
Islam S. T., Rahman S. H., Matin M. A., Dey A., Talukder B., Sanyal N., et al. (2024). State of the world’s rivers. Annu. Rev. Environ. Resour. 49, 137–162. doi: 10.1146/annurev-environ-111022-020951
Kholodkevich S. V. (2024). Brief overview of methods for assessing the health of aquatic ecosystems. Problems and prospects of development. Inland Water Biol. 17, 830–844. doi: 10.1134/S1995082924700500
Li X., Meng X., Ji X., Zhou J., Pan C., Gao N. (2023). Zoning technology for the management of ecological and clean small-watersheds via k-means clustering and entropy-weighted TOPSIS: A case study in Beijing. J. Cleaner Production 397, 136449. doi: 10.1016/j.jclepro.2023.136449
Lin S. (2023). Phosphate limitation and ocean acidification co-shape phytoplankton physiology and community structure. Nat. Commun. 14, 2699. doi: 10.1038/s41467-023-38381-0
Liu G.-W., Dai C.-L., Shao Z.-X., Xiao R.-H., Guo H.-C. (2024). Assessment of ecological flow in hulan river basin utilizing SWAT model and diverse hydrological approaches. Sustainability 16, 2513. doi: 10.3390/su16062513
Liu X., Chen L., Zhang G., Zhang J., Wu Y., Ju H. (2021). Spatiotemporal dynamics of succession and growth limitation of phytoplankton for nutrients and light in a large shallow lake. Water Res. 194, 116910. doi: 10.1016/j.watres.2021.116910
Meng L., Chen Y., Li W., Zhao R. (2009). Fuzzy comprehensive evaluation model for water resources carrying capacity in Tarim River Basin, Xinjiang, China. Chin. Geogr. Sci. 19, 89–95. doi: 10.1007/s11769-009-0089-x
Rattan K. J., Corriveau J. C., Brua R. B., Culp J. M., Yates A. G., chambers P. A. (2017). Quantifying seasonal variation in total phosphorus and nitrogen from prairie streams in the Red River Basin, Manitoba Canada. Sci. Total Environ. 575, 649–659. doi: 10.1016/j.scitotenv.2016.09.073
Raven J. A., Beardall J. (2021). Influence of global environmental Change on plankton. J. Plankton Res. 43, 779–800. doi: 10.1093/plankt/fbab075
Rowiński P. M., Okruszko T., Radecki-Pawlik A. (2022). Environmental hydraulics research for river health: recent advances and challenges. Ecohydrology Hydrobiology 22, 213–225. doi: 10.1016/j.ecohyd.2021.12.003
Stefanidis K., Karaouzas I., Oikonomou A., Smeti E., Kouvarda T., Latsiou A., et al. (2023). Geodiversity as a potential indicator of stream health in ecological quality assessment systems. Ecohydrology 16, e2551. doi: 10.1002/eco.2551
Vollmer D., Regan H. M., Andelman S. J. (2016). Assessing the sustainability of freshwater systems: A critical review of composite indicators. Ambio 45, 765–780. doi: 10.1007/s13280-016-0792-7
Vugteveen P., Leuven R. S. E. W., Huijbregts M. A. J., Lenders H. J. R. (2006). Redefinition and elaboration of river ecosystem health: perspective for river management. Hydrobiologia 565, 289–308. doi: 10.1007/s10750-005-1920-8
Wang G., Xiao C., Qi Z., Lai Q., Meng F., Liang X. (2022). Research on the exploitation and utilization degree of mineral water based on ecological base flow in the Changbai Mountain basalt area, northeast China. Environ. Geochem Health 44, 1995–2007. doi: 10.1007/s10653-021-00865-7
Withers P. J. A., Jarvie H. P. (2008). Delivery and cycling of phosphorus in rivers: A review. Sci. Total Environ. 400, 379–395. doi: 10.1016/j.scitotenv.2008.08.002
Wu C., Gao P., Zhou J., Fan X., Xu R., Mu X. (2024). Fuzzy evaluation and obstacle factors of urban ecological health changes in the Wei River Basin, northwest China. Ecol. Processes 13, 50. doi: 10.1186/s13717-024-00529-1
Yang R., Chen Y., Qiu Y., Lu K., Wang X., Sun G., et al. (2023). Assessing the Landscape Ecological Health (LEH) of Wetlands: Research Content and Evaluation Methods (2000–2022). Water 15, 2410. doi: 10.3390/w15132410
Yasmeen R., Hao G., Ye Y., Shah W. U. H., Tang C. (2023). The synergy of water resource agglomeration and innovative conservation technologies on provincial and regional water usage efficiency in China: A super SBM-DEA approach. Water 15, 3524. doi: 10.3390/w15193524
Yi M., Li L., Li H., Liu C., Deng Y., Wu Z., et al. (2024). Spatiotemporal variations of plankton communities in different water bodies of the Yellow River: Structural characteristics, biogeographic patterns, environmental responses, and community assembly. J. Hydrology 640, 131702. doi: 10.1016/j.jhydrol.2024.131702
Yu H., Shi X., Zhao S., Sun B., Liu Y., Arvola L., et al. (2022). Primary productivity of phytoplankton and its influencing factors in cold and arid regions: A case study of Wuliangsuhai Lake, China. Ecol. Indic. 144, 109545. doi: 10.1016/j.ecolind.2022.109545
Zhang S., Han G., Gao X. (2023). The urbanization impacts on potentially toxic metals: the distribution, sources and contamination risks in river situated in typical megacity, China. Sustain. Cities Soc. 97, 104784. doi: 10.1016/j.scs.2023.104784
Zhang J., Xiang J., Ma Q., Li C., Xu X. (2024). Water ecological health evaluation of urban river: a case study of Zaogang River, China. Front. Ecol. Evol. 12. doi: 10.3389/fevo.2024.1478024
Keywords: river health, biodiversity, aquatic ecosystems, Dalian City rivers, biodiversity conservation
Citation: Bu J, Wang T and Xu T (2025) River health assessment based on set pair analysis model in typical Northern Chinese City. Front. Ecol. Evol. 12:1533380. doi: 10.3389/fevo.2024.1533380
Received: 23 November 2024; Accepted: 18 December 2024;
Published: 08 January 2025.
Edited by:
Celso Santos, Federal University of Paraíba, BrazilReviewed by:
Yakui Ding, Jiangsu University, ChinaHuawei Li, North China University of Water Resources and Electric Power, China
Copyright © 2025 Bu, Wang and Xu. This is an open-access article distributed under the terms of the Creative Commons Attribution License (CC BY). The use, distribution or reproduction in other forums is permitted, provided the original author(s) and the copyright owner(s) are credited and that the original publication in this journal is cited, in accordance with accepted academic practice. No use, distribution or reproduction is permitted which does not comply with these terms.
*Correspondence: Jiuhe Bu, YnVqaEBjd3h1LmVkdS5jbg==