 Ivan Vlašiček
 Daniela Marić Pfannkuchen*
 Mirta Smodlaka Tanković
 Ana Baričević
 Nataša Kužat
 Mia Knjaz
 Lana Grižančić
 Ivan Podolšak
 Tjaša Kogovšek
 Martin Pfannkuchen
- Laboratory for Evolutionary Ecology, Ruđer Bošković Institute, Center for Marine Research, Rovinj, Croatia
The Northern Adriatic is a dynamic and the most productive part of the Adriatic Sea. The phytoplankton of the Northern Adriatic is, as many studies in this area showed, under heavy influence of freshwater inputs and anthropogenic pressures. Cluster analysis of a more than 20 year phytoplankton data set across steep spatio-temporal, ecological gradients on a longitudinal transect across the northern Adriatic, allowed us to identify significant and reoccurring phytoplankton species assemblages. Those phytoplankton clusters show stable seasonality and relation to environmental conditions and are presumed to be cornerstones of important ecosystem services provided by phytoplankton. Our results demonstrate that the stable seasonality of important phytoplankton clusters is disrupted, leading to a destabilisation of seasonal patterns in the biodiversity of primary producers. During the last 20 years, clusters characterised by dominating species were replaced by clusters characterised by the coexistence of several species. Overall the frequency of dense blooms of single species appears to decline. Multivariate analysis showed that possible reasons might lie in oligotrophication and increased salinity dynamics. Our results suggest the importance and applicability of cluster analysis in taxon based biodiversity long term data sets to elucidate functional biodiversity changes.
1 Introduction
The northern Adriatic (NA) is the northernmost part of the Mediterranean Sea. It is a rather shallow sea area with depths of up to around 60 m. Due to its dense coastal population, it has been under immense anthropogenic influence(s), such as millennia of (over)exploitation of natural resources, industrial activities, intense marine traffic and land runoff (Coll et al., 2012; Worm et al., 2009).
The NA is the receiving basin for the second largest riverine freshwater input into the Mediterranean, the river Po (Ivančić and Degobbis, 1987; Giani et al., 2012, 2023). Natural and anthropogenic eutrophication trends have been intensely studied and described (Degobbis et al., 2000; Djakovac et al., 2012). Marine circulation patterns are mainly driven by meteorological drivers and coastal configurations. Circular current patterns regularly form a separate water body in the northern Adriatic with prolonged retention times in the area and freshwater influence from the river Po regularly reaches across the entire basin (Russo et al., 2005; Hopkins et al., 1999). Winter conditions regularly mix the entire water column and they form cold, dense, oxygen and nutrient rich water that feeds the deeper waters of the southern Adriatic through density induced water currents (Bergamasco et al., 1999; Vilibić, 2003). Large freshwater inputs and the intricate circulation patterns in the area generate a highly dynamic ecosystem with steep spatio-temporal ecological gradients across e.g. nutrient concentrations, salinity, temperature etc. The basin as such is a highly productive area where primary production sustains a rich food network and dense populations of pelagic commercial fish, which underlines the importance of the qualitative aspects of primary production (Cibic et al., 2022; Mozetič et al., 2012). Microphytoplankton as the main primary producer in the NA is largely dominated by Diatoms (Bacillariophyta) (Fuks et al., 2012; Marić et al., 2012). While highly productive, the northern Adriatic is a mainly phosphate limited system (Ivančić et al., 2016). Anthropogenic phosphate inputs generated further eutrophication and regulatory efforts to reduce these inputs were undertaken during the end of the last century. Several studies investigated the effects of those efforts on the planktonic ecosystem of the NA and changes, including regime shifts, have been described around the turn of the century (Marić et al., 2012). The phytoplankton of the Adriatic Sea has been intensely studied during the last 50 years. Species inventories as well as inventories of genetic diversity in phytoplankton are readily available and show its connectivity with the entire Mediterranean as well as capability to sustain regional populations through its water current systems (Grižančić et al., 2023; Viličić et al., 2002). Many studies in the area concern the succession of phytoplankton communities in the yearly cycle, the ecology of selected species, the use of phytoplankton analyses in ecological monitoring or the description of biodiversity and species as such (Godrijan et al., 2013; Bernardi Aubry et al., 2006; Cerino et al., 2019). In recent years, the availability of affordable computational power allowed for the application of more complicated analysis of the structure of phytoplankton over larger datasets. Time series datasets on phytoplankton typically include information across several years to decades. The underlying sampling regime includes one or more sampling positions to cover the area of interest or an interesting ecological gradient, and the information includes relative or absolute abundances of typically hundreds of species or taxa. Recent research focused on the identification of trait based guilds within the phytoplankton communities examined. Guilds were identified by physiological or morphological traits (Vadrucci et al., 2007). More recent research performed network analyses (Neri et al., 2023) and cluster analysis (Vascotto et al., 2021, 2024) to elucidate structure in the observed datasets through the application of statistical analyses on biodiversity datasets. Those approaches set out to define clusters of phytoplankton species that are defined by co-appearance and might be indicative for certain sets of ecological conditions. Cluster analyses of a 26 year dataset from the gulf of Naples clustered phytoplankton species on the base of their temporal distribution (Zingone et al., 2023). Clusters showed distinct seasonalities and similarities in morphological traits appeared independent from the clustering. However, the cluster analysis resulted in the identification of distinct species assemblages with predictable/stable temporal distribution at the observed station. A similar analysis has been performed on a 12 year dataset on the temporal distribution of phytoplankton at a station in the Gulf of Trieste in the northern Adriatic Sea. Samples were clustered on the base of their respective community structure and characteristic species for the respective clusters were identified. The identified clusters showed stable seasonality and delivered a deeper insight into the structure of the observed coastal phytoplankton succession (Vascotto et al., 2021). Also, within the northern Adriatic Sea a cluster analysis of a 12 year data set of phytoplankton community composition at 2 stations 100 km apart was analysed to study the relation of the temporal distribution of the observed phytoplankton clusters with abiotic environmental factors at mesoscale. The results indicated a significant intrinsic periodicity in the temporal dynamics of the observed phytoplankton clusters (Vascotto et al., 2024). An analysis of phytoplankton from two stations just south of the northern Adriatic Sea under heavy influence of the Po river freshwater input into the Adriatic confirmed the periodicity of the observed clusters and could demonstrate significant differences in observed clusters between near-shore and off-shore stations, which the authors attributed to the differences in trophic conditions and the severity of freshwater influences (Neri et al., 2023). In the aforementioned report a 31 year dataset on phytoplankton was clustered seasonally and the seasons were characterised by significant species for the respective clusters.
We can conclude at the moment that stable, periodically reappearing phytoplankton clusters were identified for three coastal positions and one more offshore position that can characterise the north-eastern, north-western and south-eastern extremes of the northern Adriatic Sea. However, no information is currently available for the central part of the Northern Adriatic, where the water body of the NA is formed by large-scale gyres (Cushman-Roisin et al., 2001). Also, there are some reports about decline of predictability in the phytoplankton community where it is noticed that phytoplankton blooms occur more sporadically (Vascotto et al., 2021, 2024; Skejić et al., 2024; Totti et al., 2019).
Ecosystem services provided by phytoplankton are considered to be of particular importance and range from oxygen production and primary production over their influence on a large range of biogeochemical cycles to food web structuring (Naselli-Flores and Padisák, 2023). Phytoplankton clusters or reoccurring assemblages of phytoplankton species might well be a key feature in the provision of phytoplankton ecosystem services and the nature of the respective services provided is largely determined by the species composition.
Our goal in this report is the characterisation of the phytoplankton community using cluster analysis resulting in spatio-temporal maps of clusters. We hypothesise that clusters are under the influence of environmental parameters such as nutrient concentration, temperature, salinity, length of day and phosphorus limitation.
To this effect we furthermore compare clusters recovered from nearby regions with the phytoplankton clusters as recovered from a two decades dataset from a transect across the central northern Adriatic, spanning steep ecological gradients from the river Po mouth to the western Istrian coast with a particular focus on the persistence and stability of the periodicity of the respective clusters.
2 Materials and methods
2.1 Sampling
Seawater for all following analyses was sampled from the year 2000 to the end of year 2023 using Niskin samplers. In most cases sampling depths were 0 m, 5 m, 10 m, 20 m and bottom depth. Seawater was sampled on 4 stations along a longitudinal transect across the northern Adriatic Sea at the following stations: RV001 (lat = 45° 5’ N, lon = 13° 36’ E), SJ107 (lat = 45° 3’ N, lon = 13° 19’ E), SJ101 (lat = 44° 60’ N, lon = 12° 50’ E), SJ108 (lat = 44° 45’ N, lon = 12°45’ E). See Figure 1 for the map of study area and sampling station.
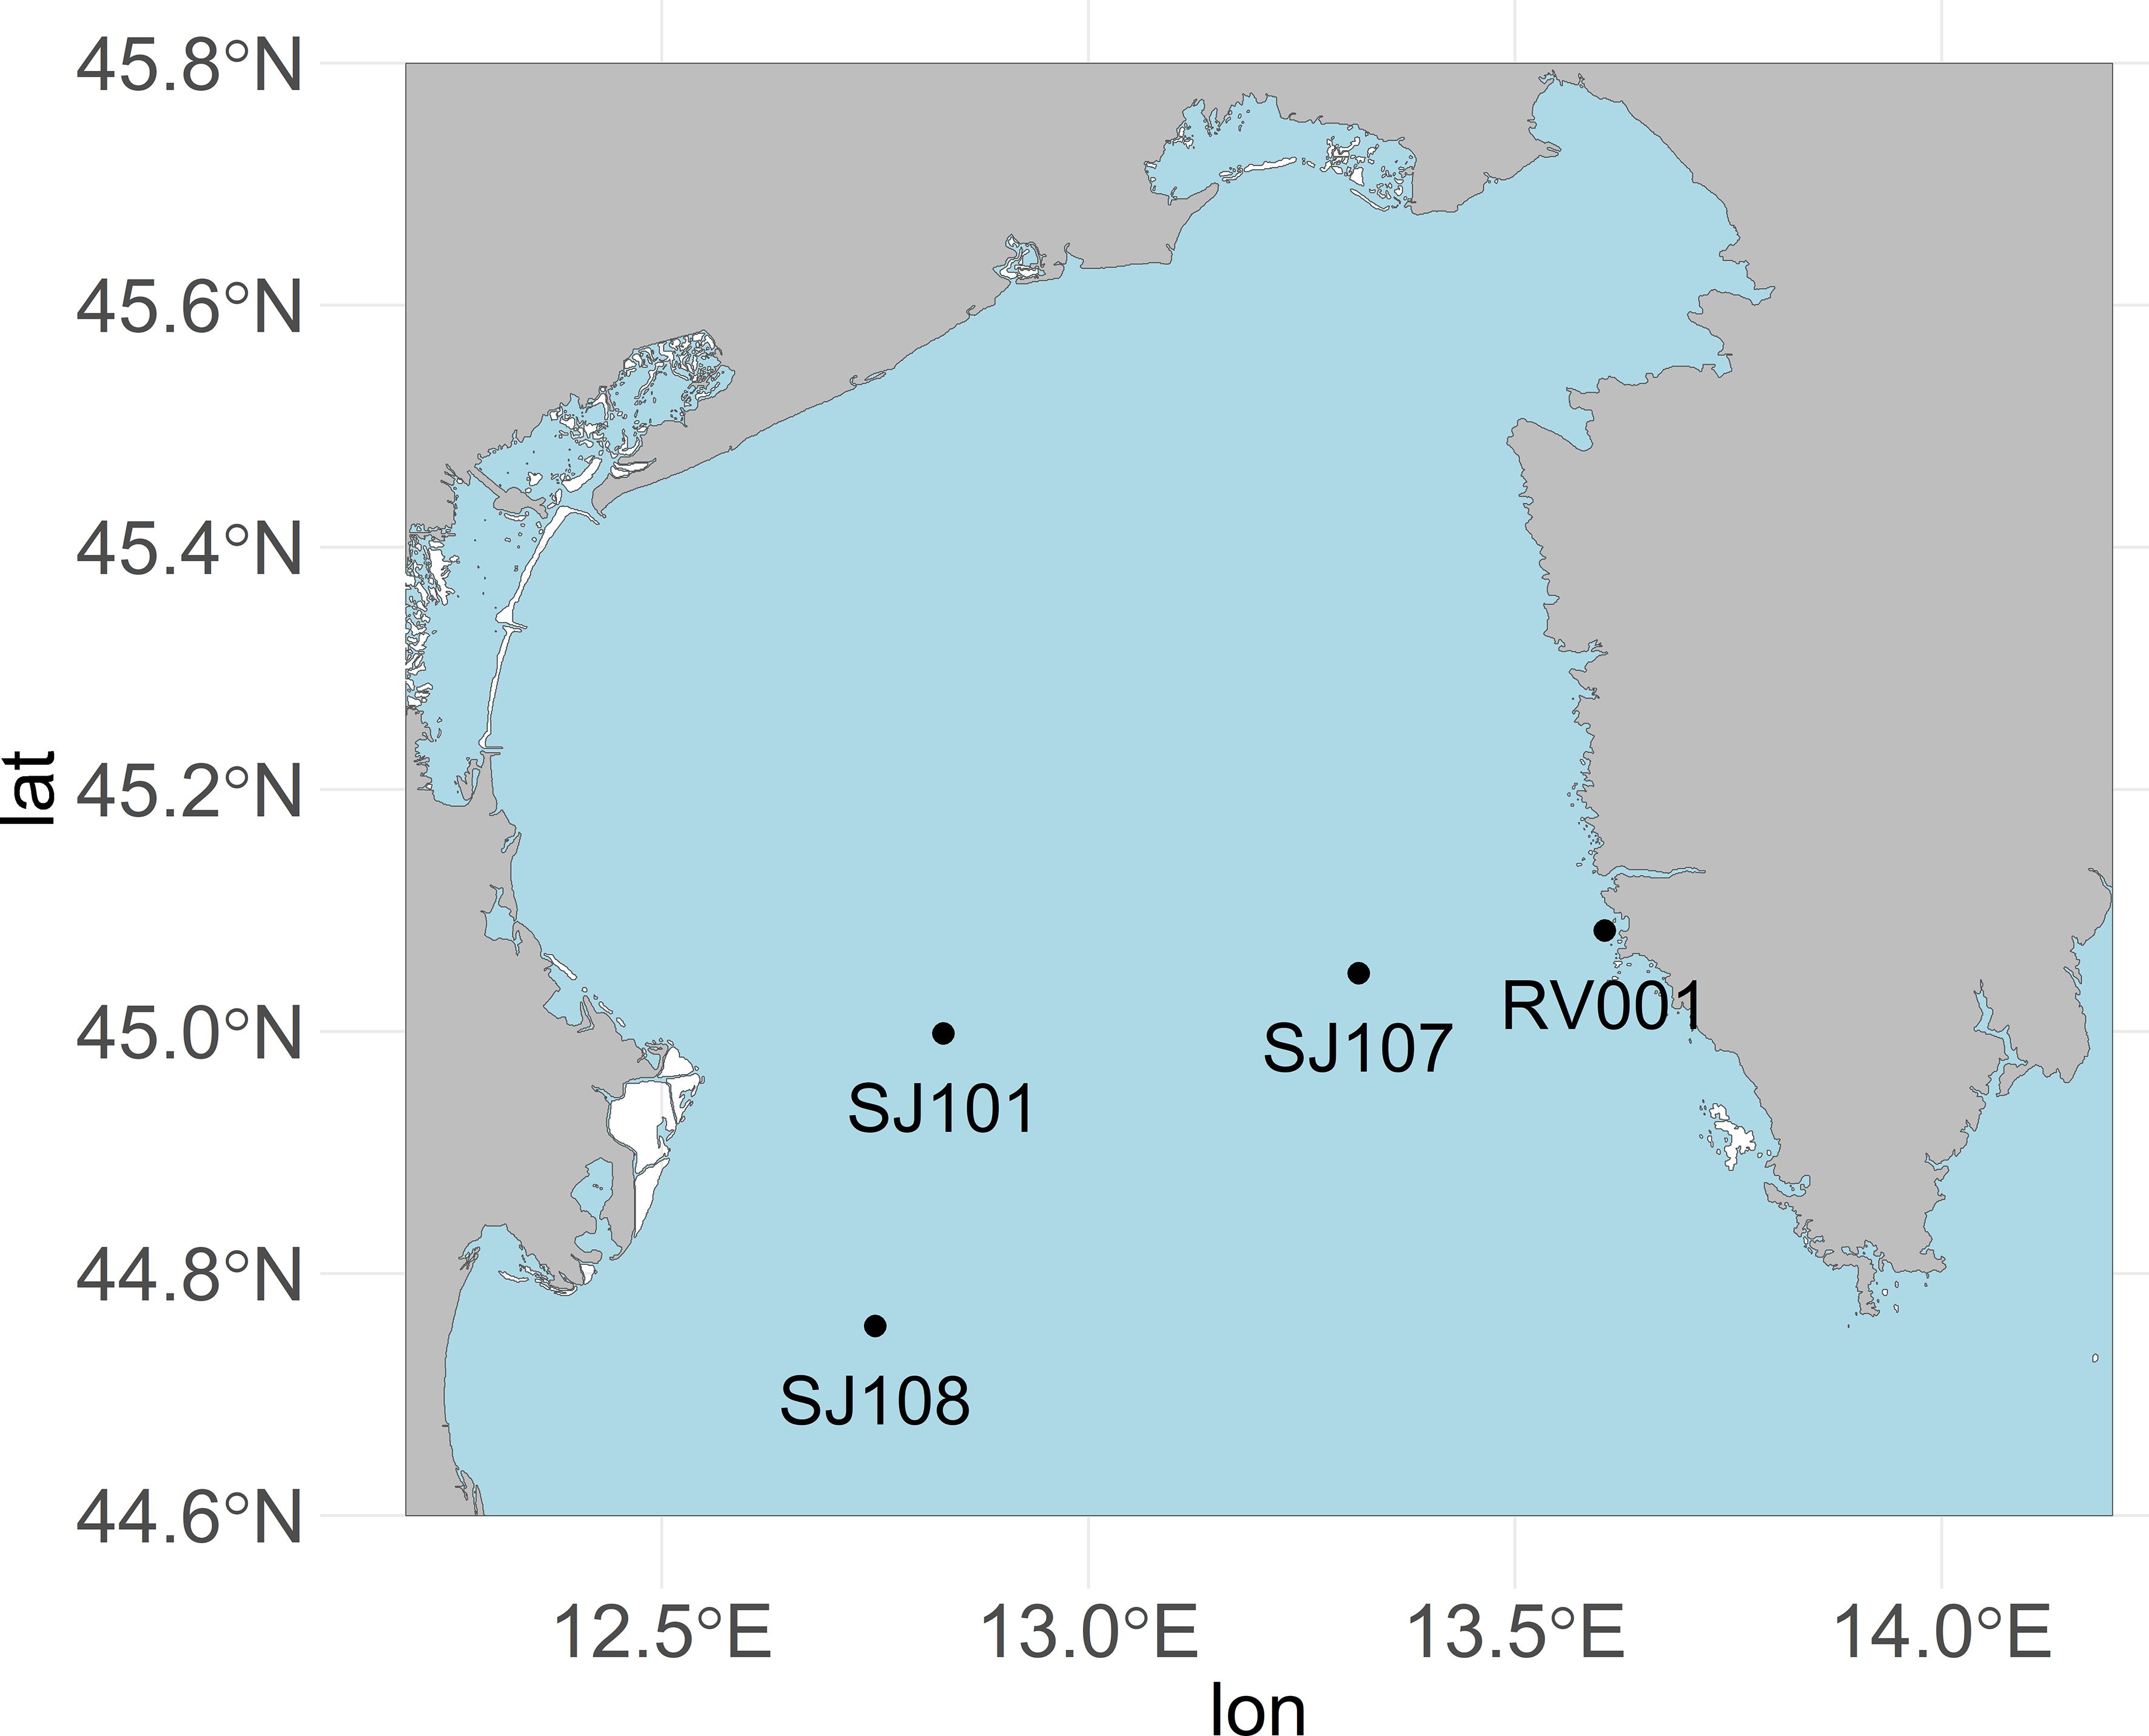
Figure 1. Map of the study area and the sampling stations.
Conductivity–temperature–depth (CTD) measurements and oxygen were recorded with an SBE 25 Sealogger CTD probe (Sea-Bird Electronics, Inc., Bellevue, Washington, USA). Nutrient concentrations (nitrate: [NH4]+, nitrite: [NO2]− ammonium: [NH4]+, orthophosphate: [PO4]3− and orthosilicate: SiO4−) were analysed aboard immediately after sample collection by spectrophotometric methods as described earlier (Ivančič and Degobbis, 1984; Parsons et al., 1984) on a Cecil CE 2040 spectrophotometer until the end of 2004 and with a Shimadzu UV-1800 model afterwards. The method accuracies for [NO3]−, [NO2]−, [NH4]+, [PO4] 3− i SiO4− were ±3%, ± 3%, ± 5%, ± 3%, and ±6%, respectively, and detection limits were 0.05 μmol L−1, 0.01 μmol L−1, 0.1 μmol L−1, 0.02 μmol L−1, and 0.05 μmol L−1, respectively. The calibrations were carried out following (Strickland, 1968). All data is stored in the Center for Marine research database.
2.2 Phytoplankton microscopic analysis
Samples for phytoplankton analysis were collected with Niskin bottles and prefiltered (300 µm mesh size), before 200 mL of subsample was fixed with neutralised formaldehyde (2% final concentration). Volumes of 50 mL of the total volume (or smaller) were sedimented in sedimentation chambers for 48 h and counted using Utermöhl’s method (Utermöhl, 1958) on a Zeiss AxioObserver inverted microscope equipped with phase-contrast, differential interference contrast (DIC) and bright field optics. Various transects on the chambers were inspected at 400×, 200× and 100x total magnification. Microphytoplankton was separated from nanophytoplankton (< 20 µm) (Sieburth et al., 1978). Cells were determined to the highest possible taxonomic rank following the identification guides. All data is stored in the Center for Marine research database.
2.3 Community analysis
The phytoplankton dataset (3464 samples) was presented as a species abundances over samples matrix. Abundances were transformed into relative abundances per sample in order to harmonise the dataset. Bray–Curtis similarity [function “vegdistance” from R package “vegan” (Oksanen et al., 2022)] for each sample was calculated from this matrix in order to perform a hierarchical clustering (Ward’s method) [Q-mode, or clustering of sites based on relative abundances of species (Legendre and Legendre, 2014)]. After inspecting the obtained dendrogram, a representative number of definite clusters was determined. A threshold of 5 of the overall tree height resulted in 8 well defined clusters with more than double between cluster distances than within cluster distances. For each cluster, silhouette scores [R package “cluster” (Maechler et al., 2022)] were calculated in order to filter strongly defined clusters (threshold of 0.4). Final samples were assigned to their respective clusters and most frequent species and species with highest max abundance were identified in clusters. Ratios between strongly defined clusters and others were calculated in order to show predictability of the phytoplankton community.
A chi-squared test (χ2 test) was used to test the difference in cluster occurrence before and after 2009. 2009 was set as the threshold after inspecting clustering results and different clusters were observed before and after this year. To check if sampling frequency influenced the difference, a random subsamples from both periods were created and tested as well to confirm the difference.
Significant IndVal scores were calculated using original data (absolute abundances), and definite clusters from hierarchical clustering were used as a grouping variable [R package: “labdsv” (Roberts, 2019)] IndVals were calculated in each cluster according to the following formula:
where IndVal is the indicator value of species i in cluster j. Ninidividualsij is the mean number of individuals of species i in the cluster of samples j. Ninidividualsi is the sum of the mean number of individuals of species i in all clusters. Aij is a measure of specificity. Nsamplesij is the number of samples in cluster j where species i is present while Nsamplesj is the number of samples in cluster j. Bij represents fidelity. This index is chosen due to its insensitivity to size of clusters and differences in abundances in samples within clusters (Dufrene and Legendre, 1997).
Clusters from the previous analysis were used as grouping variables in the analysis of diversity indices. Number of species (S), Shannon index (H’) (Shannon, 1948), Simpson’s index (D), (Simpson, 1949) and Pielou’s index (J) (Pielou, 1966) were calculated using the R package “vegan” (Oksanen et al., 2022).
Environmental parameters (temperature, salinity, O2, [NO3]−, [NO2]−, [NH4]+, [PO4]3− and SiO4−) were used as independent variables in canonical correspondence analysis (CCA) using R package “vegan” (Oksanen et al., 2022). Clusters were used to highlight groups and to investigate their relation with environmental parameters. Kruskal–Wallis test was used in order to test if mean values of environmental parameters are significantly (p < 0.05) different between clusters. Differences between each cluster are confirmed with Dunn’s post-hoc test (Ogle et al., 2025).
Ratios between total inorganic nitrogen ([NO3]− + [NO2]− + [NH4]+) and inorganic phosphorus ([PO4]3−) in all samples were calculated to check if this ratio exceeded the Redfield ratio, molar ratio = N:P = 16 (Redfield et al., 1963). One sample t-test was used to test if N:P ratios in samples assigned to certain clusters exceeded the Redfield ratio.
3 Results
3.1 Dataset
We analysed samples from 4 stations (RV001, SJ107, SJ101, SJ108) along a transect across the central part of the NA (45°5’0.48’’ N, and from 13°36’18’’ E to 12°45’00 E). The dataset spans over/across 23 years: from the year 2000 to the year 2023.
In 3340 samples 399 taxa were identified to the lowest taxonomic level possible using light microscopy. 168 diatom (Bacillariophyceae), 184 dinoflagellate (Dinophyceae), 28 Prymnesiophyceae (with coccolithophores), 6 Dictyochophyceae, 3 Chrysophyceae, 3 Euglenoidea and 3 Thecofilosea (ebriids), 2 Xanthophyceae, 1 Chlorophyceae and 1 Raphydophyceae taxa were found in our dataset. The most frequently found taxa were the diatoms Pseudo-nitzschia sp. Peragallo, 1900, undetermined pennate diatoms, Cerataulina pelagica Ehrenberg, 1834, Thalassionema nitzschioides (Grunow) Mereschkowsky, Dactyliosolen fragilissimus (Bergon) Hasle, 1996 and Proboscia alata (Brightwell) Sundstrom, 1986. The most frequent dinoflagellates were Tripos fusus (Ehrenberg) F.Gomez, 2013 and Gymnodinium sp. Syracosphaera pulchra Lohmann, 1902 was the most frequent coccolithophore. Species which reached top abundances (maximum abundances of certain species) were Skeletonema sp. R.K. Greville, 1865, Pseudo-nitzschia sp., Chaetoceros socialis H.S.Lauder, 1864 and Cerataulina pelagica (Supplementary Table S2).
3.2 Phytoplankton clusters in the northern Adriatic
In our 23 year data set we identified 8 strongly defined clusters that characterise the phytoplankton community of the central NA. Each cluster showed different significant indicator species based on IndVal. Clusters are named after the taxon with the highest IndVal score: Asterionellopsis glacialis (Castracane) Round, 1990, Cerataulina pelagica, Chaetoceros curvisetus Cleve, 1889, Chaetoceros sp. C.G. Ehrenberg, 1844, Cyclotella sp. (F.T. Kutzing) A. de Brebisson, 1838, Pseudo-nitzschia sp., Skeletonema sp. and Thalassionema nitzschioides. Supplementary Figure S1 shows all samples, including samples which are not assigned to strongly defined clusters. We found an Asterionellopsis glacialis cluster in our dataset during winter in 2002, 2005 and 2009. Its last occurrence was recorded in 2017 and thereafter this cluster was not present in samples anymore. Other indicator species in this cluster include Chaetoceros compressus Lauder, 1864, Chaetoceros atlanticus Cleve, 1873 and Leptocylindrus sp. Petersen, 1889. The cluster Cerataulina pelagica was recorded in the first decade of the analysed dataset. This cluster was present in late spring and summer months. Other species with high IndVal in this cluster are Prorocentrum micans Ehrenberg, 1834, Proboscia alata and Tripos fusus. Cerataulina pelagica cluster was found as an important cluster during the first years of the investigated period (until 2004). A third cluster, named Chaetoceros socialis, was recorded in samples after 2014. In 2022, on the RV001 station, this cluster was shown highly important since it persisted on that location for 4 months. This cluster is an almost exclusively autumn assemblage, and is characterised by the highest number of other indicator species, some of them are Chaetoceros lauderi Ralfs, 1864, Chaetoceros tortissimus Gran, 1900 and Guinardia striata Hensen, 1911. This cluster was also absent in our dataset after the early 2000s. The Cyclotella sp. cluster started to appear in samples after 2010, mostly in spring months. Other indicator species include dinoflagellates and coccolithophores like Heterocapsa sp. Massart, 1920, Ophiaster sp. Gran, 1912 and more. The Pseudo-nitzschia sp. cluster, characterised only by the genus after which it is named, was mostly recorded at the station SJ107, positioned in the middle of the NA sampling transect. This cluster showed peaks in different times of year, most notably early winter and then occasional peaks in spring and main peaks which begin in late summer and last through autumn. The cluster Skeletonema sp. increases its occurrence westwards with the highest abundances on the western extremes of the transect. This cluster decreased in frequency of occurrence over time and showed a typical bimodal seasonality, with the main peak in winter. Few other species were also characteristic for this cluster like Thalassiosira sp. Hasle, 1973 and Ditylum brightwelli (T.West) Grunow, 1885. The Thalassionema nitzschioides cluster appeared in samples after 2015, in June and July. In this assemblage, Prorocrentrum compressum (Bailey) T.H.Abe ex J.D.Dodge, 1975, Alexandrium sp. Halim, 1960 and Prorocentrum cordatum (Ostenfeld) J.D.Dodge, 1976 were other indicator species.
In all clusters, taxa with highest IndVal score in their corresponding cluster (Supplementary Table S1) also reached maximum abundances (Supplementary Table S2) and frequencies of occurrence (Supplementary Table S3) as well, thus confirming their status as characteristic taxa for their cluster. Figure 2 shows the spatio-temporal distribution of the above mentioned clusters recorded in the dataset between the years 2000 and 2023. A clear qualitative and quantitative difference of cluster observations between the years before 2009 and the years after 2009 appears visible (p < 0.05, χ2 test).
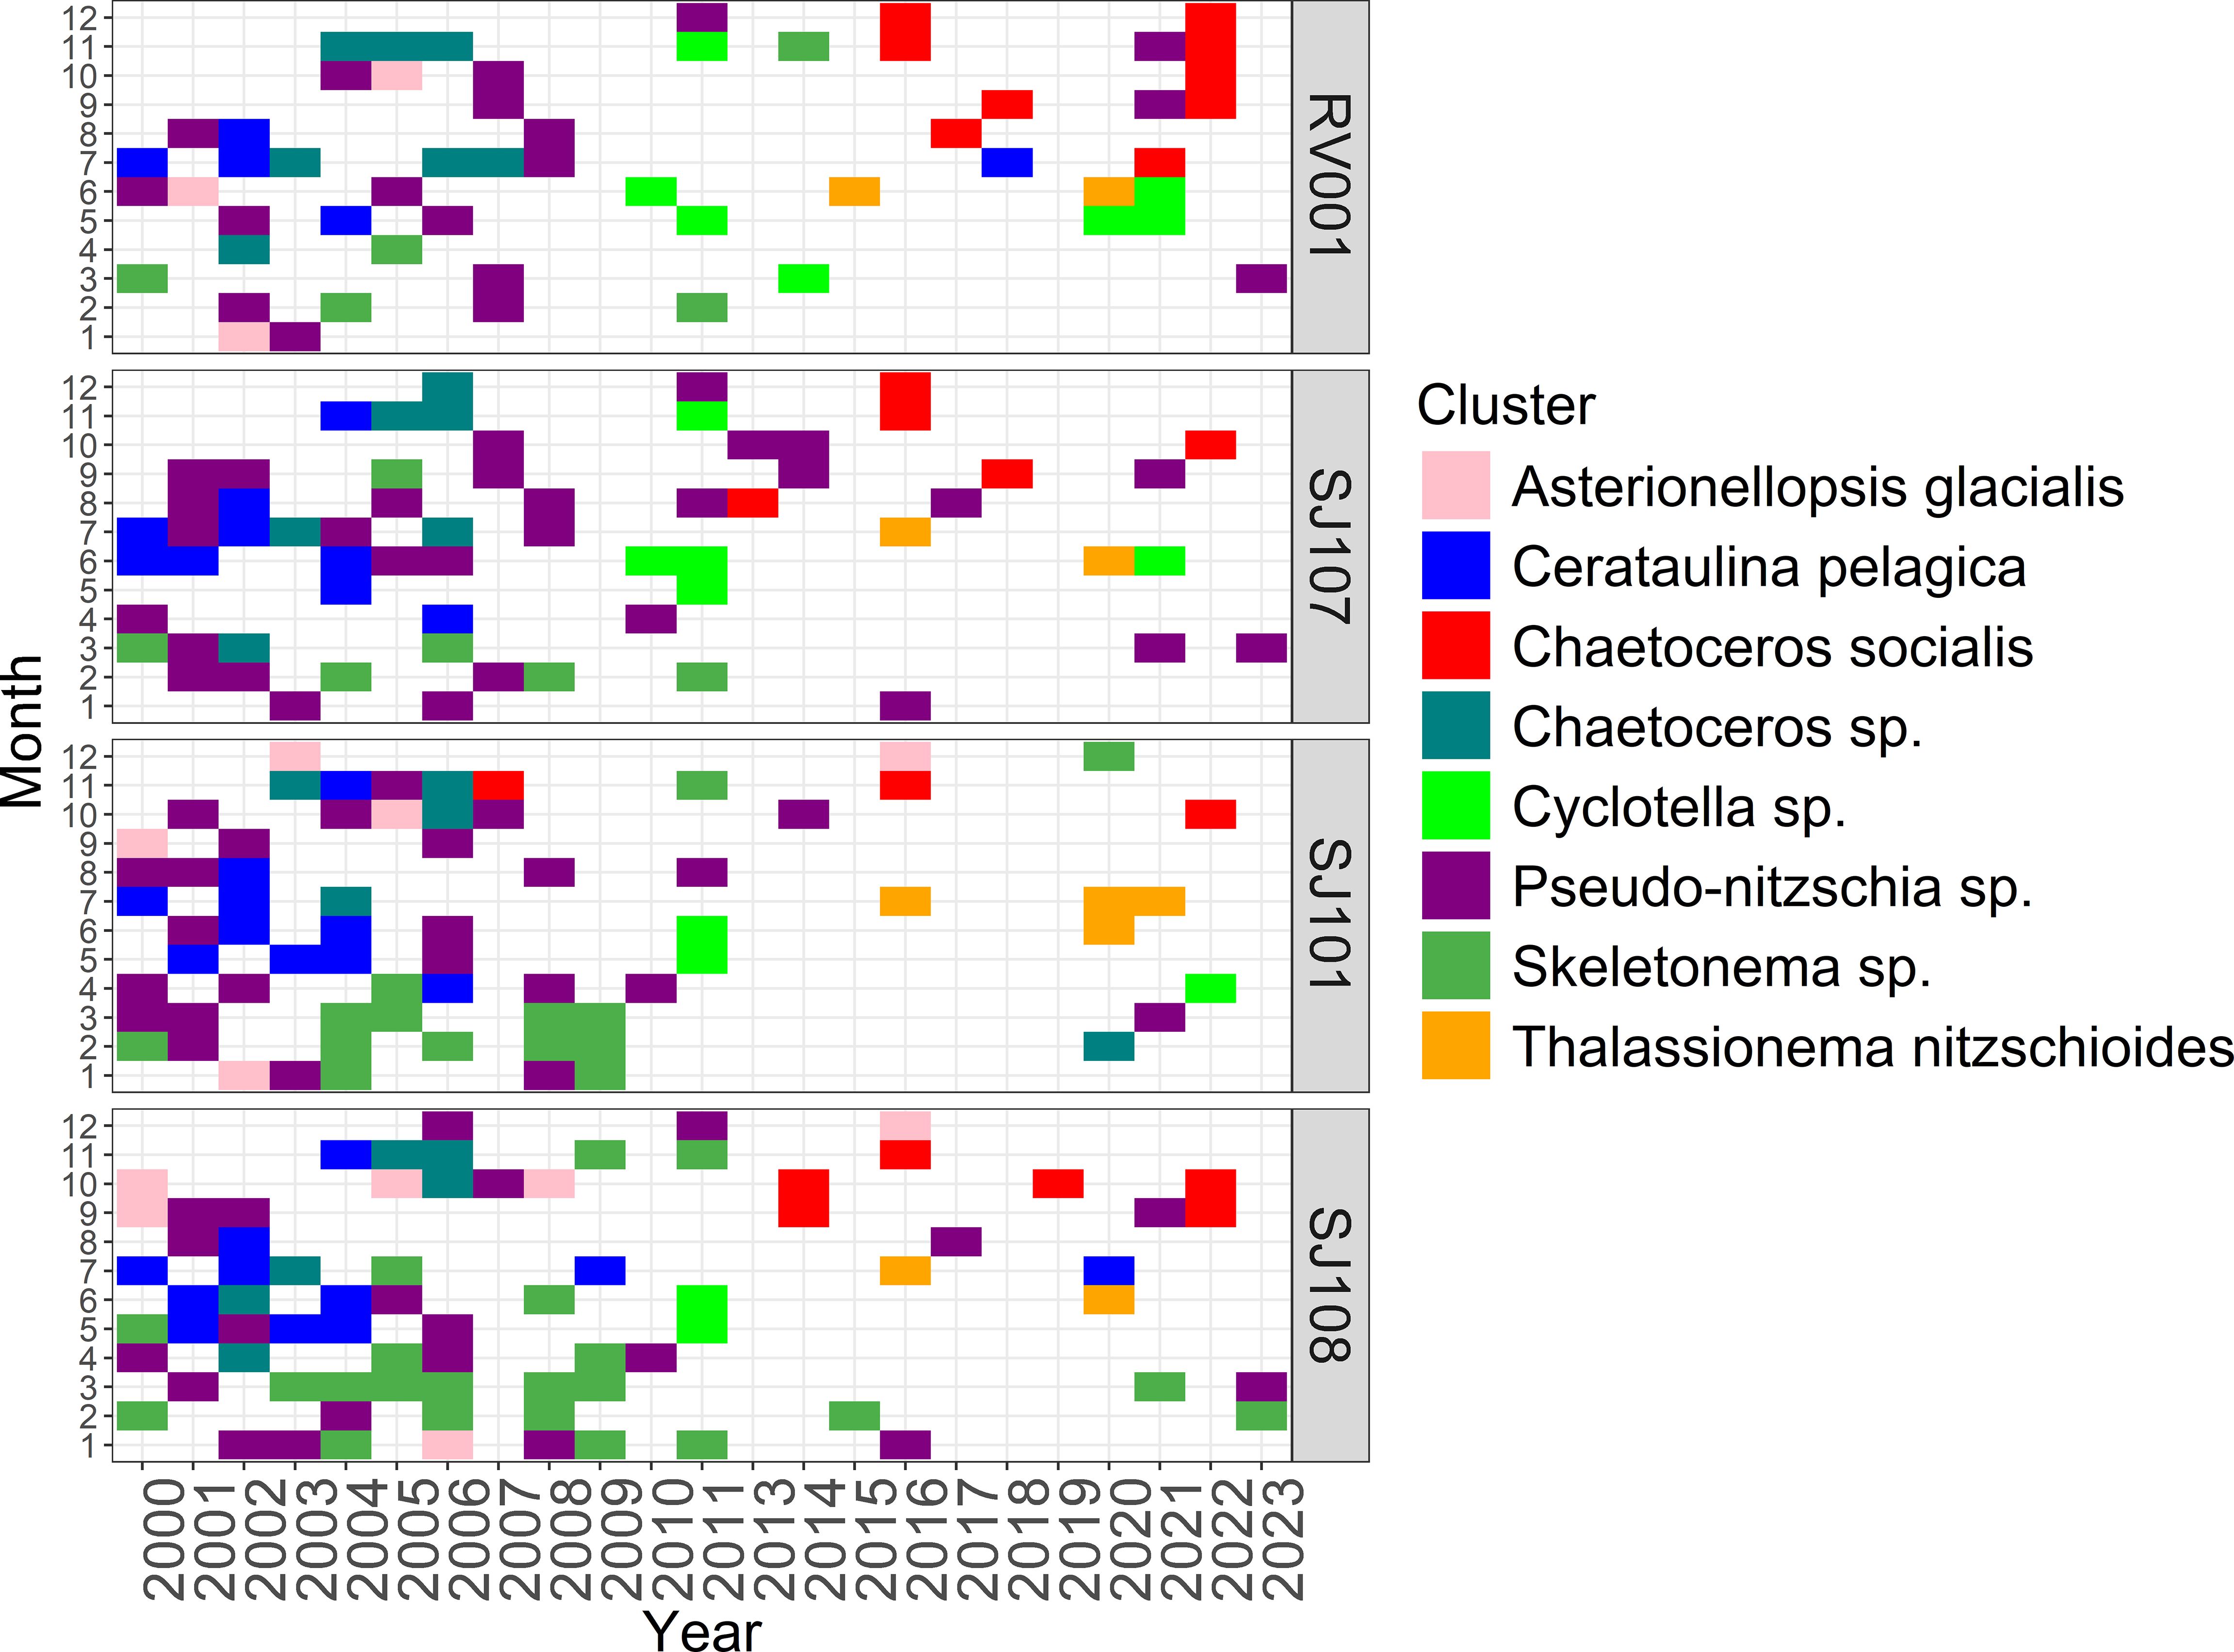
Figure 2. Most frequent clusters per month and year. Only samples assigned to clusters are shown here.
3.3 Phytoplankton seasonality and spatial distribution
To further detail the seasonality and regularity of succession of the identified phytoplankton clusters, relative occurrence of the observed clusters per month was analysed (Figure 2). A clear and distinct seasonality for Asterionellopsis glacialis, Cerataulina pelagica, Chaetoceros socialis, Cyclotella sp. and Thalassionema nitzschioides clusters was observed (Figure 2). In both Figure 2 and Supplementary Figure S1 clear differences in succession patterns are visible before and after 2009, therefore marking a potential regime shift.
To further detail the spatial distribution of the observed clusters across the analysed longitudinal transect across the NA (see Figure 1) are shown in Figure 3 with the relative occurrence of clusters at the stations SJ108, SJ101, SJ107 and RV001 (from west to east, e.g. with increasing distance from the largest freshwater input of the Mediterranean, the river Po). Clear spatial patterns were observed, e.g. the Chaetoceros socialis cluster was most often observed on the eastern sampling station RV001, while the frequency of occurrence for the cluster Skeletonema sp. was the highest on the most western sampling station SJ108, most directly under the influence of freshwater from the river Po. Clusters Asterionellopsis glacialis and Cerataulina pelagica appeared to be more often observable at stations closer to the Po river delta, while the clusters Chaetoceros sp., and Cyclotella sp. were more often observable on the more eastern stations. The Thalassionema nitzschoides cluster appears to be more often observable at the stations most distant from the shoreline.
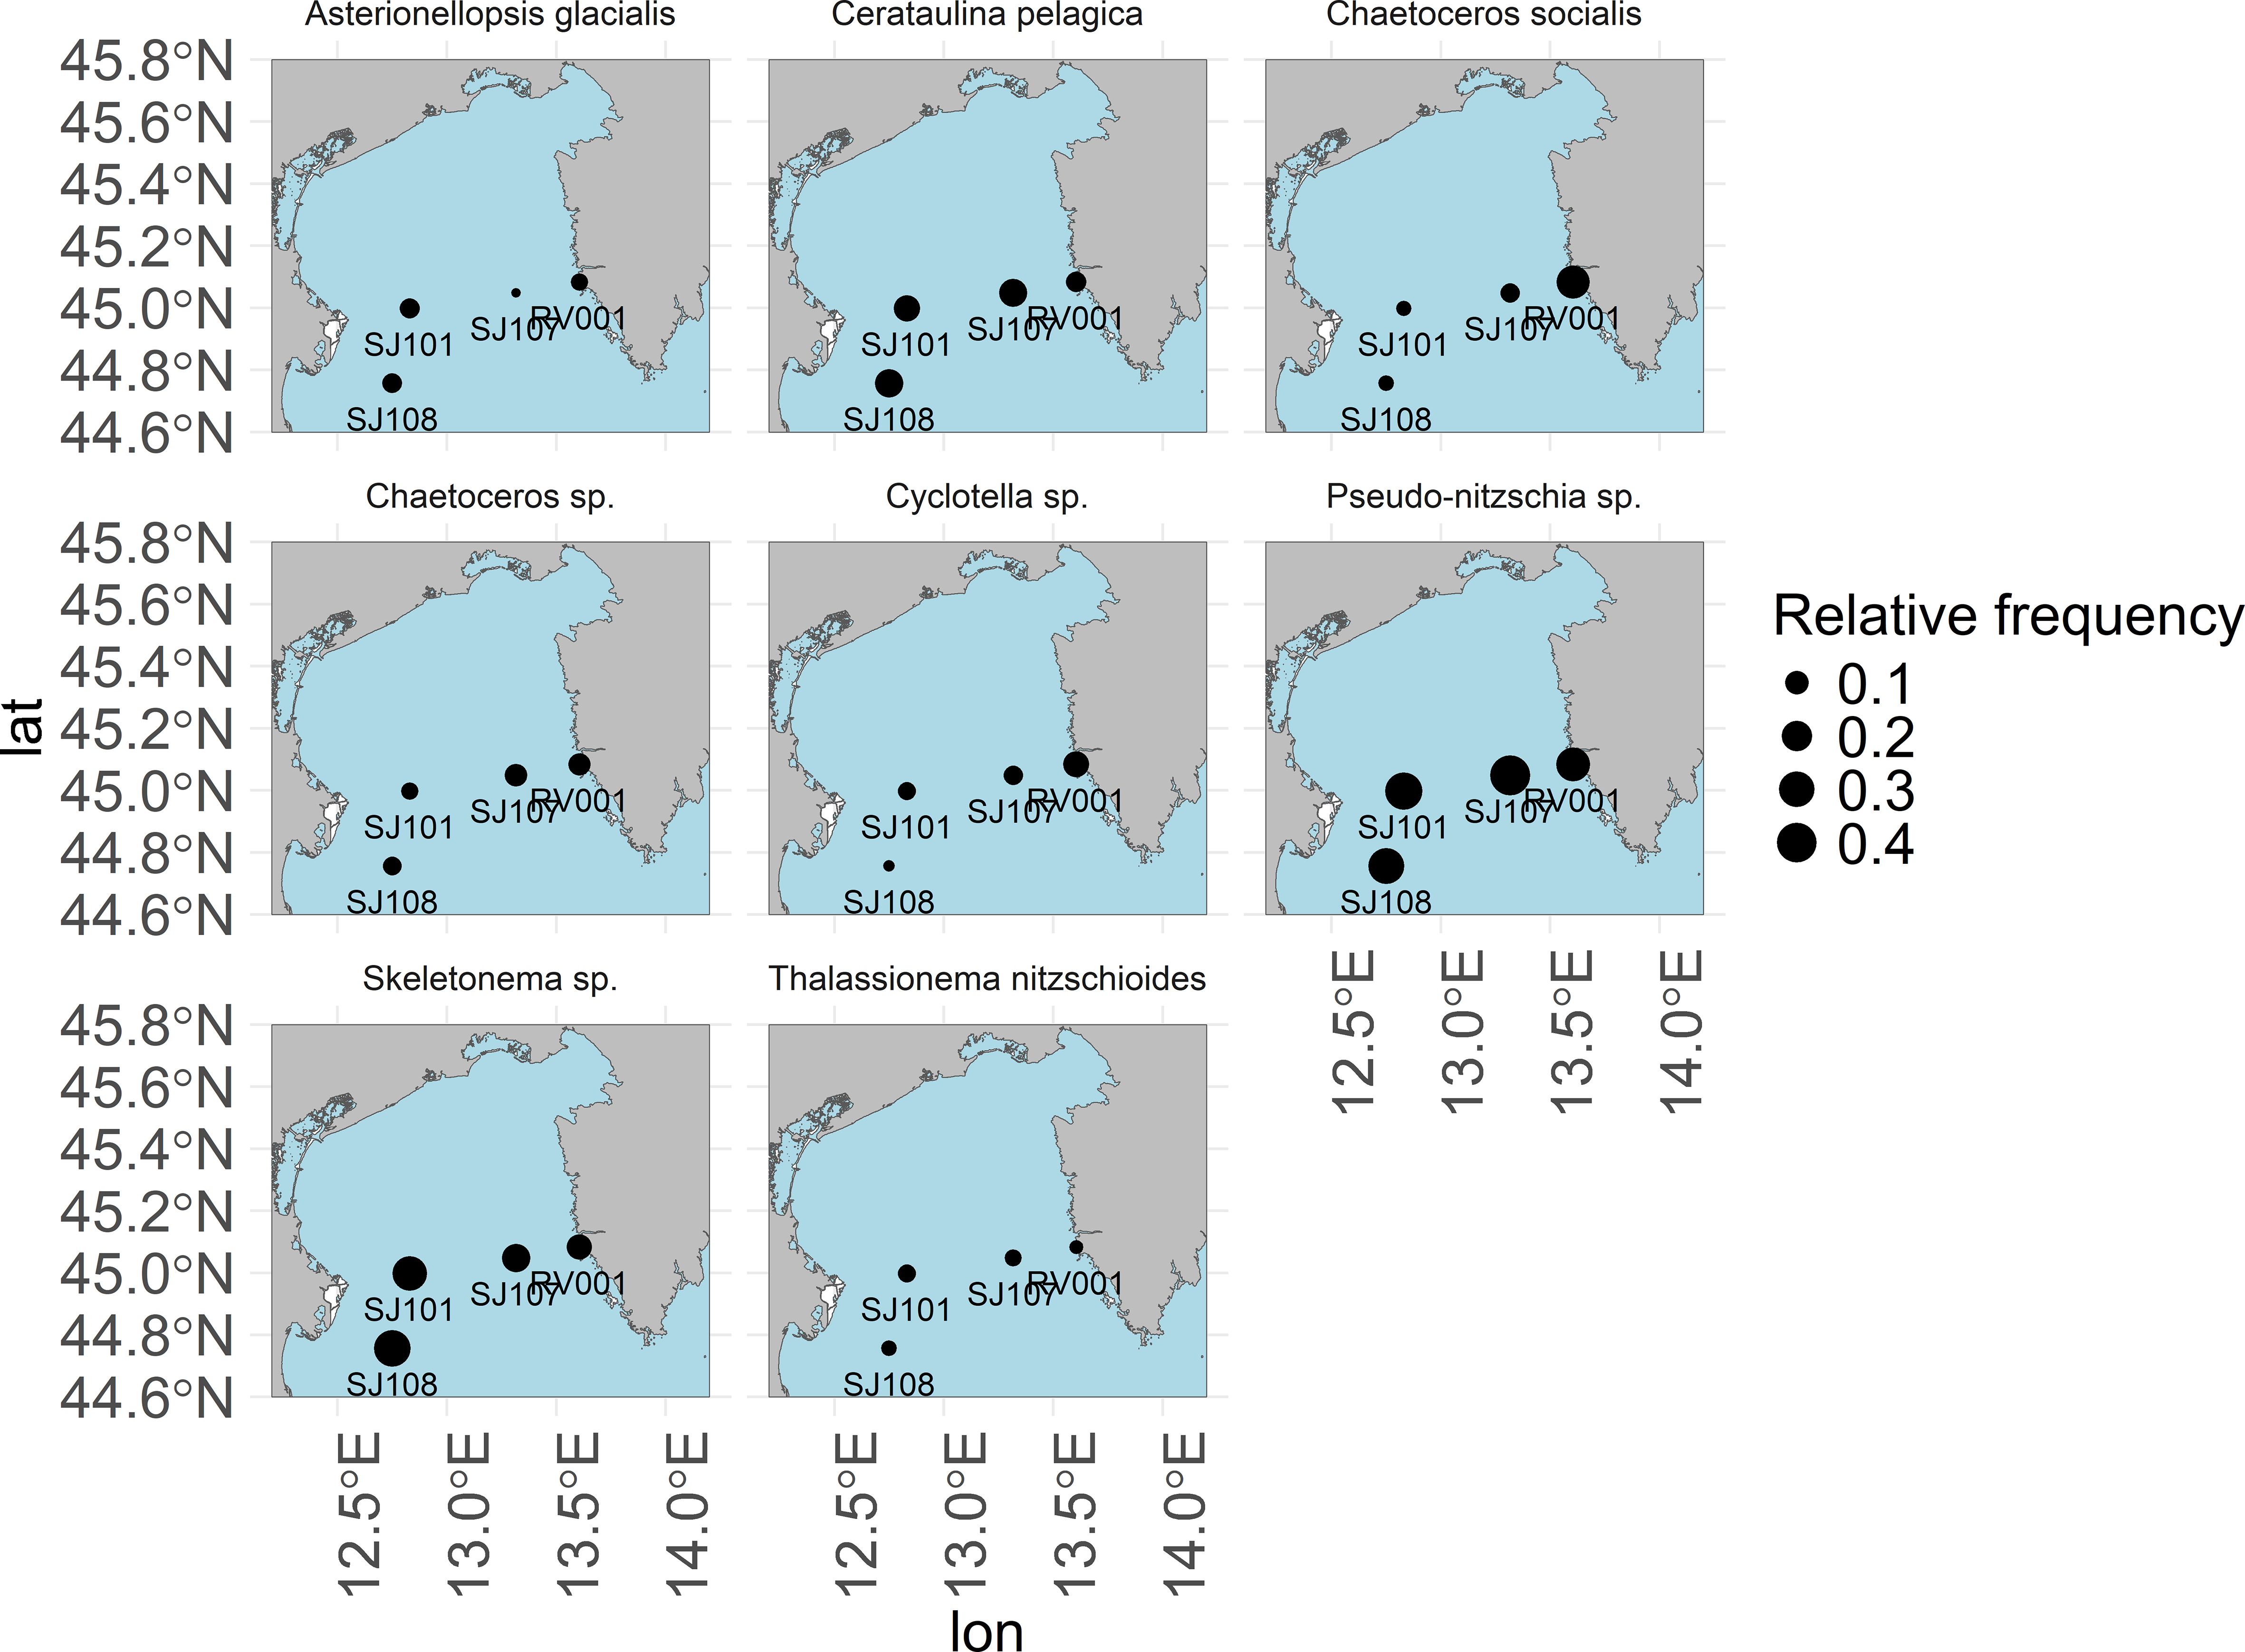
Figure 3. Spatial distribution of clusters relative frequency of occurrence in the northern Adriatic Sea.
3.4 Diversity indices in clusters
Highest median number of species or alpha diversity was found in the Chaetoceros socialis cluster followed by the Thalassionema nitzschioides cluster and the Asterionellopsis glacialis cluster. Cerataulina pelagica and Skeletonema sp. clusters show a low median number of species (Figure 4). Similar trends were observable for Shannon (H’) and Simpson (D) indices (Figure 4) are compared, but the Asterionellopsis glacialis cluster is the one with the highest median indices, while lowest values for those diversity indices still are observed for the same clusters: Cerataulina pelagica and Skeletonema sp. The Pielou index however: highest medians were calculated for A. glacialis and T. nitzschioides clusters while lowest values were observed in Skeletonema sp. cluster. More detailed temporal and spatial variation of indices in clusters are shown in Supplementary Figure S2.
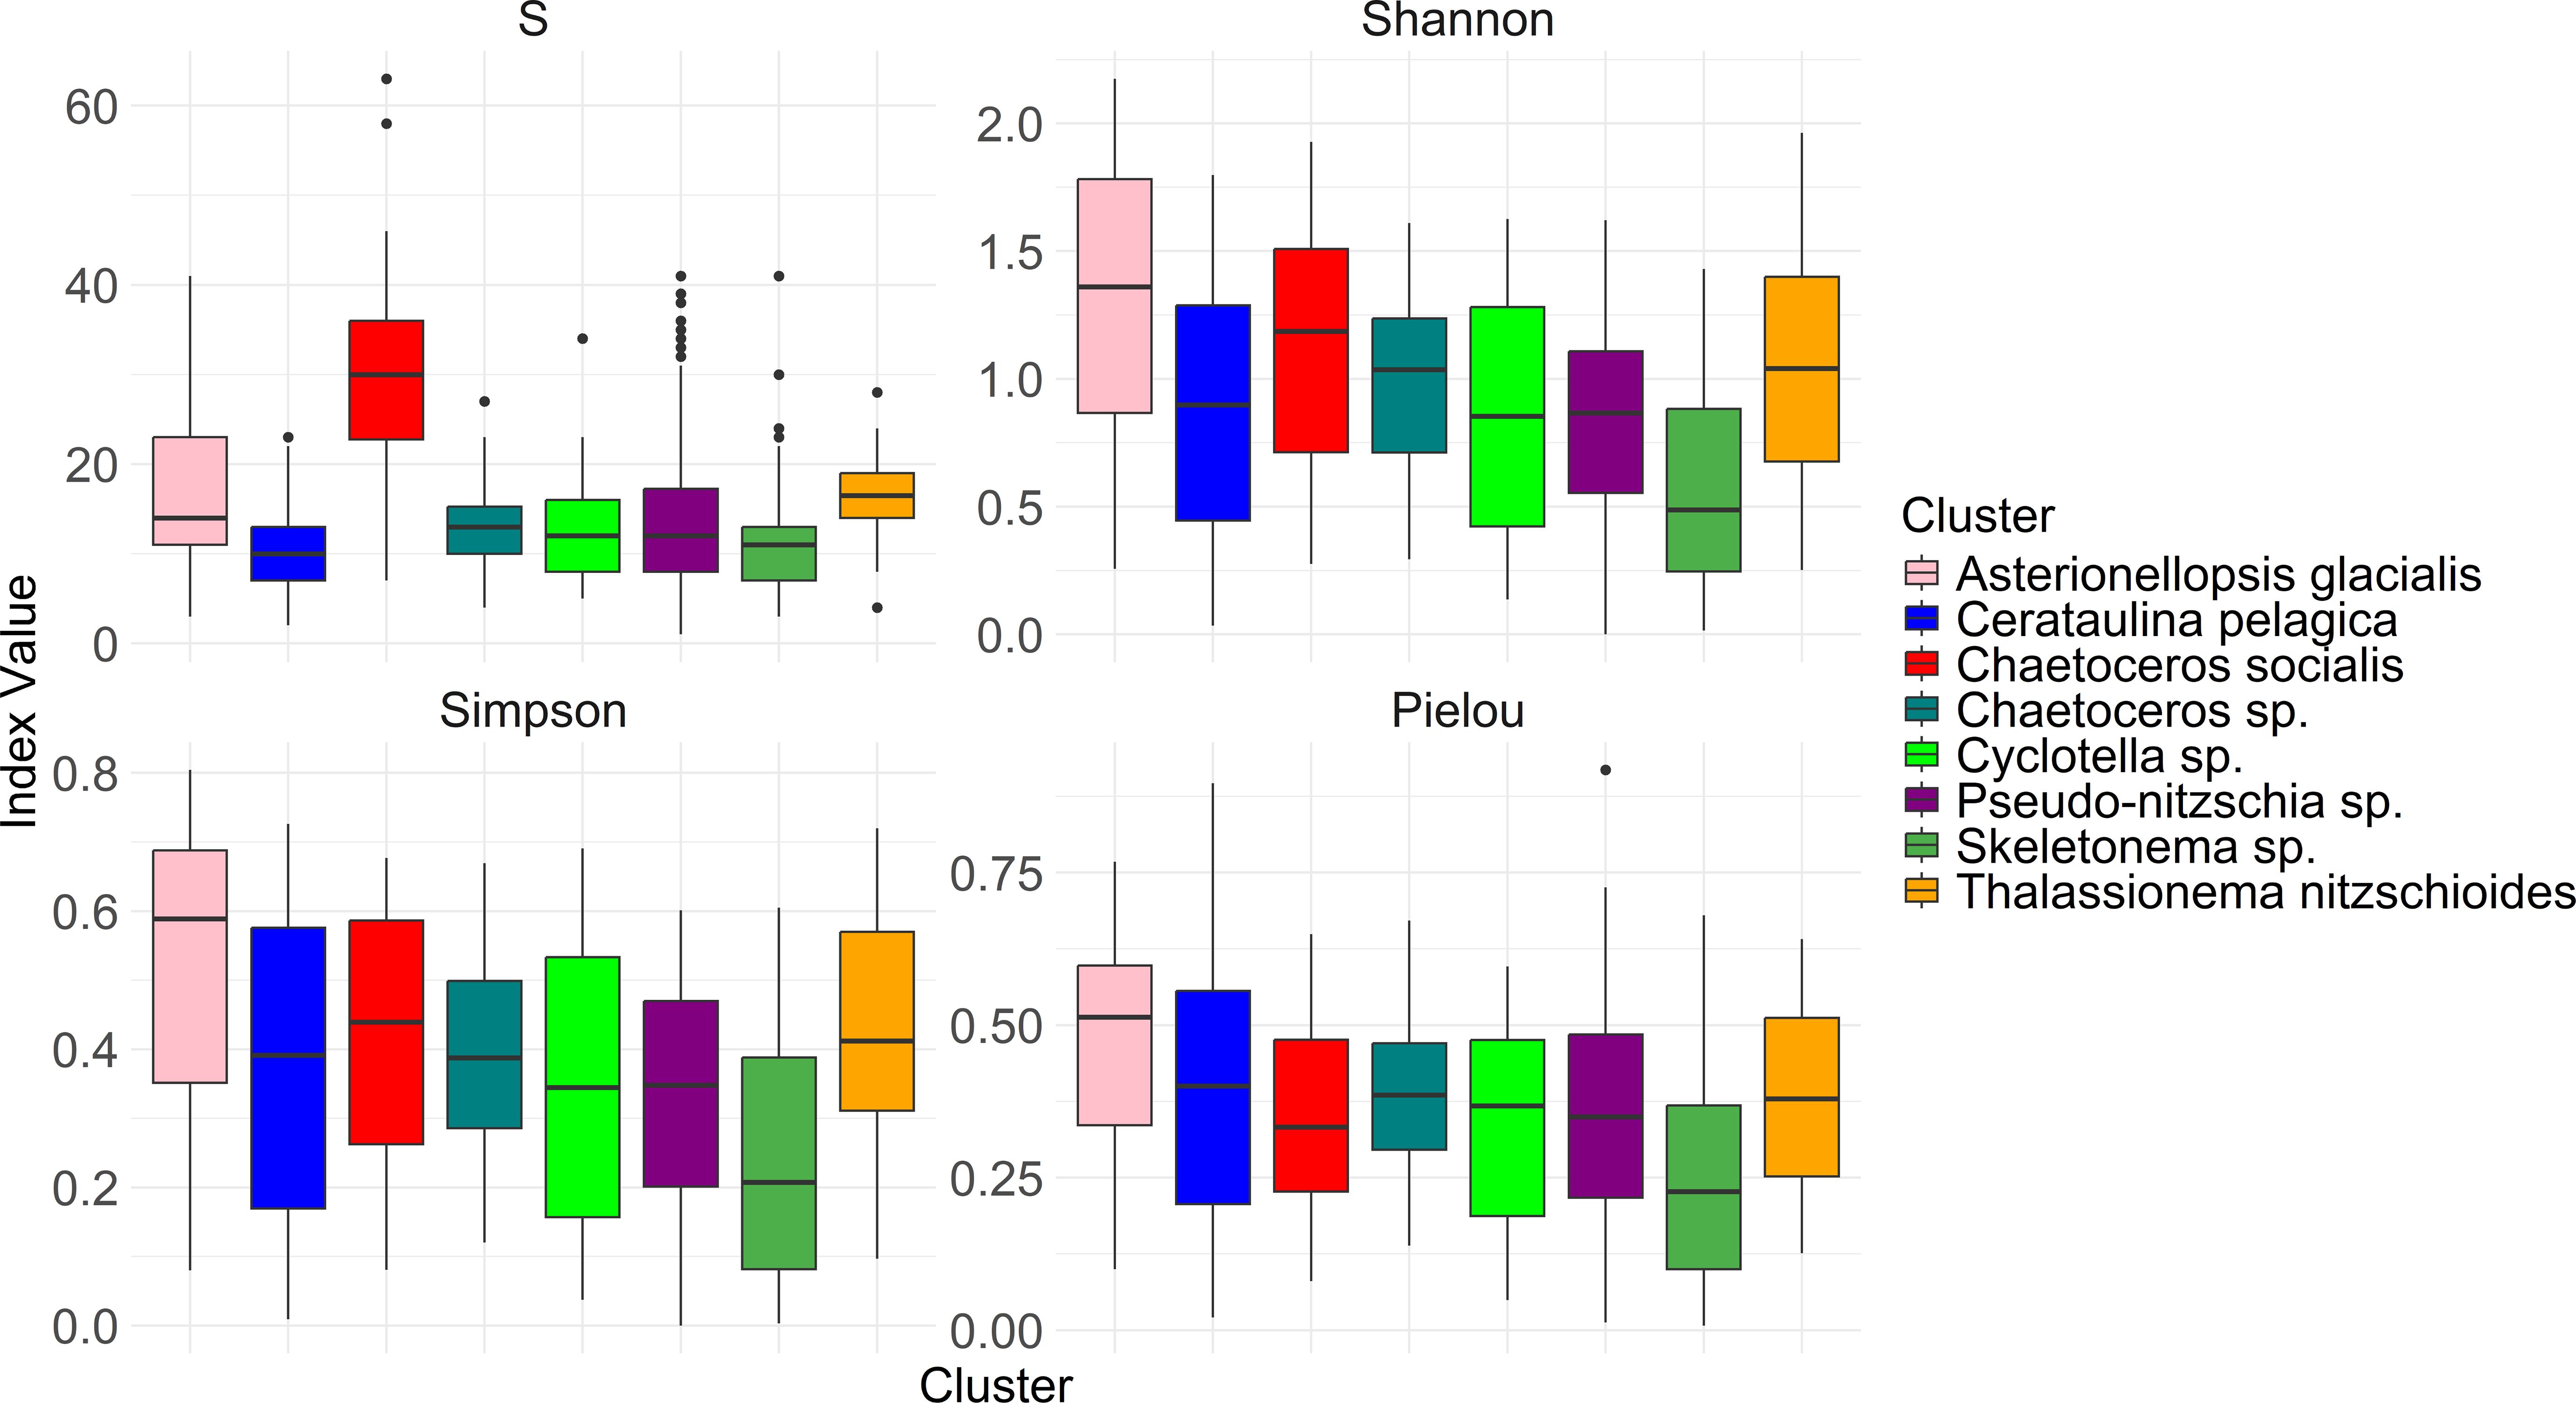
Figure 4. Diversity indices for each cluster. S stands for the number of taxa.
3.5 Influence of environmental parameters on phytoplankton community
To further elucidate the environmental conditions the above mentioned clusters were observed, Figure 5 depicts the observed clusters in the CCA space of respective ecological conditions. A generally good separation of clusters in the CCA space of ecological conditions (Figure 5), with relatively tight groupings, supports the notion that the applied process of phytoplankton assemblages clustering resulted in environmentally significant clusters. Temperature was negatively associated with the CCA1 axis while dissolved orthophosphates, silicates, nitrates, nitrites and oxygen are positively associated with this axis. Ammonium and salinity are positively associated with the CCA2 axis while length of day is negatively associated with CCA2. Skeletonema sp. cluster is positively associated with nutrient concentrations. Chaetoceros socialis cluster is positively correlated with salinity. Interestingly, Cerataulina pelagica, Thalassionema nitzschioides and Cyclotella sp. clusters showed positive association with length of the day (Figure 6). Statistically significant differences (p < 0.05) in analysed environmental parameters between clusters are confirmed with Kruskal–Wallis test and Dunn post hoc test and they are presented in Supplementary Table S4.
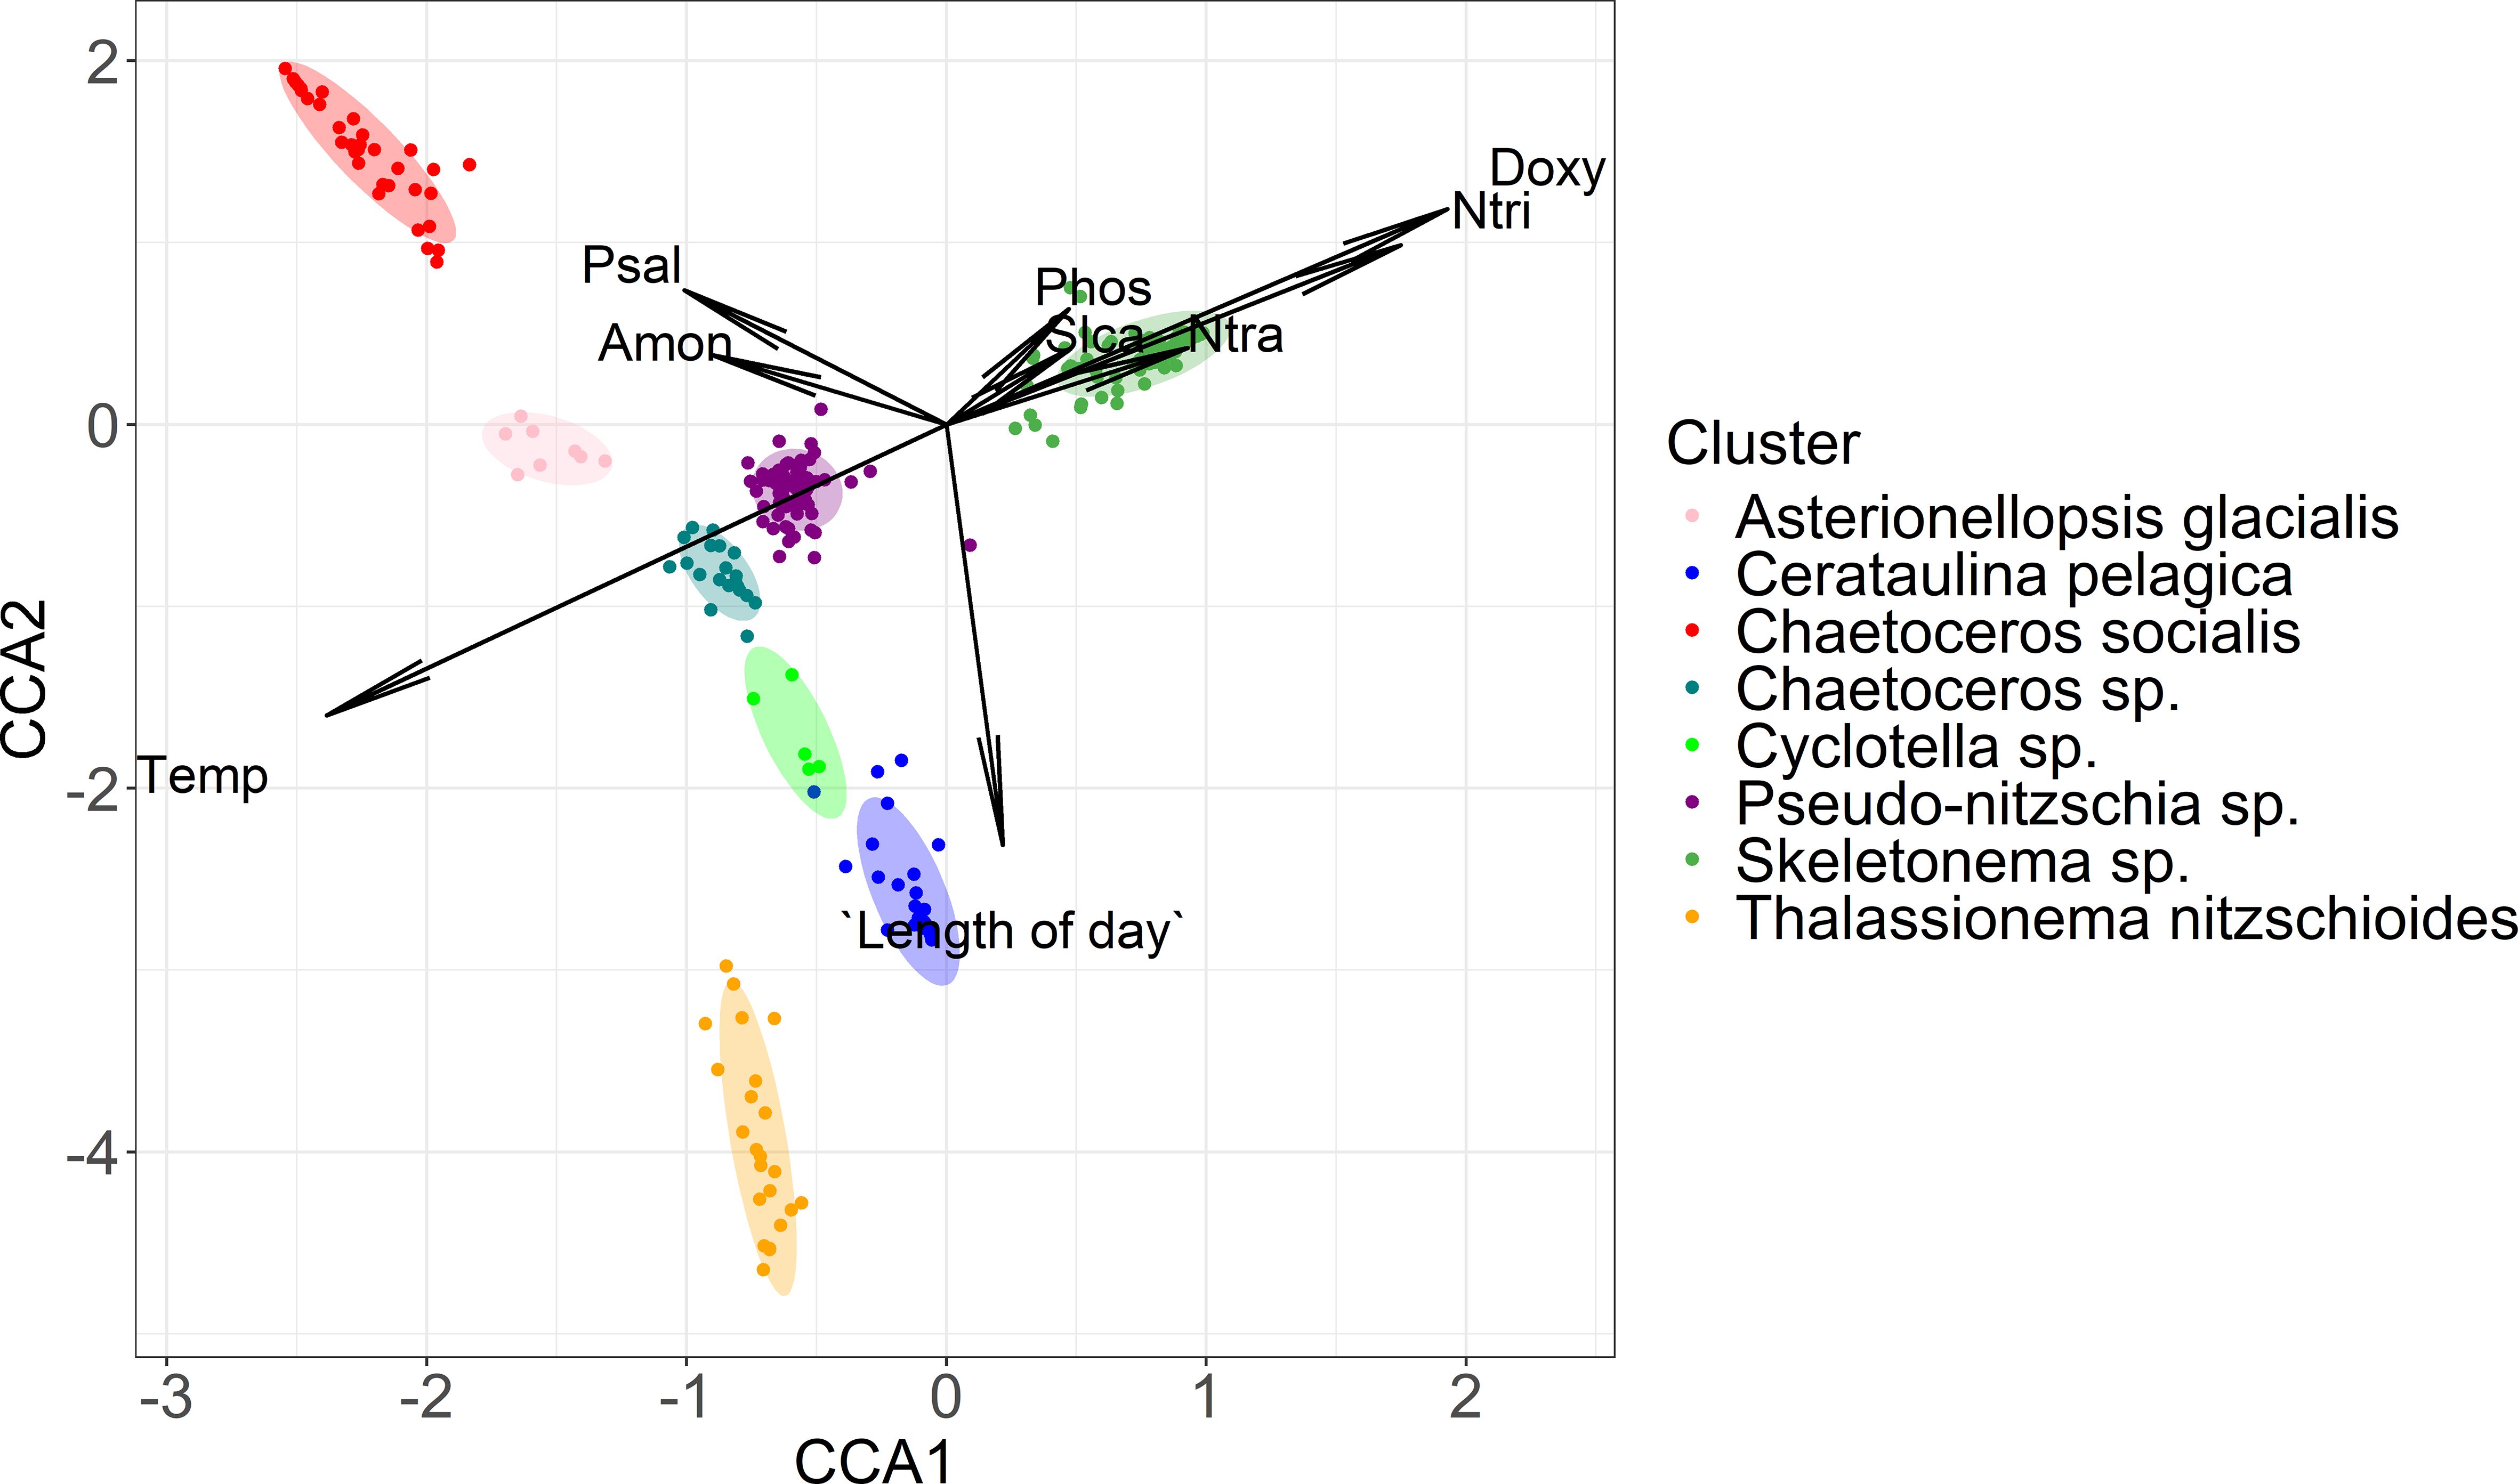
Figure 5. CCA biplot with clustered samples marked as points and environmental parameters as arrows. Temp, temperature; Psal, salinity; Amon, ammonium; Ntra, nitrates; Ntri, nitrites; Phos, orthophosphates; Slca, orthosilicates; Doxy, dissolved oxygen. Phytoplankton clusters are indicated in different colours.
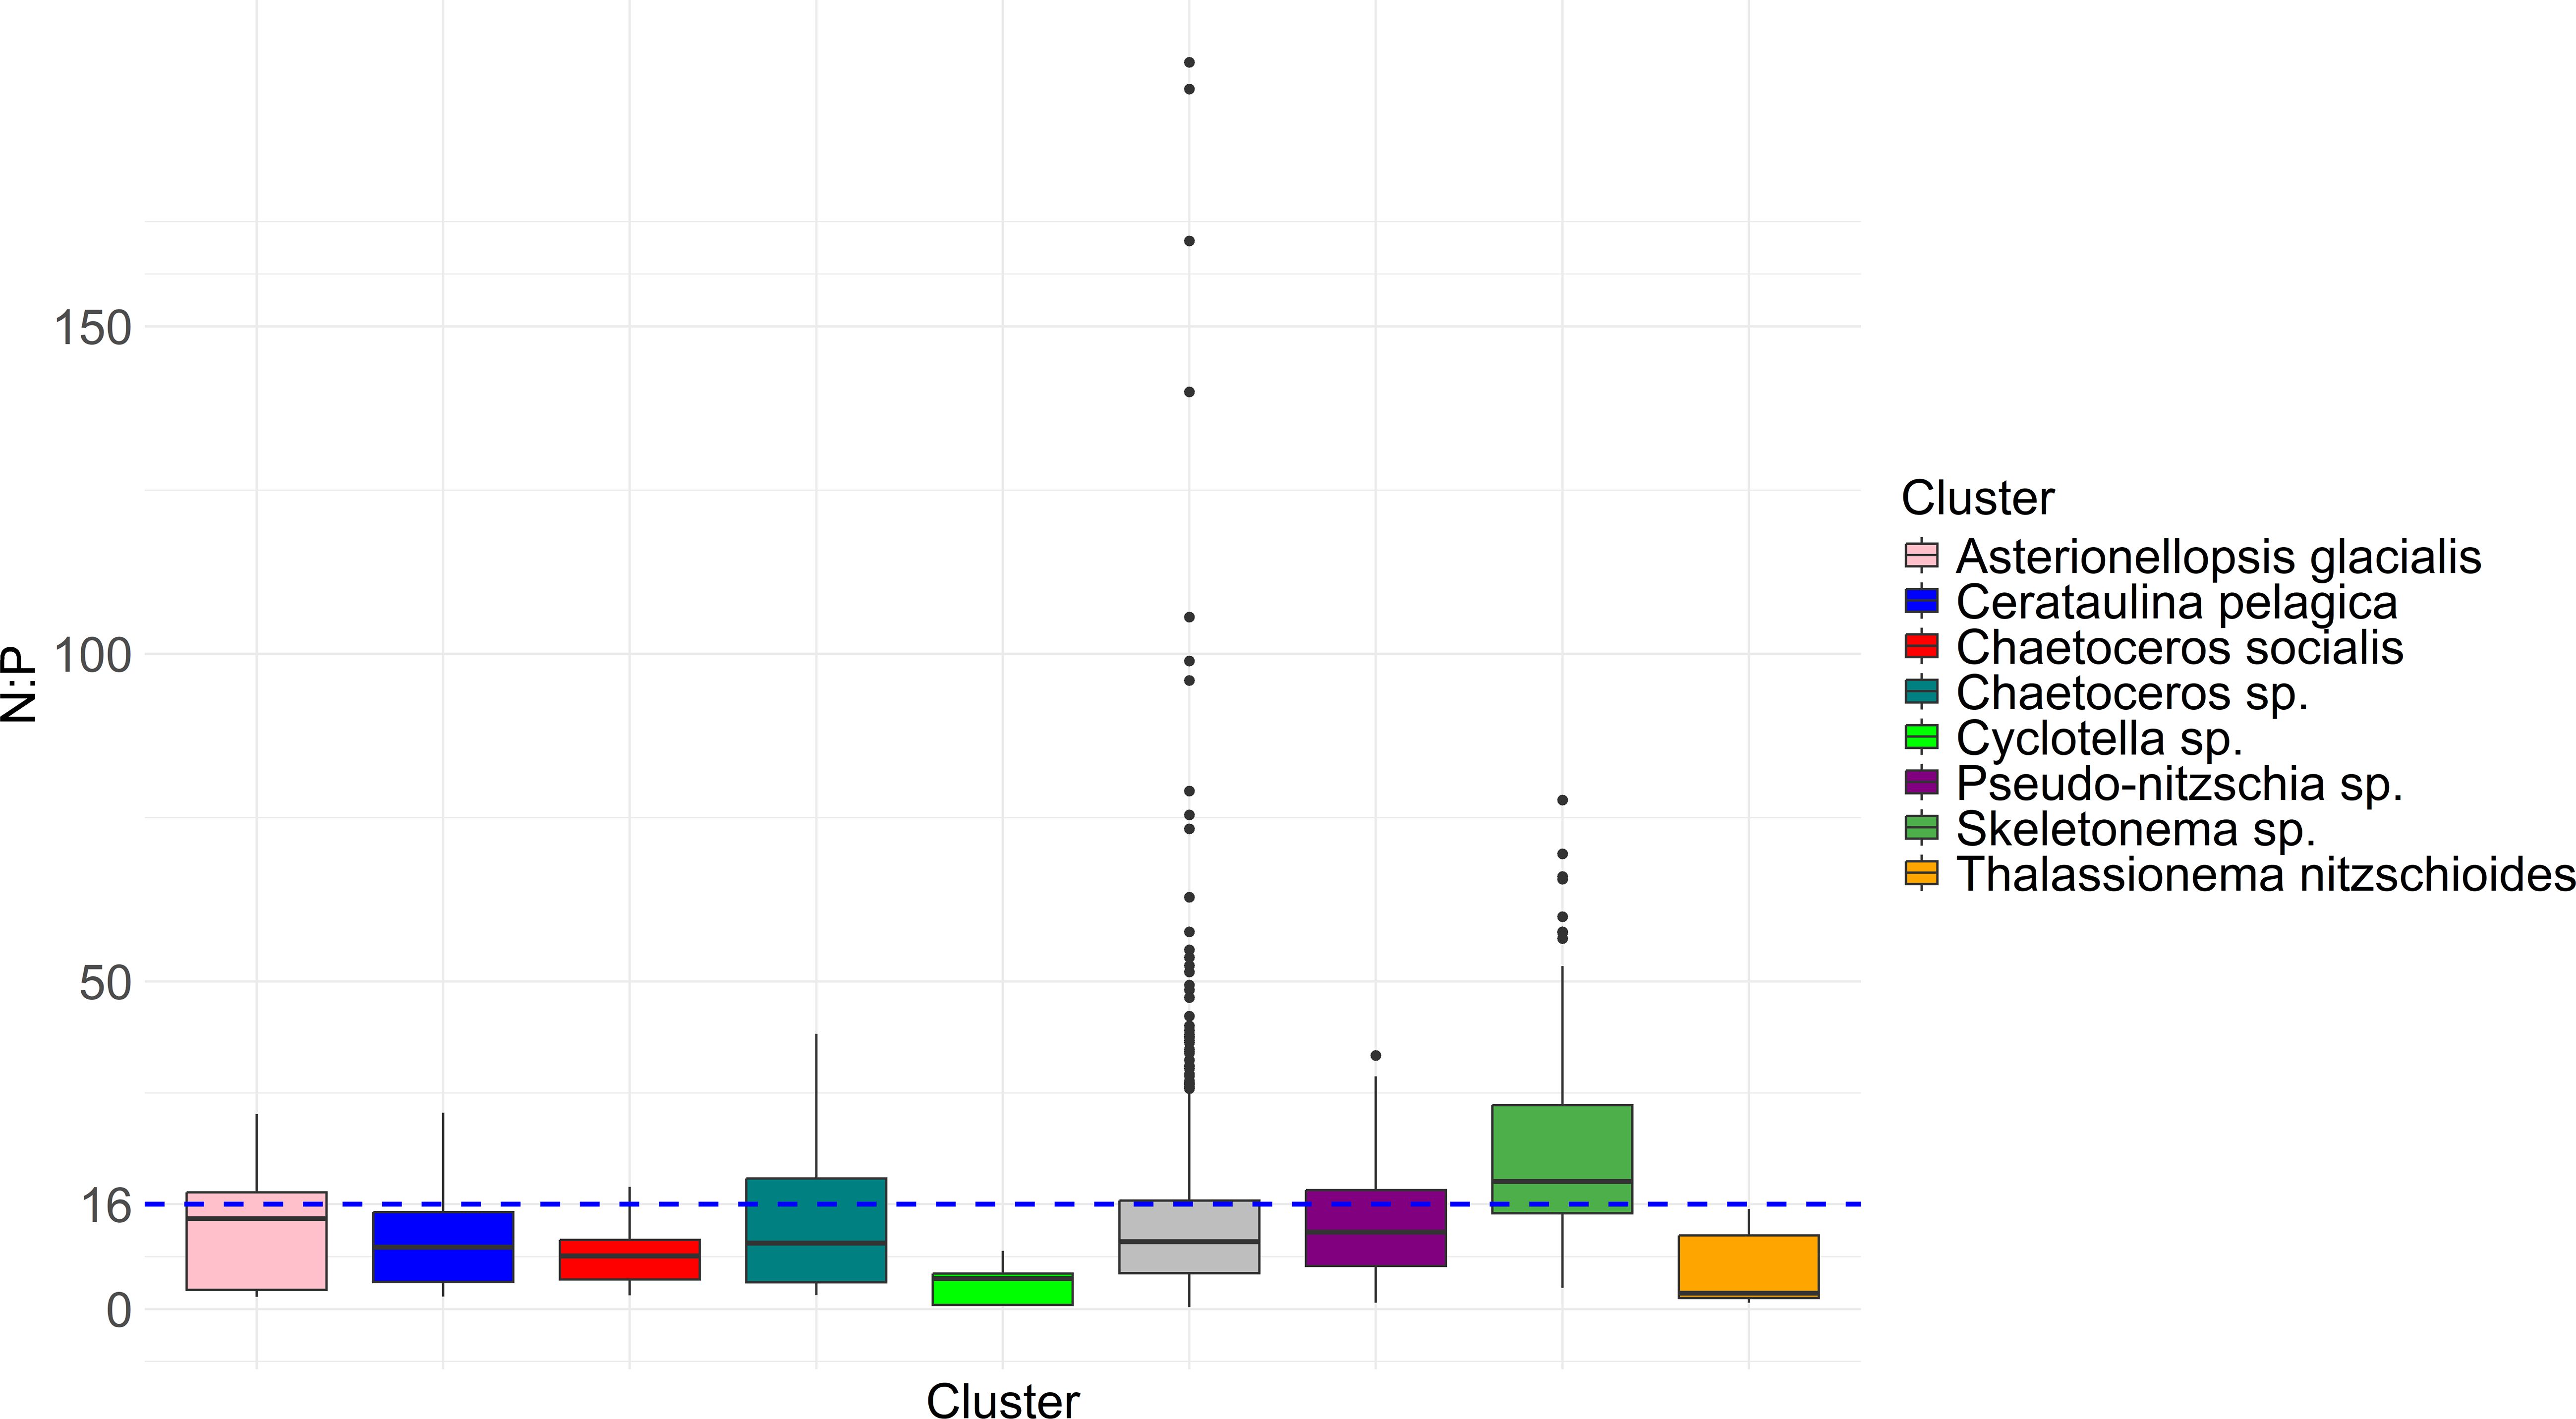
Figure 6. Total inorganic N: inorganic P molar ratio in all samples. Blue dashed line indicates the Redfield ratio (N:P = 16) where the N:P molar ratio might be considered optimal (Redfield et al., 1963). Grey colour marks unclustered samples.
Many samples were found in phosphorus limited conditions. However, only samples corresponding to Skeletonema sp. cluster showed significantly (p < 0.05, t-test) higher N:P molar ratios than the threshold value (N:P = 16, Figure 6).
3.6 Predictability of phytoplankton community
Ratios between the number of samples assigned to clusters and those that are not, showed spatial and temporal differences. Generally, more samples tended to be assigned to clusters on the western stations, closer to the Po River mouth and hence under more direct influence of the respective freshwater and nutrient input into the NA (Figure 7). The proportion of clustered samples decreased over time (Figure 8).
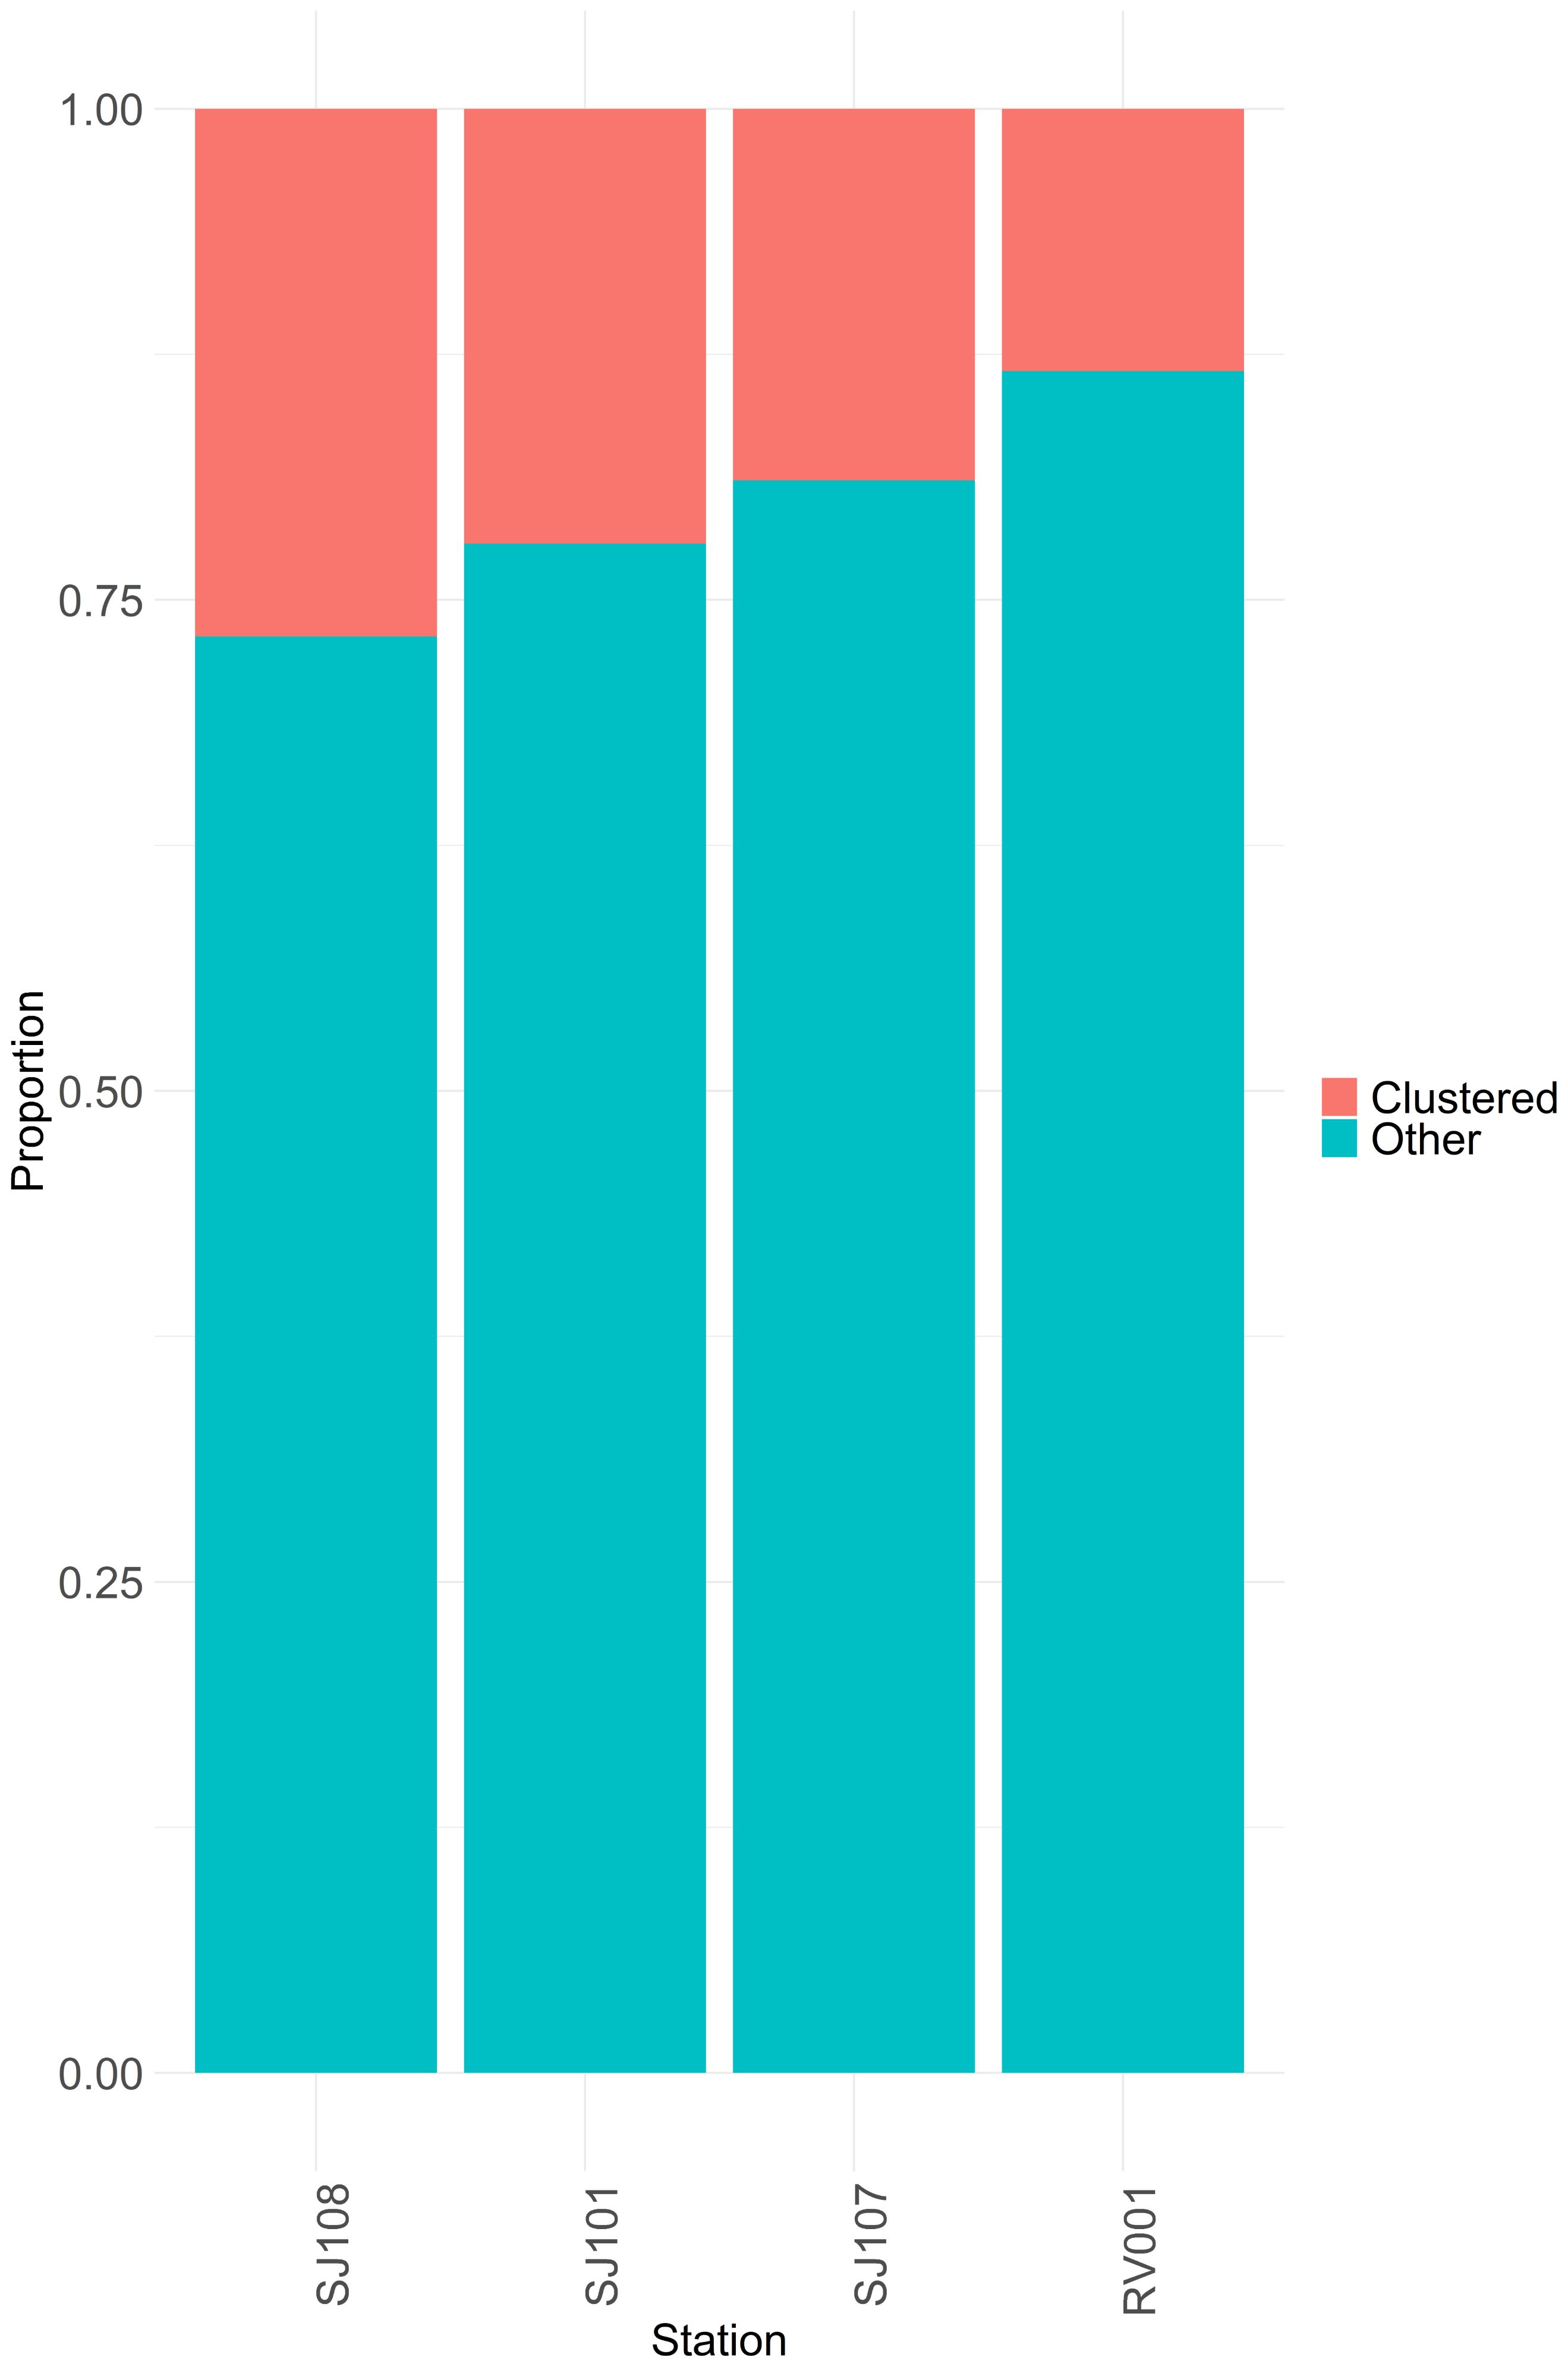
Figure 7. Proportion of clustered samples and non-clustered samples per station. Order of stations on this plot corresponds to their longitudinal order in sapling area. SJ108 is closest to the river Po mouth and RV001 is furthest from the river Po mouth.

Figure 8. Percentage of clustered samples per year. Locally estimated scatterplot smoothing (LOESS) shows decreasing trend in proportion of strongly clustered samples per year.
4 Discussion
4.1 Phytoplankton clusters in northern Adriatic
Cluster analysis was performed on the 23 year long dataset of phytoplankton diversity and abundance recorded along the longitudinal transect across the central part of the NA. The transect spans the steepest and most variable ecological gradient across the NA mainly driven by fluctuating influences of the Po river freshwater input into the system (Gilmartin et al., 1990; Harding et al., 1999). In the studied area, seasonal changes and a variety of ecological gradients result in the appearance of recurring assemblages of phytoplankton species often grouped into clusters. Previous research in the NA used similar clustering approaches to classify phytoplankton samples, most notably in the Gulf of Trieste (Vascotto et al., 2021) and in the Gulf of Venice (Vascotto et al., 2024). Here, we were interested in the spatial distribution of the reported phytoplankton clusters, and indeed, previous reports found some clusters with the same main indicator species (with highest IndVal score) as the clusters we could report for the central northern Adriatic. A winter Asterionellopsis glacialis cluster was present in our dataset during 2002, 2005 and 2009. A corresponding cluster was also found in December 2009 in the Gulf of Trieste (Vascotto et al., 2021), indicating the presence of the same assemblage in this area as well. Moreover, our dataset shows the disappearance of this assemblage after 2017. The cluster Cerataulina pelagica was recorded in the first decade of the analysed dataset. This cluster was also diminished in our dataset but earlier, in 2004. A similar cluster was found in the Gulf of Trieste, but only in June 2007 (Vascotto et al., 2021) marking a possible local and episodic occurrence of this cluster in the Gulf of Trieste. The cluster Chaetoceros sp. is another assemblage characteristic for the early 2000’s with complete absence in recent years, even at station RV001 where monthly sampling was performed from 2020. In this cluster a few other taxa were also indicator species/taxa like pennate diatoms and Chaetoceros affinis. Chaetoceros sp. cluster was found in the Gulf of Trieste until 2015 without strong seasonality (Vascotto et al., 2021) while in our dataset this cluster was present until 2007 and virtually disappeared afterwards. The Cyclotella sp. cluster was found both in the Gulf of Trieste and Gulf of Venice as well as in the here reported dataset. This summer cluster was present in the Gulf of Trieste until 2012 (Vascotto et al., 2021) and until 2019 (whole observed period) in the Gulf of Venice (Vascotto et al., 2024). The Pseudo-nitzschia sp. cluster showed main peaks which in late summer and last through autumn in our dataset, although this cluster did not show strong seasonality. Corresponding cluster in the Gulf of Trieste established itself as an autumn cluster after 2010 while in the Gulf of Trieste it was not found (Vascotto et al., 2021, 2024). The Skeletonema sp. cluster presence decreased over time in our dataset and in the Gulf of Trieste and the Gulf of Venice as well (Vascotto et al., 2021, 2024). The Skeletonema sp. cluster in our dataset showed a typical bimodal seasonality, with the main peak in winter. Interestingly, in the Gulf of Venice this cluster (the main indicator species named Skeletonema costatum s.l.) became observable only in Autumn months (Vascotto et al., 2021, 2024), indicating a possible shift in seasonality of this genus. The cluster Thalassionema nitzschioides represents a new spring/summer assemblage that was recorded only after 2015. Thalassionema nitzschioides cluster was also found in the Gulf of Venice (Vascotto et al., 2024) in all studied years (2010–2019). This cluster was most prominent in summer, just like in our dataset, but it can be found in other seasons as well, which is not the case in our dataset.
4.2 The ecology of phytoplankton assemblages
The Asterionellopsis glacialis cluster appeared in autumn and winter months as expected (Aubry et al., 2012; Godrijan et al., 2013; Cerino et al., 2019). Diversity indices showed that the A. glacialis cluster is rather diverse with evenly distributed species diversity in the dataset. The A. glacialis cluster is associated with shorter days, lower nutrient concentrations but not lower temperatures. The cluster appeared in the early 2000s, in less stable autumn and early winter seasons. In such conditions, more dominant species are replaced with coexisting survivalists.
C. pelagica was previously characterised as a typical summer species in the NA in the period 1999–2001 (Bernardi Aubry et al., 2006). This is also confirmed in our study where the C. plagica cluster is positively associated with temperature, and even more so with the photoperiod as in longer days. The decrease of this cluster could be related to the absence of mucilage appearance as C. pelagica was one of the species found in large mucus aggregates which occurred in summer months during previous years (Totti et al., 2019). Together with C. pelagica in this cluster, other mucilage associated diatoms as Cylindrotheca closterium, Pseudo-nitzschia sp. and Dactyliosolen fragilissimus (Najdek et al., 2005; Revelante and Gilmartin, 1991; Totti et al., 2005) also showed high abundances. Formation and accumulation of mucilage is possible in conditions of calm weather and weak winds (Precali et al., 2005). Beside winds, the increase in temperature, freshwater input and stratification as many other factors like nutrient input promote formation of mucous aggregates (De Lazzari et al., 2008). Hence, it is possible that overall changes in the area like intensity of rainfall or anthropogenic influence (nutrient load) played a role in decrease of mucilage appearance and clusters with species associated with this phenomenon (Totti et al., 2019). Low abundances and diversity indices in this cluster (S, H’, D and J) indicate the domination of one or few species in the community and possible competitive exclusion.
C. socialis was in previous studies characterised as an autumn species in the northern Adriatic (Bosak et al., 2016; Godrijan et al., 2013; Totti et al., 2005; Cerino et al., 2019). Our results show a strong positive association of the C. socialis cluster with salinity, as expected, since also previously, this species showed positive correlation with salinity (Bosak et al., 2016). Thus, the higher recorded ecological importance of this cluster could be related to the recently reported increase of salinity during autumn in the Adriatic Sea (Mihanović et al., 2021; Vilibić et al., 2013). C. socialis cluster showed negative association with day length which could additionally explain seasonality of this cluster. The C. socialis clusters was associated with low nutrient concentrations, shorter days and higher temperatures which are typical conditions for the autumn season just before the breakup of stable stratification and the beginning of water column mixing and internal fertilisation processes (Ivančić and Degobbis, 1987). In the studied dataset, this cluster showed the highest median number of taxa (S) and relatively high diversity indices (H’ and D). This suggests that the species in this assemblage are more oriented towards coexistence, instead of competition since a high number of taxa is more evenly distributed.
The Chaetoceros sp. cluster showed a slightly negative association with nutrients while slightly positively associated with temperature. Similar results were found in the Gulf of Trieste, although there Chaetoceros sp. was characterised as a spring taxon (Cerino et al., 2019). The identification of Chaetoceros sp. using light microscopy in long term monitoring efforts is challenging. It is likely that several Chaetoceros species are contributing to the observation of this cluster. Nevertheless, this cluster should be considered as separate from others due to the fact that Chaetoceros blooms are usually multispecies blooms. Blooms are likely to develop from resting spores which germinate into adult stages after water column mixing (Bosak et al., 2016; Montresor et al., 2013). Respective indices (H’, D, J) place this cluster among those where taxa tend to be more evenly abundant, in other words it represents a more diverse assemblage.
In our results the Cyclotella sp. cluster showed a positive association with temperature and length of day. On the contrary, previous studies in the Adriatic sea confirmed positive correlation of Cyclotella genus with ammonium (Ninčević-Gladan et al., 2015) as well as this species oligotrophic preferences (Vilicic et al., 2007). Cyclotella as a small sized diatom can effectively use nutrients in warm periods when stratification occurs (Vascotto et al., 2024) which explains occurrence of this cluster in warmer months. The cluster characterised by Pseudo-nitzschia decreased in its occurrence after the first decade of the studied period. Pseudo-nitzschia is a genus with potentially toxic species and an important contributor of the total phytoplankton community in NA (Viličić et al., 2009; Marić et al., 2012). Lack of strong seasonality of this cluster is in accordance with the frequent appearance of Pseudo-nitzschia sp. blooms in NA. Similarly as for the Chaetoceros sp. cluster, Pseudo-nitzschia cluster includes a genus with species that are difficult to identify at species level by light microscopy in long term observations. There are hence probably several species of the genus Pseudo-nitzschia contributing to this cluster. This genus usually peaks in spring or autumn, but occasional blooms are possible in summer as well with large interannual fluctuations (Turk Dermastia et al., 2020). Decrease and fluctuations of this cluster could be related to more irregular nutrient input as this genus is an opportunistic species with fast response to nutrient load (Ljubešić et al., 2011). High ranges of diversity indices and weak association with environmental parameters in CCA indicate possible generalistic and opportunistic strategies of species in this assemblage.
The Skeletonema sp. cluster showed a slightly bimodal temporal distribution throughout the year (Figure 3). This observation might be related to Skeletonema intrageneric diversity. For the NA, currently 2 Skeletonema species are reported: S. marinoi and S. grevillei. Skeletonema grevillei is reported from the region only since the year 2018, but might have been present even earlier. It is however reported to be a species likely introduced by ballast waters from Chinese waters (Marić Pfannkuchen et al., 2018). These two species are difficult to discriminate using light microscopy but they have been shown to display different seasonal patterns. S. marinoi is a late Winter/early Spring species (just like this cluster) while S. grevillei is a late autumn species which can explain the occurrence of this particular cluster in autumn months (Marić Pfannkuchen et al., 2018). S. marinoi prefers western stations closer to Po river mouth while S. grevillei was found more often in ports and on the eastern part of study area. After 2011 the occurrence of this cluster became scarce which is related to a respective decrease in bloom intensity and frequency of this taxon. Skeletonema sp. blooms decreased in the second decade in terms of intensity and frequency. Decrease of Skeletonema sp. frequency is also noted in previous studies/research relevant for our study area and period (Marić et al., 2012; Viličić et al., 2009). The trend of Skeletonema sp. decrease was also noticed in the Gulf of Venice (Bernardi Aubry et al., 2021) and it could be connected to this decreasing trend in NA already recorded before the year 2000 (Cabrini et al., 2012). Skeletonema cluster is also characterised by lowest diversity indices (H’, D, J) which suggests a strong domination of one species. Skeletonema sp. cluster is the only cluster in our dataset that shows strong association with nutrients and a negative association with the temperature which showed typical for Skeletonema marinoi in the NA (Casabianca et al., 2022; Marić Pfannkuchen et al., 2018; Cerino et al., 2019). Despite strong nutrient input from the Po river, the Adriatic Sea is an example of a phosphorus limited sea (Cozzi and Giani, 2011) where inorganic N:P ratio exceeds balanced N:P = 16 (Redfield et al., 1963). Many phytoplankton species can survive in such conditions due to alkaline phosphatase activity, as shown in in situ measurements (Ivančić et al., 2012, 2016). Our results confirm this since many samples were related to phosphorus limited conditions. However, only samples corresponding to Skeletonema sp. cluster showed significantly higher N:P molar ratios than the threshold value (N:P = 16, Figure 7). This species was found to express alkaline phosphatase on its cell surface and reach high abundances by feeding on organic phosphorus (Ivančić et al., 2016). It is also shown to successfully evade predation and form bloom under grazing stress (Smodlaka Tanković et al., 2018).
The Thalassionema nitzschioides cluster is positively associated with temperature and length of day, while negatively associated with nutrient contents, salinity and ammonia. This is in accordance with the preferences of this species as published earlier for observations in the north western Adriatic sea (Casabianca et al., 2022). It is a typical early summer cluster, however with a relatively low relative frequency of appearance. Periods in early summer with little nutrient availability, probably during early stratification and with reduced salinity appear to favour these clusters. Establishment of this cluster in the last decade could be related to a trend of reduced nutrient availability in the northern Adriatic, as shown in other studies (Mozetič et al., 2010; Cerino et al., 2019) and models (Mentaschi et al., 2024). This trend could be caused by decreased and more variable Po river discharge (Cozzi et al., 2019). High diversity indices showed that this species tends to form a more evenly distributed community which could be a survival strategy in oligotrophic conditions. In such conditions organisms could be more oriented towards coexistence, rather than competition. The Thalassionema nitzschioides cluster showed strongest positive association with the length of day. Overall, our results confirm that photoperiod is one of the main drivers of seasonality in the phytoplankton community as previously shown by (Longobardi et al., 2022).
Most clusters appeared and were observed at higher relative frequency on the western stations, close to the river Po delta (Figure 4). Those clusters were also characterised by the highest total phytoplankton abundances and the highest overall frequencies of appearance. These observations underline the importance of the river Po in shaping and driving the ecosystem of the NA. The clusters Chaetoceros socialis, Chaetoceros sp. and Cyclotella sp. however, were more frequently observed on the eastern coast of the NA Sea, which might indicate their preference for more oligotrophic waters and possibly a connection with the intrusion of southern Adriatic waters into the NA along the eastern Adriatic coast.
Generally, our results indicate hence that the river Po with its freshwater input and the input of nutrients generates rather stable and recurring phytoplankton clusters and hence stability and predictability in the planktonic ecosystem, which is thought to be an important backbone of overall ecosystem stability, in particular taking into consideration the intricate relations within the marine food web, where e.g. grazers and their larval stages rely on the predictability or seasonality of specific phytoplankton assemblages (Hays et al., 2005). The river Po is reported to deliver rather imbalanced ratios of nitrogen and phosphorus (Marić et al., 2012; Cozzi et al., 2019; Soana et al., 2024). Our results however indicate that rather low N:P ratios (e.g. below the redfield ratio) appears to foster stable clusters in the phytoplankton assemblages, while not regular reoccurring phytoplankton assemblages are associated with high N:P ratios (see Figure 7). Whether those relations are possibly the result of nutrient cycling during the establishment of stable cluster assemblies rather than the driving factor remains to be uncovered in future research.
4.3 Decline of cluster frequency and shift in survival strategies
Ratios between the number of samples assigned to clusters and those that are not, showed spatial and temporal differences. Generally, more samples tended to be assigned to clusters on the western stations, closer to the Po River mouth and hence under more direct influence of the respective freshwater and nutrient input into the NA (Figure 8). We propose, that in the here investigated sampling regime and dataset, well supported clusters originate from regularly occurring phytoplankton assemblies. A larger number of well supported clusters and a larger number of samples assigned to those clusters within a certain time frame might indicate a regular occurring succession of external pressures and/or intrinsic processes. Conversely, a decrease in number of clusters and sample assignment to those might indicate changes in the regularity of aforementioned driving factors. Such trends were noted by other researchers in the study area as well (Vascotto et al., 2021, 2024). We could additionally observe that the number and frequency of observed phytoplankton assemblages, assignable to clusters tend to increase towards western stations, closer to the influence of Po river underlining the importance of the river Po as a shaping/driving factor for the sea region. As the eastern part of the Adriatic sea is periodically under oligotrophic influence of southern waters due to circulation patterns, it is expected that a less stable phytoplankton community can develop in such conditions. Chaetoceros socialis and Thalassionema nitzschioides assemblages show signs of coexistence of species while Skeletonema sp. and Cerataulina pelagica assemblages are more oriented towards the domination of one species. In general, more dominant assemblages are being replaced with more coexistence-oriented assemblages, possibly due to an increased environmental variability. If nutrients are available there is more competition, if they are scarce then all organisms are oriented towards survival, however overall production declines. Species coexistence relies on mechanisms such as resource partitioning and frequency-dependent predation, alongside equalising mechanisms that minimise average fitness differences, influencing diversity dynamics (Chesson, 2000). Regular phosphate limitation in the northern Adriatic Sea is a shaping phenomenon for the phytoplankton community in the region (Fuks et al., 2012; Ivančić et al., 2016, 2012). However, global and regional trends towards further disbalance in nutrient availability (Zhang et al., 2022) might lead to a further change of marine planktonic food webs and the decline of regularly reoccurring clusters in the phytoplankton assemblages. A change in the number of observable clusters, in metrices for the clusters as well as in the fraction of clusters assigned samples might be evoked by an intrinsic change in the phytoplankton biodiversities capability to react to internal and external pressures, but also by a change in internal or external pressures. Changes in periodicity of external factors like nutrient input, temperatures, salinity or meteorological conditions could lead to changes in the succession of phytoplankton assemblages. Not all possible relevant pressures or driving factors can be recorded in long term datasets. But further research might discern intrinsic changes and internal as well as external pressures that drive the observed changes. However it must be assumed that changes in the spatiotemporal dynamics of clusters as observed for the NA here, reflect or effect through the entire ecological network and relevant ecosystem services.
The presented analysis of phytoplankton dynamics based on a clustering approach promises to deliver valuable insights into the changes of marine planktonic ecosystems. Monitoring of marine ecosystem health in particular for coastal areas is a cornerstone for coastal management, and we predict that coastal monitoring efforts could greatly benefit from clustering approach based analyses of phytoplankton dynamics. In our data set we could demonstrate that stable and well defined clusters/phytoplankton assemblages appear and disappear over time (see Figure 2) and we could demonstrate that the percentage of samples assignable to stable clusters is in decline over time in the NA (see Figure 8). These results are in accordance with previous studies where decline in phytoplankton abundances and predictability is reported by different approaches (Vascotto et al., 2021, 2024; Skejić et al., 2024).
4.4 Conclusions
Our analysis revealed dynamic shifts in the composition and distribution of phytoplankton species in the NA. Some assemblages diminished in prevalence while new ones emerged over time, with certain patterns observed across seasons and locations. The proportion of clustered samples declined over time. This trend aligns with documented observations in the NA, suggesting broader environmental influences on community dynamics.
As with time the frequency of observable community compositions that could be assigned to stable clusters decreased, we observed a trend towards more cooperative assemblages and away from dominance by single species. In Chaetoceros socialis and Thalassionema nitzschioides assemblages the coexistence of larger species diversity is observed whereas Skeletonema sp. and Cerataulina pelagica assemblages tend towards domination.
Environmental parameters played key roles in shaping phytoplankton communities. Phosphorus limitation promoted the stability of the winter community dominated by Skeletonema sp., while increasing salinity favoured the establishment of Chaetoceros socialis. Oligotrophy and rising temperatures promoted the emergence of the T. nitzschioides cluster. It appears that beside classical oceanographic conditions like temperature, salinity and nutrient content one of the main drivers for seasonality of assemblages is length of day.
Oligotrophication, salinity increases, and greater environmental variability disrupted formerly reoccurring successions of phytoplankton assemblages that could readily be assigned to stable clusters of observations. Structured communities with competitive species tend to emerge in more eutrophic conditions, while less predictable environments favour coexistence among species due to frequent disturbances. Significant changes in the periodicity and recurrence of phytoplankton clusters were observed and the changes of respective ecosystem services specific to the observed clusters hence will have changed as well. Further research now must elucidate the nature of ecosystem services related to specific phytoplankton clusters and demonstrate their respective effects e.g. through the food web or on biogeochemical cycles.
The presented results demonstrate a clear change in the phytoplankton dynamics of the northern Adriatic sea, a change that more simple biodiversity indicators do not detect. The here presented analysis hence might be considered in the future for a more sensitive ecosystem monitoring and earlier detection of changes in aquatic ecosystems.
Data availability statement
The raw data supporting the conclusions of this article will be made available by the authors, without undue reservation.
Author contributions
IV: Conceptualization, Data curation, Formal analysis, Investigation, Methodology, Software, Validation, Visualization, Writing – original draft, Writing – review & editing. DM: Conceptualization, Data curation, Formal analysis, Funding acquisition, Investigation, Methodology, Project administration, Resources, Supervision, Validation, Writing – review & editing. MS: Data curation, Formal analysis, Funding acquisition, Investigation, Project administration, Resources, Software, Validation, Writing – review & editing. AB: Formal analysis, Funding acquisition, Investigation, Project administration, Resources, Validation, Writing – review & editing. NK: Formal analysis, Investigation, Methodology, Validation, Writing – review & editing. MK: Formal analysis, Investigation, Validation, Writing – review & editing. LG: Formal analysis, Investigation, Validation, Writing – review & editing. IP: Formal analysis, Investigation, Validation, Writing – review & editing. TK: Formal analysis, Investigation, Validation, Writing – review & editing. MP: Conceptualization, Formal analysis, Funding acquisition, Investigation, Methodology, Project administration, Resources, Supervision, Validation, Writing – review & editing.
Funding
The author(s) declare that financial support was received for the research, authorship, and/or publication of this article. This work was funded by the Croatian Science Foundation (HRZZ) Projects: Life Strategies of Phytoplankton in the Northern Adriatic (UIP-2014-09-6563) and Molecular Life Strategies of Phytoplankton in the Northern Adriatic ADRILife (UIP-2020-02-7868). Lana Grižančić is supported by the HRZZ project DOK-2021-02-5104. The study was also supported by the H2020 program project JERICO-S3 and the Interreg Italy-Croatia projects AdriaClim, Marless and Cascade from the European Union regional development funds.
Acknowledgments
We thank the crew of R/V Vila Velebita and R/V Burin for help during sampling. Special thanks goes to Anica Bakota and Jelena Godrijan for phytoplankton sample analysis, Marija Fornažar, Victor Stinga Perusco, Denis Škalic, Jasna Jakovčević and Margareta Buterer for their help with sampling and sample analysis. We are grateful to MF, VS, and DŠ for cheering up the atmosphere in the laboratory.
Conflict of interest
The authors declare that the research was conducted in the absence of any commercial or financial relationships that could be construed as a potential conflict of interest.
Publisher’s note
All claims expressed in this article are solely those of the authors and do not necessarily represent those of their affiliated organizations, or those of the publisher, the editors and the reviewers. Any product that may be evaluated in this article, or claim that may be made by its manufacturer, is not guaranteed or endorsed by the publisher.
Supplementary material
The Supplementary Material for this article can be found online at: https://www.frontiersin.org/articles/10.3389/fevo.2025.1498307/full#supplementary-material
References
Aubry F. B., Cossarini G., Acri F., Bastianini M., Bianchi F., Camatti E., et al. (2012). Plankton communities in the northern adriatic sea: patterns and changes over the last 30 years. Estuarine Coast. Shelf Sci. 115, 125–137. doi: 10.1016/j.ecss.2012.03.011
Bergamasco A., Oguz T., Malanotte-Rizzoli P. (1999). Modeling dense water mass formation and winter circulation in the northern and central adriatic sea. J. Mar. Syst. 20, 279–3005. doi: 10.1016/S0924-7963(98)00087-6
Bernardi Aubry F., Acri F., Bastianini M., Bianchi F., Cassin D., Pugnetti A., et al. (2006). Seasonal and interannual variations of phytoplankton in the gulf of venice (Northern adriatic sea). Chem. Ecol. 22 (sup1), S71–S91. doi: 10.1080/02757540600687962
Bernardi Aubry F., Acri F., Finotto S., Pugnetti A. (2021). Phytoplankton dynamics and water quality in the venice lagoon. Water 13 (19), 2780. doi: 10.3390/w13192780
Bosak S., Godrijan J., Šilović T. (2016). Dynamics of the marine planktonic diatom family chaetocerotaceae in a mediterranean coastal zone. Estuarine Coast. Shelf Sci. 180, 69–81. doi: 10.1016/j.ecss.2016.06.026
Cabrini M., Fornasaro D., Cossarini G., Lipizer M., Virgilio D. (2012). Phytoplankton temporal changes in a coastal northern adriatic site during the last 25 years. Estuar. Coast. Shelf Sci. 115, 113–124. doi: 10.1016/j.ecss.2012.07.007
Casabianca S., Capellacci S., Ricci F., Scardi M., Penna A. (2022). A phytoplankton time series in the northwestern adriatic sea: structure and dynamics of the assemblages in a coastal ecosystem. Estuarine Coast. Shelf Sci. 278, 108109. doi: 10.1016/j.ecss.2022.108109
Cerino F., Fornasaro D., Kralj M., Giani M., Cabrini M. (2019). Phytoplankton temporal dynamics in the coastal waters of the north-eastern adriatic sea (Mediterranean sea) from 2010 to 2017. Nat. Conserv. 34, 343–372. doi: 10.3897/natureconservation.34.30720
Chesson P. (2000). Mechanisms of maintenance of species diversity. Annu. Rev. Ecology Evolution Systematics 31, 343–366. doi: 10.1146/annurev.ecolsys.31.1.343
Cibic T., Baldassarre L., Cerino F., Comici C., Fornasaro D., Kralj M., et al. (2022). Benthic and pelagic contributions to primary production: experimental insights from the gulf of trieste (Northern adriatic sea). Front. Mar. Sci. 9. doi: 10.3389/fmars.2022.877935
Coll M., Piroddi C., Albouy C., Lasram F. B. R., Cheung W. W.L., Christensen V., et al. (2012). The mediterranean sea under siege: spatial overlap between marine biodiversity, cumulative threats and marine reserves. Global Ecol. Biogeography: A J. Macroecology 21, 465–480. doi: 10.1111/j.1466-8238.2011.00697.x
Cozzi S., Giani M. (2011). River water and nutrient discharges in the northern adriatic sea: current importance and long term changes. Continental Shelf Res. 31, 1881–1935. doi: 10.1016/j.csr.2011.08.010
Cozzi S., Ibáñez C., Lazar L., Raimbault P., Giani M. (2019). Flow regime and nutrient-loading trends from the largest south European watersheds: implications for the productivity of mediterranean and black sea’s coastal areas. Water 11 (1), 1. doi: 10.3390/w11010001
Cushman-Roisin B., Gacic M., Poulain P.-M., Artegiani A. (2001). Physical oceanography of the adriatic sea: past, present and future. Dordrecht, Netherlands: Springer. doi: 10.1007/978-94-015-9819-4
Degobbis D., Precali R., Ivancic I., Smodlaka N., Fuks D., Kveder S. (2000). Long-term changes in the northern adriatic ecosystem related to anthropogenic eutrophication. Int. J. Environ. pollut. 13, 495–533. doi: 10.1504/IJEP.2000.002332
De Lazzari A., Berto D., Cassin D., Boldrin A., Giani M. (2008). Influence of winds and oceanographic conditions on the mucilage aggregation in the northern adriatic sea in 2003–2006. Mar. Ecol. 29, 469–825. doi: 10.1111/j.1439-0485.2008.00268.x
Djakovac T., Degobbis D., Supić N., Precali R. (2012). Marked reduction of eutrophication pressure in the northeastern adriatic in the period 2000–2009. Estuarine Coast. Shelf Sci. 115, 25–32. doi: 10.1016/j.ecss.2012.03.029
Dufrene M., Legendre P. (1997). Species assemblages and indicator species: the need for a flexible asymmetrical approach. Ecol. Monogr. 67, 345–665. doi: 10.2307/2963459
Fuks D., Ivancic I., Najdek M., Lucic D., Njire J., Godrijan J., et al. (2012). Changes in the planktonic community structure related to trophic conditions: the case study of the northern adriatic sea. J. Mar. Syst., 96–97, 95–102. doi: 10.1016/j.jmarsys.2012.02.006
Giani M., Djakovac T., Degobbis D., Cozzi S., Solidoro C., Umani S. F. (2012). Recent changes in the marine ecosystems of the northern adriatic sea. Estuarine Coast. Shelf Sci. 115, 1–13. doi: 10.1016/j.ecss.2012.08.023
Giani M., Ogrinc N., Tamše S., Cozzi S. (2023). Elevated river inputs of the total alkalinity and dissolved inorganic carbon in the northern adriatic sea. Water 15, 1–22. doi: 10.3390/w15050894
Gilmartin M., Degobbis D., Revelante N., Smodlaka N. (1990). The mechanism controlling plant nutrient concentrations in the northern adriatic sea. Internationale Rev. Der Gesamten Hydrobiologie 75, 425–445. doi: 10.1002/iroh.19900750402
Godrijan J., Marić D., Tomažić I., Precali R., Pfannkuchen M. (2013). Seasonal phytoplankton dynamics in the coastal waters of the north-eastern adriatic sea. J. Sea Res. 77, 32–44. doi: 10.1016/j.seares.2012.09.009
Grižančić L., Baričević A., Tanković M. S., Vlašiček I., Knjaz M., Podolšak I., et al. (2023). A metabarcode based (species) inventory of the northern adriatic phytoplankton. Biodiversity Data J. 11, e106947. doi: 10.3897/BDJ.11.e106947
Harding L. W. J. R., Degobbis D., Precali R. (1999). “Production and fate of phytoplankton: annual cycles and interannual variability,” in Ecosystem at the Land-Sea Margin: Drainage Basin to Coastal Sea, Eds. Malone T. C., Malej A., Harding L. W. Jr., Smodlaka N., Turner R. E.. (Washington (MD): American Geophysical Union (AGU)), 131–172. doi: 10.1029/CE055p0131
Hays G. C., Richardson A. J., Robinson C. (2005). Climate change and marine plankton. Trends Ecol. Evol. 20, 337–445. doi: 10.1016/j.tree.2005.03.004
Hopkins T. S., Artegiani A., Kinder C., Pariante R. (1999). A discussion of the northern adriatic circulation and flushing as determined from the ELNA hydrography. Adriatic Sea 32, 85–106.
Ivančič I., Degobbis D. (1984). An optimal manual procedure for ammonia analysis in natural waters by the indophenol blue method. Water Res. 18, 1143–1475. doi: 10.1016/0043-1354(84)90230-6
Ivančić I., Degobbis D. (1987). Mechanisms of production and fate of organic phosphorus in the northern adriatic sea. Mar. Biol. 94, 117–125. doi: 10.1007/BF00392904
Ivančić I., Godrijan J., Pfannkuchen M., Marić D., Gašparović B., Djakovac T., et al. (2012). Survival mechanisms of phytoplankton in conditions of stratification-induced deprivation of orthophosphate: northern adriatic case study. Limnology Oceanography 57, 1721–1315.
Ivančić I., Pfannkuchen M., Godrijan J., Djakovac T., Pfannkuchen D. M., Korlević M., et al. (2016). Alkaline phosphatase activity related to phosphorus stress of microphytoplankton in different trophic conditions. Prog. Oceanography 146, 175–186. doi: 10.1016/j.pocean.2016.07.003
Legendre P., Legendre L. F.J. (2014). “Numerical ecology,” in Developments in Environmental Modelling 20, 2nd ed (Elsevier Science & Technology). Available at: https://books.google.com/books/about/Numerical_Ecology.html?id=KBoHuoNRO5MC (Accessed September 4, 2024).
Ljubešić Z., Bosak S., Viličić D., Borojević K. K., Marić D., Godrijan J., et al. (2011). Ecology and taxonomy of potentially toxic pseudo-nitzschia species in lim bay (north-eastern adriatic sea). Harmful Algae 10, 713–225. doi: 10.1016/j.hal.2011.06.002
Longobardi L., Dubroca L., Margiotta F., Sarno D., Zingone A. (2022). Photoperiod − Driven rhythms reveal multi − Decadal stability of phytoplankton communities in a highly fluctuating coastal environment. Sci. Rep. 12 (1), 3908. doi: 10.1038/s41598-022-07009-6
Maechler M., Rousseeuw P., Struyf A., Hubert M., Hornik K. (2022). Cluster: cluster analysis basics and extensions. Available online at: https://CRAN.R-project.org/package=cluster (Accessed August 28, 2024).
Marić D., Kraus R., Godrijan J., Supić N., Djakovac T., Precali R. (2012). Phytoplankton response to climatic and anthropogenic influences in the north-eastern adriatic during the last four decades. Estuarine Coast. Shelf Sci. 115, 98–112. doi: 10.1016/j.ecss.2012.02.003
Marić Pfannkuchen D., Godrijan J., Tanković M. S., Baričević A., Kužat N., Djakovac T., et al. (2018). The ecology of one cosmopolitan, one newly introduced and one occasionally advected species from the genus skeletonema in a highly structured ecosystem, the northern adriatic. Microbial Ecol. 75, 674–875. doi: 10.1007/s00248-017-1069-9
Mentaschi L., Lovato T., Butenschön M., Alessandri J., Aragão L., Verri G., et al. (2024). Projected climate oligotrophication of the adriatic marine ecosystems. Front. Climate 6. doi: 10.3389/fclim.2024.1338374
Mihanović H., Vilibić I., Šepić J., Matić F., Ljubešić Z., Mauri E., et al. (2021). Observation, preconditioning and recurrence of exceptionally high salinities in the adriatic sea. Front. Mar. Sci. 8. doi: 10.3389/fmars.2021.672210
Montresor M., Prisco C., Sarno D., Margiotta F., Zingone A. (2013). Diversity and germination patterns of diatom resting stages at a coastal mediterranean site. Mar. Ecol. Prog. Ser. 484, 79–95. doi: 10.3354/meps10236
Mozetič P., Francé J., Kogovšek T., Talaber I., Malej A. (2012). Plankton trends and community changes in a coastal sea (northern adriatic): bottom-up vs. Top-down control in relation to environmental drivers. Estuarine Coast. Shelf Sci. 115, 138–148. doi: 10.1016/j.ecss.2012.02.009
Mozetič P., Solidoro C., Cossarini G., Socal G., Precali R., Francé J., et al. (2010). Recent trends towards oligotrophication of the northern adriatic: evidence from chlorophyll a time series. Estuaries Coasts 33, 362–755. doi: 10.1007/s12237-009-9191-7
Najdek M., Blažina M., Djakovac T., Kraus R. (2005). The role of the diatom cylindrotheca closterium in a mucilage event in the northern adriatic sea: coupling with high salinity water intrusions. J. Plankton Res. 27, 851–625. doi: 10.1093/plankt/fbi057
Naselli-Flores L., Padisák J. (2023). Ecosystem services provided by marine and freshwater phytoplankton. Hydrobiologia 850, 2691–2706. doi: 10.1007/s10750-022-04795-y
Neri F., Romagnoli T., Accoroni S., Ubaldi M., Garzia A., Pizzuti A., et al. (2023). Phytoplankton communities in a coastal and offshore stations of the northern adriatic sea approached by network analysis and different statistical descriptors. Estuarine Coast. Shelf Sci. 282, 108224. doi: 10.1016/j.ecss.2023.108224
Ninčević-Gladan Ž., Bužančić M., Kušpilić G., Grbec B., Matijević S., Skejić S., et al. (2015). The response of phytoplankton community to anthropogenic pressure gradient in the coastal waters of the eastern adriatic sea. Ecol. Indic. 56, 106–115. doi: 10.1016/j.ecolind.2015.03.018
Ogle D. H., Doll J. C., Wheeler A.P., Dinno A. (2025). FSA: simple fisheries stock assessment methods. Available online at: https://CRAN.R-project.org/package=FSA (Accessed September 6, 2024).
Oksanen J., Simpson G. L., Guillaume Blanchet F., Kindt R., Legendre P., Minchin P. R., et al. (2022). Vegan: community ecology package. Available online at: https://cran.r-project.org/package=vegan (Accessed September 6, 2024).
Parsons T. R., Maita Y., Lalli C. M. (1984). A manual of chemical and biological methods for seawater analysis. 1st ed. Pergamon international library of science, technology, engineering, and social studies (Oxford: Pergamon Press).
Pielou E. C. (1966). The measurement of diversity in different types of biological collections. J. Theor. Biol. 13, 131–144. doi: 10.1016/0022-5193(66)90013-0
Precali R., Giani M., Marini M., Grilli F., Ferrari C. R., Pecar O., et al. (2005). Mucilaginous aggregates in the northern Adriatic in the period 1999–2002: typology and distribution. Sci. Total Environ. 353 (1-3), 10–23.
Redfield A. C., Ketchum B. H., Richards F. A. (1963). “The influence of organisms on the composition of sea-water,” in The Sea, vol. 2 . Ed. Hill M. N. (Interscience Publishers, New York), 26–77.
Revelante N., Gilmartin M. (1991). The phytoplankton composition and population enrichment in gelatinous ‘Macroaggregates’ in the northern adriatic during the summer of 1989. J. Exp. Mar. Biol. Ecol. 146, 217–233. doi: 10.1016/0022-0981(91)90027-T
Roberts D. W. (2019). Labdsv: ordination and multivariate analysis for ecology. Available online at: https://cran.r-project.org/package=labdsv (Accessed September 3, 2024).
Russo A., Maccaferri S., Djakovac T., Precali R., Degobbis D., Deserti M., et al. (2005). Meteorological and oceanographic conditions in the northern adriatic sea during the period June 1999–July 2002: influence on the mucilage phenomenon. Mucilages Adriatic Tyrrhenian Seas 353, 24–385. doi: 10.1016/j.scitotenv.2005.09.058
Shannon C. E. (1948). A mathematical theory of communication. Bell System Tech. J. 27, 379–423. doi: 10.1002/j.1538-7305.1948.tb01338.x
Sieburth J. M., Smetacek V., Lenz J. (1978). Pelagic ecosystem structure: heterotrophic compartments of the plankton and their relationship to plankton size fractions 1. Limnology Oceanography 23, 1256–1635. doi: 10.4319/lo.1978.23.6.1256
Skejić S., Roje B. M., Matić F., Arapov J., Francé J., Bužančić M., et al. (2024). Phytoplankton assemblage over a 14-year period in the adriatic sea: patterns and trends. Biology 13 (7), 493. doi: 10.3390/biology13070493
Smodlaka Tanković M., Baričević A., Perusco V. S., Melzer R. R., Lopez A. I., Dömel J. S., et al. (2018). Experimental evidence for shaping and bloom inducing effects of decapod larvae of xantho poressa (Olivi 1792) on marine phytoplankton. J. Mar. Biol. Assoc. United Kingdom. 98 (8), 1881–1887. doi: 10.1017/S0025315418000449
Soana E., Gervasio M. P., Granata T., Colombo D., Castaldelli G. (2024). Climate change impacts on eutrophication in the po river (Italy): temperature-mediated reduction in nitrogen export but no effect on phosphorus. J. Environ. Sci. 143, 148–163. doi: 10.1016/j.jes.2023.07.008
Strickland J. D. H. (1968). A practical handbook of seawater analysis. Fish. Res. Bd. Canada Bull. 167, 185–194.
Totti C., Cangini M., Ferrari C., Kraus R., Pompei M., Pugnetti A., et al. (2005). Phytoplankton size-distribution and community structure in relation to mucilage occurrence in the northern adriatic sea. Mucilages Adriatic Tyrrhenian Seas 353, 204–175. doi: 10.1016/j.scitotenv.2005.09.028
Totti C., Romagnoli T., Accoroni S., Coluccelli A., Pellegrini M., Campanelli A., et al. (2019). Phytoplankton communities in the northwestern adriatic sea: interdecadal variability over a 30-years period, (1988–2016) and relationships with meteoclimatic drivers. J. Mar. Syst. 193, 137–153. doi: 10.1016/j.jmarsys.2019.01.007
Turk Dermastia T., Cerino F., Stanković D., Francé J., Ramšak A., Tušek M. Ž., et al. (2020). Ecological time series and integrative taxonomy unveil seasonality and diversity of the toxic diatom pseudo-nitzschia H. Peragallo in the northern adriatic sea. Harmful Algae 93, 101773. doi: 10.1016/j.hal.2020.101773
Utermöhl H. (1958). Zur vervollkommnung der quantitativen phytoplanktonmethodik. SIL Communications 1953-1996 9, 1–38.
Vadrucci M. R., Cabrini M., Basset A. (2007). Biovolume determination of phytoplankton guilds in transitional water ecosystems of mediterranean ecoregion. Trans. Waters Bull. 1, 83–102. doi: 10.1285/i1825229Xv1n2p83
Vascotto I., Aubry F. B., Bastianini M., Mozetič P., Finotto S., Francé J. (2024). Exploring the mesoscale connectivity of phytoplankton periodic assemblages’ Succession in northern adriatic pelagic habitats. Sci. Total Environ. 913, 169814. doi: 10.1016/j.scitotenv.2023.169814
Vascotto I., Mozetič P., Francé J. (2021). Phytoplankton time-series in a LTER site of the adriatic sea: methodological approach to decipher community structure and indicative taxa. Water 13, 20455. doi: 10.3390/w13152045
Vilibić I. (2003). An analysis of dense water production on the north adriatic shelf. Estuarine Coast. Shelf Sci. 56, 697–707. doi: 10.1016/S0272-7714(02)00277-9
Vilibić I., Šepić J., Proust N. (2013). Weakening thermohaline circulation in the adriatic sea. Climate Res. 55, 217–225. doi: 10.3354/cr01128
Vilicic D., Bosak S., Buric Z., Caput-Mihalic K. (2007). Phytoplankton Seasonality and Composition along the Coastal NE Adriatic Sea during the Extremely Low Po River Discharge in 2006. Acta Botanica Croatica 66, 101.
Viličić D., Djakovac T., Burić Z., Bosak S. (2009). Composition and annual cycle of phytoplankton assemblages in the northeastern adriatic sea. Bot. Mar. 52, 291–305. doi: 10.1515/BOT.2009.004
Viličić D., Marasović I., Mioković D. (2002). Checklist of phytoplankton in the eastern adriatic sea. Acta Botanica Croatica 61, 57–91.
Worm B., Hilborn R., Baum J. K., Branch T. A., Collie J. S., Costello C., et al. (2009). Rebuilding global fisheries. Science 325, 578–585. doi: 10.1126/science.1173146
Zhang F., Wen Z., Wang S., Tang W., Luo Y.-W., Kranz S. A., et al. (2022). Phosphate limitation intensifies negative effects of ocean acidification on globally important nitrogen fixing cyanobacterium. Nat. Commun. 13, 67305. doi: 10.1038/s41467-022-34586-x
Keywords: phytoplankton, cluster analysis, long term changes, Adriatic Sea, seasonality
Citation: Vlašiček I, Marić Pfannkuchen D, Smodlaka Tanković M, Baričević A, Kužat N, Knjaz M, Grižančić L, Podolšak I, Kogovšek T and Pfannkuchen M (2025) Cluster analysis of long-term phytoplankton data from the Northern Adriatic reveals environmental influences and disruptions in seasonal patterns. Front. Ecol. Evol. 13:1498307. doi: 10.3389/fevo.2025.1498307
Received: 18 September 2024; Accepted: 14 February 2025;
Published: 03 March 2025.
Edited by:
Manel Leira, University of Santiago de Compostela, SpainReviewed by:
Da Huo, Chinese Academy of Sciences (CAS), ChinaElżbieta Zębek, University of Warmia and Mazury in Olsztyn, Poland
Copyright © 2025 Vlašiček, Marić Pfannkuchen, Smodlaka Tanković, Baričević, Kužat, Knjaz, Grižančić, Podolšak, Kogovšek and Pfannkuchen. This is an open-access article distributed under the terms of the Creative Commons Attribution License (CC BY). The use, distribution or reproduction in other forums is permitted, provided the original author(s) and the copyright owner(s) are credited and that the original publication in this journal is cited, in accordance with accepted academic practice. No use, distribution or reproduction is permitted which does not comply with these terms.
*Correspondence: Daniela Marić Pfannkuchen, ZG1hcmljQGlyYi5ocg==