 Chao-fan Guo
 Dongliang Zhao2
- 1College of Business, Quzhou University, Quzhou, Zhejiang, China
- 2College of Resources Environment and Tourism, Capital Normal University, Beijing, China
Introduction: Understanding the landscape evolution and driving mechanisms in the Yellow River Basin (YRB) is crucial for safeguarding the ecological environment and promoting high-quality development in the region.
Methods: The analysis of spatio-temporal evolution characteristics of land use/land cover (LULC) and landscape pattern (LP) in the YRB employed transfer matrix and landscape pattern index models. Furthermore, a random forest regression method was utilized to investigate the driving mechanism behind landscape evolution.
Results: Based on our research findings, it is evident that significant changes have occurred in LULC, which have had profound implications for regional landscape patterns. The evolution of these patterns can be categorized into distinct stages. Between 1985 and 2010, there was a noticeable increase in clustering and interconnectedness, while between 2010 and 2020, this trend shifted. Grassland transformation primarily influenced landscape pattern evolution, whereas other LULC classifications had relatively limited effects on overall landscape integrity, diversity, and connectivity. Changes in grassland predominantly occurred at the outskirts of established grassland regions, while alterations in other LULC classifications were more sporadic due to human activities exerting influence.
Discussion: Landscape evolution is synthetically influenced by both social and natural factors. Local changes are driven by social factors, while long-term gradual changes are primarily shaped by natural factors. Over the past three decades, social factors have played a significant role in shaping YRB’s landscapes.
1 Introduction
A river basin refers to a complex natural geographic region that is shaped by the flow of river water and the presence of groundwater (Deng et al., 1988). The river basin ecosystem plays an important role in human reproduction and social development (Mavhaire et al., 2025). Nevertheless, due to the dynamic natural environment and human interference, the landscape elements and spatial structure of basin are constantly changing. Consequently, the river basin ecology has become the most intricate and challenging geographical unit in terms of regional human-land relationships (Wu et al., 2024). Therefore, conducting a comprehensive examination of both spatial and temporal attributes of basin landscapes, as well as understanding their underlying driving forces, is crucial for gaining profound insights into basin ecosystem evolution. This understanding is essential for developing effective strategies for basin planning and restoration.
Land use/land cover (LULC) represents the most conspicuous manifestation of the landscape, being closely intertwined with human activities related to land operation and management. When analyzing LULC, it is crucial to investigate the characteristics of land resources, layout and structure of land use, degree and impact of utilization, as well as existing issues within the study area (Zhang et al., 2023). Additionally, some researchers utilize the index to demonstrate the progression of landscape evolution in the dimension of landscape pattern (LP). A landscape index is a concise numerical indicator that summarizes the characteristics of a landscape’s structural composition and spatial configuration, providing a succinct overview of specific landscape pattern features. The utilization of elementary mathematical operations facilitates the establishment of connections between landscape structures and processes, thereby enhancing the comprehension of landscape functioning at a profound level. This approach represents a fundamental methodology for investigating the evolution of landscape patterns (O’Neill et al., 1988). Research on landscape indices has been influenced by various theoretical frameworks over the past four decades, ranging from island biogeography theory (O’Neill et al., 1988). to infiltration theory (Laner et al., 2024), information theory (Konapala et al., 2020), and spatial theory (Guo et al., 2023). This research has led to the development of a series of landscape indices including patch metrics, class metrics, and landscape metrics. These indices have greatly advanced our understanding of the state, trends, and dynamics of ecosystems such as wetlands (Guo et al., 2024), cities (Liang and Gong, 2020), and forests (Hou et al., 2023). Regrettably, the association between LULC and LP has not received sufficient scholarly attention. Further investigation is necessary to ascertain whether these two models can comprehensively capture the distinct characteristics of regional landscapes.
The factors driving landscape evolution in a river basin encompass the elements that contribute to alterations in LULC or land productivity, ultimately influencing the direction of the landscape. Control over the process of landscape evolution can be achieved through an investigation into landscape-driving mechanisms. Landscape evolution is influenced by two primary categories of factors: natural factors and social factors (Hu et al., 2012; Liu et al., 2021). The natural factors primarily include climate, hydrology, topography, and biodiversity, while the social factors encompass economics, science and technology, culture, and policies. Endogenous changes in landscape evolution are predominantly influenced by natural factors that exert a particularly strong impact on large-scale landscape change. However, these endogenous changes require a long-term gradual process. On the other hand, social factors mainly affect smaller areas leading to rapid l change in LULC, which subsequently contributes to landscape evolution. Currently, most researchers adopt a unified approach to investigate how both natural and social factors drive basin-level landscape evolution either through analyzing LULC or LP dimensions (Li et al., 2020, 2014; Zhao et al., 2023). It is important to consider whether these two analytical methods yield similar or distinct conclusions regarding the driving mechanisms.
The Yellow River Basin (YRB) plays a crucial role in upholding ecological security and is regarded as one of China’s most vital basin ecosystems. It encompasses the eastern, central, and western regions of China. In September 2019, the national leader of China further emphasized the significance of the YRB by elevating “ecological protection and high-quality development of the Yellow River Basin” to a major national strategy. This paper focuses on analyzing landscape characteristic changes and their driving factors over the past 35 years in the YRB using LULC data from 1985 to 2020, along with corresponding social and natural data. The dimensions considered include LULC and LP. The findings from this study are expected to provide fundamental insights for safeguarding the YRB.
2 Study area
The Yellow River, the second longest river in China, originates from the Qinghai-Tibetan Plateau and traverses nine provinces: Qinghai, Sichuan, Gansu, Ningxia, Inner Mongolia, Shanxi, Shaanxi, Henan and Shandong. With a main stream length of 5,464 km and a river drop variance of 4,480 m (Figure 1), it is geographically located between 95°50’ E-119°06’ E and 32°06’ N-41°48’ N. The basin spans approximately 7.52×10⁵ km2 with an east-west length of about 1,900 km and a north-south width of around 1,100 km. The YRB is divided into three main terraces, which correspond to the three primary geographical regions. The western section is located on the eastern side of the Tibetan Plateau, at an altitude exceeding 3,000 m. The central Loess Plateau ranges in altitude from 1,000 to 2,000 m, while the eastern part consists of a plain with an altitude below 100 m. The climate within the basin can be categorized into three climatic zones: plateau climate zone, mesothermal zone, and southern temperate zone. There is a gradual decrease in mean annual temperature from south to north and from east to west across the basin. Precipitation distribution also diminishes from south to north, with most of it occurring between July and October (Liu et al., 2022).
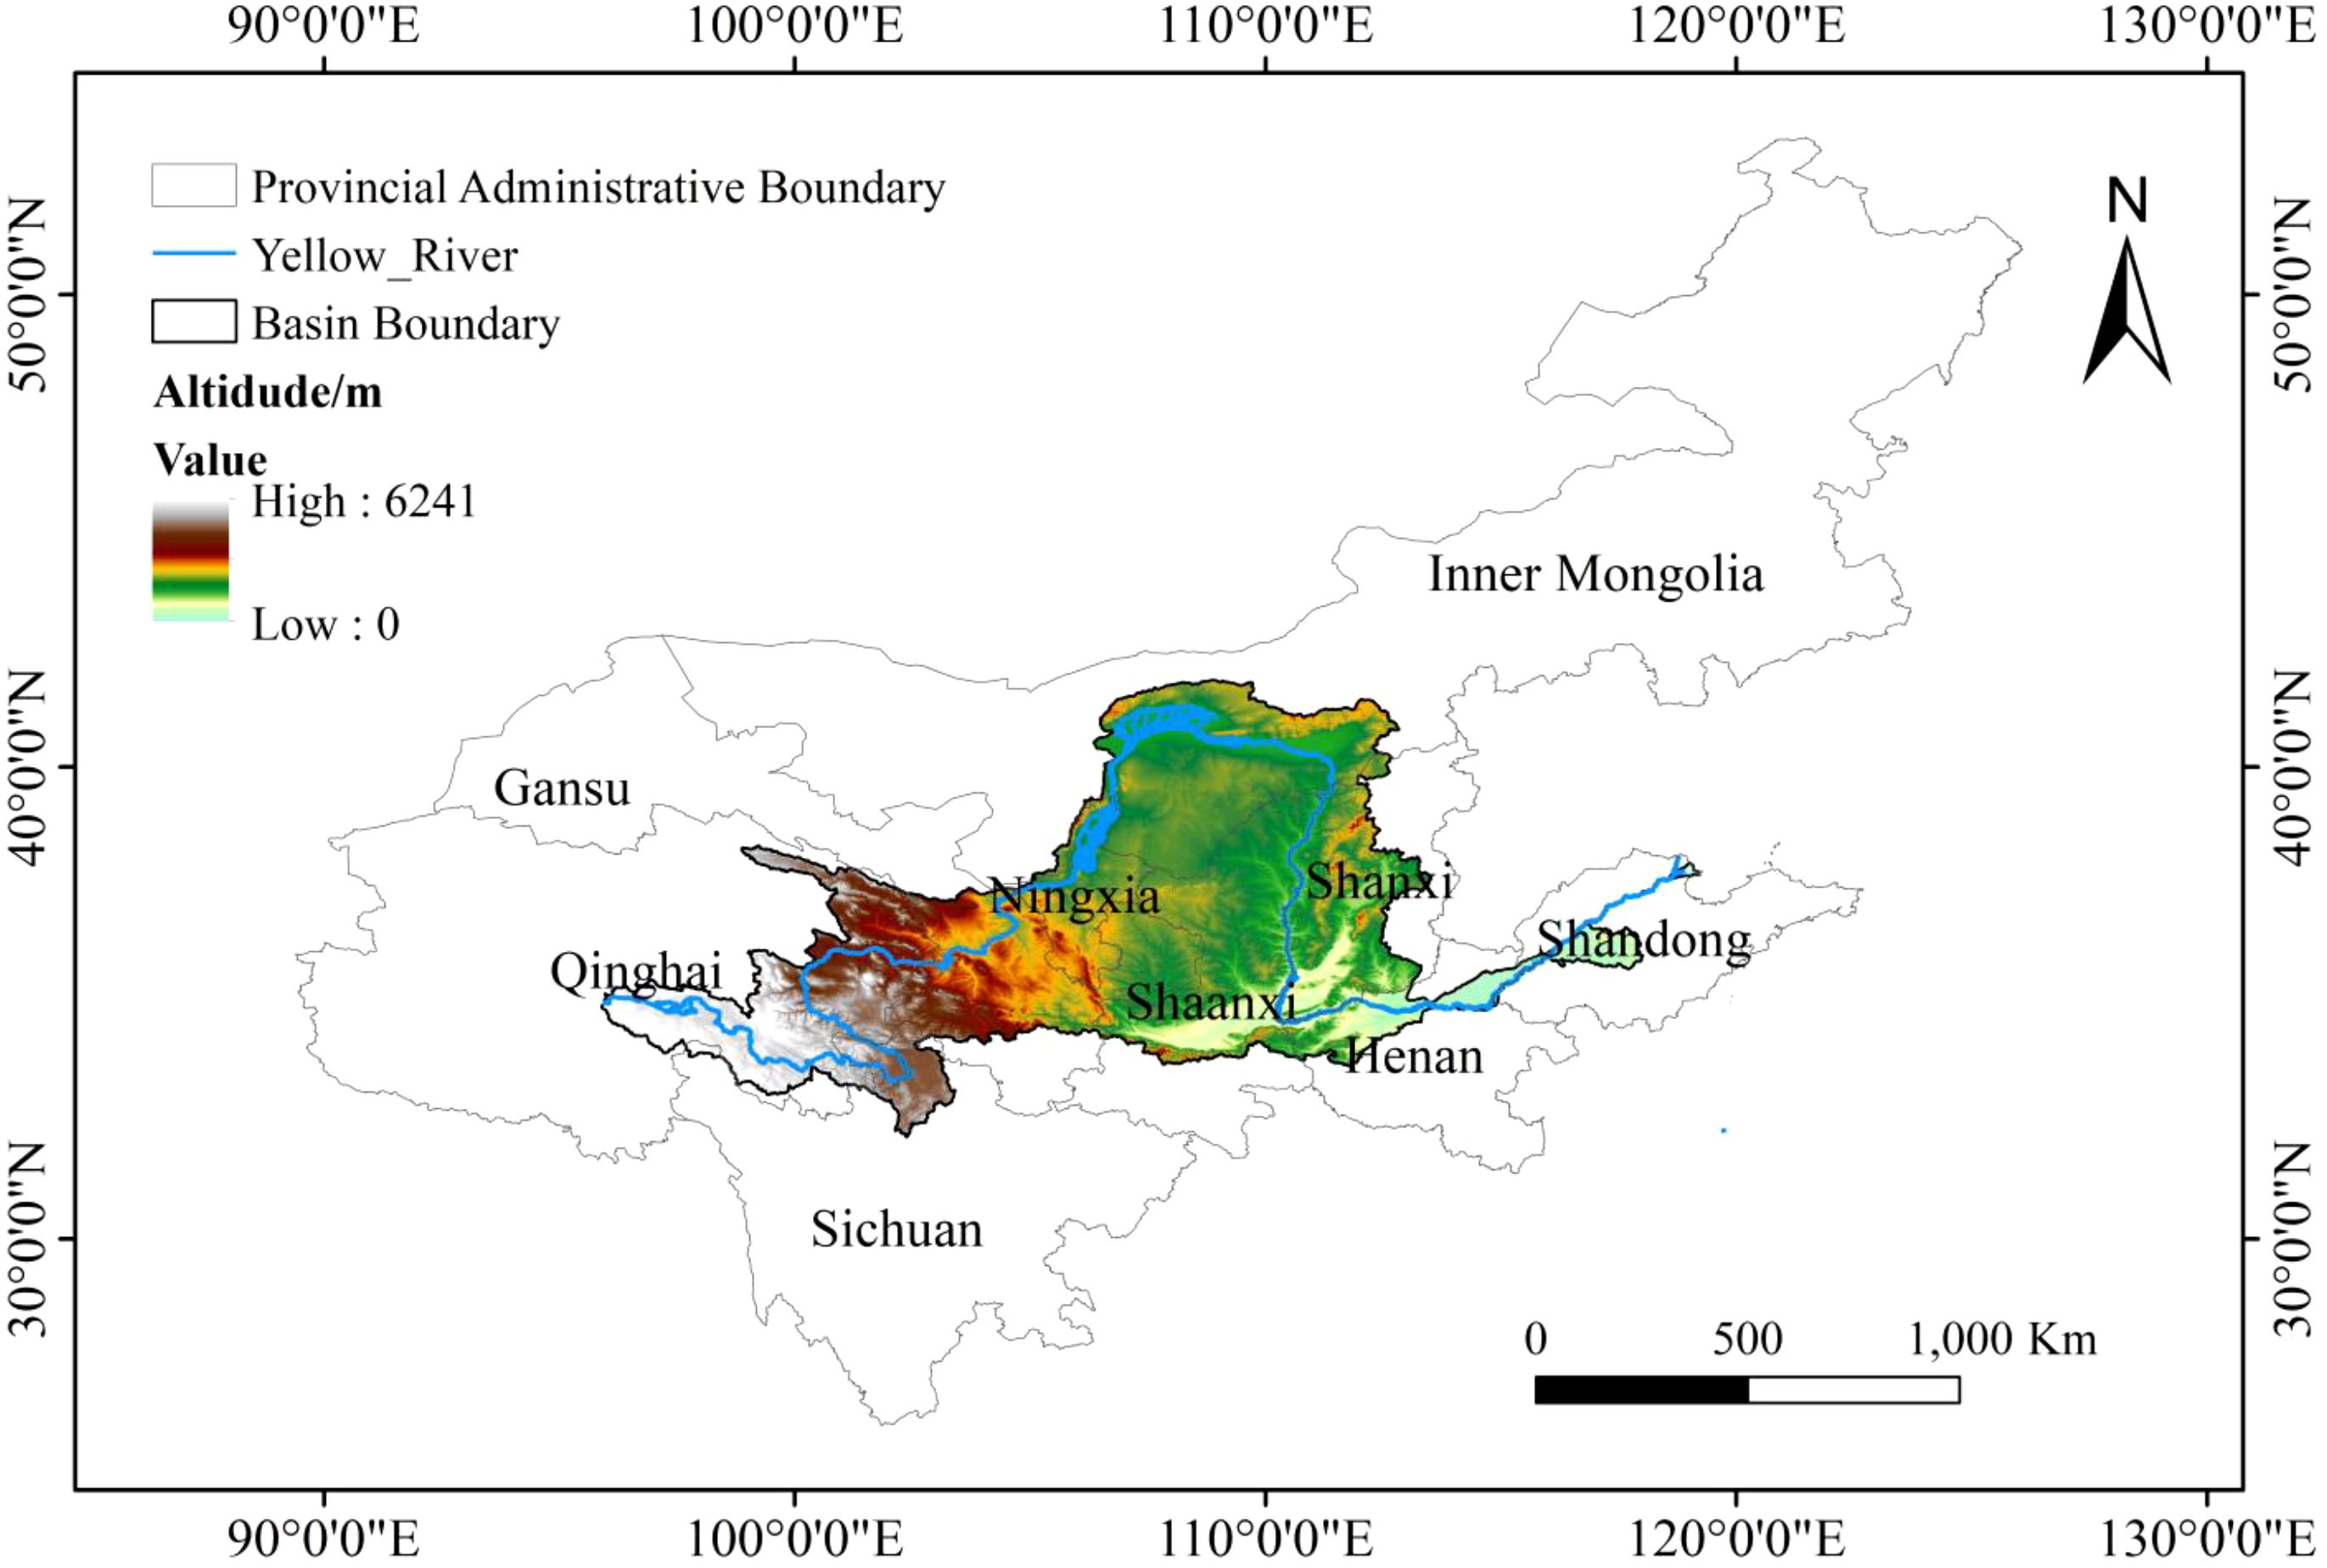
Figure 1. The location of study area.
3 Materials and methods
3.1 Data sources
The LULC data, with a spatial resolution of 30 m, were employed for the years 1985, 1990, 1995, 2000, 2005, 2010, and 2020. These data were obtained from the annual China Land Cover Dataset (CLCD), developed by Professors Yang Jie and Huang Xin from Wuhan University using Landsat imagery (Yang and Huang, 2021). Following the CLCD classification system and considering the observed land-use composition in the study area of interest (YRB), we reclassified the LULC into categories including farmland, forest land, grassland, water body, unused land and construction land. Forest land mainly includes the classes ‘Forest’ and ‘Shrub’; water body mainly include the classes ‘Water’ and ‘Wetland’; construction land mainly refers to the class ‘Impervious’; and unused land mainly refers to the class ‘Barren’, which, mainly refers to desert.
The formation and evolution of the landscape in river basin is frequently comprehensive consequence of socio-economic and natural factors. In consideration of the influence of social and natural factors on the scope and time-sensitive characteristics, this study selected seven social factors, including Total Population (TP), Non-agricultural Population (NAP), Year-end Actual Cultivated Land Area (YACLA), Gross Domestic Product (GDP), Primary Industry (PI), Secondary Industry (SI) and Tertiary industry (TI). Additionally, six natural factors such as Precipitation (Pr), Air Temperature (AT), Mean Relative Humidity (MRH), Surface Temperature (ST), Evaporation (EV) and Potential Evaporation (PEV) were analyzed for driving forces. The data for the social factors were obtained from the China Urban Statistical Yearbook and the statistical yearbooks of each province. The data for the natural factors were obtained from the National Meteorological Centre of the China Meteorological Administration (http://data.cma.cn/data), the Geo-Remote Sensing Ecological Network (http://www.gisrs.cn), and the Earth Resources Data Cloud (http://www.gis5g.com).
3.2 Research methodology
3.2.1 Calculation the land use/land cover change
The transfer matrix is employed to calculate the area of LUCC. The land use transfer matrix is a two-dimensional matrix based on the dynamic transformation relationship of land use status in the same region at different times. It can be used to visually represent the value and direction of LUCC over a period of time. It can also be used to reveal the spatial and temporal evolution of the area flow between different LULC classes (Li et al., 2020). The matrix is calculated using the following formula:
Where Sij is the land area (km²) of the LUCC class i transformed into j; n is the number of different LULC classes; i and j are the LULC classes before and after the transfer, respectively.
3.2.2 Construction of landscape index system
The landscape index is a quantitative measure that comprehensively captures the information of LP. It serves to depict the characteristics and dynamics of LP, as well as unveil the intricate relationship between LP and landscape processes. The significance of different landscape indices varies in accordance with their distinct physical and ecological attributes. Based on previous research (Liang and Gong, 2020; Hu et al., 2012) and the socio-economic development of the YRB, we developed a landscape index system for the study area (Table 1). The following landscape indices of class metrics were selected for analysis: Percentage of Landscape (PLAND), Largest Patch Index (LPI), Number of Patches (NP), Patch Density (PD), Landscape Shape Index (LSI) and Patch Cohesion Index (COHESION). At landscape metrics, the following indices were considered: Edge Density (ED), Contagion (CONTAG), Shannon’s Diversity Index (SHDI) and Simpson’s Evenness Index (SIEI). To facilitate data processing, the spatial resolution was resampled to 300 m × 300 m. All landscape pattern indices were calculated using Fragstats 4.2.1 software based on raster data. The ecological significance of these landscape pattern indices was derived from relevant references (Haines-Young and Chopping, 1996; Rodríguez-Loinaz et al., 2015).
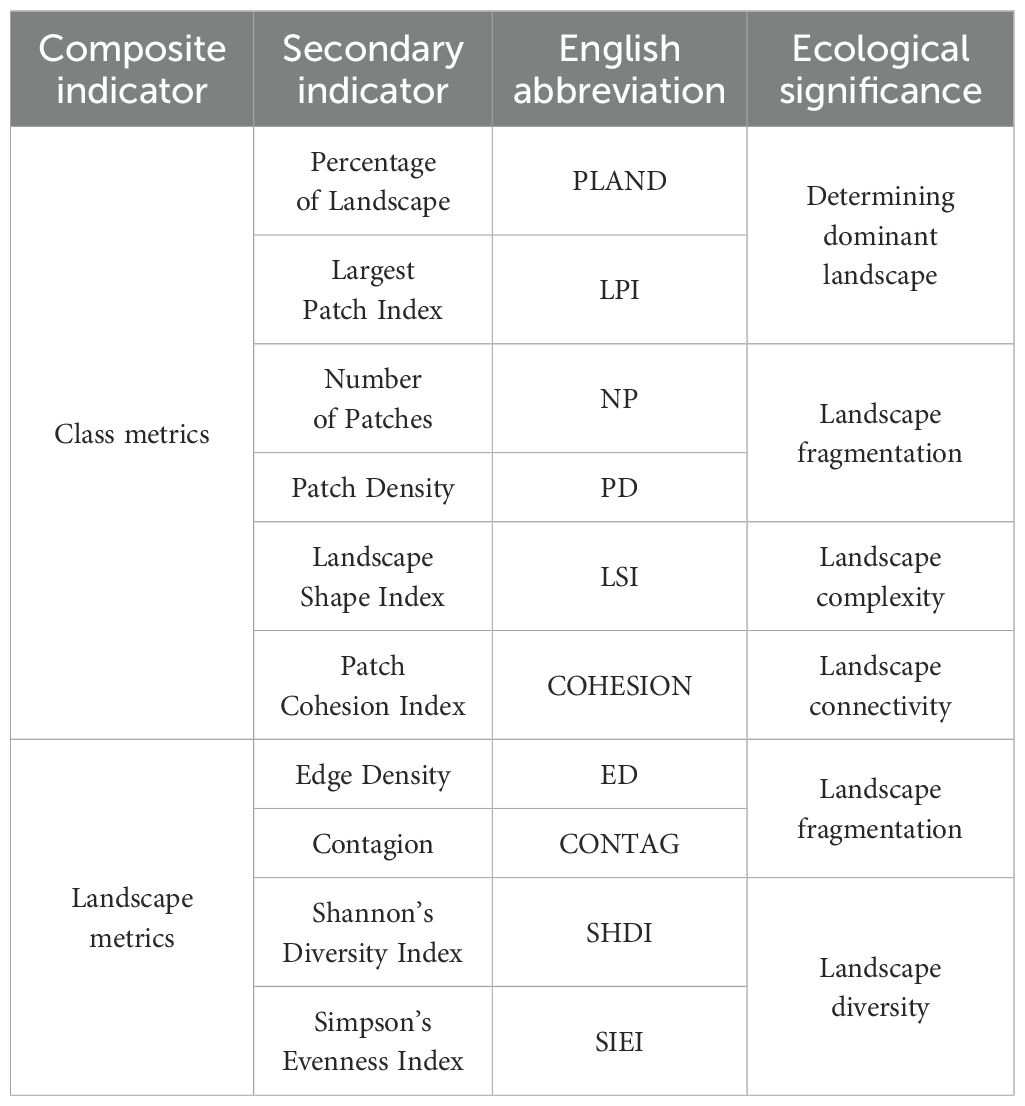
Table 1. The index system of landscape index.
3.2.3 Response relationship between LULC and LP
Researchers have postulated that LULC, as integral components of landscape elements, exhibit close associations with LP (Ning et al., 2020; Yang et al., 2022). To further validate this relationship, the response was investigated at class and landscape metric levels. The relationship between different LULC classification and landscape indices was examined using correlation analysis at the class metrics. Additionally, a regression model employing the least squares method was constructed to explore the relationship between landscape indices and various LULC classifications at landscape scale.
3.2.4 Driving force analysis
The predictor variables in this study were meticulously selected based on previous research findings, as well as considering the natural geographical features and socio-economic conditions of the YRB (Li et al., 2014; Liu et al., 2022). Thirteen potential social and natural factors were chosen for analysis using the random forest model in two dimensions: LULC and LP. The random forest method is an ensemble learning technique that offers several advantages, including high performance, the ability to handle high-dimensional data, and effective prevention of overfitting. During the construction of the Random Forest model, the algorithm performs feature sampling, ensuring that even in the presence of collinear features, they are unlikely to be selected simultaneously within the same decision tree. As a result, Random Forest effectively mitigates the impact of multicollinearity on model performance (Gao et al., 2022). This method utilizes bootstrap resampling by randomly selecting n observations from the original dataset. Subsequently, a subset of variables is chosen as classification tree nodes with the objective of constructing hundreds or even thousands of classification trees. These trees are then aggregated into a random forest, where the most frequently occurring tree is considered as the final outcome. In this study, we performed random forest regression analysis using R software, setting the ntree parameter to 2000 trees while keeping other parameters at their default values.
4 Results and analyses
4.1 Spatio-temporal characteristic of LULC
Based on the spatial and temporal distribution of LULC in the YRB (Figure 2), it is evident that grassland dominates, encompassing over 50% of the area during different time periods. Farmland represents the second largest landscape, primarily concentrated in the Hetao Plain, Weihe Plain, Ningxia Plain, and North China Plain. Forest land is the third largest landscape. Unused land is predominantly located in the upper reaches of the Yellow River, including Ulanbuh Desert, Kubuqi Desert, and Maowusu Desert. Construction land is mainly concentrated in urbanized areas within the central and lower regions of the basin. The composition of LULC classifications remained relatively consistent from 1985 to 2020.
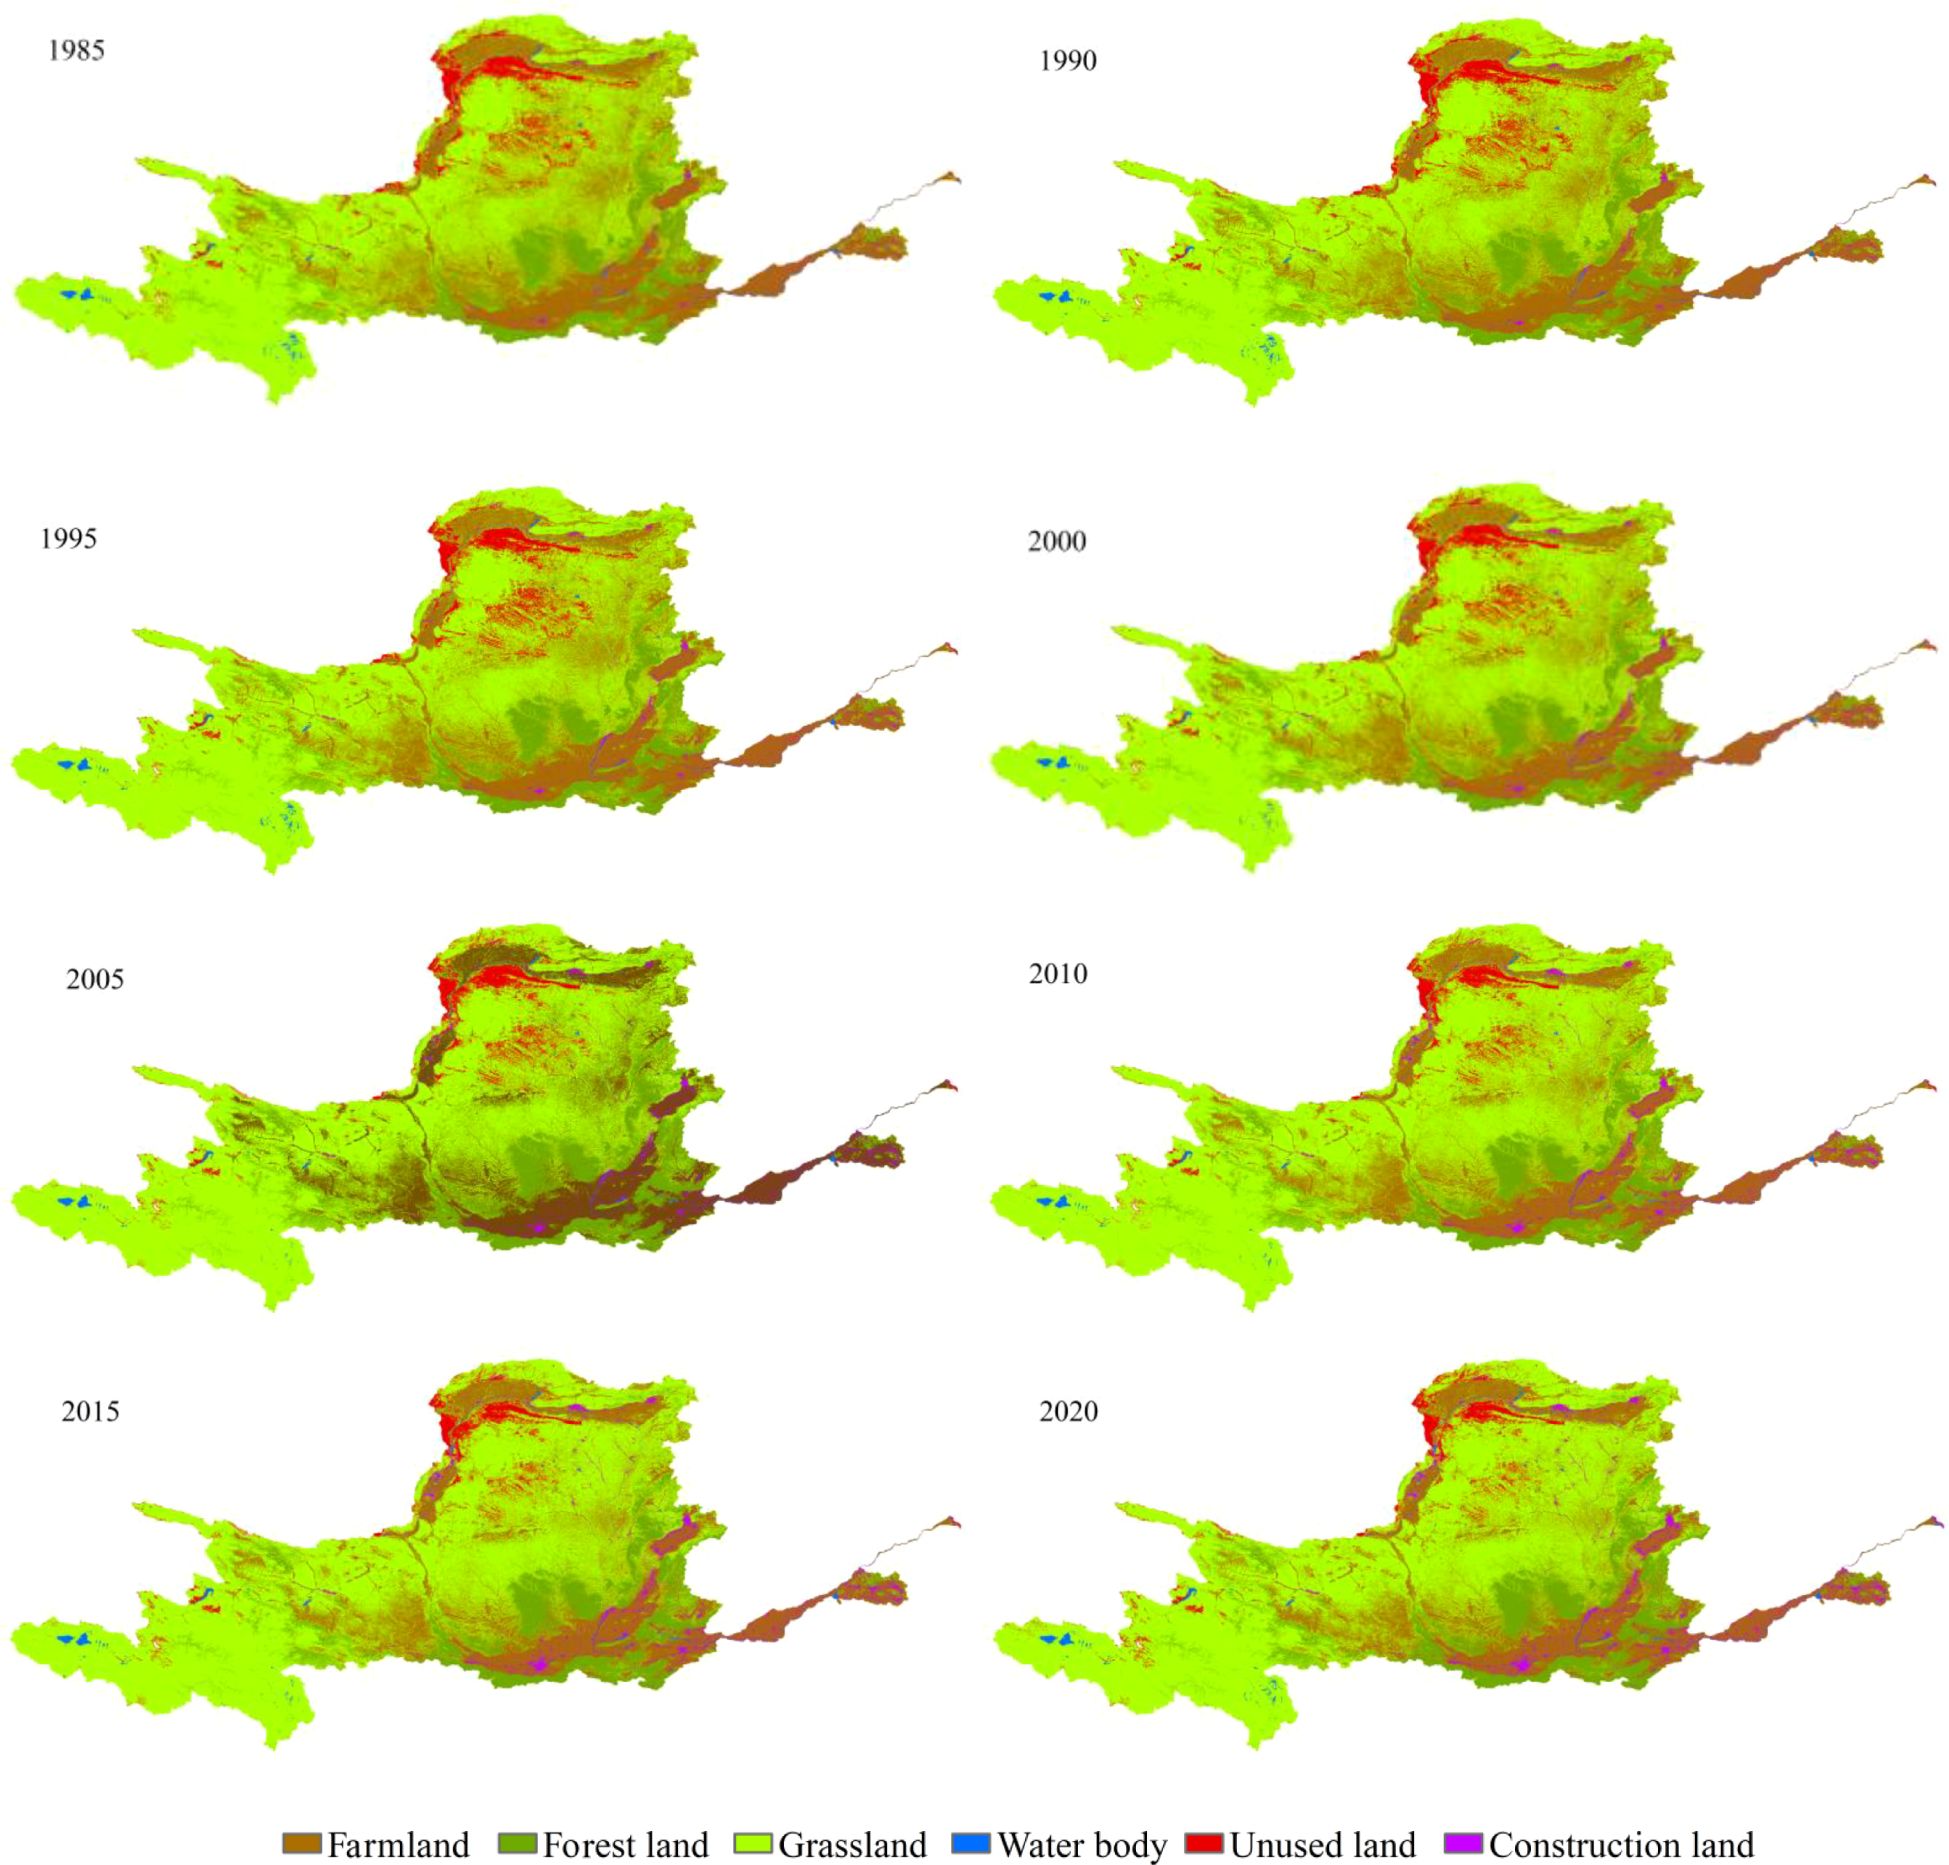
Figure 2. Land use/land cover classification in the Yellow River Basin from 1985 to 2020.
The transfer matrix of LULC in the YRB is presented in the Figure 3. Notably, a significant transformation has occurred between grassland and farmland from 1985 to 2020. The dominant phenomenon during the period from 1985 to 2015 was the conversion of farmland to grassland, encompassing an extensive area exceeding 19,917 km2. Conversely, the primary manifestation observed between 2015 and 2020 was the transformation from grassland to farmland, involving an approximate area of 1634 km². Another significant characteristic is exemplified by the reciprocal transformation between grassland and unused land. A series of policies for ecological environment protection and restoration, including the establishment of protective forests as part of the “Three Norths” project, preservation of natural forests, and implementation of the Beijing-Tianjin Sand Control Project initiated through human intervention, have contributed to a reduction in land desertification (Li et al., 2024, 2023). From 1985 to 2020, a total of 15,120 km² of previously unused land underwent transformation, resulting in the establishment of thriving grasslands. The effective control of desertification plays a pivotal role in the expansion of grassland areas and the reduction of unused land resources. It is worth noting that there was a remarkable increase in the extent of construction land between 1985 and 2020, with an overall growth rate reaching 17,188 km². Notably, during the period from 2005 to 2020, there was a substantial surge observed specifically in construction land area which experienced an impressive growth rate of 68.4%. Interestingly enough, more than sixty percent of this increment can be attributed to farmland conversion - often considered as an indispensable step towards urbanization and economic development (Huang et al., 2019). A comparative analysis of land use/land cover changes in the Yellow River Basin and other regions in China reveals distinct regional characteristics. Li et al. (2025) emphasized that the land use transitions between grassland and cropland are particularly pronounced in both western China and the Yellow River Basin, reflecting a dynamic interplay between large-scale agricultural expansion and ecological restoration efforts. Similarly, the Yangtze River Basin exhibits a reciprocal conversion of grassland and cropland. However, the ecological restoration policies in the two regions differ significantly. The Yangtze River Basin prioritizes wetland protection and water source management, while the Yellow River Basin places greater emphasis on grassland restoration and desertification prevention. This policy divergence has led to a notable increase in grassland area within the Yellow River Basin.
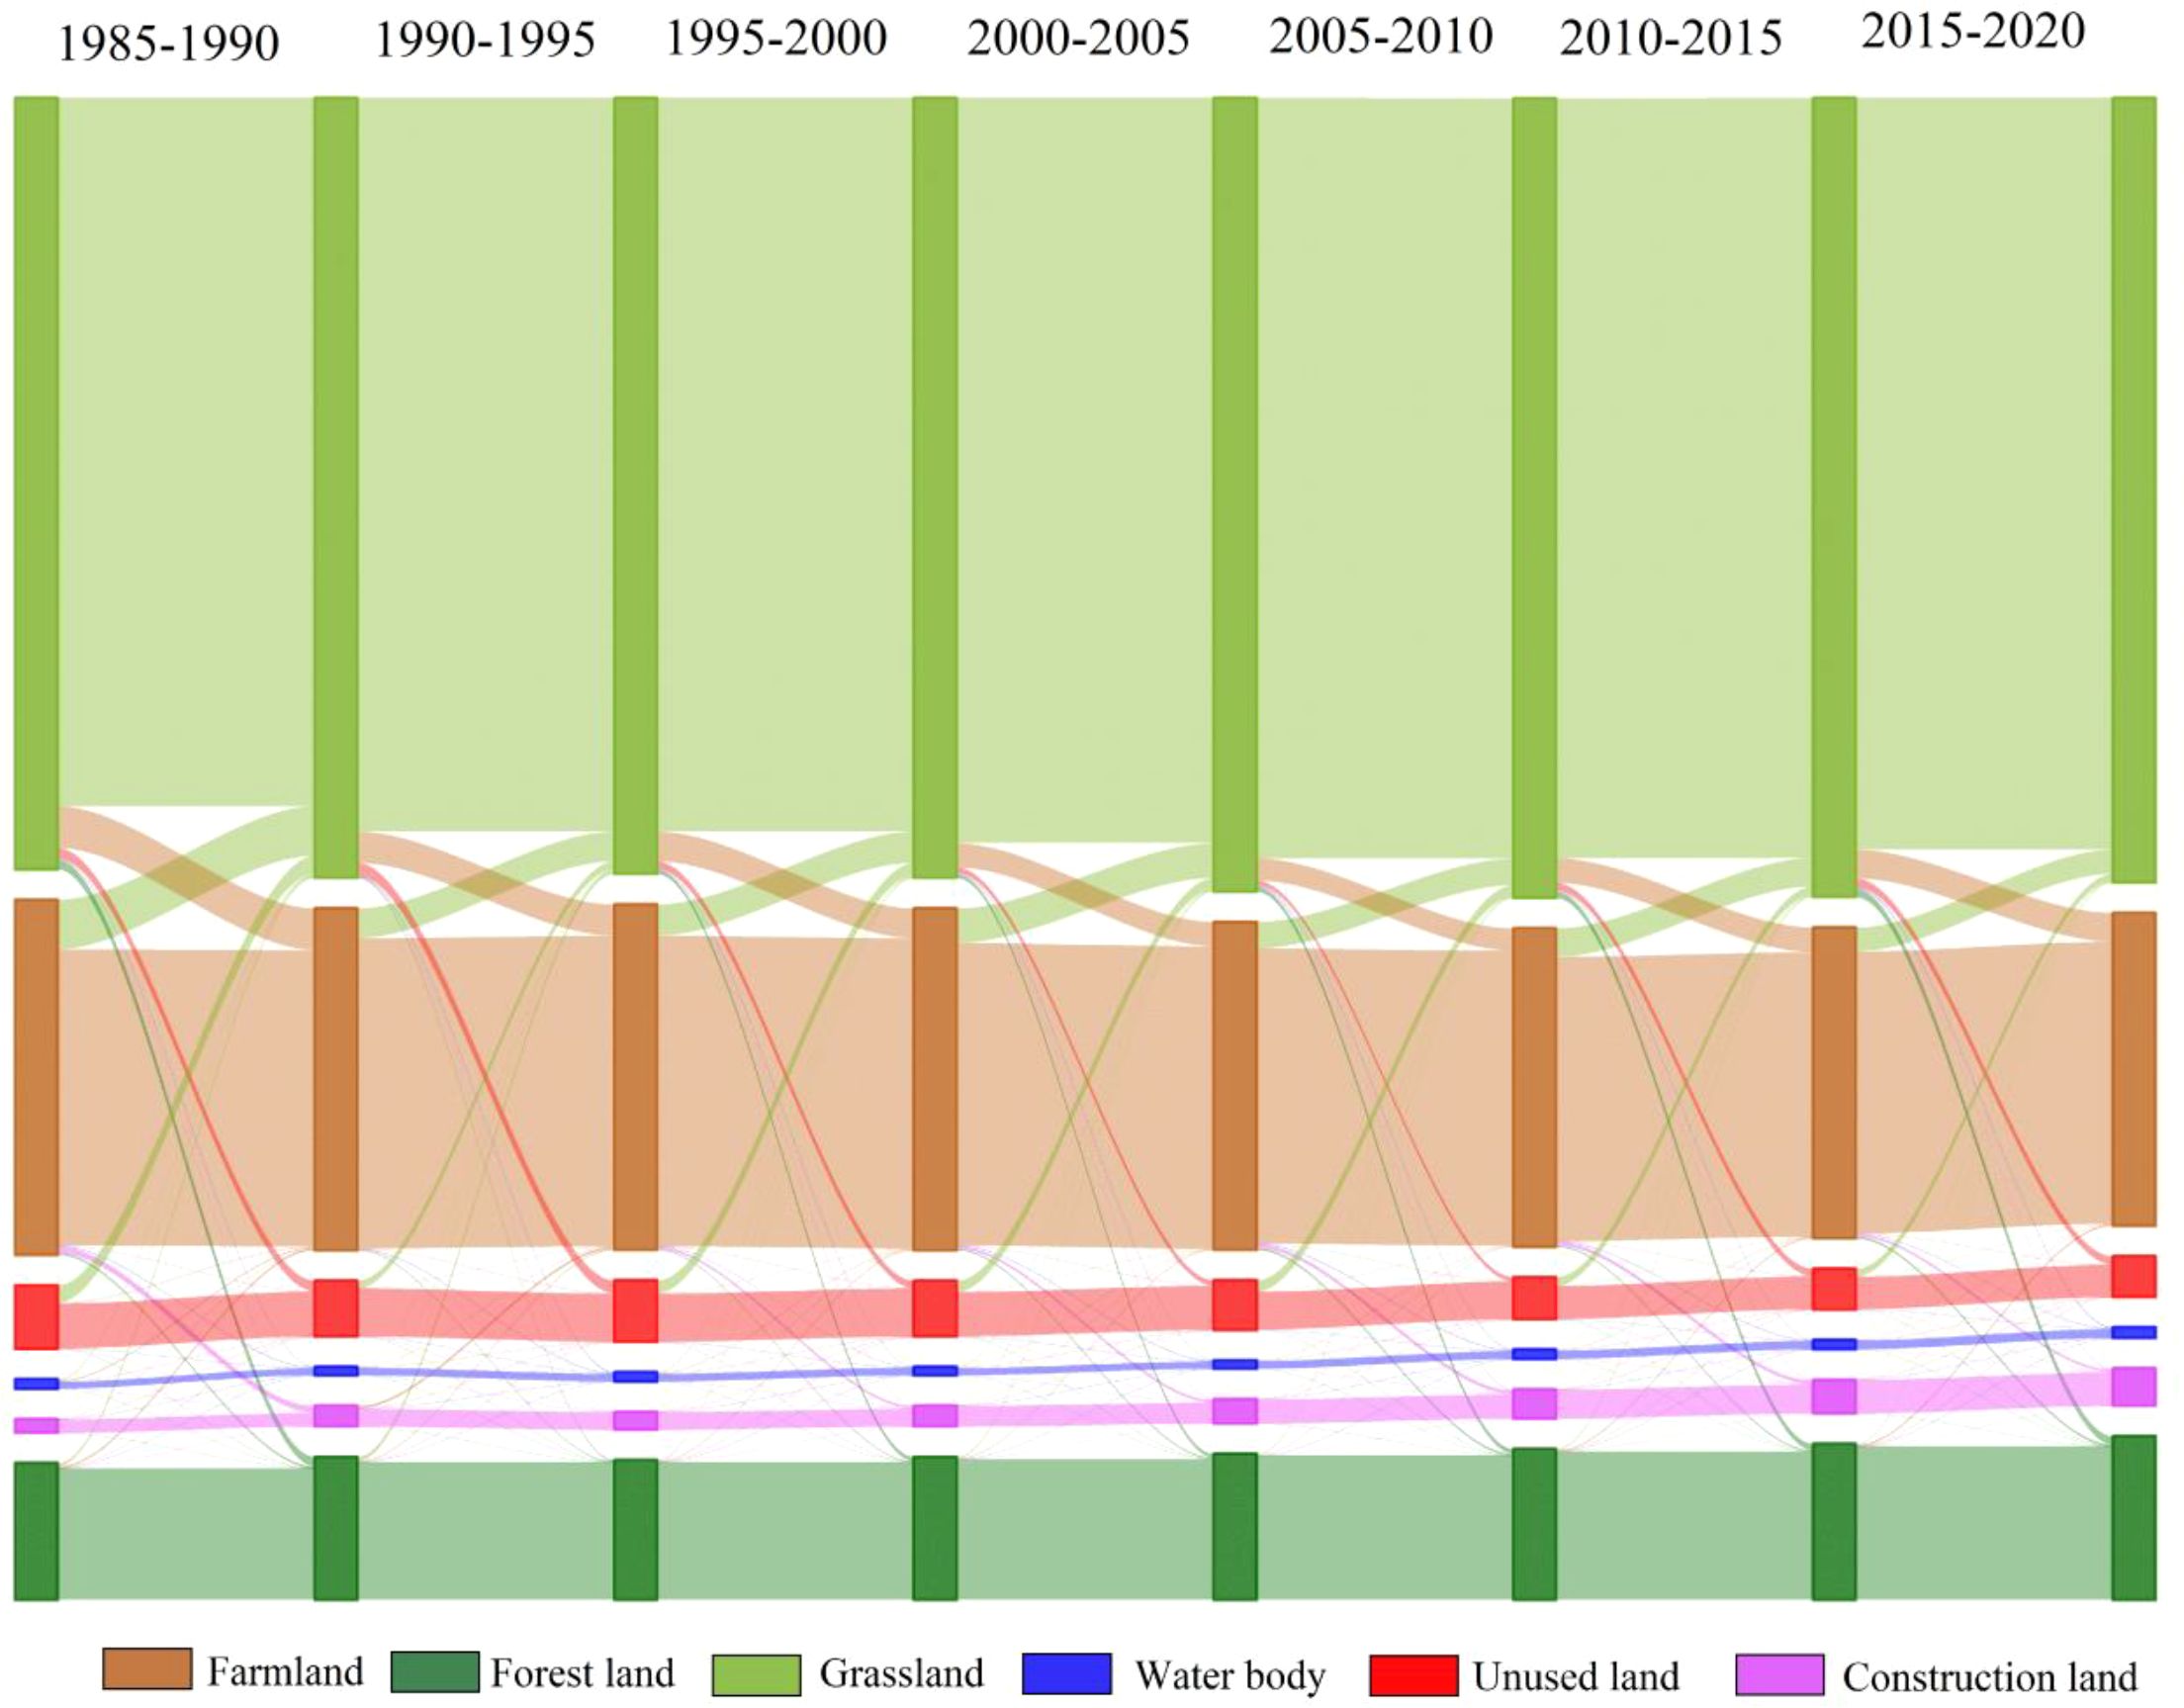
Figure 3. Sankey diagram of land use area from 1985 to 2020 in the Yellow River Basin.
4.2 Heterogeneity analysis of LP
4.2.1 Heterogeneity analysis at class metrics
The results presented in the Figure 4 clearly indicate that grassland and farmland exhibit the highest PLAND and LPI values, implying their dominant presence in the YRB. Notably, both grassland and forest land demonstrate an overall increasing trend in terms of PLAND and LPI values, while farmland exhibits a decreasing trend. These findings strongly suggest that the implementation of the “Grain for Green” program initiative has exerted a substantial influence on the ecosystem of YRB. In terms of landscape fragmentation, the NP and PD values of farmland and grassland exhibited a declining trend from 1985 to 2010, which may be attributed to effective protection policies. However, since 2010, there has been a noticeable increase in the fragmentation of farmland and grassland possibly due to ongoing urbanization processes. Conversely, the PD and NP values of forest land, water body, and construction land showed an upward trend, indicating increased fragmentation in these LULC classifications and their heightened vulnerability to urbanization compared to grassland and farmland. The LSI values for forest land, water body, and construction land exhibited a consistent upward trend, indicating that these LULC classifications are heavily influenced by anthropogenic activities. Moreover, the shapes of these patches became increasingly irregular over time. Conversely, the LSI of unused land and forest land displayed a decline followed by an uptick (with the inflection point occurring in 2010). The COHESION value indicates a rapid upward trend in the COHESION of construction land, while the COHESION of forest land and grassland shows an increasing trend with fluctuations. This suggests a strong association between these three LULC classifications over time. Conversely, there is a noticeable decline in farmland, water body, and unused land. In general, the fragmentation and complexity of dominant classes, such as cultivated land, forest, and grassland, exhibited a considerable shift in evolution before and after 2010.
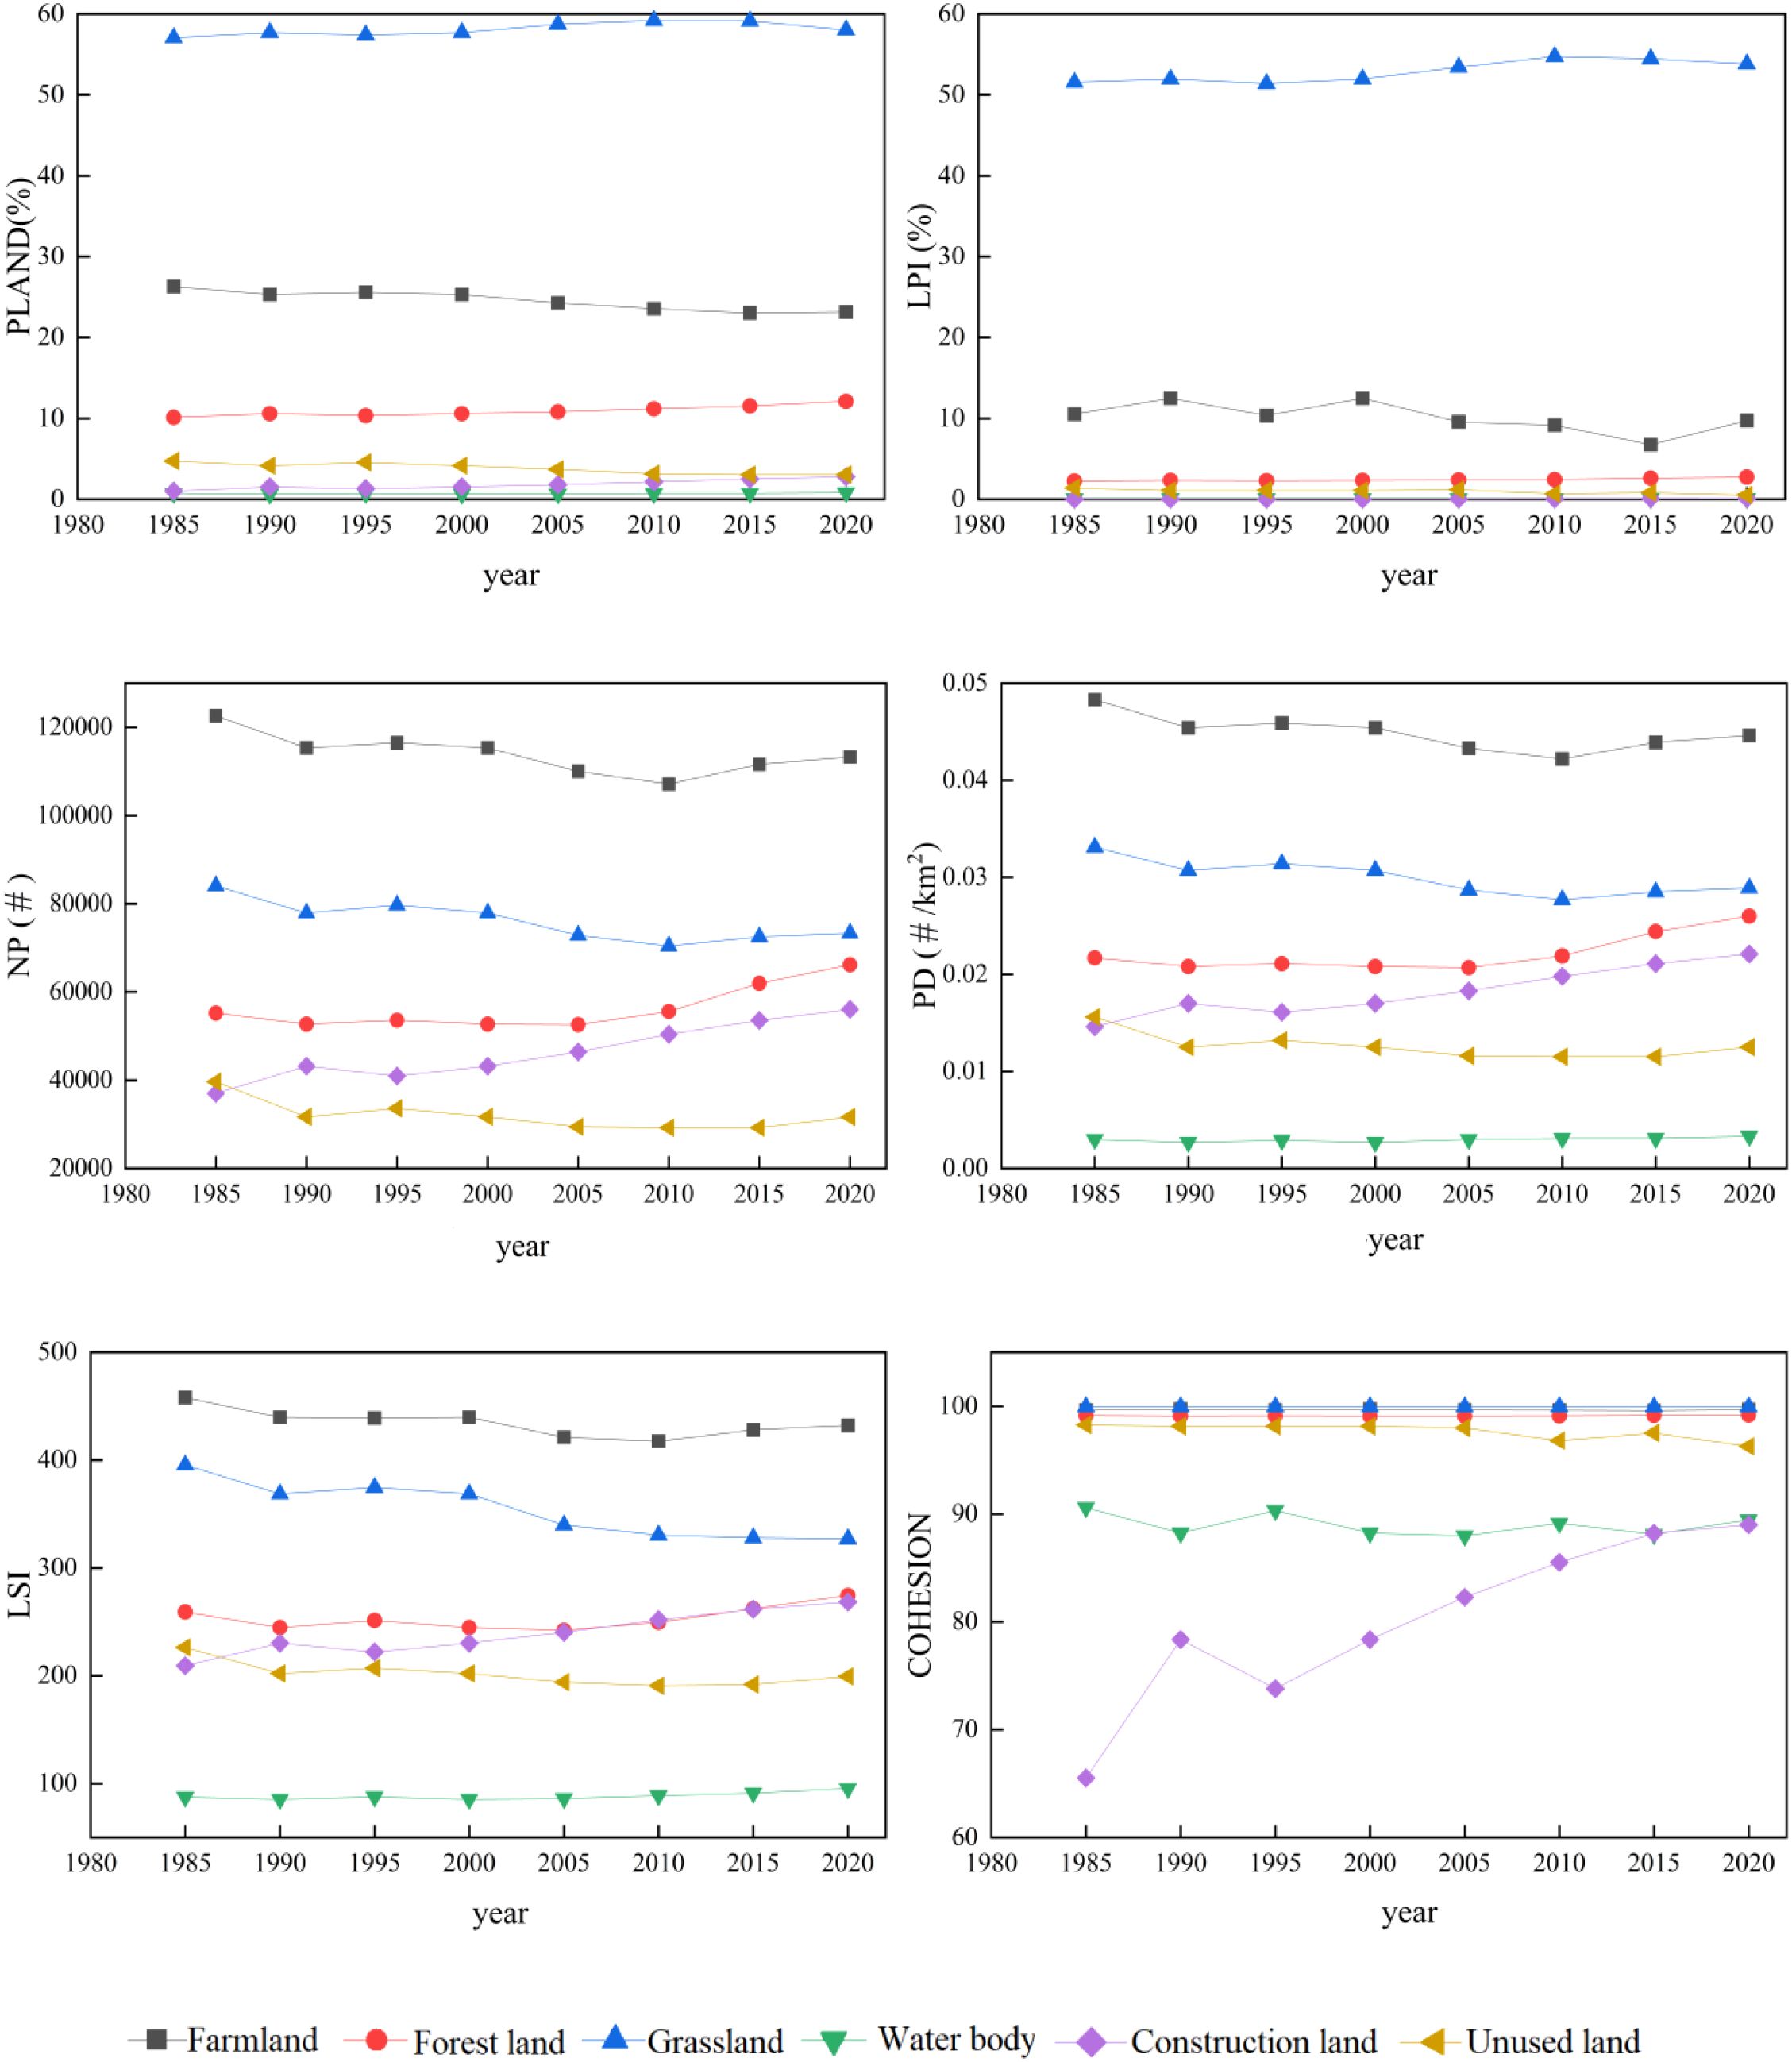
Figure 4. Landscape indices at class metrics from 1985 to 2020.
4.2.2 Heterogeneity analysis at landscape metrics
Table 2 demonstrates a decline in the ED from 1985 to 2010, indicating a reduction in landscape fragmentation. Conversely, the ED increased during the period of 2010-2020, suggesting an enhanced complexity and diversification of the landscape accompanied by an increase in fragmentation. The CONTAG exhibits an upward trend followed by a subsequent decline. Connectivity within the YRB initially showed an increasing trend but became more sporadic after 2010, reflecting heightened fragmentation resulting from human activities. The SHDI and SIEI exhibit a similar trend, both indicating an overall increase. This suggests that anthropogenic activities during urbanization have led to increasingly complex and diversified landscape changes. From the perspective of landscape metrics in the YRB, the evolution of LP can be observed across different stages. Between 1985 and 2010, there was a notable rise in landscape aggregation and connectivity. However, a shift in this pattern occurred between 2010 and 2020. The results of the landscape heterogeneity analysis at class metrics support this conclusion.
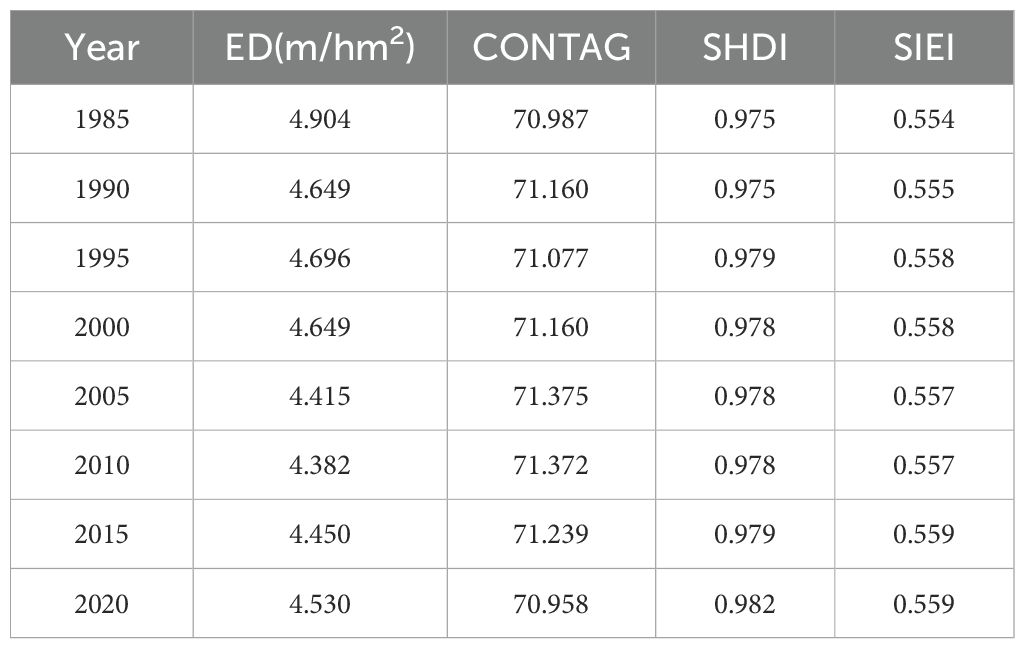
Table 2. Landscape index at landscape metrics.
4.3 Response relationship between LULC and LP
4.3.1 Response relationship between LULC and LP at class metrics
An analysis was conducted to investigate the correlation between different LULC classifications and landscape pattern indices at class metrics. The results, as depicted in the Table 3, revealed a significant correlation between the six LULC classifications and five landscape indices (the correlation between LULC and PLAND was 1, which was not discussed). The LPI exhibited a strong relationship with various LULC classifications, including farmland, forest land, grassland, water body, unused land, and construction land. Notably, forest land and construction land demonstrated significant influences on the LPI with correlation coefficients of 0.987 (p < 0.01) and 0.98 respectively. There was a robust positive correlation between NP and multiple LULC classifications such as farmland, forest land, water body, unused land, and construction land. Among these classifications, construction land had the most pronounced impact on NP with a correlation coefficient of 0.999 (p < 0.01). Furthermore, a strong inverse relationship was observed between NP and grassland, exhibiting a significant correlation coefficient of -0.931 (p<0.01). This finding supports the notion that extensive grassland areas have undergone conversion into various LULC classifications, resulting in heightened landscape fragmentation. A notable positive correlation was identified between PD and both water body and construction land, with correlation coefficients of 0.874 (p < 0.01) and 0.999 (p < 0.01), respectively. This can be attributed to the combination of limited water body and construction land along with a substantial number of NPs present in the study area. Additionally, there was an evident negative association between PD and grassland, aligning with the inverse correlation observed between grassland and NP. LSI exhibited the strongest positive correlation with construction land while displaying the most pronounced negative relationship with grassland among all variables examined in this study. Moreover, COHESION demonstrated positive correlations across all six LULC classifications within the YRB region under investigation herein; notably, construction land exerted a considerable influence on COHESION as evidenced by high correlation coefficients reaching up to 0.953 (p < 0.01). Overall, the five landscape indices (LPI, NP, PD, LSI, and COHESION) exhibited robust positive correlations with the five LULC classifications (farmland, forest land, water body, unused land, and construction land) in the basin when considering class metrics. The findings of this study suggest that human activities strongly influence changes in these LULC classifications. Conversely, grassland demonstrated negative correlations with NP, PD, and LSI indices. This implies that grassland areas in peripheral regions of the YRB are more likely to experience expansion or contraction.
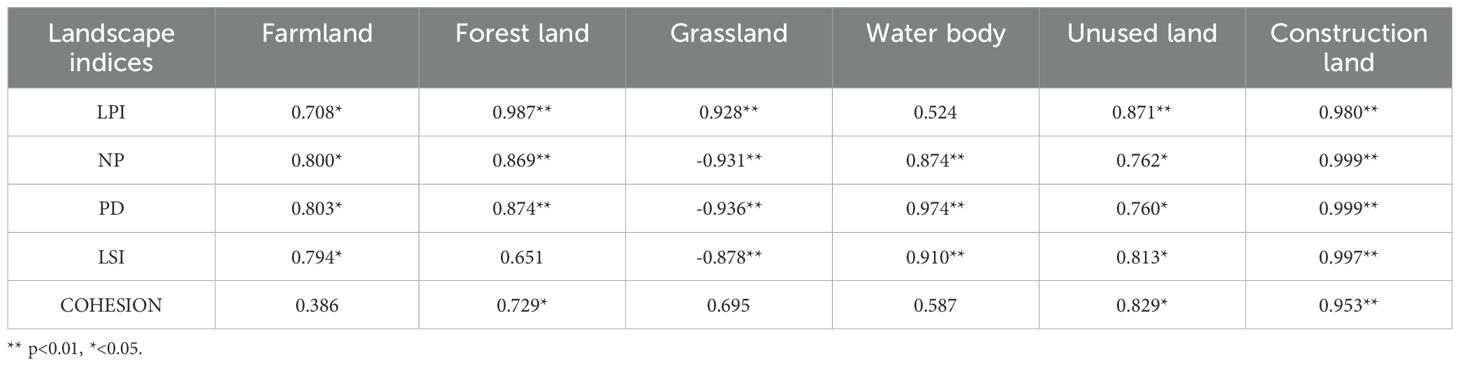
Table 3. Correlation between LULC and landscape indices at class metrics.
4.3.2 Response relationship between LULC and LP at landscape metrics
The coefficients in Table 4 demonstrate the strength of influence that LULC exerts on LP. The plus and minus signs are employed to indicate the consistency between LULC and LP. The regression results, with R² values above 0.80, demonstrate a strong model fit and substantial explanatory power, highlighting a significant influence of LULC on LP. Notably, while other LULC classifications impact LP in various ways, the change of grassland exhibits an opposing trend. In the realm of different LULC classifications, the alteration in farmland had a favorable impact on landscape indices such as ED (+0.24), SHDI (+0.27), and SIEI (+0.31). However, it had an adverse effect on the CONTAG index (-0.36). The alterations in forest land demonstrated a positive influence on landscape indices including ED (+0.35), SHDI (+0.23), and SIEI (+0.24), while simultaneously exerting a negative impact on CONTAG (-0.32). The observed changes in grassland yielded beneficial effects on CONTAG with an increase of 0.35; While, these changes detrimentally affected other landscape indices such as ED (-0.32), SHDI (-0.36), and SIEI (-0.37). Adding a water body had a beneficial impact on landscape indices like ED (+0.05), SHDI (+0.21), and SIEI (+0.14). However, it had a detrimental effect on the CONTAG index (-0.16). Converting unused land to other uses can have a significant impact on landscape indices. It has been observed to have a positive effect on indices like ED, SHDI, and SIEI, increasing to 0.08, 0.26, and 0.24 respectively. However, this conversion also has a negative effect on the CONTAG index, leading to a decrease of 0.17. The alterations in construction land had a favorable impact on landscape indices like ED (+0.26), SHDI (+0.01), and SIEI (+0.04), but had an adverse effect on landscape indices such as CONTAG (-0.16). In general, the changes in grassland, farmland, and forest land play a pivotal role in shaping the landscape pattern evolution within the YRB. Farmland and forest land have a positive influence on landscape indices ED, AI, SHDI, and SIEI; whereas grassland has a negative impact on these indices. This suggests that grassland change predominantly shapes the overall landscape pattern (integrity, diversity, and connectivity) in the YRB.
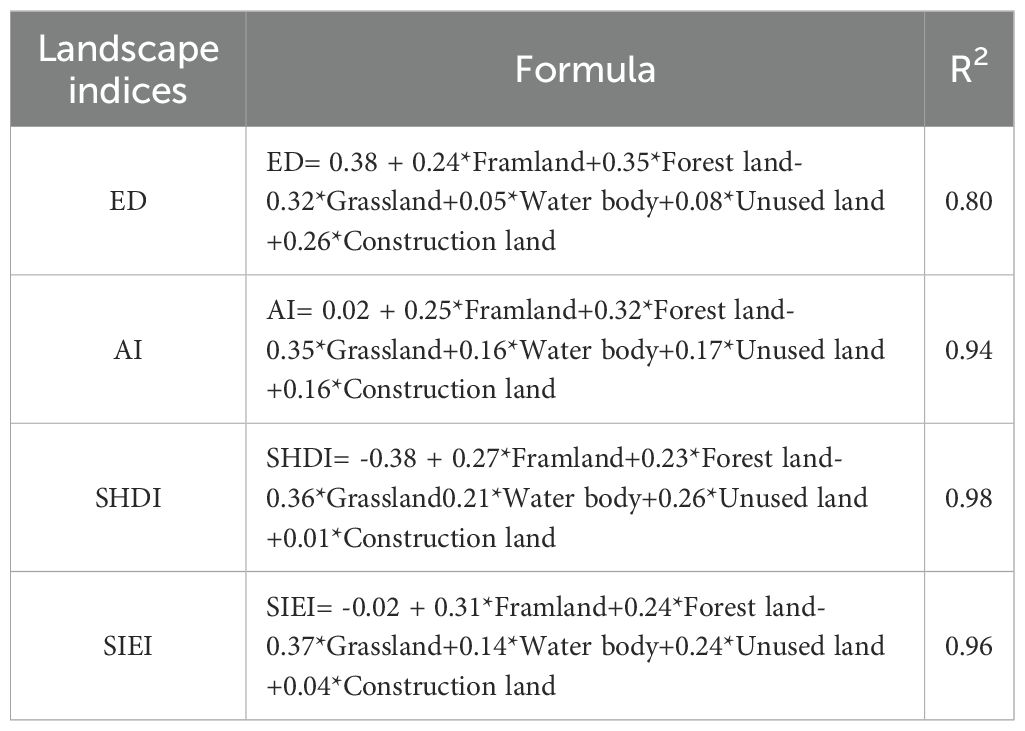
Table 4. Response relationship between LULC and LP at landscape metrics.
4.4 Driving force analysis of landscape evolution
The results of the driving force analysis of the landscape evolution in the YRB are presented in Figure 5. Based on the figure, it is evident that the landscape evolution in the YRB is influenced by social and natural factors. Social factors lead to rapid changes in the local scope, while natural factors dominate the long-term base gradual change of the landscape. According to the driving force analyses of both dimensions of LULC and LP, it is evident that social factors play a more significant role compared to natural factors (excluding water body). This suggests that social factors have been the main drivers of landscape changes in the YRB over the past 35 years.
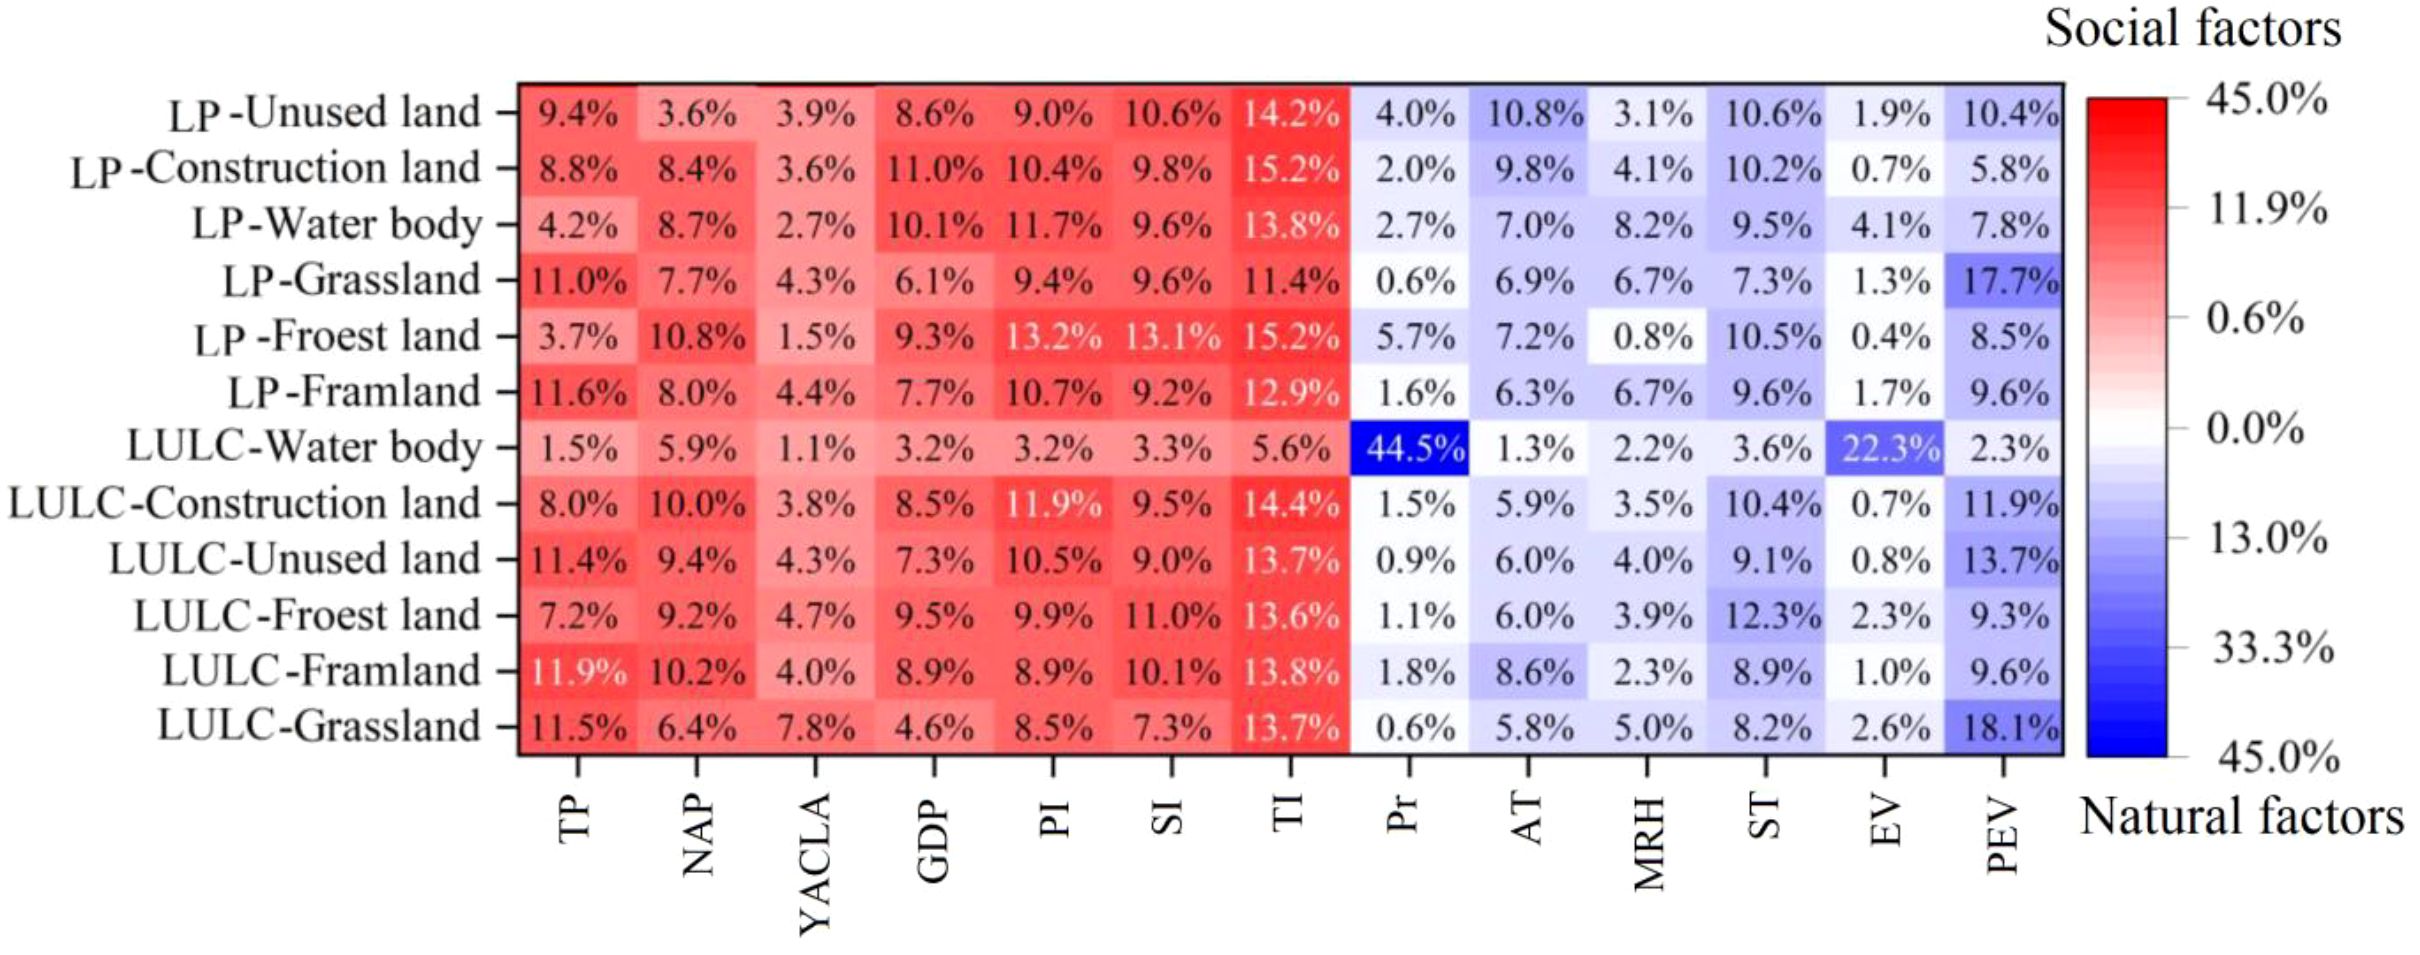
Figure 5. Driving force analysis of landscape evolution in the Yellow River Basin.
4.4.1 The driving forces of LUCC
Changes in farmland areas are influenced by a combination of social and natural factors. Social factors contribute to 67.7% of these changes, while natural factors account for 32.3%. The core drivers, which include TI, TP, NAP, SI, and PEV, are responsible for the top 5 percentages of contribution. Among the factors driving changes in forest land, the contribution of social factors is 65.1%, that of natural factors is 34.9%, and that of the TI, ST, SI, PI, and GDP are the core drivers. Among the drivers of changes in the area of grassland, the contribution of social factors is 59.7%, that of natural factors is 40.3%, and that of PEV, TI, TP, PI, and ST are the core drivers. The social factor accounts for 23.8% of the changes in water body, while the natural factor contributes 76.2%. Pr, EV, NAP, TI, and ST are the core of the subject. Social factors account for 66.1% of the changes in construction land, while natural factors make up the remaining 33.9%. TI, PI, PEV, ST, and NAP are the main factors that drive the core operations. Social factors play a significant role in driving changes in unused land, accounting for 65.6% of the overall contribution. On the other hand, natural factors contribute 34.4% to these changes. TI, PEV, TP, PI, and NAP are the primary drivers driving the system.
4.4.2 The driving forces of LP
Considering the results of driving forces of LP, it is evident that social factors play a significant role in driving changes in farmland, accounting for 64.6% of the overall impact. Natural factors, on the other hand, contribute 35.4% to these changes. Additionally, the core drivers identified include TI, TP, PI, PEV, and ST. Among the drivers of changes in forest land, the contribution of social factors is 66.9%, the contribution of natural factors is 33.1%, and TI, PI SI, NAP, and ST are the core drivers. Among the drivers of changes in grassland, the contribution of social factors to the change in grassland is 59.5%, while the contribution of natural factors is 40.5%. PEV, TI, TP, SI, and PI are the core drivers. Social factors account for 60.8% of the changes in water body, while natural factors contribute 39.2%. TI, PI, GDP, SI, and ST are the primary components that drive the system. Among the drivers of changes of construction land, the contribution of social factors is 60.2%. The contribution of natural factors is 39.8%, and TI, GDP, PI, ST, and SI are the core drivers. Social factors account for 59.1% of the drivers of changes in unused land, while natural factors contribute 40.9%. TI, MRH, ST, SI, and PEV are the key variables driving the project. The results of landscape metrics analysis indicate that social factors contribute 67.2% to the driving factors of landscape evolution in the YRB, with natural factors accounting for 32.8%. The core driving factors are YACLA, TP, MRH, Pr and PEV.
5 Discussion
5.1 Response relationship between LULC and LP in the YRB
Some researchers argue that landscape pattern changes are primarily influenced by LUCC. Researchers have developed various quantitative models to assess the impact of LUCC on LP (Ning et al., 2020; Yang et al., 2022). However, these studies have not focused on the landscape ecological significance indicated by this quantitative relationship. This paper analyzes the response relationship between each LULC class and the fragmentation, complexity, and connectivity of landscapes through correlation analysis, revealing potential locations for LUCC. By employing regression modeling, we were able to determine how different LULC classes influence the direction and intensity of landscape evolution at landscape metrics. This analysis unveils the impact of various LUCC classes on the overall trend of landscape evolution in the YRB.
5.2 Driving mechanisms of landscape evolution in the YRB
The landscape evolution of the YRB is a complex outcome resulting from a multitude of natural and societal factors, as evidenced by the primary indicators derived from the dimensions of LULC and LP. The contribution of social factors surpasses that of natural factors significantly. Long-term landscape changes are consistently influenced by natural forces. The natural environment of the basin is influenced by the process of climate change, resulting in alterations to LULC as well as LP within the basin. Through statistical analysis of AT and ST data from 1985 to 2020, it was observed that the AT increased at a rate of 0.043°C per year. Similarly, the ST exhibited an increase at a rate of 0.056°C per year. These findings indicate an overall warming trend in the regional climate. Additionally, the Pr in the basin has exhibited a decrease of 4.35 mm/year over the past three decades. This decline in rainfall, combined with the observed rise in temperature, will lead to a reduction in soil moisture content, a lowering of the water table, and an impairment of runoff regulation capacity. These alterations will have significant implications for the ecological equilibrium and landscape dynamics of the basin, potentially resulting in heightened intricacy and fragmentation (Wen et al., 2023; Huang et al., 2017). The analysis of driving forces revealed that the overall contribution of climate factors to the evolution of landscape patterns is relatively limited. Climate factors play a crucial role in restoring the ecological environment in basins and achieving high-quality development. However, it should be noted that climate factors are not the sole determinant of landscape pattern evolution. Other factors also influence basin landscape evolution. Social factors significantly contribute to rapid transformations in basin landscapes and shape their subsequent directions of change. When examining the influences on LULC, as well as LP, it becomes evident that social factors exert a much greater influence compared to natural factors. This indicates that social factors have a stronger impact on landscape evolution than natural ones, making them dynamic driving forces for such changes. Between 1985 and 2020, the population of the YRB witnessed substantial growth. The TP increased from 148.18 million to 218.73 million, with the NAP experiencing an even more significant rise from 34.95 million to 136.41 million. This notable increase in the number of NAP residents and the resulting transformation in the composition of the TP will necessitate additional land reclamation measures to sustain urban growth, ultimately leading to potential landscape fragmentation.
When considering secondary indicators, there exists a certain degree of variation in the factors driving landscape changes within the YRB, as observed through LULC and LP. For instance, the core driving factors contributing to changes in forest land classification include TI, ST, SI, PI, and GDP. The core drivers of forest landscape pattern changes were mainly TI, PI, SI, NAP, and ST. Notably, these core drivers overlap, as both forest land classification change and landscape pattern change were influenced by common factors, namely TI, PI, SI, and ST. This suggests that certain factors play a critical role in the evolution of forest land landscapes across different landscape types. The interrelationships among these factors further indicate a complex dynamic in landscape transformations, where environmental, social, and economic variables interplay. However, differences in these elements also point to variations in the ecological significance of the models. Similar findings were observed for the other LULC classifications as well. This indicates that LULC and LP reflect both shared and divergent processes in landscape evolution, and by examining the core drivers and their interrelations, we can gain a deeper understanding of the underlying mechanisms driving landscape changes. Furthermore, when comparing these findings with studies from other regions, we observe that while some core drivers such as TI and PI are consistent with other research (e.g., [Author, Year]), the influence of factors like GDP and NAP may differ, highlighting the region-specific nature of landscape evolution.
6 Conclusion
The present study investigates the spatio-temporal dynamics of LULC and LP in the YRB from 1985 to 2020. Moreover, it explores the underlying drivers that have contributed to these transformations. Additionally, it elucidates the intricate interrelationships between LULC and LP within the basin. Based on the research findings:
(1) The LULC in the YRB have undergone significant changes over the past 35 years. From 1985 to 2020, there has been a notable increase in the extent of grassland (2.21%), forest land (19.18%), water body (9.50%), and construction land (173.52%). Particularly, the area covered by grassland exhibited the most substantial expansion, reaching 12,536.55 km². Conversely, farmland and unused land experienced significant declines with reductions of 12.43% and 34.32%, respectively. The reduction in farmland accounted for an area of 17,059.40 km² while that of unused land amounted to 32,367.26 km².
(2) The landscape pattern evolution in the YRB is characterized by distinct stages. A significant change occurred between 1985 and 2010, marked by an increase in landscape aggregation and connectivity. Conversely, between 2010 and 2020, a noticeable shift towards fragmentation and reduced connectivity was observed. Concurrently, the NP and PD values associated with dominant landscape classes such as farmland and grassland exhibited a declining trend from 1985 to 2010 but showed an increasing trend thereafter. This was the primary driving force behind the landscape pattern evolution in the YRB.
(3) The landscape evolution of the YRB has been primarily shaped by grassland changes, with other land LULC classes exerting a relatively minor influence on overall composition, diversity, and connectivity. The transition of grassland is predominantly observed in the periphery of existing grassland areas, while the evolution of other LULC classes is subject to a greater degree of human influence and exhibits a more stochastic pattern.
(4) The landscape evolution in the YRB is a result of both social and natural factors. Social factors have led to rapid alterations in local landscapes, while natural factors have played a more significant role in shaping long-term basal gradient of landscape. Through an analysis of driving forces related to LULC and LP, it is evident that social factors have been major contributors to the landscape changes observed in the YRB over the past three decades.
In summary, this study explores the spatio-temporal dynamics of LULC and LP in the Yellow River Basin from 1985 to 2020, providing valuable insights into the driving forces behind these changes. However, it has certain limitations. The data used in the analysis has limitations in terms of temporal and spatial resolution, which may affect the generalizability of the results. Additionally, the research focuses solely on the Yellow River Basin, and the findings might not be directly applicable to other regions with different socio-economic and environmental conditions. Moreover, this study mainly relies on historical data and does not provide predictions for future LULC and LP changes. Future research could address these limitations by incorporating higher-resolution data and employing advanced modeling techniques, such as deep learning and remote sensing technologies, to refine the understanding of LULC and LP relationships. Expanding the study to other river basins or regions would also offer broader insights into landscape evolution. Furthermore, future studies should consider predicting future trends, using both social and natural factors, to better inform land use planning and ecosystem management.
Data availability statement
The original contributions presented in the study are included in the article/supplementary material. Further inquiries can be directed to the corresponding authors.
Ethics statement
The manuscript presents research on animals that do not require ethical approval for their study.
Author contributions
C-FG: Methodology, Investigation, Writing – original draft, Software. DZ: Writing – review & editing, Supervision, Conceptualization, Validation. M-FF: Data curation, Methodology, Writing – review & editing, Resources.
Funding
The author(s) declare that financial support was received for the research and/or publication of this article. The authors would like to acknowledge the following funding sources for their support: the Science and Technology Project of Henan Province (222102320364), the Key Scientific Research Project of Henan University (21A170004), and the Beijing Municipal Natural Science Foundation–Beijing Municipal Education Commission Joint Key Project (KZ20190028042).
Acknowledgments
The authors are indebted to the editors for their valuable comments and suggestions.
Conflict of interest
The authors declare that the research was conducted in the absence of any commercial or financial relationships that could be construed as a potential conflict of interest.
Generative AI statement
The author(s) declare that no Generative AI was used in the creation of this manuscript.
Publisher’s note
All claims expressed in this article are solely those of the authors and do not necessarily represent those of their affiliated organizations, or those of the publisher, the editors and the reviewers. Any product that may be evaluated in this article, or claim that may be made by its manufacturer, is not guaranteed or endorsed by the publisher.
References
Deng H. B., Wang Q. L., and Cai Q. H. (1988). Watershed ecology—New discipline new idea and new approach. Chin. J. Appl. Ecol. 9, 443–449.
Gao S., Zhang X., and Chen M. (2022). Spatiotemporal dynamics and driving forces of city-level CO2 emissions in China from 2000 to 2019. J. Cleaner. Prod. 377, 134358. doi: 10.1016/j.jclepro.2022.134358
Guo C. F., Zhao D. L., and Wu D. L. (2024). Long-term evolution and driving mechanisms of the Baiyangdian wetland based on land cover frequency characteristics. J. Freshw. Ecol. 39, 1–14. doi: 10.1080/02705060.2024.2327279
Guo H., Sun Y., Wang Q., Wang X., and Zhang L. (2023). Construction of greenspace landscape ecological network based on resistance analysis of GeoDetector in Jinan. Stochastic. Environ. Res. Risk Assess. 37, 651–663. doi: 10.1007/s00477-022-02296-x
Haines-Young R. and Chopping M. (1996). Quantifying landscape structure: A review of landscape indices and their application to forested landscapes. Prog. Phys. Geogr. 20, 418–445. doi: 10.1177/030913339602000403
Hou B., Wei C., and Liu X. (2023). Assessing forest landscape stability through automatic identification of landscape pattern evolution in Shanxi Province of China. Remote Sens. 15, 545. doi: 10.3390/rs15030545
Hu S., Liu C., and Zheng H. (2012). Assessing the impacts of climate variability and human activities on streamflow in the water source area of Baiyangdian Lake. J. Geograph. Sci. 22, 895–905. doi: 10.1007/s11442-012-0971-9
Huang Z., Du X., and Castillo C. S. Z. (2019). How does urbanization affect farmland protection? Evidence from China. Resources. Conserv. Recycling. 145, 139–147. doi: 10.1016/j.resconrec.2018.12.023
Huang Q., Huang J., and Yang X. (2017). Evaluating the scale effect of soil erosion using landscape pattern metrics and information entropy: A case study in the Danjiangkou Reservoir area, China. Sustainability 9, 1243. doi: 10.3390/su9071243
Konapala G., Kao S. C., and Addor N. (2020). Exploring hydrologic model process connectivity at the continental scale through an information theory approach. Water Resour. Res. 56, 1–23. doi: 10.1029/2020WR027340
Laner P., Rossi C., Lüthi R., and Haller R. M. (2024). Landscape permeability for ecological connectivity at the macro-regional level: The Continuum Suitability Index and its practical implications. Ecol. Indic. 153, 109885. doi: 10.1016/j.ecolind.2024.112145
Li K., Feng M., and Biswas A. (2020). Driving factors and future prediction of land use and cover change based on satellite remote sensing data by the LCM model: A case study from Gansu Province, China. Sensors 20, 2757. doi: 10.3390/s20102757
Li X., Hai Q., and Zhu Z. (2023). Spatial and temporal changes in vegetation cover in the Three North Protection Forest project area supported by GEE cloud platform. Forests 14, 295. doi: 10.3390/f14020295
Li S. H., Jin B. X., and Zhou J. S. (2014). Analysis of the spatiotemporal land-use/land-cover change and its driving forces in Fuxian Lake Watershed 1974 to 2014. Polish. J. Environ. Stud. 26, 671–681. doi: 10.15244/pjoes/65737
Li D., Liang D., and Li T. (2024). Ecological-economic coordination in the Yellow River Basin: Spatial and temporal evolution and driving mechanisms. Environ. Dev. Sustainabil. 26, 3819–3848. doi: 10.1007/s10668-022-02859-6
Li Y., Wang X. H., Wan Y. X., and Xu B. (2025). Spatial pattern evolution and driving forces of ecosystem service value in the Yellow River Basin. Front. Environ. Sci. 13, 1562274. doi: 10.3389/fenvs.2025.1562274
Liang L. and Gong P. (2020). Urban and air pollution: A multi-city study of long-term effects of urban landscape patterns on air quality trends. Sci. Rep. 10, 18618. doi: 10.1038/s41598-020-74524-9
Liu C., Zhang F., and Johnson V. C. (2021). Spatio-temporal variation of oasis landscape pattern in arid areas: Human or natural driving? Ecol. Indic. 125, 107495. doi: 10.1016/j.ecolind.2021.107495
Liu C., Zhang X., and Wang T. (2022). Detection of vegetation coverage changes in the Yellow River Basin from 2003 to 2020. Ecol. Indic. 35, 103–109. doi: 10.1134/S1024856022020129
Mavhaire D., Rajendrakumar S., Tharanidevi N., Shimly S., Dil B. R., and Raja R. T. (2025). Eco-profile approach in watershed and river basin management for addressing water rights and conflicts at micro scale. Front. Water 7. doi: 10.3389/frwa.2025.1511044
Ning Q. M., Ouyang H. Y., Tang F. H., and Zeng Z. W. (2020). Temporal and spatial evolution of landscape pattern in Dongting Lake Area under the influence of land use change. Econ. Geogr. 40, 196–203. doi: 10.15957/j.cnki.jjdl.2020.09.021
O’Neill R. V., Krummel J. R., and Gardner R. H. (1988). Indices of landscape pattern. Landscape Ecol. 1, 153–162. doi: 10.1007/BF00162741
Rodríguez-Loinaz G., Alday J. G., and OnaIndia M. (2015). Multiple ecosystem services landscape index: A tool for multifunctional landscapes conservation. J. Environ. Manage. 147, 152–163. doi: 10.1016/j.jenvman.2014.09.001
Wen L., Peng Y., and Zhou Y. (2023). Study on soil erosion and its driving factors from the perspective of landscape in Xiushui Watershed, China. Sci. Rep. 13, 8182. doi: 10.1038/s41598-023-35451-7
Wu Y., Qin F., Li L., and Dong X. (2024). Exploring landscape ecological risk with human activity intensity and correlation in the Kuye River Basin. Front. Ecol. Evol. 12. doi: 10.3389/fevo.2024.1409515
Yang J. and Huang X. (2021). The 30 m annual land cover dataset and its dynamics in China from 1990 to 2019. Earth Syst. Sci. Data 13, 3907–3925. doi: 10.5194/essd-13-3907-2021
Yang H. F., Zhong X. N., Deng S. Q., and Nie S. N. (2022). Impact of LUCC on landscape pattern in the Yangtze River Basin during 2001–2019. Ecol. Inf. 69, 101631. doi: 10.1016/j.ecoinf.2022.101631
Zhang T., Cheng C., and Wu X. (2023). Mapping the spatial heterogeneity of global land use and land cover from 2020 to 2100 at a 1 km resolution. Sci. Data 10, 748. doi: 10.1038/s41597-023-02637-7
Keywords: land use/land cover, landscape pattern, driving force analysis, spatial heterogeneity, sustainable development
Citation: Guo C-f, Zhao D and Feng M-f (2025) Spatio-temporal evolution and driving mechanisms of landscape in the Yellow River Basin from 1985 to 2020. Front. Ecol. Evol. 13:1611874. doi: 10.3389/fevo.2025.1611874
Received: 15 April 2025; Accepted: 13 June 2025;
Published: 02 July 2025.
Edited by:
Jeanne Marie Fair, Los Alamos National Laboratory (DOE), United StatesReviewed by:
Daniel M. Coffey, Texas A&M University Corpus Christi, United StatesCristhian Clavijo, Vida Silvestre Uruguay, Uruguay
Copyright © 2025 Guo, Zhao and Feng. This is an open-access article distributed under the terms of the Creative Commons Attribution License (CC BY). The use, distribution or reproduction in other forums is permitted, provided the original author(s) and the copyright owner(s) are credited and that the original publication in this journal is cited, in accordance with accepted academic practice. No use, distribution or reproduction is permitted which does not comply with these terms.
*Correspondence: Mei-fang Feng, ZmFubnlmZW5nMTFAMTYzLmNvbQ==