 Robbert Smit
 Kurt Hess
 Patricia Bachmann
 Verena Blum
 Thomas Birri
- 1Research and Development, University of Teacher Education St. Gallen, St. Gallen, Switzerland
- 2Research and Development, University of Teacher Education Zug, Zug, Switzerland
The lasting effects of teacher professional development (PD) are seldom examined. We investigated whether 44 teachers and their Grade 5 and 6 primary classes continued working with tasks for mathematical reasoning and employing a rubric after the PD finished. Questionnaires for students and teachers were administered before the intervention, at the end of the intervention, and 5 months later. The results of the longitudinal quantitative analyses with supplementary qualitative interpretations indicated that the mathematical reasoning features of the PD showed more sustainable effects than the use of the rubric. Explorative findings suggest that this outcome may be related to the teachers' pedagogical content knowledge.
Introduction
Many studies in the field of teacher professional development (PD) report positive effects of their PD. However, how long lasting are the effects of such PD? Do all teachers who receive the PD continue with the objectives of the project? Research frequently notes the limited effects of various PD programs (Borko, 2004; Yoon et al., 2007). Powell et al. (2010) draw attention to the fact that a critically important question is whether PD approaches show sustainability in instructional practices beyond the period of PD support. Follow-up studies of teacher PD projects are still rare.
The starting point of this study was the end of a teacher PD project, which aimed to introduce rubrics as a means to improve the practice of formative assessment in primary school classes. We found positive effects for our control-group intervention with rubrics on the teachers' practice of assessment and feedback. With respect to the students, the project had positive impacts on their self-regulation competencies and their self-efficacy beliefs (Smit et al., 2017). Irrespective of whether students were in the “intervention” or “control” group, all students developed their mathematical reasoning abilities. At first sight, the project was successful. However, what happened after the project finished? Were there any longer-term effects of the PD project on primary teachers' use of rubrics in mathematics?
Sustainability of Teacher Professional Development
Teacher professional learning is a complex process, which requires the cognitive and emotional involvement of teachers individually and collectively, the capacity, and willingness to examine where they stand in terms of their convictions and beliefs, and the perusal and enactment of appropriate alternatives for improvement or change (Avalos, 2011). To understand and explain why and how teachers learn, we must consider how a teacher's individual learning orientation system interacts with the school's learning orientation system, and how both systems together affect the PD activities (Opfer and Pedder, 2011). In addition, researchers also argue that successful PD cannot be divorced from teachers' own classroom contexts (Lieberman and Miller, 2001). Instead, PD must approach teacher learning as a dynamic, active process where teachers engage directly with student work, obtain direct feedback on their instruction, and review materials from their own classrooms (Garet et al., 2001; Desimone et al., 2002).
Guskey (2002) identified five levels that need to be evaluated in order to determine the success of a PD program. The first three levels evaluate the teachers' reactions to the PD, their learning from the PD, and the level of support from their schools. The fourth level targets information on changes teachers make in their professional practice. Such evidence cannot be gathered at the end of a PD session or program. Enough time must pass to allow teachers to adapt the new ideas and practices to their settings (Guskey, 2002). Unfortunately, quite a few PD interventions in education are not long lasting, although empirical results are few. A dialogic reading study by Whitehurst et al. (1994) revealed that the teachers discontinued using dialogic reading strategies at the end of the intervention phase. Franke et al. (2001) conducted a follow-up study 4 years after the end of a PD program on understanding the development of students' mathematical thinking. The results showed that only about half of the teachers in the project group became engaged in on-going learning while the others did not. The researchers proposed that it is teachers' engagement with student thinking that determined who developed further and who did not. Borko et al. (2000) also reported this finding when they found that the two participating teachers in a follow-up study both commented that they had been surprised at their students' capabilities in problem-solving activities. As a result, both teachers raised their expectations for the students and allowed them to take more active roles in their own learning.
The students themselves might also hinder sustainable implementation. According to Yeager and Walton (2011), socio-psychological interventions in education have several underlying constraints that would prevent them from being long-lasting. For example, some students experience poor performance in classroom tests that could undermine the motivation to employ self-assessment strategies and to see mistakes as information for self-regulated learning. However, this is beyond the scope of this paper. In the next section, we present the background for our teacher PD project.
Rubrics as a Tool for Formative Assessment
The assessment of a student's learning, with the help of a rubric for example, is part of the teaching process. Following the work of Black and Wiliam (1998), the Assessment Reform Group (ARG) (2002) defined formative assessment as the process of seeking and interpreting evidence for use by learners and their teachers to establish where learners are in their learning, where they need to go, and how best to get there (Wiliam and Thompson, 2007). The formative assessment process can be seen as a cycle with three components (Figure 1). One component requires the teacher to clarify the learning (and assessment) targets. A rubric helps make these targets transparent to students by describing the criteria they need to reach. For a full understanding of the criteria, it is helpful to engage the learners in peer and self-assessments. A second component indicates that teachers support students in the learning process. This involves the ongoing assessment of students' learning and a diagnosis of any specific learning problems that need to be acted upon. Again, a rubric can guide the teacher while they observe a student performing the relevant tasks. As part of the cycle's third component, a rubric enables the teacher to give criteria and target-related feedback to the learner. In addition, the teacher can provide further instruction that helps the student to reach the next learning level. If all of this occurs in a way that enhances learning, a positive effect on the student's intrinsic motivation can be expected (Harlen, 2006; Moss and Brookhart, 2010). Intrinsic motivation is also fostered by self-assessment, making the students more autonomous learners who can self-regulate their own learning (Paris and Paris, 2001). Peer and self-assessment are two of the five key formative assessment strategies proposed by Black and Wiliam (2009, p. 8), and they formed part of our PD.
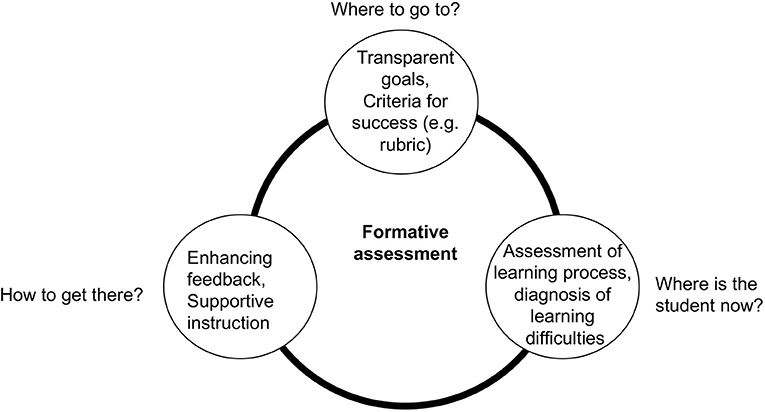
Figure 1. Relationship of a rubric, assessment/diagnosis, and feedback as components of formative assessment (adapted from Black and Wiliam, 2009).
Rubrics help teachers evaluate complex competencies assessed in authentic performance assessments, such as written compositions, oral presentations, or science projects (Montgomery, 2000; Bradford et al., 2015; Tang et al., 2015; de Leeuw, (2016). Rubrics describe performance expectations by listing criteria and describing levels of quality (Brookhart, 2018). They can be holistic or analytic; holistic rubrics consider all the criteria simultaneously, requiring only one decision on one scale, whereas analytic rubrics provide specific feedback with respect to several criteria and levels.
Rubrics are helpful guidelines for teacher feedback on students' actual levels of performance and for indicating the next steps for improvement. Although rubrics make goals more transparent, they are neither sufficient nor very effective if teachers simply hand them out without providing information for individual improvement (Andrade et al., 2008; Wollenschläger et al., 2016). Furthermore, teachers with limited understandings of teaching and learning (pedagogy), or for example, hold strong transmissive beliefs about learning, could hinder the full potential of a rubric for student learning (Mui So and Hoi Lee, 2011). Such teachers focus on the summative use of assessment results rather than on identifying the strengths and weaknesses of students in the process of learning. Therefore, teachers applying rubrics should understand the role of formative assessment in learning. In addition, providing effective formative feedback depends on teachers' assessment and diagnostic skills (Earl, 2012; Turner, 2014). Teacher feedback in classrooms has been found to have a powerful impact on students' learning, with an overall effect size of d = 0.79 (Hattie, 2008). While not exclusive to rubrics, feedback in general that encourages “mindfulness” is most likely to help students improve (Underwood and Tregidgo, 2006; Hattie and Timperley, 2007). In other words, comments that prompt students to meaningfully and thoughtfully approach their revisions show the greatest improvements in learning. Bangert-Drowns et al. (1991) discovered that although feedback in most settings was positively related to higher achievement, student learning did not benefit if the feedback omitted information necessary for learners to evaluate where they were, identify where they were going, or provide useful strategies for getting there. Rubrics can offer information in all three instances, and they help teachers keep feedback manageable, as the complexity of feedback information can also reduce the effectiveness of formative feedback itself (Shute, 2008).
A rubric is not only a tool for assisting teachers; it can also be beneficial for students. Used as a self-assessment tool, rubrics can help students improve their self-efficacy, reduce anxiety, and foster their ability to self-regulate their learning (Panadero and Jonsson, 2013). Research about the effects of rubrics within primary school classes is still scarce. The following are two examples. Andrade et al. (2008) showed that when students in primary classes used a rubric to self-assess the first drafts of their essay, they could improve important qualities of their writing. Ross et al. (2002) carried out a 12-week self-evaluation training of mathematics achievement in Grade 5 and 6 classes. Students in the experimental group learned to apply four strategies: (a) define evaluation criteria with the help of a rubric, (b) apply the criteria to their work, (c) conduct self-evaluations, and (d) develop action plans based on their self-evaluations. Students in the intervention group showed significantly higher mathematical problem-solving test scores than students in the control group. Based on their experiences of teacher PD, the researchers concluded that it is more difficult to achieve positive effects from mathematics PD than from writing PD, for example, as pedagogical content knowledge (Shulman, 1987) for mathematics is usually more demanding. Furthermore, they also suggested that student achievement could be hindered by teacher beliefs, which were not always aligned to a reform-minded view of mathematics as a dynamic set of intellectual tools for solving meaningful problems.
In our pilot study, we developed a rubric aligned to the Swiss standards (Smit and Birri, 2014). The rubric was designed to support teachers in giving feedback to students working on mathematical reasoning tasks. We constructed the rubric for use in Grades 5 and 6, although with a few adaptations, it could also be applied in higher grades. In primary schools, mathematical reasoning is used, for example, when exploring patterns and describing relationships. The introduction of algebraic reasoning into primary classrooms requires teachers to develop new competencies, as most teachers at this level have little experience with the rich and connected aspects of algebraic reasoning (Blanton and Kaput, 2005). In Switzerland, the mathematics standard expected of students at the end of primary school (Grade 6) is competence in verifying statements and justifying or falsifying results using data or arguments. In our project, the rubric consisted of four dimensions of sound algebraic reasoning (appropriate and comprehensible procedures; correct computations; comprehensible and detailed descriptions; and reasoning, illustrations and examples), as well as four levels of development (see Supplementary Material). By describing four development levels, teachers can potentially document the growth of these complex competencies over an extended period of time.
Following the theoretical outline, we formulated the following research questions:
1. Do teachers continue to use the practices implemented in the PD project?
2. How do the teachers' formative assessment practices change after the PD project?
3. Which teachers continue to use a rubric as part of their formative assessments?
Methods
Design
Our project, “Learning with rubrics,” began in 2015 and ran for 2 years. It was conducted at two teacher education universities in Switzerland (St. Gallen and Zug). The research design was quasi-experimental and longitudinal, and is set out in Table 1. Prior to the intervention phase (T1), we assessed students' mathematical reasoning abilities, and teachers and students completed questionnaires on their attitudes and related aspects of teaching, such as feedback quality. Next, all teachers participated in a 1-day workshop about the theory of mathematical reasoning. The same team members conducted the workshop. As part of the workshop, the intervention group (IG) received information about the use of rubrics, while the control group (CG) discussed mathematically tangential content on how to adapt textbook tasks.
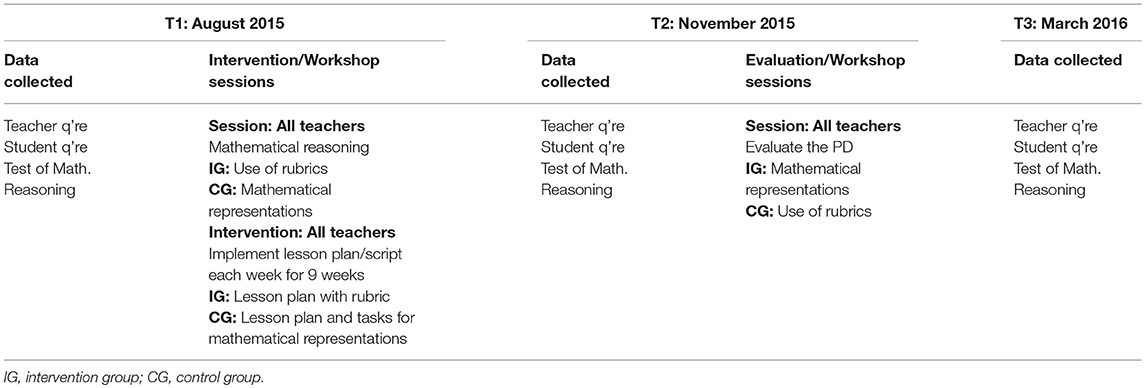
Table 1. Research design.
The PD lasted for 9 weeks, and all teachers were given a detailed lesson plan with a strict script each week for teaching mathematical reasoning. These plans entailed a socio-constructivist orientation, with collaborative group or peer work included in most lessons (e.g., the placemat technique). In the IG, the lesson plans included rubrics for self-assessment and teacher feedback. At the end of the PD, the teachers participated in a workshop to evaluate the PD. At that time (T2) we assessed students' mathematical reasoning abilities again, and students and teachers completed a second questionnaire. One part of the second workshop was used to evaluate the PD phase, while the second part was used to deliver the information that each group, respectively, missed in the first workshop. Thus, the IG was informed about mathematical representations among primary students, and the CG learned about the use of rubrics in formative assessment. About 5 months after the end of the PD (T3), students were assessed again on their mathematical reasoning abilities and students and teachers were asked to provide information about any on-going use of project tools (e.g., the rubric, the mathematical reasoning tasks, the teaching methods). The questionnaires and mathematical reasoning test were employed a third time. The choice of T3 was related, in part, to the 2-year project time granted, and it provides a first insight only into the on-going implementation of the project aims.
Sample
The teachers for our project were recruited with the help of an advertisement in the local teacher journal, and by personal requests. The initial sample consisted of 45 full-time teachers from two Swiss cantons (regions). Twenty-five teachers were women and 20 were men; the mean age was 41 years, and the mean service age was 11 years. Nine teachers taught Grade 5 classes, and 18 teachers taught Grade 6 classes. The remaining 18 teachers taught multi-grade classes with 4 teachers teaching Grade 4 students. The teachers were allocated to the intervention group (IG) or the control group (CG) using a “partly random” procedure so that there was an equal distribution of teachers by gender, age, grade level, and canton (district). Therefore, the IG and CG were parallel in relation to these variables. Twenty-two teachers participated in the intervention group (IG), and 23 participated in the control group (CG). During the project period, one teacher dropped out because of a heavy workload involving daily classroom work, and at T3, another two teachers withdrew for the same reasons. Thus, we obtained datasets for 44 classes with 23 students in Grade 4, 337 in Grade 5 and 402 in Grade 6 (totaling 762 students). Some students were missing at T2 and T3. Fifty-two percent of the students were boys and 48% were girls. For 25% of all students, German was not the main language spoken at home.
Instruments
Questionnaires
We employed questionnaires, one for the teacher and one for the students. In each questionnaire, a bundle of items were repeated at each time point complemented by items appropriate for a particular single time point. Background variables also included information on the students' nationality and special needs. Both questionnaires consisted of scales related to the model depicted in Figure 1. These scales for assessment and diagnosis skills, supportive feedback and peer and self-assessment were constructed based on existing items (Smit, 2009; Brown et al., 2012) or were newly developed based on the literature (Hargreaves et al., 2000; Hattie and Timperley, 2007). For the transmissive beliefs and the function of word problems as part of curricular knowledge (Shulman, 1987), items from Rakoczy et al. (2005) were employed. To measure the impact of the PD project, we used closed and open items in the questionnaire at T3. For the closed items, we asked about the frequency of the use of the rubric as well as about the inclusion of reasoning tasks as part of teaching mathematics. In the section with the open questions, the teachers were asked to give some brief information about their on-going use of the strategies used in the PD, e.g., the construction of their own rubrics or the development of their teaching practice with respect to mathematical reasoning tasks.
We mostly utilized a 6–point Likert scale for the questionnaire items. For example, for indicating the level of agreement to a statement, the scale was: 6 = absolutely agree; 5 = agree; 4 = somewhat agree; 3 = somewhat disagree; 2 = disagree; and 1 = absolutely disagree. For indicating how often certain situations occur during math lessons, the scale was: 6 = always; 5 = almost always; 4 = often; 3 = sometimes; 2 = seldom; and 1 = never. All items are presented in the Supplementary Material.
Five teacher scales for the study included: “Assessment and diagnosis” with 3 items (α = 0.75); “Supportive feedback” with 8 items covering task-, process-, and self-regulation and self-level (α = 0.73); “Peer and self-assessment” with 4 items (α = 0.79); “Transmissive beliefs” with 3 items (α = 0.63); and “Function of word problems” with 4 items (α = 0.63). Three student scales comprised: “Peer and self-assessment” with three items (α = 0.52); “Supportive feedback” with 5 items (α = 0.68); and “Assessment and diagnosis” with 5 items (α = 0.75). All Cronbach's alpha values were related to T1. For T2 and T3, the alpha values were mostly slightly higher.
Data Analysis
There were some missing values among the students who completed the questionnaire about their perceptions of feedback and assessment quality. Missing values also occurred for a few teachers. Given that these missing values were not due to the design of the study, we assumed that they occurred randomly and consequently applied the full information maximum likelihood (FIML) procedure as a model-based treatment of missing data (Enders, 2010).
As part of the qualitative analysis for each of the open questions, a standard thematic coding process was conducted (Braun and Clarke, 2006; Patton, 2015). Basically, the themes were already part of the questions, and the coding process aimed at identifying motivations, experience, and meaning within the theme of each question. When patterns of motivations, experience, and meaning were repeated, we used them as a basis for more general statements. Selected examples demonstrated the essence of the point. From a mixed-methods point of view, we applied a sequential QUAN → qual design with identical samples (Onwuegbuzie and Collins, 2007), with the two different methods being complementary. The results from each of the two methods allowed for elaboration, enhancement, illustration, and clarification (Caracelli and Greene, 1993).
The quantitative teacher and student data are presented descriptively, along with correlation coefficients. The interval between each category on the Likert scale were assumed to be approximately equal. This allowed us to conduct t-tests to check for IG and CG differences. Similar tests were used to determine change over time. Finally, we applied structural equation modeling (SEM) using the software Mplus Version 8 to test the relationships of the latent variables. As a combination of factor analysis and path analysis, SEM is appropriate for testing proposed theoretical models with latent variables. Because the units of analysis included teachers, and students nested within classrooms, a multilevel analysis was also applied. This procedure assumes that teachers influence students, and individual students in turn influence the properties of the class. As a consequence, variables may be defined at the student level and the class/teacher level.
All models were estimated with manifest variable indicators (parcels of items) to reduce the number of parameters calculated in complex models as a result of the sample size (Boivard and Koziol, 2012). To test whether the model was appropriate, model fit indices regarding the items were reviewed (Hu and Bentler, 1999).
Results
Do Teachers Continue to Use the Practices Implemented in the PD Project?
To answer our first question, we analyzed four single questions of the teacher questionnaire completed almost 5 months after the end of the project. Table 2 shows how frequently teachers reported that they still practiced four elements of the PD and Table 3 shows similar information for the IG and the CG separately. Our project was advertised as PD in the area of mathematical reasoning and in connection with the new Swiss curriculum 21. The rubric was introduced to enhance the students' learning of mathematical reasoning. Therefore, it was not very astonishing to find that the mean frequency of all teachers using mathematical tasks for reasoning and representation related to the PD and less with the rubric or making adaptations of textbook tasks. The variance (or S.D.) between the teachers was relatively high for all four project targets (ranging between 0.98 and 1.21). There were some teachers who continued using a rubric about every fortnight or more often, and some who never used it. From the correlations presented in Table 2, it might be deduced that the frequency of a rubric's application might have depended on the availability of appropriate reasoning tasks. Those teachers who had the time and the competence to adapt ordinary textbook tasks to make them suitable for mathematical reasoning also made more use of the rubric after the project finished. Teachers who worked less frequently with reasoning tasks in the classroom used a rubric less often. At first glance, one of the project's intentions, the introduction of tasks for mathematical reasoning and partly also for representation in daily classroom practice, demonstrated more sustainable effects. The teachers carried on applying such tasks between once a week and every fortnight. More surprising however, was the fact that not even the IG showed a more frequent use of the rubric than the CG (Table 3). If we look at it more closely, then we see that this outcome is much more the case for the teachers in the CG than for those in the IG (Table 3). One reason could be that teachers in the CG were required to adapt textbook tasks as part of the project implementation phase, while teachers in the IG worked with the rubric in the classroom.
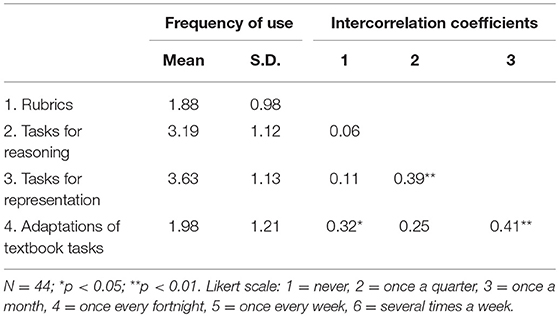
Table 2. Mean and standard deviation and intercorrelation coefficients of how frequently all teachers implemented the four project objectives 5 months after the project (T3).
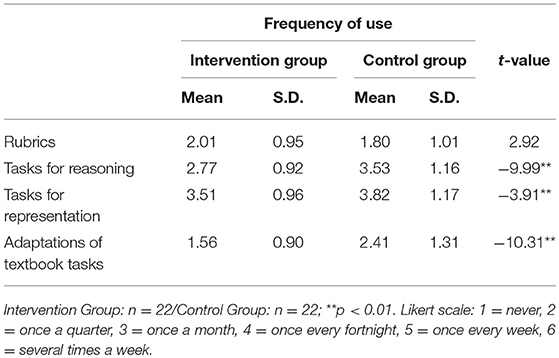
Table 3. Means, standard deviations, and t-values for group differences in how frequently teachers used four aspects of assessment 5 months after the project finished (T3).
The additional qualitative data illustrated how approximately one-third of the teachers further developed the use of rubrics after the end of the project. Some teachers merely continued working with the project rubric in their mathematics lessons. Others adapted the rubric for use in mother tongue (German) language lessons, e.g., as a mean for generating feedback for writing texts, for reading, or in oral situations. In science lessons, rubrics helped to assess student projects or presentations. The rubrics were applied for student self-assessment as well as for teacher assessment. When the teacher used the rubric, this action was often done in a summative way. As a starting point for the development of their own rubrics, a few teachers adapted existing rubrics from teaching books, or they turned criteria lists into rubrics. Existing rubrics were also revised, e.g., to make the level descriptions more substantive.
‘I adapted the rubric for the self- and teacher assessment of student self-chosen topics as well as text writing.’ (t 01GMR)
‘I added clear criteria to my own rubrics. I handed out my scoring rubrics to the students, which helps them to orientate themselves.’ (t 23LLJ)
‘Yes. [I created my own rubrics] with the help of learning goals in schoolbooks and the brochure, “Supporting and challenging students”.’ (t 10FFF)
As already noted, teachers worked more frequently with reasoning and representation tasks in the classroom. They even transferred reasoning exercises to other subjects.
‘Reasoning has become a more prominent competence during the school year. We argue much more, e.g., in the classroom council, in science, in German and in mathematics.’ (t 04CPG)
Apart from these results, some teachers took up pedagogical and methodological features from our lesson scripts. For example, three teachers mentioned that they used cooperative teaching methods, such as, placemat or jigsaw exercises more often.
How Do the Teachers' Formative Assessment Practices Change After the PD Project?
To answer the question whether the teachers developed their formative assessment practices after the project finished, we used students' perceptions to complement the teachers' self-reported qualitative data discussed below. A paired t-test for each assessment practice was conducted to explore differences over time and is reported in Table 4. According to the students, teachers' competence in assessment and diagnosis remained at the same level between T2 and T3. However, students felt that the amount of supportive feedback and peer or self-assessment decreased significantly. To check the reliability of the findings, we triangulated the student data with the teacher data to see whether there were any differences between each group's perceptions (Desimone et al., 2010). The findings from the teacher data mirrored those from the student data. Therefore, the perceptions of students and teachers were aligned and therefore, we have not presented the findings for teachers in another table.
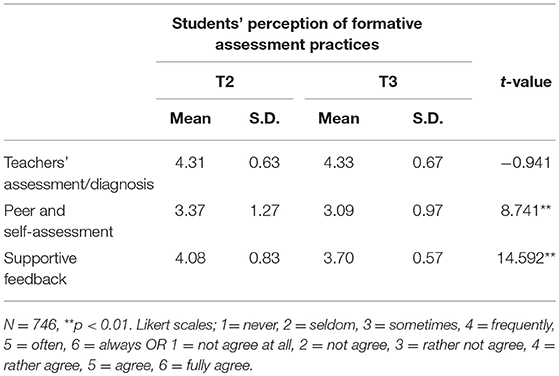
Table 4. Change in students' perceptions of formative assessment between the end of the project (T2) and 5 months later (T3).
The qualitative teacher data showed that approximately one quarter of all responding teachers did not change their feedback practice. Approximately half of the teachers in both groups developed their formative assessment practices in some way. For example, teachers more often gave individual, systematic, conscious, and frequent feedback to students—in verbal and in written ways. However, one difficulty encountered was the time needed for giving individual feedback to each student. The teachers now gave greater weight to students' approaches to solving a mathematical task and less weight to the correct solution of a mathematical task, making feedback more formative. By making the learning process the focus of closer attention, the students gained process knowledge, their thinking was stimulated, and they gained better self-assessment results. In general, more time was spent discussing student solutions. Three teachers mentioned explicitly the benefit of employing rubrics: students learned to do peer and self-assessment.
‘Yes, it is important to me, that the students develop the competence to self-assess and that they realize that it not enough to just present a solution, not only in mathematics but also in other subjects.’ (t 01ALI)
‘The students learned to give better-aimed feedback, e.g., with respect to process and explanation of the solution.’ (t 01GMR)
‘I give the students more time to exchange thoughts with other students. We discuss student solutions with the help of worked examples.’ (t 29WKM)
In a next step, we were interested to determine whether there was a lasting impact from our intervention by looking at those teachers who continued working with rubrics and how their classes perceived the three measured aspects of formative assessment 5 months later. The model in Figure 2 implies that the use of the rubric and the teacher's assessment precede giving supportive feedback. Both also influence the frequency of peer and self-assessment practices employed by the teacher. The rubric offers criteria for peer and self-assessment, and according to formative assessment theory, two forms of student assessment should support the teacher's assessment/diagnosis (Black and Wiliam, 2009).
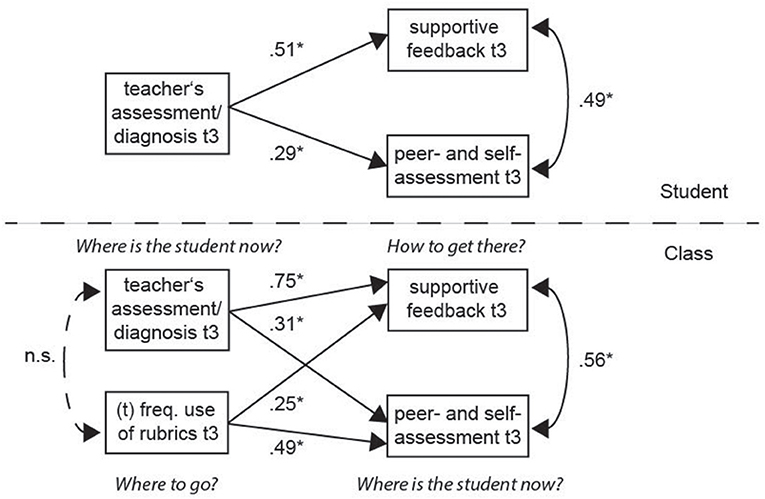
Figure 2. Standardized coefficients for the multilevel model of students' perceptions related to formative assessment and the teachers' use of rubrics. Nbetween = 42, Nwithin = 677; *p < 0.05; (t) = item of teacher questionnaire.
A first SEM was calculated using MPlus 8 with maximum likelihood estimation (MLR), and good fit values were obtained for a model with latent factors and manifest indicators [ = 0.00, CFI = 0.94, TLI = 0.92, RMSEA = 0.04, SRMRwithin = 0.04, and SRMRbetween = 0.13]. However, because the sample size is rather small, and many parameters needed to be calculated, these fit values were not completely trustworthy. Therefore, a similar model with parceled items was produced, meaning a total mean score for each scale was generated. This model with a reduced number of parameters (Figure 2) showed similar regression coefficients for each path as the model with manifest indicators. Finally, we switched to Bayesian estimation, which allows for better model estimation because large-sample theory is not needed (Muthén and Asparouhov, 2012). After conducting estimations for different iterations to determine convergence and PSR values, the outputs of the final model analysis produced stable results. The PPP value amounted to an ideal 0.46 and to an f difference of 3.875 (Lambert, 2018). On both class and individual student levels there were significant paths between the three aspects of formative assessment according to our model in Figure 1. The strongest path coefficients on the individual student level were found between teacher assessment and supportive feedback (β = 0.51) as well as between teacher assessment and peer and self-assessment (β = 0.49). Between peer and self-assessment, there was a lower path coefficient (β = 0.29). It must be noted that the significant path coefficients also indicated that the students in a class perceived formative assessment differently. Those who thought that they received more supportive feedback also stated that the teacher did more helpful assessment, and that peer and self-assessment were more salient features in the classroom.
A similar pattern was found at the class level, but overall, the path coefficients were slightly higher than at the student level. Most interesting was the additional teacher variable “frequency of the use of rubrics.” In classes where the teacher used rubrics more often, the class seemed to receive more supportive feedback and to conduct more peer and self-assessment. However, the frequency of using the rubric was not related to the helpful assessment/diagnosis of the teacher. In the students' eyes, the teacher could assess/diagnose well independent of using a rubric. The students saw the rubric mainly as a help to guide their learning and to determine where they were at the moment with respect to the goals.
Which Teachers Continue to Use a Rubric as Part of Their Formative Assessments?
Finally, we explored why some teachers used rubrics more often than others after the project finished. From theory (see section Introduction), it might be concluded that beliefs and pedagogical content knowledge (PCK) for mathematics have an influence on teachers' instructional practices. Therefore, we checked whether our scales for teachers' transmissive beliefs and the teachers' knowledge about the function of word problems might help to shed light on this question. While we could not find any relationship between the teachers' more traditional beliefs on teaching mathematics and the continuing use of rubrics, the results for the teacher knowledge about the function of word problems (PCK) were more elucidating. The related knowledge items are part of the curriculum knowledge in the domain map for mathematical knowledge of Hill et al. (2008).
We again calculated an SEM (Figure 3) using MPlus 8 with maximum likelihood estimation (MLR), and obtained good fit values (CFI = 0.99, TLI = 0.97, RMSEA = 0.06, and SRMR = 0.03). The model explained 22% of the variance between the teachers using rubrics at T3 and 48% of the variance between the teachers employing assessment/diagnosis practices at T3. As shown in Figure 3, there was quite a strong relationship between the teachers' knowledge about the function of word problems (PCK) at T1 and how frequently a rubric was used after the project finished. Higher self-assessed PCK also correlated with higher self-perceived teacher assessment/diagnosis at T1. Both variables were relatively stable over time. Although there were no other significant paths connected to the use of a rubric, it is interesting to see that the word problem-specific PCK at T3 also predicted which teachers said they practiced assessment/diagnosis at T3. Thus, teachers' PCK seemed, in some way, to play a role when PD for formative assessment is expected to have lasting effects for classroom practice. This result is similar to a comparable outcome from Diedrich et al. (2002). They reported that teachers with more knowledge about the function of word problems showed a more discursive teaching practice. They concluded that, in the mathematics lessons of teachers with higher knowledge about the function of word problems (PCK), the topic was first approached in small group settings before different approaches to the proof of the Pythagorean theorem were discussed.
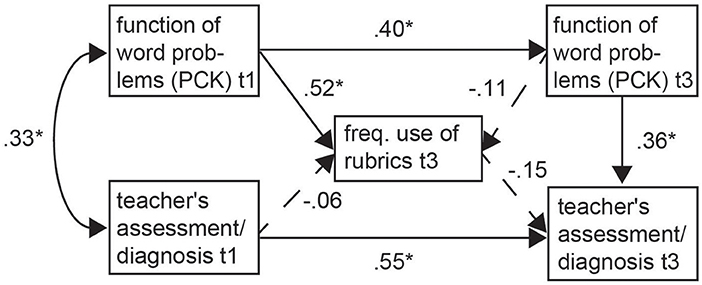
Figure 3. SEM model for the influence of teachers' knowledge about word problems on the use of rubrics and on teachers' assessment competence (teacher perceptions). N = 42; *p < 0.05; (PCK) = pedagogical content knowledge. All estimates are standardized.
Discussion and Conclusions
Our aim was to obtain an impression of the longer-term effects of the teacher PD project. We acknowledge that 5 months is not a very long time to check whether the teachers participating in the project had implemented any changes. However, the rather short time period was determined by the length of time for the project. Nevertheless, investigations of what occurs once a teacher PD finishes is only seldom pursued and therefore are of particular interest. We investigated the following three questions: 1. Do the teachers continue with the project objectives? 2. How do the teachers' formative assessment practices develop after the project's end? 3. Which teachers continue using a rubric as part of formative assessment?
With respect to the first question we can state that most teachers continued mainly with applying mathematical tasks related to the PD and less with the rubric. On average, teachers used the rubric once, if at all, after the project finished, while the mathematical reasoning or representation tasks were part of the lessons at intervals between every fortnight and every month. Teachers differed in how often they used these; teachers in the CG applied these tasks more often. It must be noted that the PD was targeted for teachers interested in learning how to teach mathematical reasoning. Most of the time during the first workshop was dedicated to this aspect. The use of rubrics was introduced to the IG as an additional feature. Therefore, teachers might not have viewed the rubric as an important (or key) aspect of the PD. It was surprising that the IG did not use the rubric more than the CG, on average. Constraints for applying the rubric included a lack of time and a lack of teacher competence to adapt ordinary textbook tasks to make them suitable for mathematical reasoning.
Borko et al. (2000) stated that although both teachers in their case study changed their approaches to assessment during the PD project, their assessments—particularly in mathematics—changed less than their instructional practices. This finding, although unexpected given the project's explicit focus on assessment, becomes more understandable when it is considered that teachers generally have more experience and expertise related to instruction than to assessment. Our project shows that at least some teachers developed their own rubrics, but they seem to have used them more for summative assessment and less as an instrument for teaching and learning. It looks as if they had not altered their assessment practices yet but had adopted the rubric as a useful instrument for their traditional ways of assessing.
That the teachers continued using mathematical reasoning tasks might also be due to the provision of a large number of tasks available for use in the classroom together with some methodological recommendations. A crucial point for successful PD is the incorporation of tools and new mathematical approaches into existing instructional practices (Borko et al., 2000). The introduction of resources during the process of teacher change is very important. Unless teachers have convenient and ready access to such resources, they are likely to ignore or resist efforts to change. For the use of rubrics to have had a more lasting effect it may have been helpful to offer a few more of them for other mathematical areas or for other subjects.
This point leads to the second question on whether the teachers' formative assessment practices remained the same as during the implementation phase. This outcome seemed true for the teachers' assessment competence but not for their assessment practices. According to the students, the teachers' assessment and diagnosis competence remained at the same level after the project finished. The amount of supportive feedback and peer or self-assessment, however, decreased significantly. The differences between teachers were particularly large for peer and self-assessment. The qualitative analysis showed that at least a few teachers positively changed their assessment practices in combination with their way of teaching mathematical word problems. This change was accomplished in more student-oriented ways. Tasks that foster mathematical reasoning abilities invite the use of multiple-solution strategies and multiple representations, and require students to explain or justify how they arrive at their answers (Stein et al., 1996). Teachers must be aware that it is not sufficient to present such tasks without creating an instructional environment with an emphasis on discourse. This practice is important for the teachers' understanding of students' thinking processes (Sfard, 2001; Ginsburg, 2009; Brodie, 2010). As noted above, the reason for teachers not maintaining the assessment practices could be that not all of the teachers saw the link between learning and formative assessment. As de Lange (1999) proposed in the Framework for Classroom Assessment in Mathematics, teachers should support students to use formative assessment when students solve problems, pose questions, and create mathematical arguments. The reasons for a lack of formative assessment practices are multiple (e.g., the great difficulty of designing fair, rich, open, and creative tasks; the way the feedback mechanism operates; and the organization and logistics of an opportunity-rich classroom) (de Lange, 1995).
Question three aimed at finding connections between the teachers' use of rubrics and their knowledge and beliefs. Because reasoning in mathematical lessons requires interaction with others, a socio-constructivist view of learning mathematics could be viewed as more favorable than a transmissive view (Voss et al., 2013). Thus, teachers' beliefs about mathematics teaching and learning can constrain the ways tasks are implemented (Swan, 2007), and as a consequence, unfavorable beliefs need to be altered. However, favorable beliefs do not guarantee adequate practices (Borko et al., 2000). It is also crucial to have an understanding of relevant pedagogical content knowledge (PCK) for the successful translation of a mathematical reasoning task for classroom use (Sullivan et al., 2009). Knowledge seems to play a role when teachers monitor and assess students' progress. Fennema et al. (1993) observed an exemplary teacher, who was able to engender a high degree of student metacognition because her knowledge of mathematics was extensive, accurate, and hierarchically organized. With respect to self-assessment, Ross et al. (2002) assumed that teachers might be reluctant to share responsibility for assessment if they were uneasy about their ability to defend their own assessment decisions. We could not detect a relationship between teachers' transmissive beliefs and the use of rubrics; however, mathematical PCK might play a role. We found that teachers' knowledge about the function of word problems (PCK) at the beginning of the project predicted how frequently they used a rubric after the project finished. However, we found no such relationship between PCK after the project had finished and the use of the rubric. The relationship with PCK over time was of medium stability, indicating that a few teachers might have adapted their knowledge about the function of word problems. Cautiously, it might be concluded that PCK for word problems is relevant for a successful and sustainable PD with the topic of mathematical reasoning supported with formative assessment practices.
Conclusions
When we look at the pre and post phases of our project, we can state that our PD was successful (Smit et al., 2017). There were positive effects from our control-group intervention with rubrics on the teachers' practices of assessment and feedback. With respect to the students, the project had positive impacts on their self-regulation competencies and their self-efficacy beliefs. Independent of placement in the intervention group, all students developed their mathematical reasoning competence. However, in Guskey's five-level model of PD evaluation (Guskey, 2002), level 4 focuses on the information about teachers' changes that can be gathered by questionnaires or structured interviews. This level cannot be evaluated immediately at the end of a project. Time must pass to allow participants to adapt the new ideas and practices to their settings. From their research, Borko et al. (2000) concluded that teachers are likely to take several years of experimentation before they truly integrate new ideas and practices into their instructional programs. Therefore, researchers should be careful when they report positive impacts from a teacher PD. It might be worthwhile to check after some time whether these positive developments vanished shortly after the project ended or whether they became a regular feature of teaching. Hence, more studies about the long-term effects of PD are needed.
Finally, as a recommendation for further PD and research, we think that the inclusion of teacher collaboration could have been beneficial for the sustainability of the goals of the project. Teacher collaboration is a crucial feature of successful PD. Collaboration among teachers fosters professional development by having common goals for change, by sharing materials, and by finding time to support each other on an on-going, long-term basis (Borko et al., 2000). It might be reasonable to assume that such collaboration could have led to more sustainable effects of our PD.
Ethics Statement
The study was carried out in accordance to the protocol and with principles enunciated in the current version of the Declaration of Helsinki, the guidelines of Good Clinical Practice (GCP) issued by ICH, in case of medical device: the European Regulation on medical devices 2017/745 and the ISO Norm 14155 and ISO 14971, the Swiss Law and Swiss regulatory authority's requirements. This study was not specifically reviewed and approved by an ethics committee, as this was not needed according to the national guidelines. The investigators explained the nature of the study, its purpose, the procedures involved, and the expected duration it may entail to each participant. Each participant was informed that participation in the study was voluntary and that he/she may withdraw. Written informed consent was obtained from all participants.
Author Contributions
RS and KH were head investigators and grant applicants, while the other three authors were project team members.
Funding
The presented project was funded by the Swiss National Science Foundation (project no. 149386).
Conflict of Interest Statement
The authors declare that the research was conducted in the absence of any commercial or financial relationships that could be construed as a potential conflict of interest.
Supplementary Material
The Supplementary Material for this article can be found online at: https://www.frontiersin.org/articles/10.3389/feduc.2018.00113/full#supplementary-material
References
Andrade, H., Du, Y., and Wang, X. (2008). Putting rubrics to the test: the effect of a model, criteria generation, and rubric-referenced self-assessment on elementary school students' writing. Educ. Meas. 27, 3–13. doi: 10.1111/j.1745-3992.2008.00118.x
Assessment Reform Group (ARG) (2002). Assessment for Learning: 10 Principles. University of Cambridge; Faculty of Education Available online at: https://www.aaia.org.uk/content/uploads/2010/06/Assessment-for-Learning-10-principles.pdf (Accessed November 5, 2012).
Avalos, B. (2011). Teacher professional development in Teaching and Teacher Education over ten years. Teach. Teach. Educ. 27, 10–20. doi: 10.1016/j.tate.2010.08.007
Bangert-Drowns, R. L., Kulik, C.-L. C., Kulik, J. A., and Morgan, M. (1991). The instructional effect of feedback in test-like events. Rev. Educ. Res. 61, 213–238. doi: 10.3102/00346543061002213
Black, P., and Wiliam, D. (1998). Assessment and classroom learning. Assess. Educ. 5, 7–74. doi: 10.1080/0969595980050102
Black, P., and Wiliam, D. (2009). Developing the theory of formative assessment. Educ. Assess. Eval. Account. 21, 5–31. doi: 10.1007/s11092-008-9068-5
Blanton, M. L., and Kaput, J. J. (2005). Characterizing a classroom practice that promotes algebraic reasoning. J. Res. Math. Educ. 36, 412–446. doi: 10.2307/30034944
Boivard, J. A., and Koziol, N. A. (2012). “Measurement models for ordered-categorical indicators,” in Handbook of Structural Equation Modeling, ed R. H. Hoyle (New York, NY: The Guildford Press), 495–511.
Borko, H. (2004). Professional development and teacher learning: mapping the terrain. Educ. Res. 33, 3–15. doi: 10.3102/0013189X033008003
Borko, H., Davinroy, K. H., Bliem, C. L., and Cumbo, K. B. (2000). Exploring and supporting teacher change: two third-grade teachers' experiences in a mathematics and literacy staff development project. Elem. Sch. J. 100, 273–306. doi: 10.1086/499643
Bradford, K. L., Newland, A. C., Rule, A. C., and Montgomery, S. E. (2015). Rubrics as a tool in writing instruction: effects on the opinion essays of first and second graders. Early Childhood Educ. J. 44, 1–10. doi: 10.1007/s10643-015-0727-0
Braun, V., and Clarke, V. (2006). Using thematic analysis in psychology. Qual. Res. Psychol. 3, 77–101. doi: 10.1191/1478088706qp063oa
Brodie, K. (2010). Teaching Mathematical Reasoning in Secondary School Classrooms. New York, NY: Springer. doi: 10.1007/978-0-387-09742-8
Brookhart, S. M. (2018). Appropriate criteria: key to effective rubrics. Front. Educ. 3:22. doi: 10.3389/feduc.2018.00022
Brown, G. T. L., Harris, L. R., and Harnett, J. (2012). Teacher beliefs about feedback within an assessment for learning environment: endorsement of improved learning over student well-being. Teach. Teach. Educ. 28, 968–978. doi: 10.1016/j.tate.2012.05.003
Caracelli, V. J., and Greene, J. C. (1993). Data analysis strategies for mixed-method evaluation designs. Educ. Eval. Policy Anal. 15, 195–207. doi: 10.3102/01623737015002195
de Lange, J. (1995). “Assessment: no change without problems,” in Reform in School Mathematics and Authentic Assessment, ed T. A. Romberg (Albany, NY: State University of New York Press), 87–172.
de Lange, J. (1999). Framework for Classroom Assessment in Mathematics. Utrecht: Freudenthal Institute and University of Madison, WI; National Centre for Improving Student Learning and Achievement in Mathematics and Science.
de Leeuw, J. (2016). “Rubrics and exemplars in writing assessment,” in Leadership of Assessment, Inclusion, and Learning, eds S. Scott, E. D. Scott, and F. C. Webber (Cham: Springer International Publishing), 89–110.
Desimone, L. M., Porter, A. C., Garet, M. S., Yoon, K. S., and Birman, B. F. (2002). Effects of professional development on teachers' instruction: results from a three-year longitudinal study. Educ. Eval. Policy Anal. 24, 81–112. doi: 10.3102/0162373702400208
Desimone, L. M., Smith, T. M., and Frisvold, D. E. (2010). Survey measures of classroom instruction. Educ. Policy 24, 267–329. doi: 10.1177/0895904808330173
Diedrich, M., Thussbas, C., and Klieme, E. (2002). “Professionelles lehrerwissen und selbstberichtete unterrichtspraxis im fach mathematik,” in Bildungsqualität von Schule: Schulische und außerschulische Bedingungen Mathematischer, Naturwissenschaftlicher und überfachlicher Kompetenzen, Zeitschrift für Pädagogik, Beiheft, eds M. Prenzel and J. Doll (Weinheim: Beltz), 107–123.
Earl, L. M. (2012). Assessment as Learning: Using Classroom Assessment to Maximize Student Learning. Thousand Oaks, CA: Corwin Press.
Fennema, E., Franke, M. L., Carpenter, T. P., and Carey, D. A. (1993). Using children's mathematical knowledge in instruction. Am. Educ. Res. J. 30, 555–583. doi: 10.3102/00028312030003555
Franke, M. L., Carpenter, T. P., Levi, L., and Fennema, E. (2001). Capturing teachers' generative change: a follow-up study of professional development in mathematics. Am. Educ. Res. J. 38, 653–689. doi: 10.3102/00028312038003653
Garet, M. S., Porter, A. C., Desimone, L., Birman, B. F., and Yoon, K. S. (2001). What makes professional development effective? Results from a national sample of teachers. Am. Educ. Res. J. 38, 915–945. doi: 10.3102/00028312038004915
Ginsburg, H. P. (2009). The challenge of formative assessment in mathematics education: children's minds, teachers' minds. Hum. Dev. 52, 109–128. doi: 10.1159/000202729
Guskey, T. R. (2002). Does it make a difference? Evaluating professional development. Educ. Leadersh. 59:45.
Hargreaves, E., McCallum, B., and Gipps, C. (2000). “Teacher feedback strategies in primary classrooms - new evidence,” in Feedback for Learning, ed A. Susan (London: Routledge), 21–31.
Harlen, W. (2006). “The role of assessment in developing motivation for learning,” in Assessment and Learning, ed J. Gardner (London: Sage), 61–80.
Hattie, J. (2008). Visible Learning: A Synthesis of Over 800 Meta-Analyses Relating to Achievement. London: Routledge. doi: 10.4324/9780203887332
Hattie, J., and Timperley, H. (2007). The power of feedback. Rev. Educ. Res. 77, 81–112. doi: 10.3102/003465430298487
Hill, H. C., Ball, D. L., and Schilling, S. G. (2008). Unpacking pedagogical content knowledge: Conceptualizing and measuring teachers' topic-specific knowledge of students. J. Res. Math. Educ. 39, 372–400.
Hu, L., and Bentler, P. M. (1999). Cutoff criteria for fit indexes in covariance structure analysis: conventional criteria versus new alternatives. Struct. Equat. Model. 6, 1–55. doi: 10.1080/10705519909540118
Lieberman, A., and Miller, L. (2001). Teachers Caught in the Action: Professional Development That Matters, Vol. 31. New York, NY: Teachers College Press.
Montgomery, K. (2000). Classroom rubrics: systematizing what teachers do naturally. Clear. House 73, 324–328. doi: 10.1080/00098650009599436
Moss, C. M., and Brookhart, S. M. (2010). Advancing Formative Assessment in Every Classroom: A Guide for Instructional Leaders. Alexandria, VA: ASCD.
Mui So, W. W., and Hoi Lee, T. T. (2011). Influence of teachers' perceptions of teaching and learning on the implementation of Assessment for Learning in inquiry study. Assess. Educ. 18, 417–432. doi: 10.1080/0969594X.2011.577409
Muthén, B. O., and Asparouhov, T. (2012). Bayesian structural equation modeling: a more flexible representation of substantive theory. Psychol. Methods 17, 313–335. doi: 10.1037/a0026802
Onwuegbuzie, A. J., and Collins, K. M. (2007). A typology of mixed methods sampling designs in social science research. Qual. Rep. 12, 281–316. Available online at: https://nsuworks.nova.edu/tqr/vol12/iss2/9
Opfer, V. D., and Pedder, D. (2011). Conceptualizing teacher professional learning. Rev. Educ. Res. 81, 376–407. doi: 10.3102/0034654311413609
Panadero, E., and Jonsson, A. (2013). The use of scoring rubrics for formative assessment purposes revisited: a review. Educ. Res. Rev. 9, 129–144. doi: 10.1016/j.edurev.2013.01.002
Paris, S. G., and Paris, A. H. (2001). Classroom applications of research on self-regulated learning. Educ. Psychol. 36, 89–101. doi: 10.1207/S15326985EP3602_4
Powell, D. R., Diamond, K. E., Burchinal, M. R., and Koehler, M. J. (2010). Effects of an early literacy professional development intervention on head start teachers and children. J. Educ. Psychol. 102:299. doi: 10.1037/a0017763
Rakoczy, K., Buff, A., Lipowsky, F., Hugener, I., Pauli, C., and Reusser, K. (2005). Dokumentation der Erhebungs- und Auswertungsinstrumente zur schweizerisch-deutschen Videostudie “Unterrichtsqualität, Lernverhalten und Mathematisches Verständnis”. Frankfurt am Main: Gesellschaft zur Förderung Pädagogischer Forschung.
Ross, J. A., Hogaboam-Gray, A., and Rolheiser, C. (2002). Student self-evaluation in grade 5-6 mathematics effects on problem-solving achievement. Educ. Assess. 8, 43–58. doi: 10.1207/S15326977EA0801_03
Sfard, A. (2001). There is more to discourse than meets the ears: looking at thinking as communicating to learn more about mathematical learning. Educ. Stud. Math. 46, 13–57. doi: 10.1023/A:1014097416157
Shulman, L. S. (1987). Knowledge and teaching: foundations of the new reform. Harv. Educ. Rev. 57, 1–23. doi: 10.17763/haer.57.1.j463w79r56455411
Shute, V. J. (2008). Focus on formative feedback. Rev. Educ. Res. 78, 153–189. doi: 10.3102/0034654307313795
Smit, R. (2009). Die formative Beurteilung und ihr Nutzen für die Entwicklung von Lernkompetenz. Baltmannsweiler: Schneider Verlag Hohengehren.
Smit, R., Bachmann, P., Blum, V., Birri, T., and Hess, K. (2017). Effects of a rubric for mathematical reasoning on teaching and learning in primary school. Instruct. Sci. 45, 603–622. doi: 10.1007/s11251-017-9416-2
Smit, R., and Birri, T. (2014). Assuring the quality of standards-oriented classroom assessment with rubrics for complex competencies. Stud. Educ. Eval. 43, 5–13. doi: 10.1016/j.stueduc.2014.02.002
Stein, M. K., Grover, B. W., and Henningsen, M. (1996). Building student capacity for mathematical thinking and reasoning: an analysis of mathematical tasks used in reform classrooms. Am. Educ. Res. J. 33, 455–488. doi: 10.3102/00028312033002455
Sullivan, P., Clarke, D., and Clarke, B. (2009). Converting mathematics tasks to learning opportunities: an important aspect of knowledge for mathematics teaching. Math. Educ. Res. J. 21, 85–105. doi: 10.1007/BF03217539
Swan, M. (2007). The impact of task-based professional development on teachers' practices and beliefs: a design research study. J. Math. Teach. Educ. 10, 217–237. doi: 10.1007/s10857-007-9038-8
Tang, X., Coffey, J., and Levin, D. M. (2015). Reconsidering the use of scoring rubrics in biology instruction. Am. Biol. Teach. 77, 669–675. doi: 10.1525/abt.2015.77.9.4
Turner, S. L. (2014). Creating an assessment-centered classroom: Five essential assessment strategies to support middle grades student learning and achievement. Middle School J. 45, 3–16. doi: 10.1080/00940771.2014.11461895
Underwood, J. S., and Tregidgo, A. P. (2006). Improving student writing through effective feedback: best practices and recommendations. J. Teach. Writ. 22, 73–98.
Voss, T., Kleickmann, T., Kunter, M., and Hachfeld, A. (2013). “Mathematics teachers' beliefs,” in Cognitive Activation in the Mathematics Classroom and Professional Competence of Teachers, eds M. Kunter, J. Baumert, W. Blum, U. Klusmann, S. Krauss, and M. Neubrand (New York, NY: Springer), 249-271.
Whitehurst, G. J., Epstein, J. N., Angell, A. L., Payne, A. C., Crone, D. A., and Fischel, J. E. (1994). Outcomes of an emergent literacy intervention in Head Start. J. Educ. Psychol. 86, 542–555. doi: 10.1037/0022-0663.86.4.542
Wiliam, D., and Thompson, M. (2007). “Integrating assessment with learning: what will it take to make it work?,” in The Future of Assessment: Shaping Teaching and Learning, ed C. A. Dwyer (Mahwah, NJ: Lawrence Erlbaum Associates), 53–82.
Wollenschläger, M., Hattie, J., Machts, N., Möller, J., and Harms, U. (2016). What makes rubrics effective in teacher-feedback? Transparency of learning goals is not enough. Contemp. Educ. Psychol. 44–45, 1–11. doi: 10.1016/j.cedpsych.2015.11.003
Keywords: professional development, sustainability, rubrics, primary school, mathematical reasoning
Citation: Smit R, Hess K, Bachmann P, Blum V and Birri T (2019) What Happens After the Intervention? Results From Teacher Professional Development in Employing Mathematical Reasoning Tasks and a Supporting Rubric. Front. Educ. 3:113. doi: 10.3389/feduc.2018.00113
Received: 09 July 2018; Accepted: 05 December 2018;
Published: 07 January 2019.
Edited by:
Mary Frances Hill, The University of Auckland, New ZealandReviewed by:
Raman Grover, British Columbia Ministry of Education, CanadaHaci Bayram Yilmaz, Ondokuz Mayis University, Turkey
Gavin T. L. Brown, The University of Auckland, New Zealand
Copyright © 2019 Smit, Hess, Bachmann, Blum and Birri. This is an open-access article distributed under the terms of the Creative Commons Attribution License (CC BY). The use, distribution or reproduction in other forums is permitted, provided the original author(s) and the copyright owner(s) are credited and that the original publication in this journal is cited, in accordance with accepted academic practice. No use, distribution or reproduction is permitted which does not comply with these terms.
*Correspondence: Robbert Smit, cm9iYmVydC5zbWl0QHBoc2cuY2g=