 Karoline Aslaksen
 Monika Haga
 Hermundur Sigmundsson
 Håvard Lorås
- 1Department of Psychology, Faculty of Social and Educational Sciences, NTNU – Norwegian University of Science and Technology, Trondheim, Norway
- 2Department of Teacher Education, Faculty of Social and Educational Sciences, NTNU – Norwegian University of Science and Technology, Trondheim, Norway
- 3Department of Sport Science and Physical Education, Reykjavík University, Reykjavik, Iceland
A well-known hypothesis amongst educators and the general public is that matching instructional method with an individual’s modality-specific learning style improves learning. Several critical reports in the past decade, however, have shown that the psychometric properties of the inventories applied to establish modality-specific learning styles have been poorly validated. Furthermore, theoretical development has challenged the theoretical basis for the modality-specific learning style model. Thus, the aim of the current study was to examine the psychometric properties and relationship between, two modality-specific learning style inventories: the Barsch Learning Style Inventory (BLSI) and the Learning Style Survey (LSS). University students (n = 242) completed the two inventories, and their responses were subjected to confirmatory and exploratory factor analysis, as well as analysis of inter-item agreement (internal consistency). The results failed to support the expected three-factor measurement model and thus indicated questionable reliability and factorial validity of the two inventories. Analysis of inter-correlations between factors from the two inventories resulted in a one-factor solution explaining up to 40% of the variance, which is discussed as emerging through an overall multimodal learning style.
Introduction
In many fields and professions, there has been an ongoing debate regarding the implications for, and effect on, skill learning that emerges from the interaction between individual differences and instructional strategies. For example, the theoretical question of the early 1900s postulated by Thorndike (1908) and as formulated by Reed (1931) concerned: “Does equal training make a group of individuals more alike or more different in their achievement?” (p. 1). This relatively early scientific interest in putative individual differences–instructional strategy interactions that affected learning outcomes have resulted in a plethora of subsequent research approaches and concepts. A theoretical concept that has emerged from these approaches is the notion of significant individual differences in learning style, which basically “refers to the concept that individuals differ in regard to what mode of instruction or study is most effective to them” (Pashler et al., 2008). The term learning styles first appeared in the literature many decades ago (e.g., Thelen, 1954) and has been the focus of extensive research in the past four decades, especially in Western Europe and the United States (Coffield et al., 2004; Evans et al., 2010).
The learning style literature in itself also demonstrates substantial heterogeneity in theoretical constructs and approaches. For example, the concept of learning styles has occasionally been considered equal to cognitive styles (Desmedt and Valcke, 2004). The latter term primarily refers to the form rather than the content of cognitive activities and is usually defined as “individual differences in the ways people perceive, think, solve problems, learn and relate to others” (Witkin et al., 1977). The two concepts differ in the area of focus, however, in that the concept of learning styles is explicitly concerned with the learning process, while cognitive styles have a more general and extensive application to human mental activities. Learning styles are thus individual differences in preferred ways of responding to learning tasks which might change depending on the environment or context (Armstrong et al., 2012). It has been established that more than 70 different learning style models have been presented in the literature, demonstrating heterogeneity to such a degree that it is virtually impossible to construct a single synthesized model (Coffield et al., 2004).
The most cited and best-known learning style perspective amongst teachers and educators’ states that individual differences in learning styles represent individual differences in modality-specific preferences (Howard-Jones, 2014). This specific version of the learning style hypothesis states that learners prefer to receive instruction through (or study with) a specific modality that is most effective for them (Willingham et al., 2015). The overarching assumption is that if individuals are given instruction in their preferred modality, they will experience enhanced learning outcomes, for example, people who prefer the auditory modality obtain enhanced learning outcomes if the instruction is given auditorily. This has also been termed the meshing hypothesis: individuals with differing modality-specific learning styles are thought to have improved learning outcomes if the instruction meshes with their preferred modality as opposed to the less preferred modality, regardless of the learning content or context. Most proponents of the learning styles concept believe in some form of the meshing hypothesis, and most accounts of how instruction should be optimized assume the meshing hypothesis (Pashler et al., 2008).
Positive attitudes toward the modality-specific learning style concept can be found across levels of education and in research approaches. Regarding the latter, Newton (2015) identified that nearly 90% of research published from 2013 to 2015 (in ERIC and PubMed databases) supported the use of learning styles in teaching and instruction. Furthermore, surveys have indicated that a substantial proportion of both primary and secondary school teachers, as well as K-12 teachers, respond in favor to statements aligned with modality-specific learning styles (Dekker et al., 2012; Howard-Jones, 2014; Gleichgerrcht et al., 2015; Ferrero et al., 2016). The same positive attitudes have been observed among two-thirds of United States higher education faculty, and many reports that learning style theory is a part of teacher education and curriculum as a textbook principle (Dandy and Bendersky, 2014; Meyer and Murrell, 2014; Cuevas, 2015; Newton and Miah, 2017).
The perspective of modality-specific learning styles, as with other learning-style taxonomies, is in principle a “type” theory, that is, learners must be classified into supposedly distinct groups, thus providing information that is said to be helpful in making instructional decisions. One can trace the lineage of such an approach back to the first modern typological theorizing in the personality field undertaken by the psychiatrist and psychoanalyst C.G. Jung, which was later incorporated into the Myers–Briggs Type Indicator test which remains widely used today in occupational settings (Lake et al., 2019). The widespread application of personality assessments such as the Myers–Briggs test promoted the development of type-based learning-style assessments, which in terms of modality-specific learning styles assumes that learners cluster into distinct groups based upon their preferred visual, auditory, or kinesthetic/tactile modality. Several models and assessments have been developed to classify learners into their modality-specific learning style, and they all share the central assumption that people have different preferences based upon a more dominant sense/modality which must be taken into consideration when designing instructional approaches (Riener and Willingham, 2010; Odendaal, 2015).
The psychometric measurement model that can be derived from the modality-specific learning style models appears to be relatively straightforward: Provided a learning-style questionnaire focusing on modality-based preferences, participants will volunteer preferences about their preferred mode of studying and taking in new information. Respondents answer behavioral statements by ranking (often by using a Likert scale) how well the statements describe them and their behavior during a learning situation. Thus, they should answer relatively consistently that they prefer, for instance, visual aids if they are to be classified as having a visual-specific learning style.
Subjected to statistical analysis, the abovementioned data should demonstrate a clear-cut, latent structure with the modality-specific learning styles emerging as non-correlated factors (see Figure 1). Provided that learning-style questionnaires focusing on preferences have (at least to some degree) psychometric reliability (i.e., a person’s score on one day predicts their score on another day; see Veres et al., 1987; Henson and Hwang, 2002), the existence of preferences with some coherence and stability is to be expected. Indeed, numerous datasets have been published demonstrating that various groups of people demonstrate differences in their modality-specific learning styles. The prevalence of the various styles varies considerably, however, and in some instances, people are classified with a multimodal learning style. In the latter example, responders report multiple preferences by scoring high on several modality-specific styles. In Table 1, we have pooled together studies that have applied the same VARK learning style inventory across populations of university students. As can be found in the table, many studies report a considerable prevalence of multimodal learning styles amounting to 47% across studies.
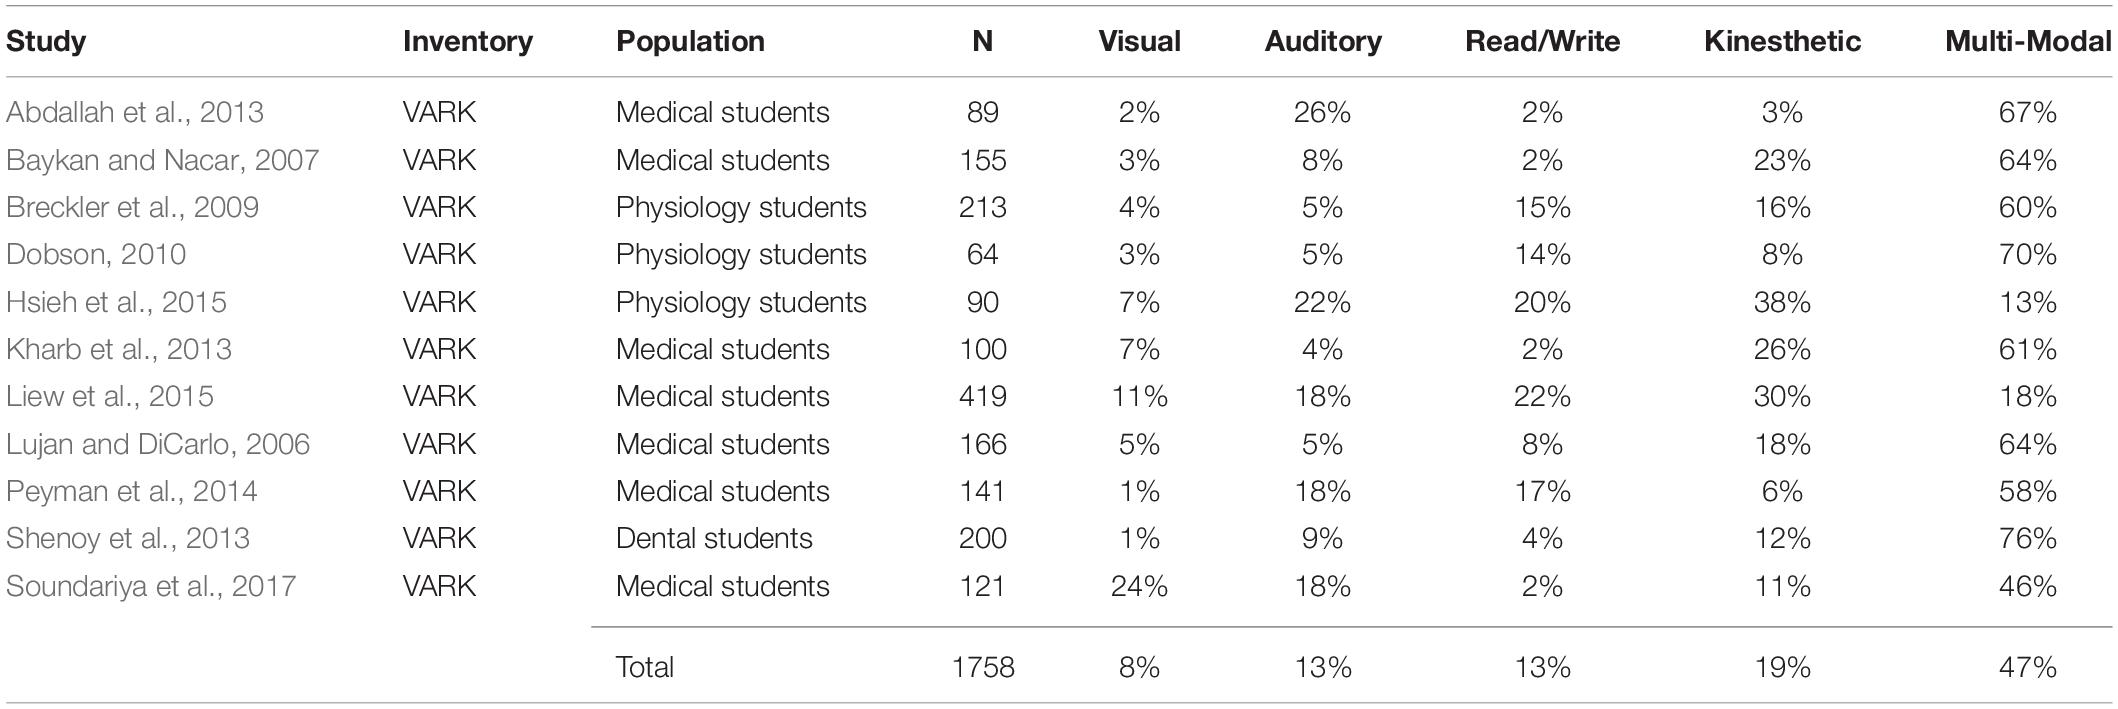
Table 1. Prevalence of modality-specific and multi-modal learning styles across studies applying the VARK inventory in university students.
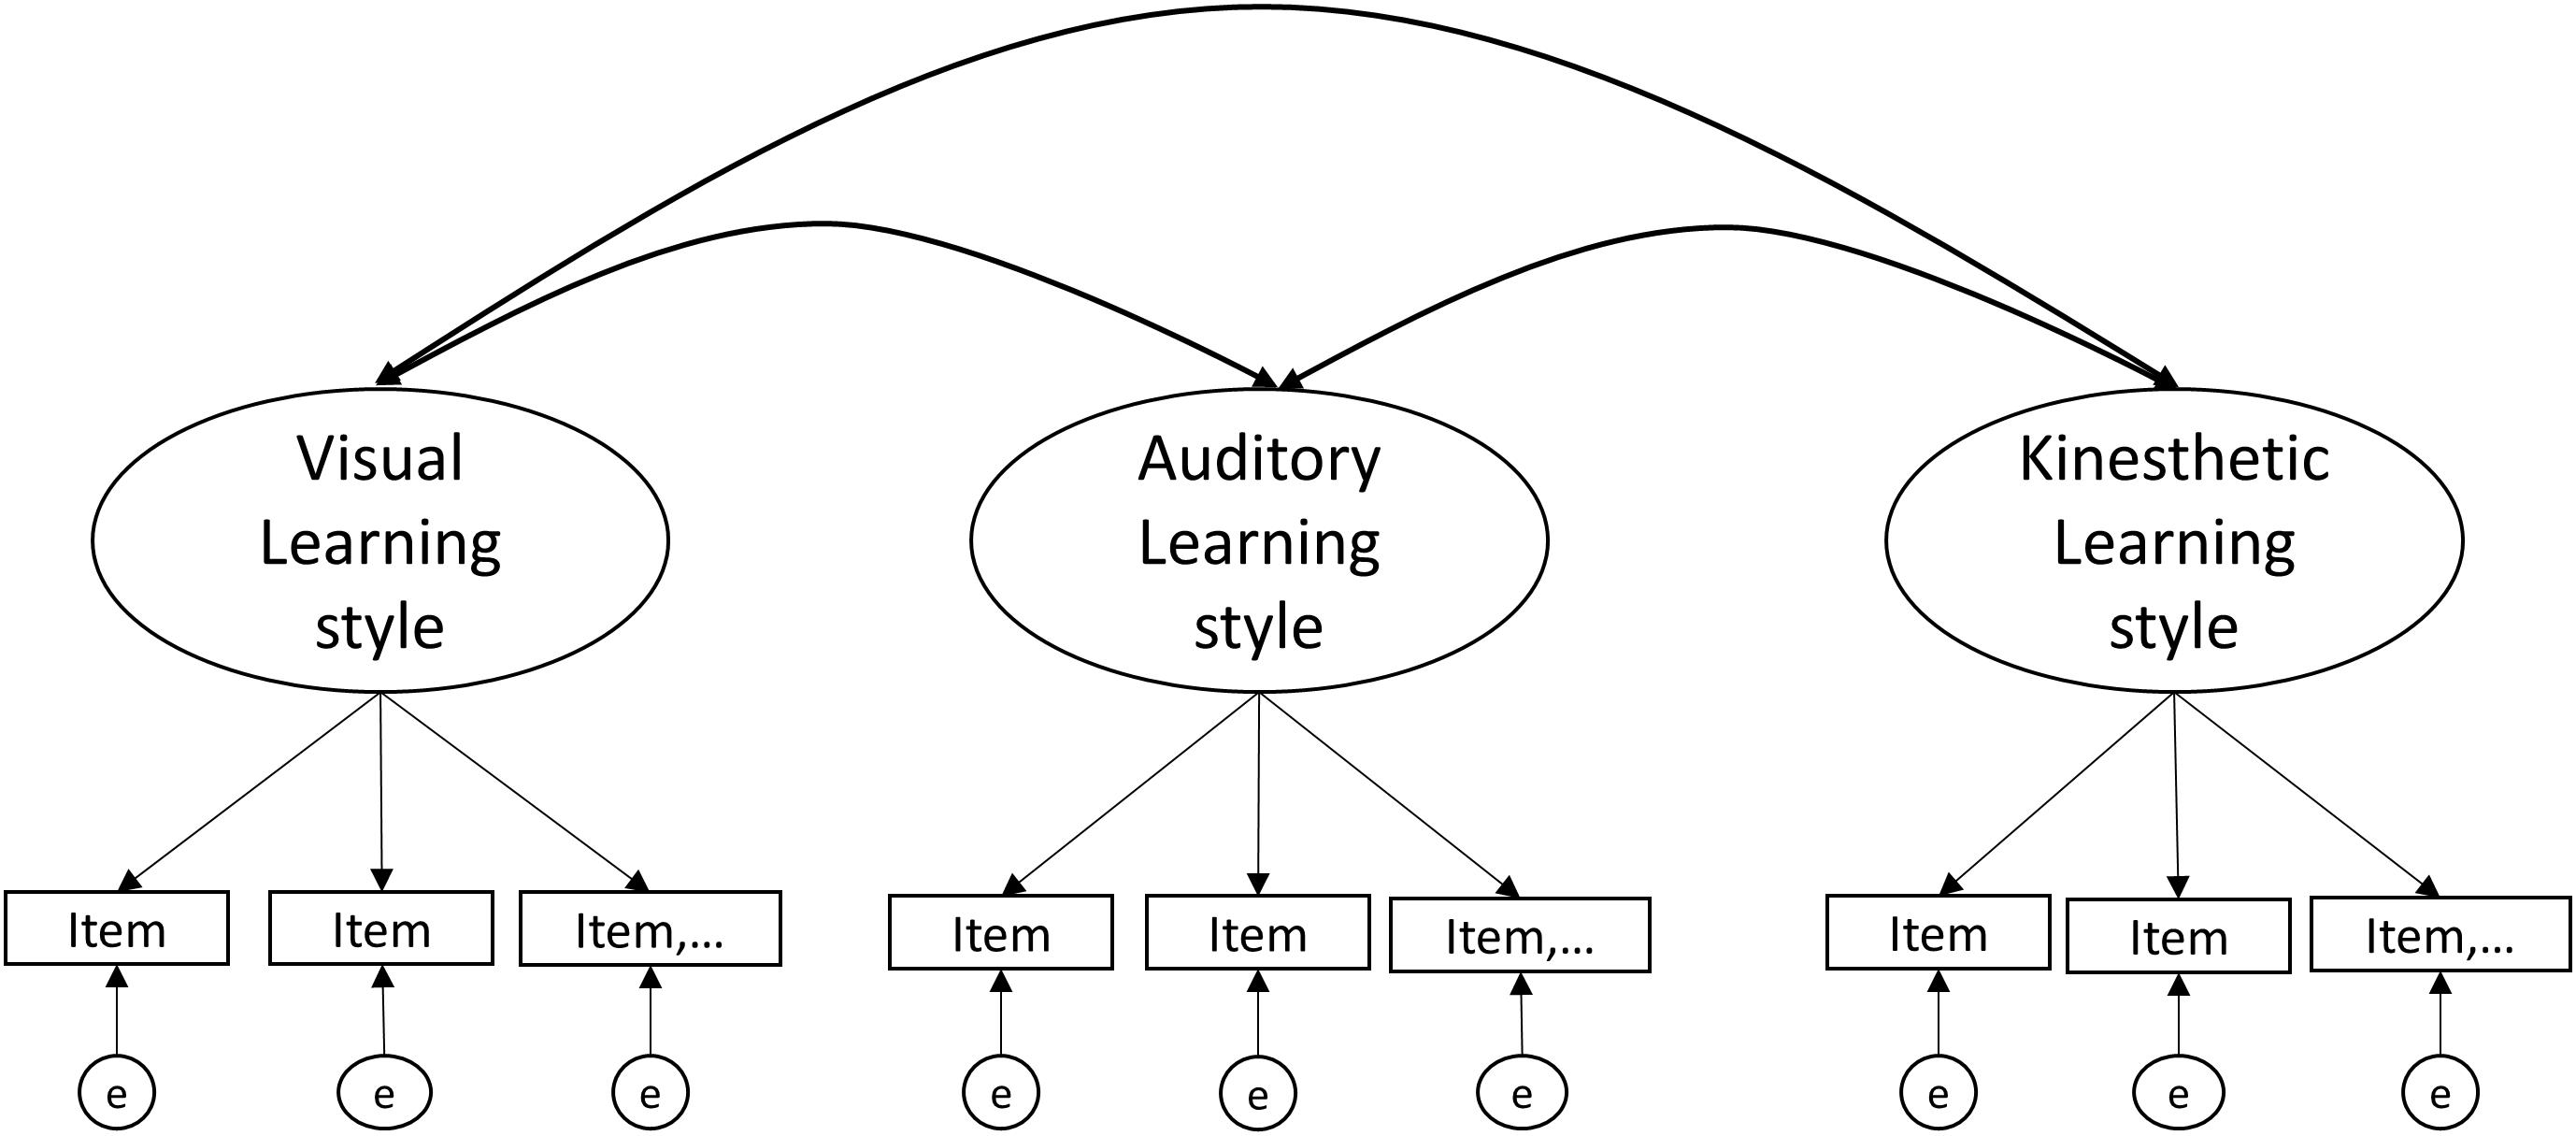
Figure 1. Overview of the psychometric measurement model from modality-specific learning style theory.
Previous studies conducted to evaluate the psychometric properties of self-assessment tools based upon different modality-specific learning style models have also generated mixed results. Leite et al. (2010) examined the dimensionality of the VARK learning styles inventory and reported that an expected four-factor model fitted the observed data and that the reliability estimates of the scores of the VARK were adequate. However, the authors also considered their results preliminary because not all indices supported the fit of the model and the estimated factor loadings of the VARK items were small to moderate. Odendaal (2015) also conducted factor analysis of responses from a modality-specific learning style questionnaire and did not obtain response patterns comparable to those suggested by theory. The principal component analysis (PCA) and cluster analyses suggested a pattern of underlying variables that was not aligned with modality-specific learning style theory and with weak principal component structure (low eigenvalues, few variables contributing to each component, and low percentage of variance explained by the model). Similarly, Wintergerst et al. (2001) performed exploratory factor analysis of the Perceptual Learning Style Preference Questionnaire (Reid, 1987) and results showed that specific survey items did not group into factors conceptually compatible with the learning style model.
In addition to the classification scheme and the psychometric assumptions, the modality-specific learning style perspective also seems to reflect a certain viewpoint on human learning. Although this feature has somewhat surprisingly been given far less attention by scholars in the modality-specific learning style field, the significance of the human senses has long been recognized in information-processing approaches toward learning (Atkinson and Shiffrin, 1968; Rumelhart et al., 1986). Such frameworks postulate that the material to be learned (input) must proceed through several stages of processing before eventually leading to a response and consolidation into long-term memory. The modalities are thus important sensory registers that convey information to working memory and other control processes that are important for learning. The modalities are by no means considered passive in the information processing, as they form important interactions with the various control processes (Craik and Lockhart, 1972). Under this approach, modality-specific learning styles can emerge through individual differences in the processing capabilities of the modalities. For example, the auditory system has faster processing speed/reaction times compared to the visual system (Jensen, 2006) and such differences might have an impact on the learning process. Furthermore, there might be modality-related differences originating from interaction with other cognitive processes. Regarding the latter point, research has demonstrated separate auditory and visual working memories (Vogel and Machizawa, 2004; Arnott et al., 2005) which can be selectively engaged during the learning process. One might not rule out the possibility, however, that modality-specific learning styles emerge through specific practice and learning within a specific modality, which across time translates to improved processing capacity compared with the less frequently applied modalities.
The modality-specific learning style perspective has undergone considerable scrutiny during the past two decades, and several reviews have pointed out a general lack of appropriate experimental evidence (Pashler et al., 2008; Aslaksen and Lorås, 2018). Furthermore, findings from the neurosciences, biological psychology, and cognitive psychology indicate that the modality-specific learning style theory may be contradictory to how processing and storage of memory occurs during the learning process (Dekker et al., 2012; Lodge et al., 2016). Although visual, auditory, and kinesthetic information are processed in different parts of the brain, these separate networks are densely interconnected and there is profound cross-modal activation and transfer of information between sensory modalities (Calvert et al., 2000). From this perspective, it is incorrect to assume that only one sensory modality is involved with information processing in the learning process (Crogman and Crogman, 2016).
The findings of cross-modal interconnectivity seem to fit well with the notion of human learning emerging alongside dynamic changes in neuronal organization. As the brain forms various networks based on an individual’s experience and development, groups of neuronal connections form a repertoire of behavioral patterns and connect different parts of the brain together (Edelman, 1993; Sporns, 2012). Together these neural groups create networks leading to connections that help form our thoughts and actions. Thus, the central nervous system adapts its structure and function in response to both internal and external influences, and neural plasticity is thus a prerequisite for learning and development (Kleim and Jones, 2008). Experience and learning will fine-tune these neuronal groups to form the basis for further learning and skill development. Although practicing a specific task will strengthen the neural connections involved in that task and thereby increase the likelihood of executing similar behavior in the future (Edelman, 1987; Sporns, 2011), it impossible to predict which neuronal pathways are ultimately involved when a skill is learned and developed.
The perspective of cross-modality, interconnectivity and plasticity of neuronal networks as central features in learning signifies what can be termed a dynamic and non-linear viewpoint on learning. From this perspective, substantial variability, and individuality in how people both approach and respond to learning tasks contributes to context-dependent learning effects (Chow et al., 2011). As opposed to modality-specific learning style models, this latter perspective advances the view that learners might prefer – and experience an increased learning rate with – a certain type of instruction in some instances, yet dissimilar instruction and aids in other contexts. When asked for preferences in various learning situations, as is the case with modality-specific learning style inventories, people might display considerable heterogeneity in their rating of behavioral statements. Thus, in principle, learners have all the learning styles at their disposal (Crogman and Crogman, 2016). Such responses might lead to poor internal consistency across items and emergence of other factor structures than what is expected based upon modality-specific learning style models.
Based on the presented considerations, which highlighted the modality-specific learning style perspective (meshing hypothesis), the corresponding psychometric measurement model, and theoretical and empirical challenges to the model, we conducted a study of the psychometric properties and relationship between two modality-specific learning style instruments: the Barsch Learning Style Inventory (BLSI) and the Learning Style Survey (LSS). Two research questions were addressed in our study:
(1) Does the latent structure of separate modality-specific learning-style instruments conform to the expected measurement model (see Figure 1)?
(2) What is the relationship between modality-specific learning style factors derived from the two different instruments?
Regarding the first question, we conducted confirmatory factor analysis (CFA) and reliability analysis of the two instruments. Specifically, we investigated whether the level of internal consistency (Cronbach’s alpha) is in accordance with established criteria and whether CFA demonstrates appropriate goodness-of-fit with the measurement model derived from modality-specific learning style theory. As to the second research question, we investigated the relationship between factors derived from the two instruments by correlational and exploratory factor analysis (principal component analysis, PCA). The modality-specific learning style perspective predicts that only similar factors should be correlated. For instance, the visual learning style factor derived from either instrument should be highly correlated.
Materials and Methods
Participants
Two hundred and forty-eight students were recruited from a university population (55 males, 192 females; mean [SD] age: 20.9 [2.5]) and responded to a questionnaire during lecture breaks consisting of the BLSI and LSS (see descriptions below). Total time to complete the questionnaires was 15 min. Participants were recruited through advertisement on information boards at campus, and thus represent a convenience sample. Given that there is no consensus regarding absolute sample size requirements for conducting factor analysis, we based our sample size upon an expected level of moderate-to-high communality derived from the expected measurement model, and the number of expected factors (6). In these instances, a n in the range of 200–300 is considered sufficient (MacCallum et al., 1999; de Winter et al., 2009). The participants received oral and written information about the purpose of the study, and then provided informed written consent before filling out the questionnaires. The Norwegian Centre for Research Data approved the study protocol.
Modality-Specific Learning Style Inventories
Translation
In the translation process, a pilot with 27 participants was conducted to examine whether the translation maintained the essence in the behavioral statements. Both the English and the translated Norwegian formats were handed out and the participants were requested to answer the original English version if they experienced the content of a behavioral statement to be dissimilar. Based on the results and feedback from the pilot, the questionnaires were revised and modified (see below).
Barsch Learning Style Inventory
The BLSI is a self-assessment tool which provides a score for the modality-specific learning styles, namely visual, auditory and kinesthetic (VAK) (Krätzig and Arbuthnott, 2006). The inventory consists of 24 behavioral statements, with eight statements corresponding to each of the three modality-specific learning styles. Respondents self-evaluate how often they perform each behavior, based on a three-point Likert-type scale (1 = seldom, 2 = sometimes, and 3 = often). The three options are scored by assigning points to each response (five points for often, three points for sometimes, one point for seldom). The responses provide three sum scores, one for each modality-specific learning style, with a maximum sum score of 40 and a minimum score of 8. Krätzig and Arbuthnott (2006) reported reliability measures (Cronbach’s alphas) of 0.54 for visual, 0.56 for auditory, and 0.38 for kinesthetic modality-specific learning styles from the BLSI.
In the translation process and after conducting the pilot, three of the statements from the BLSI were removed – one statement from each VAK scale – resulting in a total of 21 behavioral statements. The removed statements were considered not to be relevant to a Norwegian context for young adults or lost their meaning in the translation process. The removed statements were: Learn to spell better by repeating the letters out loud than by writing the word on paper (auditory), Learning spelling by “finger spelling the words” (kinesthetic), Grip objects in hands during learning period (visual).
Learning Style Survey – Part 1: How I Use my Physical Senses
Just like the BLSI, the LSS is a self-assessment tool, which consists of 11 parts (Cohen et al., 2009; Tight, 2010). The section of the LSS with relevance to this study was Part One, which provides a score for the modality-specific learning styles VAK. The tool consists of 30 behavioral statements, 10 statements corresponding to each VAK style. Respondents self-evaluate how often they perform each behavior, based on a 5-point Likert-type scale (0 = never, 1 = rarely, 2 = sometimes, 3 = often, 4 = always). The responses provide three sum scores, one for each VAK learning style, with a maximum score of 40 and a minimum score of zero.
Statistical Analysis
The distribution of scores in the dataset was investigated using the Kolmogorov–Smirnov test, histograms, and Q–Q plots. For research question 1, CFA was applied to the data from the university population, through SPSS AMOS, on the three modality-specific learning styles (VAK) originating from each of the two assessments (LSS and BLSI). The expected model for each questionnaire is presented in Figure 1, where circles represent latent variables and rectangles represent measured variables (items). Absence of a line connecting variables implies no hypothesized direct effect. Based on the CFA, the association between each subfactor of the proposed models was analyzed.
The multidimensional hierarchical model was evaluated against various types of overall goodness-of-fit indices for the constructed model: chi-squared (χ2) and normed chi-square (Barrett, 2007), root mean square error of approximation (RMSEA) (MacCallum et al., 1996), normed fit index (NFI) (Bentler and Bonett, 1980), and comparative fit index (CFI) (Bentler, 1990). The CFAs were conducted with the IBM AMOS 24.0 software (IBM, Armonk, New York, NY, United States). Reliability estimates for internal consistency and inter-item agreement for each factor was examined by Cronbach’s alpha coefficients (Cronbach, 1951).
For research question 2, summarized scores were calculated as a proxy of factor scores (Distefano et al., 2009) representing the different VAK learning styles from the LSS and BLSI inventories. The relationship between factor scores was first examined with Pearson product-moment correlations, and the dimensional structure of the correlation matrix was investigated through exploratory factor analysis. After the underlying structure of correlation matrices was established, we applied the following criteria to retain the extracted statistical components: (1) eigenvalue in accordance with the Kaiser criterion (Yeomans and Golder, 1982), (2) inspection of scree plots (Cattell, 1966), (3) eigenvalues larger than expected for permutations of random data (Horn, 1965), and (4) the standard error scree method (Zoski and Jurs, 1996). These statistical analyses were conducted with PASW statistics 25.0 (IBM, New York, NY, United States). In all analysis, p < 0.05 was applied as the criterion for statistical significance.
Results
Analyses for Research Question 1
Research question 1 addresses the extent to which responses from learning style inventories conform to the expected measurement model (Figure 1) and the degree of internal consistency. As predicted from learning style theory, participants’ responses should conform to three distinct modality-specific styles: visual, auditory or kinesthetic (VAK). As can be found in Table 2, the CFA resulted in heterogeneity in both absolute and incremental goodness-of-fit indices for both the BLSI and the LSS. A good model fit would provide an insignificant chi-square statistic at a 0.05 threshold (Barrett, 2007), which is clearly not the case in the current analysis. The normed chi-square (χ2/df), however, is below 3 for both inventories which signifies some degree of fit. A similar pattern emerges from inspection of the RMSEA indices, which have some degree of variation around the proposed 0.08 cut-off value. It is generally reported in conjunction with the RMSEA and in a well-fitting model that the lower limit is close to 0, while the upper limit should be less than 0.08 (MacCallum et al., 1996). This is clearly not the case in the current data. As for CFI and NFI, the obtained values seem to be well below what is considered to indicate good model fit (Bentler and Bonett, 1980; Bentler, 1990). Furthermore, large variations in internal consistency were also found for both inventories with Cronbach’s alpha ranging from 0.39 to 0.63 and 0.14 to 0.62 for the BLSI and the LSS factors, respectively (see Table 3).

Table 2. Goodness-of-fit indices for the psychometric measurement model applied to Barsch Learning Style Inventory and learning style survey.
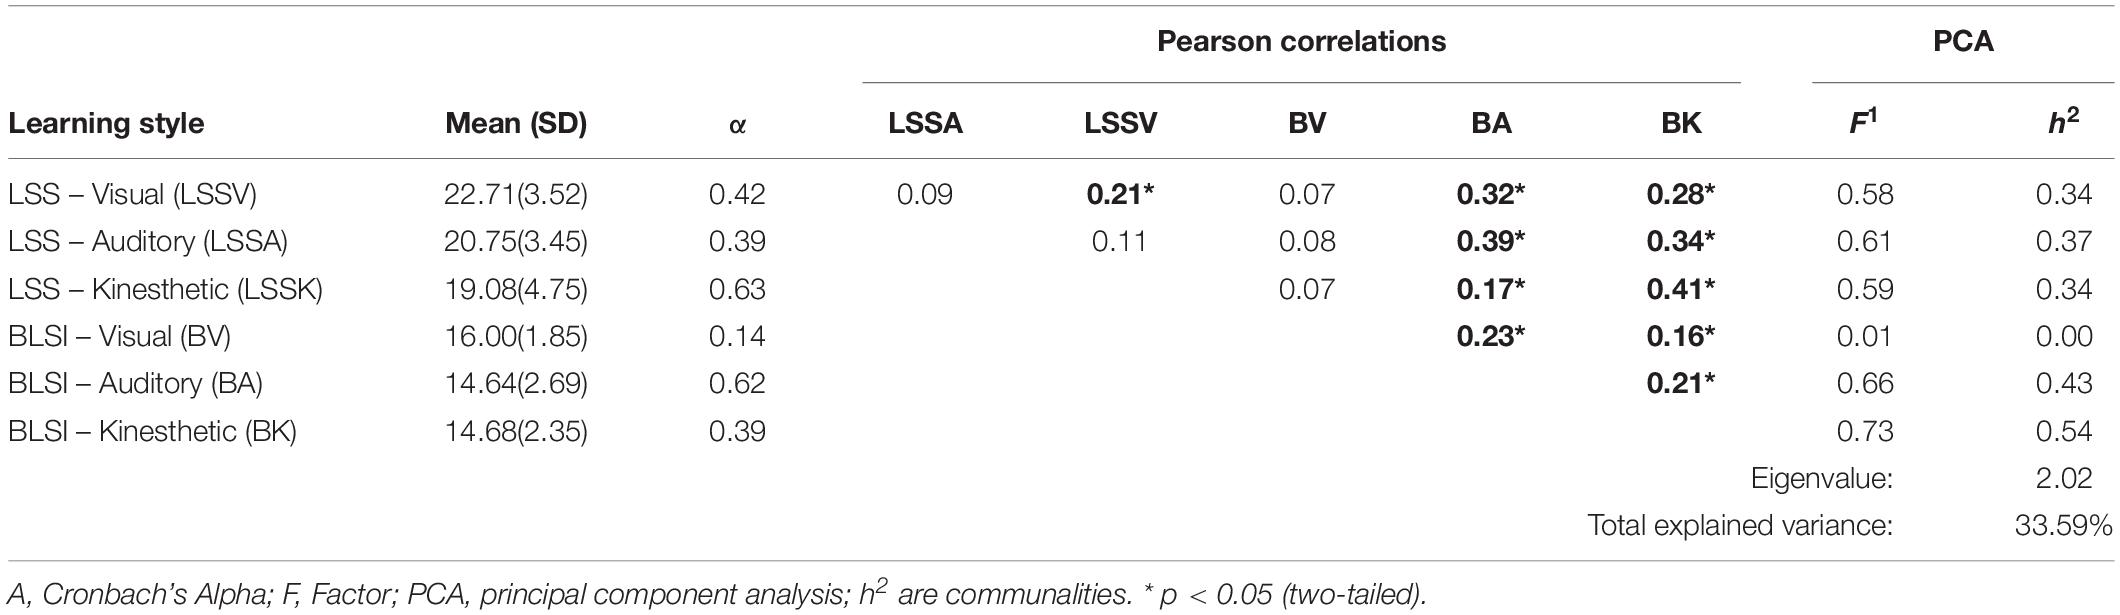
Table 3. Descriptive statistics, internal consistency (α), Pearson correlations, and overview of principal component analysis of visual, auditory and kinesthetic learning style factors (n = 248).
Analyses for Research Question 2
Research question 2 addresses the relationship between modality-specific learning style factors within and between learning style inventories. Across the sample, Bonferroni correction in independent samples t-tests indicated that there were no significant gender differences in VAK factor scores (t ≤ 3, df = 245, p > 0.05). Consequently, further analysis was conducted on the entire sample (n = 248). Table 3 reports across all six factors the whole-sample average and distribution (standard deviation). Raw Pearson product-moment correlations across all VAK factors that can be found in Table 3 indicate that all factors from the BLSI are significantly correlated and that the visual and kinesthetic factors from the LSS are significantly correlated. Furthermore, the BLSI visual and kinesthetic factors were significantly correlated to all three VAK factors computed from the LSS.
The observed significant correlations in Table 1, inspection of anti-image matrixes, Kaiser–Meyer–Olkin measure of sampling adequacy above 0.6, as well as a significant Bartlett’s test of sphericity (p < 0.001) indicated that the correlation matrix was legitimately factorable. The PCA of between-factor correlations resulted in a one-factor solution. The factor eigenvalue (above 1 in accordance with the Kaiser criterion), inspection of scree plot, as well as the standard error scree test indicated that there was only one factor. A Monte Carlo simulation (six variables, 248 subjects, 1000 replications) confirmed that this factor had an eigenvalue larger than expected for randomly generated data. The factor loadings, eigenvalues and total explained variance are presented in Table 3. It can be found that the retained one-factor solution had relatively high loadings from all factors (range 0.6–0.7), except for the visual learning-style factor extracted from the BLSI and explained about one third of the total explained variance. If the BLSI visual learning style factor was removed from the analysis, the total explained variance increased to ∼40%.
Discussion
The current study had two aims: (1) to examine the degree of fit between the psychometric measurement model originating from modality-specific learning style theory within the BLSI and the LSS and assess the internal consistency, and (2) to examine the relationship within and between modality-specific learning style factors derived from the two instruments. The first aim was carried out by conducting CFA on the responses from the two inventories as well as investigating the internal consistency using Cronbach’s alpha. In the context of the modality-specific learning style theory, participants should demonstrate clear modality-specific preferences for studying and taking in new information. Responses should thus conform to a measurement model with three factors corresponding to the VAK modalities (see Figure 1). The findings indicated that many of the goodness-of-fit values signified poor model fit (see Table 2). Furthermore, the internal consistency values (Cronbach’s alpha) were from low to medium level. The second aim was examined by investigating the correlations and factor structure (PCA) of VAK factor scores from the two inventories. According to modality-specific learning style theory, only the similar VAK factors should demonstrate intercorrelations. The findings, however, indicated significant correlations between most of the modality-specific learning style factors and a single statistical factor explaining on third of the variance. This latter measure increased to 40% if one of the (unreliable) factors was removed from the analysis (see Table 3).
Results from research question 1 showed that reliability estimates for interrelatedness of items obtained across VAK factors appeared to be, by any standard, too small to be interpreted as adequate for any of the two studied inventories. Although the interpretation of Cronbach’s alpha is not a straightforward scientific endeavor (Schmitt, 1996), the cut-off values presented in the literature indicating an adequate alpha level represent a higher magnitude. A Cronbach’s alpha level at 0.70 is typically applied as a hinge-point in many sources, at which lower levels should be (at least) interpreted as indicating a questionable interrelatedness of items (Streiner, 2003; Tavakol and Dennick, 2011). Bland and Altman (1997), on the other hand, recommended that for scales that are used as research tools for comparing groups, alpha values of 0.7 to 0.8 can be regarded as satisfactory. In more practical (clinical) applications, however, the authors stated that 0.90 is a minimum level. It is also well-known that a greater number of items in an inventory can artificially inflate the value of Cronbach’s alpha, and the number of pooled items in the current study (range 7–10 items per VAK factor) might indeed have introduced such an effect. If this was indeed the case, it should introduce even greater concern for the reliability estimates obtained in the current study for both the BLSI and the LSS. These findings also converge with alpha values from the BLSI obtained by Krätzig and Arbuthnott (2006) and Hansen and Cottrell (2013), which reported levels of Cronbach’s alpha around 0.50 for visual, 0.60 for auditory, and 0.40 for kinesthetic modality-specific learning styles, respectively. It thus appears that reliability estimates for internal consistency by Cronbach’s alpha, at least for a university population of examinees, signifies questionable interrelatedness of items for the modality-specific learning style inventories included in the current study.
The CFA on the expected measurement model (Figure 1) derived from modality-specific learning style theory did not seem to indicate a good fit to the data from either of the included inventories (see Table 1). Although some debate exists in the literature with regarding to the appropriateness of, and cut-off values for, different fit indices (Barrett, 2007), the overall pattern clearly suggests that the current data do not conform to the VAK learning style model. Similar results with structural equation modeling have been reported by Wintergerst et al. (2001), Duff and Duffy (2002), and Odendaal (2015) for other modality-specific learning style inventories. The results from those studies, and those from ours, clearly indicate that exploratory and CFA fails to show support for the existence of the VAK dimensions and learning styles proposed by theory.
In-depth examination of the inventories included in the current study might provide some explanation for the questionable levels of internal consistency and poor CFA model fit. First, and perhaps foremost, certain behavioral statements seem to be imprecise and ambiguous regarding the modality-specific learning style the item is intended to reflect. For instance, item 4 in the LSS inventory states: “I prefer to learn with TV or video rather than other media” and high agreement on the item is supposed to correspond to a visual learning style. However, this item might just as well reflect that university students prefer simultaneous audio-visual input in various learning contexts. Furthermore, some of the statements are vague about the fact that they do not seem to concern how individuals prefer to obtain and process information through different modalities in a learning context. For example, behavioral statement number 23 in the BLSI reads: “Feel very comfortable touching others, hugging, handshaking, etc.” It is not clear what aspect of modality-specific learning style this, and other items, is supposed to reflect upon. Indeed, ambiguity of behavioral statements has not only been a concern in the BLSI and LSS inventories, similar argumentation has been put forward by Leite et al. (2010) in realtion to another modality-specific learning style inventory.
Ambiguous items might lead to large variability in interpretation and invoke confusion among respondents. The lack of clarity might result in more random responses, or answers based on the respondent’s individual heuristic (Podsakoff et al., 2003). Indeed, Krätzig and Arbuthnott (2006) examined what reflections the respondents to the Barsch inventory used when they examined the different items. The findings indicated that the respondents did not use specific memories of how they learned in various situations, but rather applied more general memories and beliefs that ultimately determined their answers. The ambiguity of items and its potential consequences for examinees’ reflections and responses seem to provide a plausible explanation for the content heterogeneity (McCrae et al., 2011) observed in limited interrelatedness of items and poor CFA model fit observed in the current study.
Results for research question 2 indicated that most VAK factors demonstrated significant correlations within and between inventories (see correlation matrix reported in Table 3). Consequently, a one-factor structure emerged through PCA explaining one third of the variance. The explained variance for this one factor increased to 40%, however, if the visual learning style factor from the BLSI was removed from the analysis. These findings signify that the constructs overlap and demonstrates a different pattern of intercorrelations compared to what is predicted by modality-specific learning style theory. According to the latter, only the similar VAK factors extracted from different inventories should demonstrate significant correlations. This finding corresponds to the results obtained by Wintergerst et al. (2001), Krätzig and Arbuthnott (2006), Hansen and Cottrell (2013), and Odendaal (2015). Despite differences in inventories and study participants, all studies demonstrated intercorrelations between factors and lack of support for the expected factor structure. Neither study indicated any evidence to support the modality-specific psychometric model predicted by theory. The relatively modest amount of data collected exclusively to validate modality-specific learning style inventories thus suggest an overall problem with the application of various inventories as a tool to classify students into visual, auditory or kinesthetic learners.
Intercorrelations and shared variance across VAK factors, as observed in the current study, points to a different pattern of responding to inventories compared to predictions from modality-specific learning style theory. Participants are expected to answer behavioral statements by volunteering clear and consistent modality-specific preferences for studying and taking in new information. As this is clearly not the case in the presented data, a tendency among the participants to give answers that lean toward a mean sum score across all three learning styles emerges. Thus, by checking the answer “sometimes” across many items, the participants identify themselves with behavioral statements corresponding to each of the modality-specific learning styles. This in turn, can reflect the findings from several studies that point to a large proportion of respondents (up to as many as 85%) being indeed categorized as multimodal learners (e.g., Leite et al., 2010; Kharb et al., 2013; Whillier et al., 2014; Crogman and Crogman, 2016), as opposed to being classified within a specific VAK category (see Table 1). This preference for multimodality across learning contexts can provide an overly simple explanation for the one-factor solution that emerged in our PCA (see Table 3).
Intercorrelations between various scores, as observed between the VAK factors in the current study, are typically explained by positing the existence of an underlying and quantitative latent psychological factor (Johnson et al., 2008). Our one-factor result demonstrates similarities with what has been termed the positive manifold in differential psychology (Borg, 2018), in which assessments across a wide range of materials and content demonstrate a single factor that accounts for 40% or more of the total variance (Deary et al., 2010). Based on the results of the current study, a general and underlying multimodal learning style might thus be a plausible account of the observed one-factor solution. The notion of multimodality in learning is evident based upon the cross-modal activation and transfer of information that occurs between sensory modalities. In addition, the dynamic changes in neuronal organization as the brain forms various networks based on an individual’s experience and development, as well as the substantial variability, substantiates the idea of a multimodal learning style. Finally, individuality in how people both approach and respond to learning tasks that contributes to context-dependent learning effects challenges the modality-specific learning style theory (Chow et al., 2011). Thus, learners might prefer certain modalities in some situations and a more multimodal approach in other situations. The dissemination of such a one-factor theory in terms of an overall multimodal learning style, however, needs to be evaluated against other samples and inventories, and is clearly an avenue for further research.
The current study has limitations that warrant further investigation. Any psychometric study of various instruments needs to be evaluated against the sample of participants under investigation, as inventories might demonstrate different statistical properties across various populations. Still, one might argue that young adults from a university population represent an appropriate sample for evaluating the psychometric model based upon modality-specific learning style theory. These participants have long experience with various curricula and teaching at many (if not all) educational stages, as well as experience with their current habits for studying. Thus, they have had a substantial amount of teaching-related exposure that potentially has shaped their preferences across various learning contexts. Furthermore, this study does not include any performance- or ability-related assessments that are important for validating the modality-specific learning style hypothesis. This basic question, whether visual learners perform better in visual-processing tasks, has been examined in various other studies which have all indicated no relationship between modality-specific learning style and various task performances (e.g., Rogowsky et al., 2014; Aslaksen and Lorås, 2019).
Conclusion
The current study addressed the psychometric model (Figure 1) derived from modality-specific learning style theory. The findings indicated that across various statistical approaches, no evidence was obtained for the expected three-factor VAK model. Instead, a one-factor model emerged that explained a substantial proportion of the variance in the participants’ responses. Furthermore, estimates for internal consistency indicated questionable interrelatedness of items. These findings suggest that essential psychometric aspects of reliability and validity is not at acceptable levels in modality-specific learning style inventories, in which questions the use of these scores in classification of learners into supposedly distinct learning-style groups. A single higher-order factor also clearly points to the existence of multimodal learning preferences across learning contexts, as opposed to unidimensional preferences proposed by modality-specific learning style theory. Further study should thus investigate whether an overall multimodal learning style in principle applies to a certain degree in all learning situations.
Data Availability Statement
All datasets generated for this study are included in the article/supplementary material.
Ethics Statement
The studies involving human participants were reviewed and approved by the Norwegian Centre for Research Data. The patients/participants provided their written informed consent to participate in this study.
Author Contributions
KA, MH, HS, and HL contributed to the conception and design of the study. KA collected the data. KA and HL analyzed the data and wrote the first draft of the manuscript. All authors contributed to manuscript revision and read and approved the submitted version.
Conflict of Interest
The authors declare that the research was conducted in the absence of any commercial or financial relationships that could be construed as a potential conflict of interest.
References
Abdallah, A. R., Al-zalabani, A., and Alqabshawi, R. (2013). Preferred learning styles among prospective research methodology course students at Taiban University, Saudi Arabia. J. Egypt Public Health Assoc. 88, 3–7. doi: 10.1097/01.EPX.0000427506.57924.c1
Armstrong, S. J., Peterson, E. R., and Rayner, S. G. (2012). Understanding and defining cognitive style and learning style: a delphi study in the context of educational psychology. Educ. Stud. 38, 449–455. doi: 10.1080/03055698.2011.643110
Arnott, S. R., Grady, C. L., Hevenor, S. J., Graham, S., and Alain, C. (2005). The functional organization of auditory working memory as revealed by fMRI. J. Cogn. Neurosci. 17, 819–831. doi: 10.1162/0898929053747612
Aslaksen, K., and Lorås, H. (2018). The modality-specific learning style hypothesis: a mini-review. Front. Psychol. 2018:1538. doi: 10.3389/fpsyg.2018.01538
Aslaksen, K., and Lorås, H. (2019). Matching instruction with modality-specific learning style: effects on immediate recall and working memory performance. Educ. Sci. 9:32. doi: 10.3390/educsci9010032
Atkinson, R. C., and Shiffrin, R. M. (1968). Human Memory: A Proposed System And Its Control Processes. New York, NY: Academic Press.
Barrett, P. (2007). Structural equation modelling: adjudging model fit. Pers. Individ. Dif. 42, 815–824. doi: 10.1016/j.paid.2006.09.018
Baykan, Z., and Nacar, M. (2007). Learning styles of first-year medical students attending Wrciyes University in Kayseri. Turkey. Adv Physiol Edu 31, 158–160. doi: 10.1152/advan.00043.2006
Bentler, P. M. (1990). Comparative fit indexes in structural models. Psychol. Bull. 107, 238–246. doi: 10.1037/0033-2909.107.2.238
Bentler, P. M., and Bonett, D. G. (1980). Significance tests and goodness of fit in the analysis of covariance structures. Psychol. Bull. 88:588. doi: 10.1037/0033-2909.88.3.588
Borg, I. (2018). A note on the positive manifold hypothesis. Pers. Individ. Dif. 134, 13–15. doi: 10.1016/j.paid.2018.05.041
Breckler, J., Joun, D., and Ngo, H. (2009). Learning styles of physiology students interested in the health professions. Adv. Physiol. Educ. 33, 30–36. doi: 10.1152/advan.90118.2008
Calvert, G. A., Campbell, R., and Brammer, M. J. (2000). Evidence from functional magnetic resonance imaging of crossmodal binding in the human heteromodal cortex. Curr. Biol. 10, 649–657. doi: 10.1016/s0960-9822(00)00513-3
Cattell, R. B. (1966). Scree test for number of factors. Multivar. Behav. Res. 1, 245–276. doi: 10.1207/s15327906mbr0102_10
Chow, J. Y., Davids, K., Hristovski, R., Araújo, D., and Passos, P. (2011). Nonlinear pedagogy: learning design for self-organizing neurobiological systems. New Ideas Psychol. 29, 189–200. doi: 10.1016/j.newideapsych.2010.10.001
Coffield, F., Moseley, D., Hall, E., and Ecclestone, K. (2004). Learning Styles And Pedagogy In Post-16 Learning: A Systematic And Critical Review. London: Learning and Skills Research Centre.
Cohen, A. D., Oxford, R. L., and Chi, J. C. (2009). Learning Style Survey: Assessing Your Own Learning Styles. Available online at: http://carla.umn.edu/maxsa/documents/LearningStyleSurvey_MAXSA_IG.pdf (accessed September 30, 2019).
Craik, F. I., and Lockhart, R. S. (1972). Levels of processing: a framework for memory research. J. Mem. Lang. 11, 671–684. doi: 10.1016/s0022-5371(72)80001-x
Crogman, H., and Crogman, M. T. (2016). Generated questions learning model (GQLM): beyond learning styles. Cogent Educ. 3:1202460.
Cronbach, L. J. (1951). Coefficient alpha and the internal structure of tests. Psychometrika 16, 297–334. doi: 10.1007/bf02310555
Cuevas, J. (2015). Is learning styles-based instruction effective? A comprehensive analysis of recent research on learning styles. Theory Res. Educ. 13, 308–333. doi: 10.1177/1477878515606621
Dandy, K., and Bendersky, K. (2014). Student and faculty beliefs about learning in higher education: implications for teaching. Int. J. Teach. Learn. High. Educ. 26, 358–380.
de Winter, J. D., Dodou, D. I. M. I. T. R. A., and Wieringa, P. A. (2009). Exploratory factor analysis with small sample sizes. Multiv. Behav. Res. 44, 147–181. doi: 10.1080/00273170902794206
Deary, I. J., Penke, L., and Johnson, W. (2010). The neuroscience of human intelligence differences. Nat. Rev. Neurosci. 11:201. doi: 10.1038/nrn2793
Dekker, S., Lee, N. C., Howard-Jones, P., and Jolles, J. (2012). Neuromyths in education: prevalence and predictors of misconceptions among teachers. Front. Psychol. 3:429. doi: 10.3389/fpsyg.2012.00429
Desmedt, E., and Valcke, M. (2004). Mapping the learning styles “jungle”: an overview of the literature based on citation analysis. Educ. Psychol. 24, 445–464. doi: 10.1080/0144341042000228843
Distefano, C., Zhu, M., and Mindrila, D. (2009). Understanding and using factor scores: considerations for the applied researcher. Pract. Assess. Res. Eval. 14, 1–11.
Dobson, J. L. (2010). A comparison between learning style preferences and sex, status and course performance. Adv. Physiol. Educ. 34, 197–204. doi: 10.1152/advan.00078.2010
Duff, A., and Duffy, T. (2002). Psychometric properties of honey & Mumford’s learning styles questionnaire (LSQ). Pers. Individ. Dif. 33, 147–163. doi: 10.1016/s0191-8869(01)00141-6
Edelman, G. M. (1993). Neural darwinism: selection and reentrant signaling in higher brain function. Neuron 10, 115–125. doi: 10.1016/0896-6273(93)90304-a
Evans, C., Cools, E., and Charlesworth, Z. M. (2010). Learning in higher education – how cognitive and learning styles matter. Teach. High. Educ. 15, 467–478. doi: 10.1080/13562517.2010.493353
Ferrero, M., Garaizar, P., and Vadillo, M. A. (2016). Neuromyths in education: prevalence among Spanish teachers and an exploration of cross-cultural variation. Front. Hum. Neurosci. 10:496. doi: 10.3389/fnhum.2016.00496
Gleichgerrcht, E., Luttges, B. L., Salvarezza, F., and Campos, A. L. (2015). Educational neuromyths among teachers in Latin America. Mind Brain Educ. 9, 170–178. doi: 10.1111/mbe.12086
Hansen, L., and Cottrell, D. (2013). An evaluation of modality preference using a “Morse Code” recall task. J. Exp. Educ. 81, 123–137. doi: 10.1080/00220973.2012.678408
Henson, R. K., and Hwang, D. Y. (2002). Variability and prediction of measurement error in Kolb’s learning style inventory scores a reliability generalization study. Educ. Psychol. Meas. 62, 712–727. doi: 10.1177/0013164402062004011
Horn, J. L. (1965). A rationale and test for the number of factors in factor analysis. Psychometrika 30, 179–185. doi: 10.1007/bf02289447
Howard-Jones, P. A. (2014). Neuroscience and education: myths and messages. Nat. Rev. Neurosci. 15, 817–824. doi: 10.1038/nrn3817
Hsieh, C. T., Mache, M., and Knudson, D. (2015). Does student learning style affect performance on different formats of biomechanics examinations? Sports Biomech. 11, 108–119. doi: 10.1080/14763141.2011.637128
Jensen, A. R. (2006). Clocking the mind: Mental Chronometry And Individual Differences. Amsterdam: Elsevier.
Johnson, W., te Nijenhuis, J., and Bouchard, T. J. Jr. (2008). Still just 1 g: consistent results from five test batteries. Intelligence 36, 81–95. doi: 10.1016/j.intell.2007.06.001
Kharb, P., Samanta, P. P., Jindal, M., and Singh, V. (2013). The learning styles and the preferred teaching—learning strategies of first year medical students. J. Clin. Diagn. Res. 7, 1089–1092. doi: 10.7860/JCDR/2013/5809.3090
Kleim, J. A., and Jones, T. A. (2008). Principles of experience-dependent neural plasticity: implications for rehabilitation after brain damage. J. Speech Lang. Hear. Res. 51, 225–239.
Krätzig, G. P., and Arbuthnott, K. D. (2006). Perceptual learning style and learning proficiency: a test of the hypothesis. J. Educ. Psychol. 98, 238–246. doi: 10.1037/0022-0663.98.1.238
Lake, C. J., Carlson, J., Rose, A., and Chlevin-Thiele, C. (2019). Trust in name brand assessments: the case of the myers-Briggs type indicator. Psychol. Manag. J. 22:91. doi: 10.1037/mgr0000086
Leite, W. L., Svinicki, M., and Shi, Y. (2010). Attempted validation of the scores of the VARK: learning styles inventory with multitrait–multimethod confirmatory factor analysis models. Educ. Psychol. Meas. 70, 323–339. doi: 10.1177/0013164409344507
Liew, S.-C., Sidhu, J., and Barua, A. (2015). The relationship between learning preferences (styles and approaches) and learning outcomes among pre-clinical undergratuates medical students. BMC Med. Educ. 15:44. doi: 10.1186/s12909-015-0327-0
Lodge, J. M., Hansen, L., and Cottrell, D. (2016). Modality preference and learning style theories: rethinking the role of sensory modality in learning. Learn. Res. Pract. 2, 4–17. doi: 10.1080/23735082.2015.1083115
Lujan, H. L., and DiCarlo, S. E. (2006). First-year medical students prefer multiple learning styles. Adv. Physiol. Edu. 30, 13–16. doi: 10.1152/advan.00045.2005
MacCallum, R. C., Browne, M. W., and Sugawara, H. M. (1996). Power analysis and determination of sample size for covariance structure modeling. Psychol. Methods 1:130. doi: 10.1037/1082-989x.1.2.130
MacCallum, R. C., Widaman, K. F., Zhang, S., and Hong, S. (1999). Sample size in factor analysis. Psychol. Methods 4:84. doi: 10.1037/1082-989x.4.1.84
McCrae, R. R., Kurtz, J. E., Yamagata, S., and Terracciano, A. (2011). Internal consistency, retest reliability, and their implications for personality scale validity. Pers. Soc. Psychol. Rev. 15, 28–50. doi: 10.1177/1088868310366253
Meyer, K. A., and Murrell, V. S. (2014). A national study of theories and their importance for faculty development for online teaching. J. Distance Learn. Adm. Contents 17, 1–15. doi: 10.1111/j.1365-2923.2012.04350.x
Newton, P. M. (2015). The learning styles myth is thriving in higher education. Front. Psychol. 6:1908. doi: 10.3389/fpsyg.2015.01908
Newton, P. M., and Miah, M. (2017). Evidence-based higher education-Is the learning styles ‘myth’ important? Front. Psychol. 8:444. doi: 10.3389/fpsyg.2017.00444
Odendaal, A. (2015). (Mis) matching perceptual learning styles and practicing behavior in tertiary level Western Classical instrumentalists. Psychol. Music 44, 1–16. doi: 10.1177/0305735614567933
Pashler, H., McDaniel, M., Rohrer, D., and Bjork, R. (2008). Learning styles concepts and evidence. Psychol. Sci. Public Interest 9, 105–119. doi: 10.1111/j.1539-6053.2009.01038.x
Peyman, H., Sadeghifar, J., Khajavikhan, J., Yasemi, M., Rasool, M., Yaghoubi, Y. M., et al. (2014). Using VARK approach for assessing preferred learning styles of first year medical sciences students: a survey from iran. J. Clin. Diagn. Res. 8, 1–4. doi: 10.7860/JCDR/2014/8089.4667
Podsakoff, P. M., MacKenzie, S. B., Lee, J. Y., and Podsakoff, N. P. (2003). Common method biases in behavioral research: a critical review of the literature and recommended remedies. J. Appl. Psychol. 88:879. doi: 10.1037/0021-9010.88.5.879
Reed, H. B. (1931). The influence of training on changes in variability in achievement. Psychol. Monogr. 41:185.
Riener, C., and Willingham, D. (2010). The myth of learning styles. Change 42, 32–35. doi: 10.1080/00091383.2010.503139
Rogowsky, B. A., Calhoun, B. M., and Tallal, P. (2014). Matching learning style to instructional method: effects on comprehension. J. Educ. Psychol. 107, 64–78. doi: 10.1037/a0037478
Rumelhart, D. E., Hinton, G. E., and McClelland, J. L. (1986). A general framework for parallel distributed processing. Parall. Distribut. Process. 1:26.
Schmitt, N. (1996). Uses and abuses of coefficient alpha. Psychol. Assess. 8:350. doi: 10.1037/1040-3590.8.4.350
Shenoy, N., Ashok Shenoy, K., and Ratnakar, U. P. (2013). The perceptual preferences in learning among dental students in clinical subjects. J. Clin. Diagn. Res. 7, 1683–1685. doi: 10.7860/JCDR/2013/4940.3219
Soundariya, K., Deepika, V., and Kalaiselvan, G. (2017). A study on the learning styles and learning approaches among medical students. Natl. J. Physiol. Pharm. Pharmacol. 7, 1020–1025.
Streiner, D. L. (2003). Starting at the beginning: an introduction to coefficient alpha and internal consistency. J. Pers. Assess. 80, 99–103. doi: 10.1207/s15327752jpa8001_18
Thorndike, E. L. (1908). The effect of practice in the case of a purely intellectual function. Am. J. Psychol. 19, 374–384.
Tight, D. G. (2010). Perceptual learning style matching and l2 vocabulary acquisition. Lang. Learn. 60, 792–833. doi: 10.1111/j.1467-9922.2010.00572.x
Veres, J. G., Sims, R. R., and Shake, L. G. (1987). The reliability and classification stability of the Learning Style Inventory in corporate settings. Educ. Psychol. Meas. 47, 1127–1133. doi: 10.1177/0013164487474030
Vogel, E. K., and Machizawa, M. G. (2004). Neural activity predicts individual differences in visual working memory capacity. Nature 2004:748. doi: 10.1038/nature02447
Whillier, S., Lystad, R. P., Abi-Arrage, D., McPhie, C., Johnston, S., Williams, C., et al. (2014). The learning style preferences of chiropractic students: a cross-sectional study. J. Chiropr. Educ. 28, 21–27. doi: 10.7899/jce-13-25
Willingham, D. T., Hughes, E. M., and Dobolyi, D. G. (2015). The scientific status of learning styles theories. Teach. Psychol. 42, 266–271. doi: 10.1177/0098628315589505
Wintergerst, A. C., DeCapua, A., and Itzen, R. C. (2001). The construct validity of one learning styles instrument. System 29, 385–403. doi: 10.1016/s0346-251x(01)00027-6
Witkin, H. A., Moore, C., Goodenough, D. R., and Cox, P. W. (1977). Field-dependent and field-independent cognitive styles and their educational implications. Rev. Educ. Res. 47, 1–64. doi: 10.3102/00346543047001001
Yeomans, K. A., and Golder, P. A. (1982). The Guttman-Kaiser criterion as a predictor of the number of common factors. Statistician 31, 221–229.
Keywords: learning style, modality, psychometric, reliability, validity
Citation: Aslaksen K, Haga M, Sigmundsson H and Lorås H (2020) Evidence for a Common Multi-Modal Learning Style in Young Adults? A Psychometric Investigation of Two Modality-Specific Learning Style Inventories. Front. Educ. 5:40. doi: 10.3389/feduc.2020.00040
Received: 07 October 2019; Accepted: 27 March 2020;
Published: 21 April 2020.
Edited by:
Ana Lucia Pereira, Universidade Estadual de Ponta Grossa, BrazilReviewed by:
Sonia Brito-Costa, Instituto Politécnico de Coimbra, PortugalHorace Crogman, California State University, Dominguez Hills, United States
Copyright © 2020 Aslaksen, Haga, Sigmundsson and Lorås. This is an open-access article distributed under the terms of the Creative Commons Attribution License (CC BY). The use, distribution or reproduction in other forums is permitted, provided the original author(s) and the copyright owner(s) are credited and that the original publication in this journal is cited, in accordance with accepted academic practice. No use, distribution or reproduction is permitted which does not comply with these terms.
*Correspondence: Håvard Lorås, aGF2YXJkLmxvcmFzQG50bnUubm8=