 Florence Kyaruzi
 Jan-Willem Strijbos
 Stefan Ufer
- 1Department of Educational Psychology and Curriculum Studies, University of Dar es Salaam, Dar es Salaam, Tanzania
- 2Department of Psychology, Ludwig-Maximilians-Universität München, Munich, Germany
- 3Department of Educational Sciences, University of Groningen, Groningen, Netherlands
- 4Chair of Mathematics Education, Ludwig-Maximilians-Universität München, Munich, Germany
Using errors in mathematics may be a powerful instructional practice. This study explored the impact of a short-term professional development teacher training on (a) students’ perceptions of their mathematics teacher’s support in error situations as part of instruction, (b) students’ perceptions of error situations while learning, and (c) mathematics teacher’s actual error handling practices. Data were gathered from eight secondary schools involving eight teachers and 251 Form 3 (Grade 11) students in the Dar es Salaam region in Tanzania. To explore the effects of a short-term professional development teacher training, we used an exploratory quasi-experimental design with parallel pre-test and post-test instruments. Half of the teachers participated in the short-term professional development training in which they encountered and discussed new ways for utilizing student errors for instruction and provision of (plenary) feedback. Questionnaire scales were used to measure students’ perceptions of errors and perceptions of teacher support in error situations, along with videotaped lessons of plenary feedback discussions. Data were analyzed by latent mean analysis and content analysis. The latent mean analysis showed that students’ perceptions of teacher support in error situations (i.e., “error friendliness”) significantly improved for teachers who received the training but not for teachers who did not receive it. However, students’ perceptions of anxiety in error situations and using errors for learning (i.e., “learning orientation”) were not affected by the training. Finally, case studies of video-recorded plenary feedback discussions indicated that mathematics teachers who received the short-term professional development training appeared more error friendly and utilized errors in teaching.
Introduction
Formative assessment occurs in the context of good classroom instruction and it involves using assessment information to improve the teaching and learning process (Black and Wiliam, 2009; Ginsburg, 2009). Learning generally involves making errors (Wagner, 1981) which can be formative if students are supported with appropriate feedback and follow-up instruction (Ingram et al., 2015). Nevertheless, past analyses indicate that increases in student achievement from formative assessment are not easily achieved (Bennett, 2011; Veldhuis and Van den Heuvel-Panhuizen, 2014). For example, Rach et al. (2012) showed that even though students (a) valued the way in which their teachers’ dealt with errors in their mathematics classroom and (b) reported low anxiety in error situations, many students did not report using errors as a learning opportunity. They also showed that initiating changes in teachers’ classroom instruction that provide students cognitive strategies for using errors for learning is far from trivial. Hence, the aim of the present study is to explore the impact of a short-term professional development teacher training on (a) students’ perceptions of their mathematics teacher’s support in error situations as part of instruction, (b) students’ perceptions of error situations while learning, and (c) mathematics teacher’s actual error handling practices. Presumably, in light of the central role of the teacher in classroom settings, students’ use of errors for learning depends in part on the teacher’s monitoring and scaffolding of student learning from errors. Formative assessment is therefore central to students’ learning from errors because it calls for a productive use of student errors as a learning opportunity.
Theoretical Framework for Learning From Errors in Mathematics
The concept of “errors” or “mistakes” is used in various situations and contexts with various meanings (Frese and Keith, 2015; Metcalfe, 2017). On the one hand, errors are intrinsic and fundamental for learning because students are constantly engaged in learning new information and skills which involves making errors and improving accordingly (Frese and Keith, 2015). Nevertheless, Metcalfe (2017) considers that errors can be beneficial to learning, but only when followed by corrective feedback. Errors may occur in mathematics learning because of incorrect knowledge, application of incorrect procedures, and/or misconceptions. Moreover, errors emanate from a lack of negative knowledge that helps to identify and distinguish incorrect facts and procedures. Hence, in this study, we utilize the theory of negative knowledge which postulates that individuals possess two complementary types of knowledge: (a) positive knowledge about correct facts and procedures, and (b) negative knowledge about incorrect facts and procedures and typical errors (Minsky, 1994). Consequently, “error” is understood in the present study as the result of individual learning or problem-solving processes that do not match recognized norms or processes in accomplishing a mathematics task.
Errors in mathematics act as boundary markers, distinguishing between consistent and inconsistent practices of doing mathematics (Sfard, 2007). Nevertheless, when errors are effectively used they are likely to promote student learning and motivation (Kapur, 2014; Käfer et al., 2019). Tsujiyama and Yui (2018) noted that reflection on unsuccessful arguments in mathematical proof construction improved students’ ability to successfully plan, implement and analyze in proof related tasks. Kapur (2014) introduced the concept of productive failure after realizing that students who first reflected on unsuccessful solution attempts before receiving instruction developed more conceptual understanding and were able to transfer knowledge to a novel situation than students who immediately received instruction on how to correct their errors. Unlike Kapur (2014), this study examines students’ use of errors focusing on the student-teacher interaction in a formative assessment situation of the plenary feedback (formative) discussion on a mathematics test.
Despite the potential benefits of errors in mathematics learning, errors are negatively perceived by both students and teachers. Thus, the potential of errors to promote learning is rarely recognized or used, and discussing errors is rarely encouraged in mathematics classrooms (Borasi, 1994; Heinze, 2005; Rach et al., 2012). Studies in the domain of mathematics that used the Oser and Spychiger (2005) error perceptions questionnaire reported the positive impact of professional development training in error handling on teacher’s affective and cognitive support to students (Heinze and Reiss, 2007; Rach et al., 2012). Furthermore, Heemsoth and Heinze (2016) conducted a student focused intervention which showed that student reflection on their own errors improved their procedural and conceptual mathematics knowledge but not the use of their own errors for learning. In fact, Siegler and Chen (2008) have argued that although reflection on errors is important, it is more demanding for students to reflect on errors than reflect on a correct solution. This might explain the lack of effects on students’ use of their own errors for learning. As our ultimate goal is to have students use their errors to enhance their learning of mathematics, it is important that mathematics teachers be equipped with error handling strategies.
Teacher Error Handling Strategies in Mathematics Classes
In general, classroom practice consists of student-teacher interactions that include feedback exchanges on how students’ can correct their errors in order to achieve the desired learning outcomes (Monteiro et al., 2019). Rach et al. (2012) postulated that four practices are essential for effective learning from errors: (1) becoming aware of the error (error awareness) so as to identify or describe the error (error identification), (2) understanding the error or explaining it (error analysis), (3) correcting the error (error correction), and (4) developing strategies for avoiding similar errors in the future (error prevention). Solution paths that focus merely on error identification and correction are viewed as a pragmatic outcome-oriented approach, whereas solutions that involve all four steps are considered as an analytic process-oriented approach to learning from errors. The pragmatic approach to handling errors is likened to an instrumental view of teaching mathematics (Thompson, 1992) because in a pragmatic and instrumental view of teaching mathematics, the role of the teacher is to demonstrate, explain, and define the material while presenting it in an expository style while students listen and participate in didactic interactions. Conversely, the analytic process involves learning from the error through error analysis and error prevention strategies before correcting the error (Rach et al., 2012; Heemsoth and Heinze, 2016). Figure 1 illustrates the two approaches for learning from errors in mathematics classes. Presumably, students are likely to achieve “learning from own errors” if the prescribed steps of the error handling model are effectively utilized.
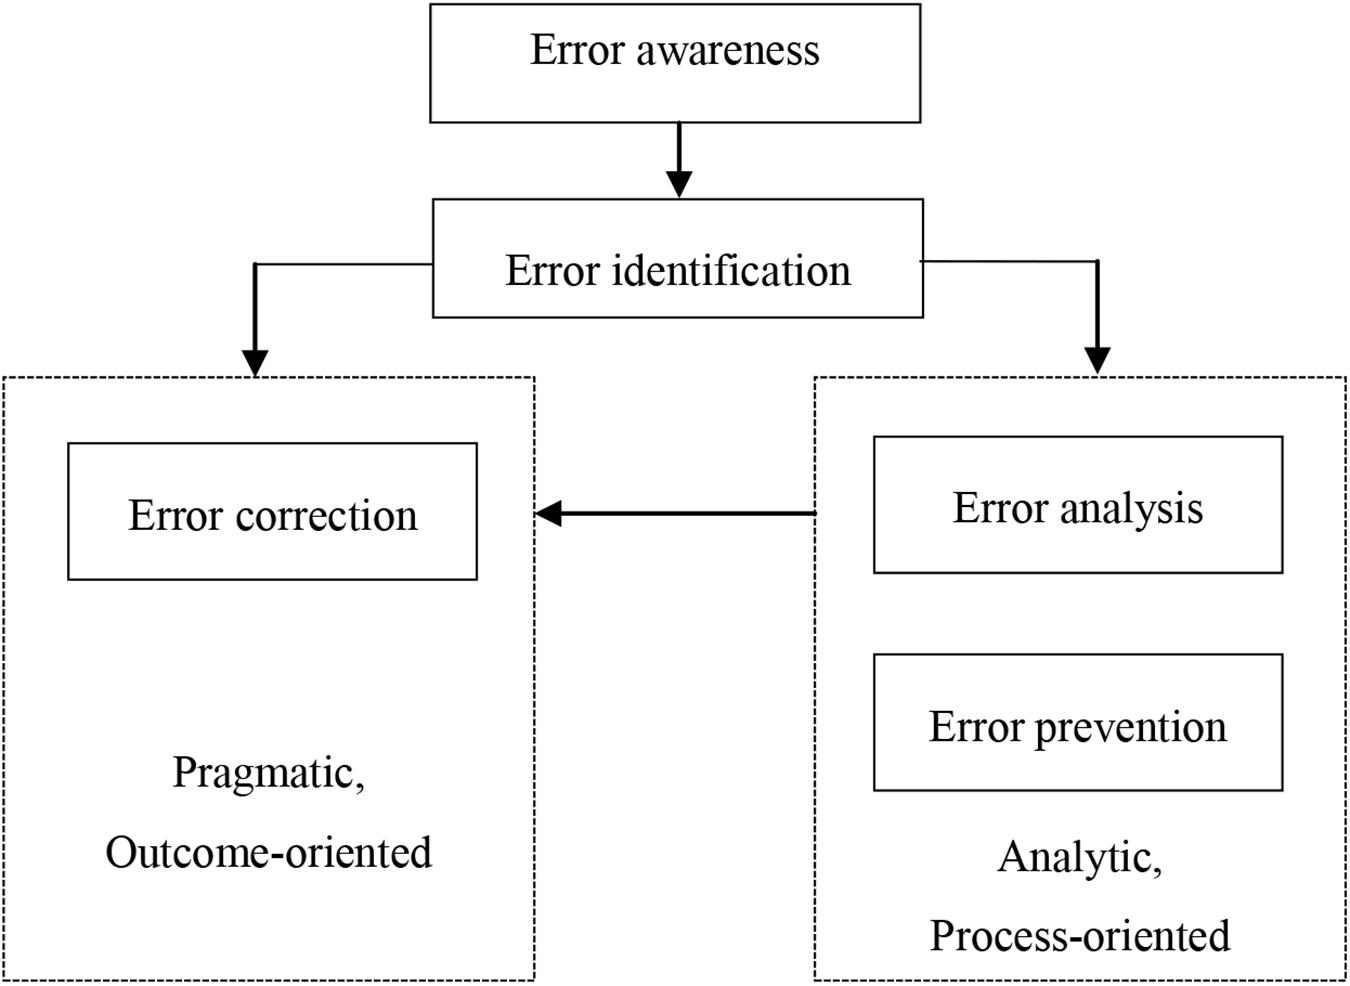
Figure 1. The model for learning from errors [adapted from Rach et al. (2012), p. 330].
Heemsoth and Heinze (2016) showed in an experimental study of learning fractions that the pragmatic outcome-oriented approach was not as effective as the analytic process-oriented approach. The decision between the two approaches depends on teachers’ and students’ appraisals of error situations and teacher behavior in error situations (Santagata, 2004; Rach et al., 2012). None of the previous studies have focused on teaching practices in the context of whole class plenary feedback discussion of student errors in a marked test (e.g., classroom instruction and feedback by the teacher). The Rach et al. (2012) study used a two-stage “train-the-trainer” approach, so it is an open question whether teachers’ cognitive support and students’ use of errors for learning can be developed by a more direct professional development training approach. Accordingly, mathematics teacher’s error handling strategies after direct professional development training deserve special attention.
Short-Term Professional Development Teacher Training
Professional development is considered to be any activity that aims at partly or primarily preparing staff members for improved performance in present or future roles as teachers (Desimone, 2009). In mathematics education, professional development has basically focused on assessment of the effectiveness of the professional training in pre-post-test forms. Such professional development training typically comprises large-scale intervention studies that document evidence of changes over an extended period of time; however, even a short termed (24-h) randomly assigned professional development training was shown to improve elementary-school teacher’s practices and students’ standardized assessment performance in science (Heller et al., 2012).
Recent discourses in the teaching of mathematics literature show that teachers need professional development because mathematics teaching involves classroom dynamics such as responding to student thinking, which teachers are not always prepared for during their initial teacher education (Hallman-Thrasher, 2017). The contingent classroom environment calls for professional development for teachers to adequately reflect on and respond to classroom realities. More specifically, teachers require specialized content knowledge that makes mathematical ideas visible to students through the use of effective instructional strategies (Takker and Subramaniam, 2019). Likewise, teachers need to be acquainted with the pedagogical content knowledge that guides a better interaction with students when they make errors or encounter difficulties.
Educational System and Assessment Practices in Tanzania
The education system of Tanzania is centralized and characterized by high-stakes examinations which hold long-term implications in deciding students’ future career. At the end of primary and secondary instructional cycles, students participate in external summative examinations centrally administered by the National Examinations Council of Tanzania (NECTA). However, to overcome overreliance on summative examinations Tanzania introduced in 1976 a Continuous Assessment (CA) program in secondary schools. CA provides the opportunity for teachers to meet and discuss with students the errors that they made in their (mathematics) tests and assignments. Conversely, Ottevanger et al. (2007) have pointed out that although most Sub-Saharan African countries – including Tanzania – have integrated school-based continuous assessment, testing at the school level remains mainly summative and is hardly used formatively, that is, for instructional purposes or to provide feedback on student errors. Thus, although curriculum and teaching guidelines emphasize a leaner-centered approach, Tanzanian mathematics teaching is heavily teacher-centered and examination-focused with a content overloaded curriculum (Ottevanger et al., 2007; Kitta and Tilya, 2010). Despite various initiatives by the government, mathematics education in secondary schools in Tanzania has suffered from high failure rates (Basic Educational Statistics in Tanzania [BEST], 2014). Several studies have examined specific educational challenges in Tanzania that might explain this: (a) the transition from Swahili as the language of instruction in primary schools to English in secondary schools (Qorro, 2013), (b) large class sizes (Basic Educational Statistics in Tanzania [BEST], 2014), (c) curriculum content overload (Kitta and Tilya, 2010), (d) lack of teachers’ assessment skills for effective implementation of school-based assessment (Ottevanger et al., 2007), and (e) the lack of in-service teacher professional development (Komba, 2007).
More specifically, it has been shown that secondary school mathematics teachers in Tanzania provide feedback to students’ assignments and tests using a relatively pragmatic approach in which a whole class plenary feedback discussion is used as opposed to individual feedback (Kyaruzi et al., 2018). Nevertheless, such plenary feedback discussions between students and their mathematics teacher do involve discussing and correcting errors made by students. In particular, the plenary feedback discussions aim at helping students to bridge the gap between their current mathematics performance and the desired standard. This study combines the existing error handling approaches from educational research while taking into account the specific local educational challenges (such as assessment in large classes) to examine the effectiveness of the whole class plenary discussion of student errors in a marked test (e.g., classroom instruction and feedback by the teacher). Therefore, it seems plausible that a short-term professional development teacher training in error handling strategies could improve mathematics teachers’ error handling and feedback practices, and subsequently student use of their own errors in learning.
The Present Study
The high mathematics failure rate among secondary schools students in Tanzania suggests, among other reasons, that teachers might lack important pedagogical and didactical competencies in implementing the proposed curriculum. In particular, Kyaruzi et al. (2018) noted that secondary school mathematics teachers in Tanzania face challenges with respect to using student assessment information to support learning. Hence, teachers’ practices deserve further investigation, and in particular their feedback practices in response to student errors and how students use such feedback to learn from their errors. Consequently, a short-term professional development training was developed as a potential intervention for improving mathematics teacher’s error handling strategies. More specifically, this study sought to explore the impact of a short-term professional development teacher training on (a) students’ perceptions of their mathematics teacher’s support in error situations as part of instruction, (b) students’ perceptions of error situations while learning, and (c) mathematics teacher’s actual error handling practices. More specifically, three research questions were examined:
1) What is the impact of a short-term professional development teacher training on students’ perceptions of their teacher’s support in error situations?
2) What is the impact of a short-term professional development teacher training on (a) students’ perceptions of individual use of errors in learning and (b) students’ anxiety in error situations?
3) What error handling strategies are practiced by teachers before and after a short-term professional development teacher training?
Based on insights from the literature, students whose teacher received the short-term professional development training might perceive their teachers as more supportive in handling error situations compared to students whose teacher did not. Although past research shows that it is not easy to foster student use of their own errors, there is some evidence that it can be improved via a (short-term) professional development teacher training (Heinze and Reiss, 2007; Rach et al., 2012). Hence, such a training might affect student use of their own errors for learning. In line with prior research (Heinze and Reiss, 2007; Rach et al., 2012) students whose teacher received the short-term professional development training might experience less anxiety compared to students whose teacher did not. Given that the short-term professional development training was directly with teachers, improved teacher use of student errors in learning could be reflected in their practices in terms of the use of analytic error handling strategies by teachers who received the training compared to those who did not.
Materials and Methods
Design and Participants
The study was conducted in the Dar es Salaam region of Tanzania. The region was sampled because according to statistics by the National Examinations Council of Tanzania (National Examinations Council of Tanzania [NECTA], 2014), mean mathematics performance in secondary schools in the Dar es Salaam region (M = 1.64, SD = 0.63) did not deviate significantly from the overall national mean (M = 1.55, SD = 0.65). Based on National Examinations Council of Tanzania [NECTA] (2014), the Dar es Salaam region had 191 secondary schools (with ≥40 students), classified according to performance as: 10 (5%) high performing, 173 (91%) middle performing, and eight (4%) low performing schools. In sampling schools, we prioritized schools with mixed gender (boys and girls) to maximize gender representativeness; 15 schools (seven high and eight low performing schools) met this criterion. In total eight schools were sampled from the two performance categories: four high performing and four low performing schools. High and low performing schools were sampled because Kyaruzi et al. (2018) found that students in these two school categories differed in their perceptions of teacher feedback practices. In schools with more than one class, one Form 3 (Grade 11) mathematics class was randomly sampled from each school. As classes are normally assigned students with mixed abilities, the single class is sufficiently representative. In the sampled classes, all students were invited to voluntarily participate in the study. We sampled Form 3 (Grade 11) classes because it is a grade with many school-based teacher assessment practices. The sampled students had an average age of 16 years.
We used an exploratory quasi-experimental pre-test, professional development teacher training, post-test repeated measures design in which half of the teachers was randomly assigned to the training in which they were taught new ways for utilizing student errors for instruction and provision of (plenary) feedback. The short-term professional development training consisted of an extensive 1-day teacher training on error handling strategies in plenary feedback discussions of a written test. Two teachers from each school-performance category (high, low) were randomly assigned to the group which received the professional development training (experimental group) or the group who did not (control group). Table 1 provides an overview of students’ and teachers’ demographics split by research condition. All observed differences in Table 1 were statistically not significant, except for the age of boys; the boys in the experimental group were older by a large margin, F (133, 1) = 29.03, p < 0.001, d = 0.93).
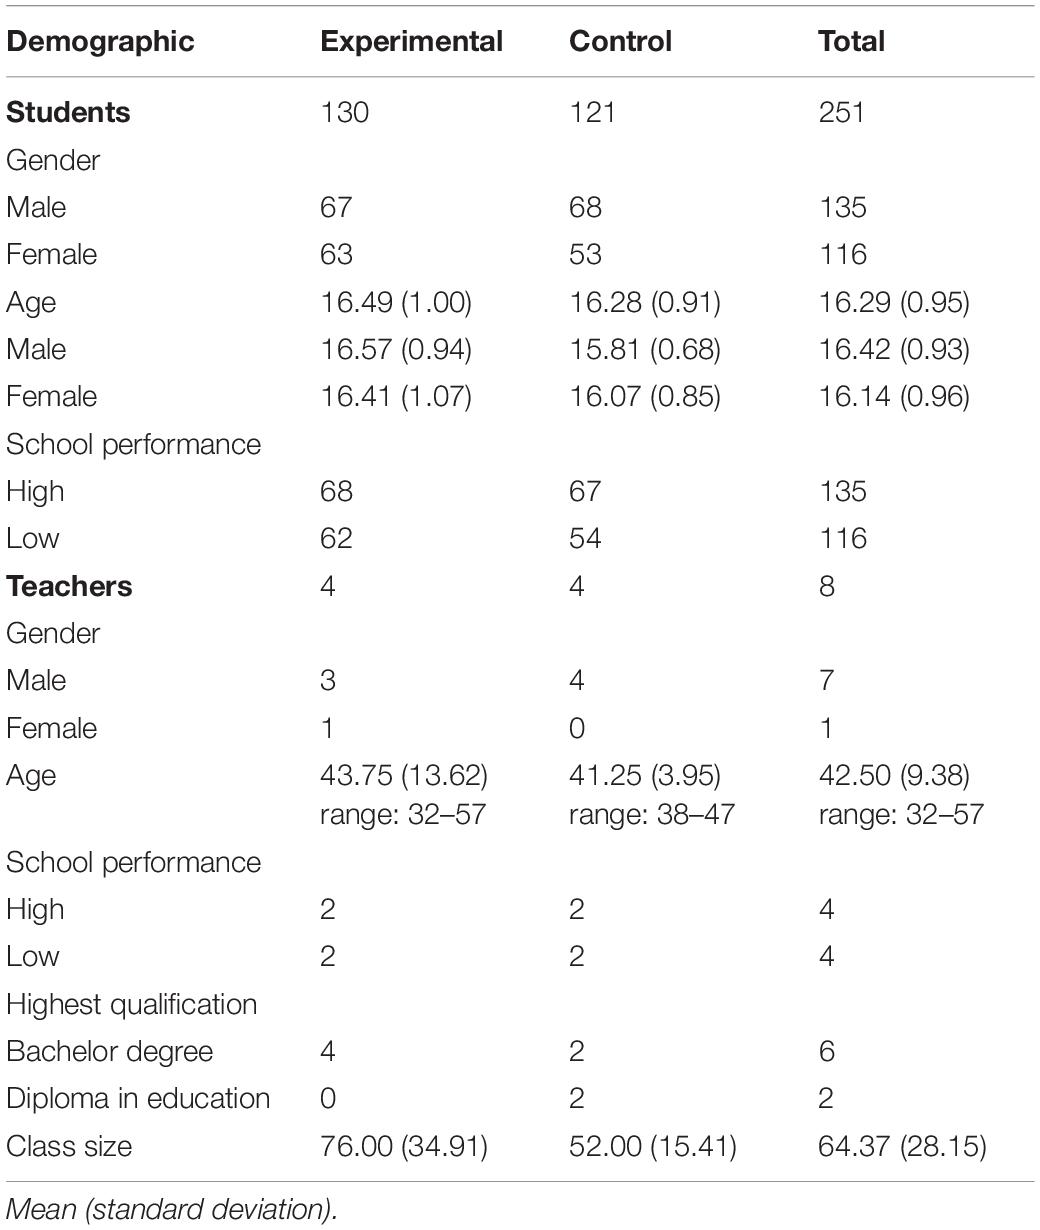
Table 1. Demographics of participating students and teachers split by group.
Although 326 respondents initially answered the pre-test questionnaire, 61 students did not participate in the post-test questionnaire due to absenteeism and were eliminated from the study. Another 14 respondents had more than 10% missing data in either the pre-test or post-test questionnaire and were therefore removed; leaving a final sample of 251 student respondents from eight classrooms and with eight mathematics teachers. We used intact classes, this also formed two student groups: experimental group (N = 130) and control group (N = 121). To ensure equity, after the post-test data collection the mathematics teachers in the control group received the same 1-day training after the study. Figure 2 summarizes the overall research design. Before and after the professional development training, the teaching behavior of all teachers was video-recorded during a plenary feedback discussion. After each of the two video-recorded lessons, students completed a questionnaire on their perceptions of teacher feedback in the plenary feedback discussion. The time interval between the training and post-tests measures was approximately 1 month.
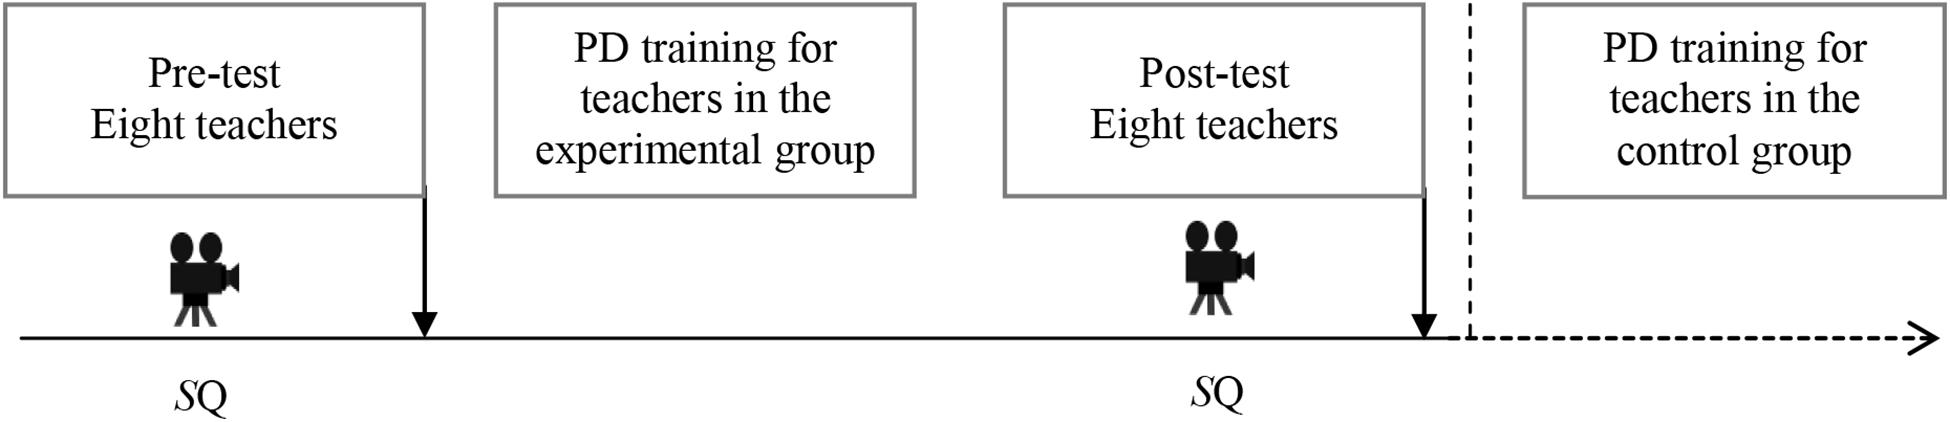
Figure 2. General research design showing data collection events. Video icon = Videotaped lesson of plenary feedback discussions; SQ = Student Questionnaire, PD = Professional Development.
Short-Term Professional Development Teacher Training
The professional development teacher training consisted of an extensive 1-day program that covered theory and practice with regard to how mathematics teachers can improve plenary feedback discussions of students’ written tests, by learning how and why student errors are a learning opportunity. Teachers were trained in using the analytic process-oriented cognitive strategy for effective learning from errors (Rach et al., 2012; Heemsoth and Heinze, 2016). During the training teachers brainstormed and practiced how to: (a) identify student errors, (b) understand student errors (why errors), (c) correct student errors, and (d) develop strategies to prevent similar errors. In particular, the intervention aimed at building a culture of error friendliness among teachers, a necessary precursor for students’ effective use of errors as a learning opportunity. The analytic-process oriented approach for dealing with errors was emphasized over a pragmatic outcome-oriented approach; thus teachers were encouraged to implement all levels of the error handling model (see Figure 1).
To consolidate teacher knowledge of sources of errors, the potential sources of student errors were discussed in relation to how they could be addressed pedagogically. Brousseau (2002) showed that errors in mathematics emanate from three obstacles: (a) ontological obstacles, due to a child’s developmental level, (b) didactical obstacles, arising from a teacher’s instructional strategies, and (c) epistemological obstacles, which are related to the nature of the concept or subject matter. Furthermore, three potential sources of student errors were discussed: semantic induction, simple execution failure and conceptual misunderstanding. Semantic induction refers to overgeneralization of the approach that has previously been successfully applied in a situation(s). Simple execution failure refers to slips or lapses in highly structured tasks (e.g., algorithmic) whereas conceptual misunderstanding refers to errors due to failure in planning or problem solving situations. It was emphasized that most instances of these three potential sources of student errors can be foreseen and clarified during instruction. Furthermore, the training emphasized that effective learning from errors also requires teachers to support students’ in building negative knowledge (knowledge about incorrect facts and procedures) to enable them to learn from their errors and prevent them from repeating the same error.
The short-term professional development teacher training combined the analytic process-oriented model for learning from errors (Rach et al., 2012; Heemsoth and Heinze, 2016) with the Hattie and Timperley (2007) feedback model to foster a deeper scientific understanding of how teachers can effectively relate to student errors as part of teacher feedback practices. The training used typical samples of written mathematics feedback on students’ tests collected from mathematics classes during the pre-test. Supplementary Appendix A summarizes the short-term professional development teacher training content, activities, and materials.
Instruments
Student Questionnaire
The questionnaire measured student perceptions of the error culture in secondary education (Spychiger et al., 2006) and their evaluation of the authenticity of mathematics teacher’s implementation of the plenary feedback discussion (Jacobs et al., 2003). We developed a new scale to measure students’ perceptions of the plenary feedback discussions, because existing feedback questionnaire scales either measure students’ perceptions to feedback aspects in general (e.g., King et al., 2009; Brown et al., 2016) or measure perceptions immediately after a specific performance (e.g., Strijbos et al., 2010). The authenticity scale was administered to measure whether the presence of the video cameras in the class did not disrupt normal practice, with high scores indicating that students considered the recorded lesson as similar to regular practice. The perceptions of the plenary feedback scale was administered to evaluate how useful to their learning the video-recorded plenary feedback discussion was. Thus, students provided their perspective as to whether the lessons were “business as usual” and “useful,” as well as their attitudes toward making errors. Students reported their mathematics performance in the test for which the teacher was conducting a plenary feedback discussion. All scales were adapted to the mathematics context and elicited responses using a balanced, symmetrical 6-point agreement rating scale ranging from completely disagree (1) to completely agree (6). Table 2 summarizes the adopted scales, number of items per scale, a sample item per scale, and the Cronbach’s α from the original studies (if available or applicable) and Cronbach’s α for the present study. It is noteworthy that some sub-scales were below the 0.70 threshold for Cronbach’s alpha, suggesting that findings should be interpreted cautiously.
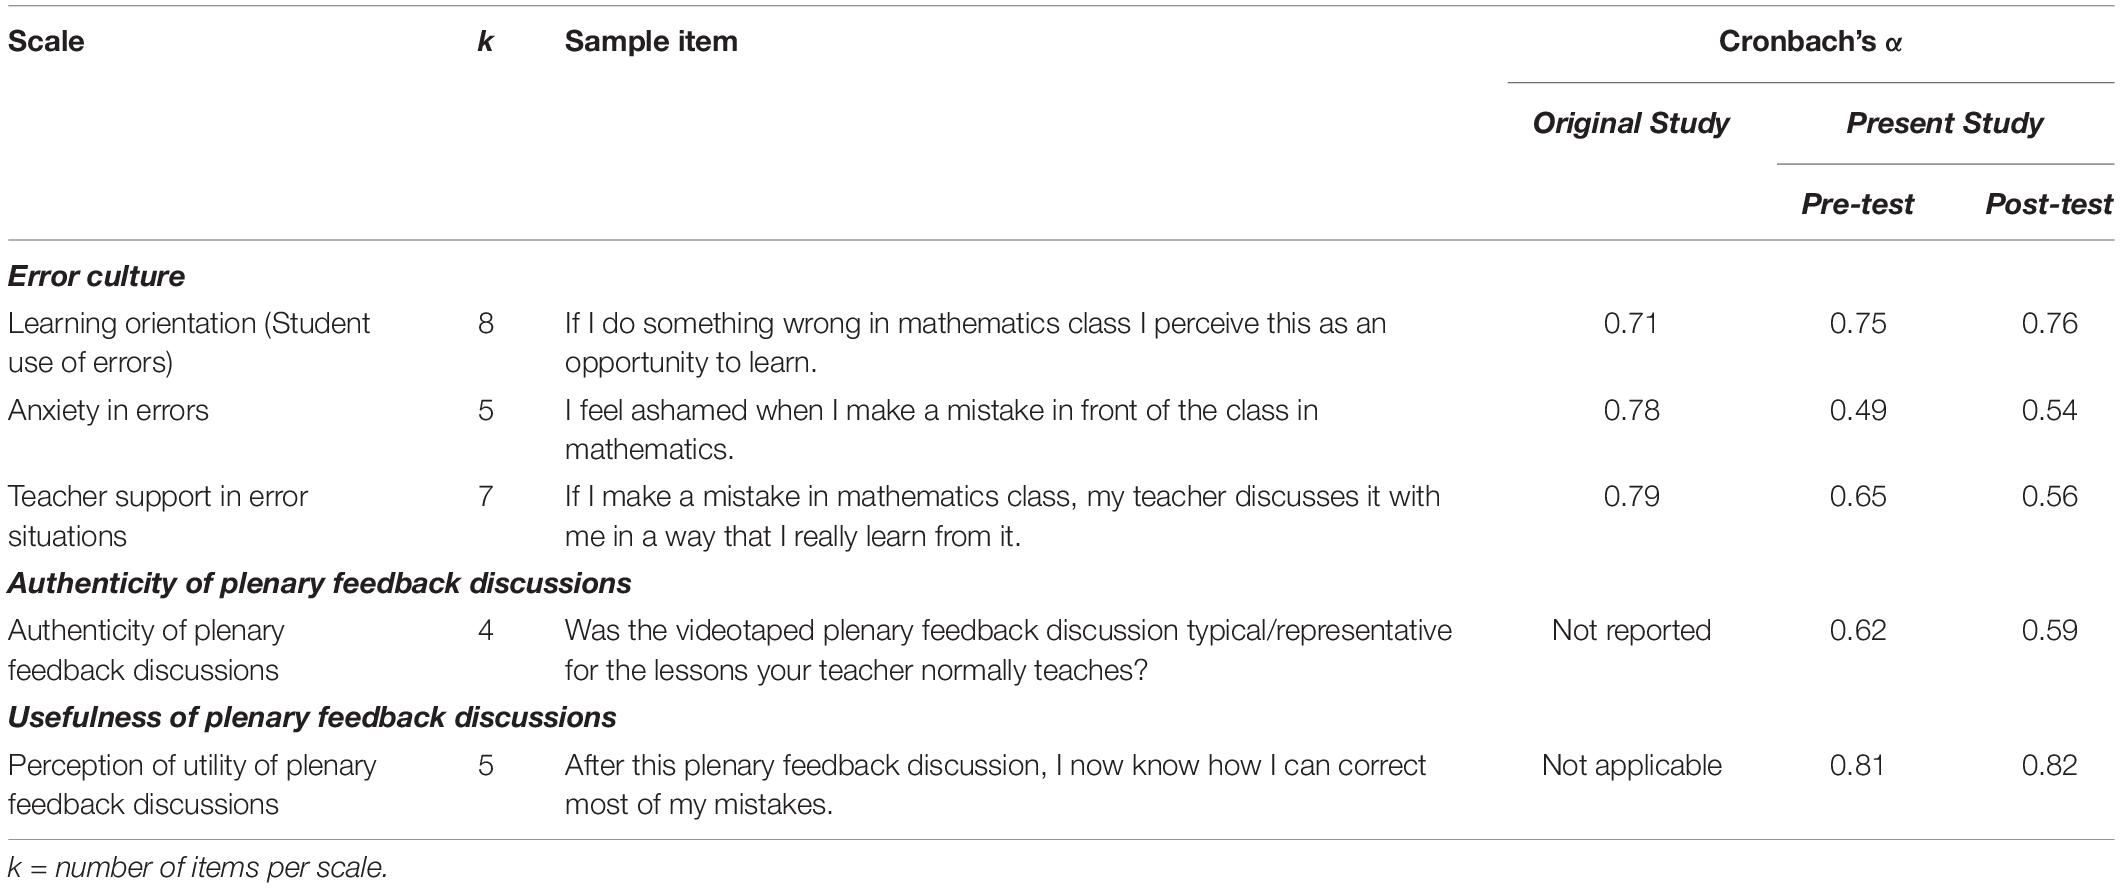
Table 2. Scales, sample items and Cronbach’s α.
Video Recording
Two video cameras (a teacher and student focused camera) were used to collect data on teachers’ behavior during plenary feedback discussions, using the guidelines recommended by TIMSS 1999 (Jacobs et al., 2003) and the IPN Study (Seidel et al., 2005).
Procedure
The study was conducted with research clearance from the University of Dar es Salaam. All teachers and their students were informed about the study rationale and actively signed an informed consent prior to their participation. The teachers in the control group were told that they would receive the short-term professional development training in error handling after the study was completed. There were no disturbances during the pre-test, professional development teacher training and post-test phases that might have affected the data collection.
Analyses
Data Inspection
Missing data from the 251 students were completely at random (MCAR) because Little’s MCAR test was not statistically significant, χ2 = 10190.60, df = 32739, p = 1.00 (Peugh and Enders, 2004). The missing values were imputed with the expectation maximization (EM) procedure which is considered to be an effective imputation method when data are completely missing at random (Musil et al., 2002).
Measurement Models
As four of the five scales were taken from previously validated instruments, measurement models were tested using confirmatory factor analysis. Because the Chi-square statistic is overly sensitive in large sample sizes above 250 (Byrne, 2010), multiple fit indicators were used in assessing the model fit. The comparative fit index (CFI) and the root mean square error of approximation (RMSEA) are not stable estimators with CFI rewarding simple models and RMSEA rewarding complex models (Fan and Sivo, 2007). In contrast, the gamma hat statistic and standardized root mean residual (SRMR) have been shown to be stable estimators (Fan and Sivo, 2007). As proposed by Byrne (2010) good model fit was based on the combination of the root mean squared error of approximation (RMSEA) and standardized root mean residual (SRMR) below 0.05 and comparative fit index (CFI) and gamma hat values above 0.95, whereas acceptable model fit was attained when RMSEA and SRMR were below 0.08 and CFI and gamma hat scores were above 0.90 (Hu and Bentler, 1999). All confirmatory factor analyses were performed with Maximum Likelihood (ML) estimation and conducted in Analysis of Moment Structures (AMOS) version 24.
Perceptions of Error Culture
The measurement model for the three inter-correlated scales measuring students’ perceptions of the error culture (i.e., ‘Learning orientation (Student use of errors)’, ‘Anxiety in error situations’, and ‘Teacher support in error situations’) had relatively poor fit from the pre-test data (i.e., SRMR = 0.054, CFI = 0.825, Gamma hat = 0.93 and RMSEA = 0.067 [0.057, 0.077]). Modification indices suggested removing eight items with poor factor loadings (<0.40) resulting in substantially improved the fit at the pre-test (i.e., SRMR = 0.047, CFI = 0.95, Gamma hat = 0.98 and RMSEA = 0.054 [0.034, 0.072]). The same model had also a good fit at the post-test (i.e., SRMR = 0.053, CFI = 0.93, Gamma hat = 0.96 and RMSEA = 0.067 [0.050, 0.085]). Second, the measurement model for students’ perceptions and authenticity of the plenary feedback discussions (Jacobs et al., 2003) had poor fit at the pre-test (i.e., SRMR = 0.076, CFI = 0.88, Gamma hat = 0.92 and RMSEA = 0.122 [0.101, 0.144]. Removing two items with low contribution improved fit at the pre-test (i.e., SRMR = 0.082, CFI = 0.90, Gamma hat = 0.92 and RMSEA = 0.149 [0.120, 0.180]). The same model at the post-test had acceptable fit (i.e., SRMR = 0.073, CFI = 0.93, Gamma hat = 0.94 and RMSEA = 0.128 [0.098, 0.154]). Finally, all analyses utilized the scales as specified in this section.
Authenticity of Plenary Feedback Discussions
Because video recording can disrupt normal teaching practices, it was essential to determine the authenticity of the video-recorded lessons – compared to unrecorded class sessions – as perceived by the students. The measurement model for the authenticity of the plenary feedback discussion had a good fit at the pre-test (i.e., SRMR = 0.024, CFI = 0.96, Gamma hat = 1.0, RMSEA = 0.034 [0.000, 0.135]) as well as the post-test (i.e., SRMR = 0.028, CFI = 0.98, Gamma hat = 1.0, RMSEA = 0.054 [0.000, 0.148]). Given that SRMR, CFI and Gamma hat had good fit at both measurement occasions, the model was considered to be stable. Since the model was simple (had four items), RMSEA is an unreliable estimator because it tends to penalize simple models.
Usefulness of Plenary Feedback Discussions
The purpose of the plenary feedback discussion was to enable students to identify their errors and why these occurred, and to be able to correct the errors as well as avoid similar errors in subsequent tasks. Therefore, it was essential to determine the usefulness of the plenary feedback discussion as perceived by the students. The measurement model for the usefulness of the plenary feedback discussion had a good fit at the pre-test (i.e., SRMR = 0.047, CFI = 0.94, Gamma hat = 0.95, RMSEA = 0.158 [0.112, 0.208]). However, eliminating one negatively phrased item with high modification indices further improved the model fit (i.e., SRMR = 0.037, CFI = 0.97, Gamma hat = 0.97, RMSEA = 0.175 [0.105, 0. 254]). The latter measurement model also had a good fit at the post-test (i.e., SRMR = 0.043, CFI = 0.96, Gamma hat = 0.96, RMSEA = 0.217 [0.147, 0.295]). Given that SRMR, CFI and Gamma hat had good fit at both measurement occasions, the model was considered to be stable. Since the model was simple, RMSEA is an unreliable estimator as it tends to penalize simple models.
Comparison Across Measurement Occasions, Time and Conditions
Measurement invariance is a prerequisite of comparison between groups and measurement occasions (Reise et al., 1993; Vandenberg and Lance, 2000; McArdle, 2007; Wu et al., 2007). Hence, invariance tests were conducted to establish evidence for scales’ comparability. The invariance of a model across the measurement occasions is evaluated by establishing whether fixing model parameters (e.g., factor regression weights, covariances, factor intercepts, or residuals) as equivalent results in a statistically significant difference in model fit (Vandenberg and Lance, 2000; Cheung and Rensvold, 2002). Conventionally, as each set of parameters is constrained to be equivalent, the difference in CFI should be ≤0.01 (Brown and Chai, 2012; Brown et al., 2017). Measurement invariance analyses were performed with Maximum Likelihood (ML) estimation in Mplus version 7.31. Considering the four interaction groups resulting from condition (experimental vs. control) and measurement occasion (pre-test vs. post-test) combinations, all measurement models were strongly invariant as indicated in Supplementary Appendix B, hence latent mean analyses were feasible.
Latent Mean Analyses (LMA) were used to determine the difference in scale means across measurement occasions and between research conditions, resulting in comparison of four groups with the pre-test means of the control group set as the reference group (i.e., set to 0). This approach provides a strong framework to account for response bias and takes into account random or non-random measurement errors (Sass, 2011; Marsh et al., 2017) as compared to conventional regression analyses. Although skewness and kurtosis for four of the five scales were well below 2 and 7, respectively, one scale was outside of these ranges. Hence, LMA was performed in Mplus version 7.31 using robust Maximum Likelihood (MLR) estimation to account for non-normality (Finney and DiStefano, 2013). In LMA the mean of a latent factor is computed and differences to other groups with a similar latent factor are estimated as z-score differences (Hussein, 2010). The Wald test of parameter constraints was used to assess whether the differences in latent means were statistically significant or not.
Video Recordings
An initial inductive analysis of 50% of the videotaped lessons was performed to extract common patterns in mathematics teachers’ strategies in handling student errors on a mathematics test. Four teacher videos from two schools were randomly sampled from the experimental and control group and analyzed – using the analytic process-oriented approach to learning from errors – by the lead author and a second coder (doctoral student). This resulted in 87.5% agreement, leading a Krippendorff’s alpha value of 0.72 (acceptable agreement). The remaining video data were analyzed by the lead author. Apart from identifying potential common patterns as to how mathematics teachers conducted the plenary feedback discussions, excerpts from the videotaped lessons at both pre-test and post-test were selected as exploratory case studies to illustrate how teachers handled student errors during the plenary feedback discussion.
Results
Student Perceptions of Authenticity and Usefulness of the Plenary Feedback Discussions
In general, at the pre-test students in the experimental group (M = 4.88, SD = 1.16) and control group (M = 5.01, SD = 1.05) were positive about the authenticity of the videotaped plenary feedback discussions indicating that they perceived the videotaped lessons to reflect the regular mathematics lessons. Likewise, students in the experimental group (M = 5.45, SD = 0.89) and control group (M = 5.60, SD = 0.58) perceived the pre-test plenary feedback discussion to be useful. Although students in both groups were positive about the authenticity of the videotaped lessons, the change trends were inverse with the experimental group increasing in their perception of authenticity at the post-test (M = 4.98, SD = 1.05) and the control group decreasing (M = 4.93, SD = 1.04). In contrast, students in the experimental group (M = 5.43, SD = 0.79) and the control group (M = 5.40, SD = 0.92) both declined in their perception of the usefulness of the plenary feedback discussion at the post-test. Table 3 summarizes the scales’ manifest and latent means.
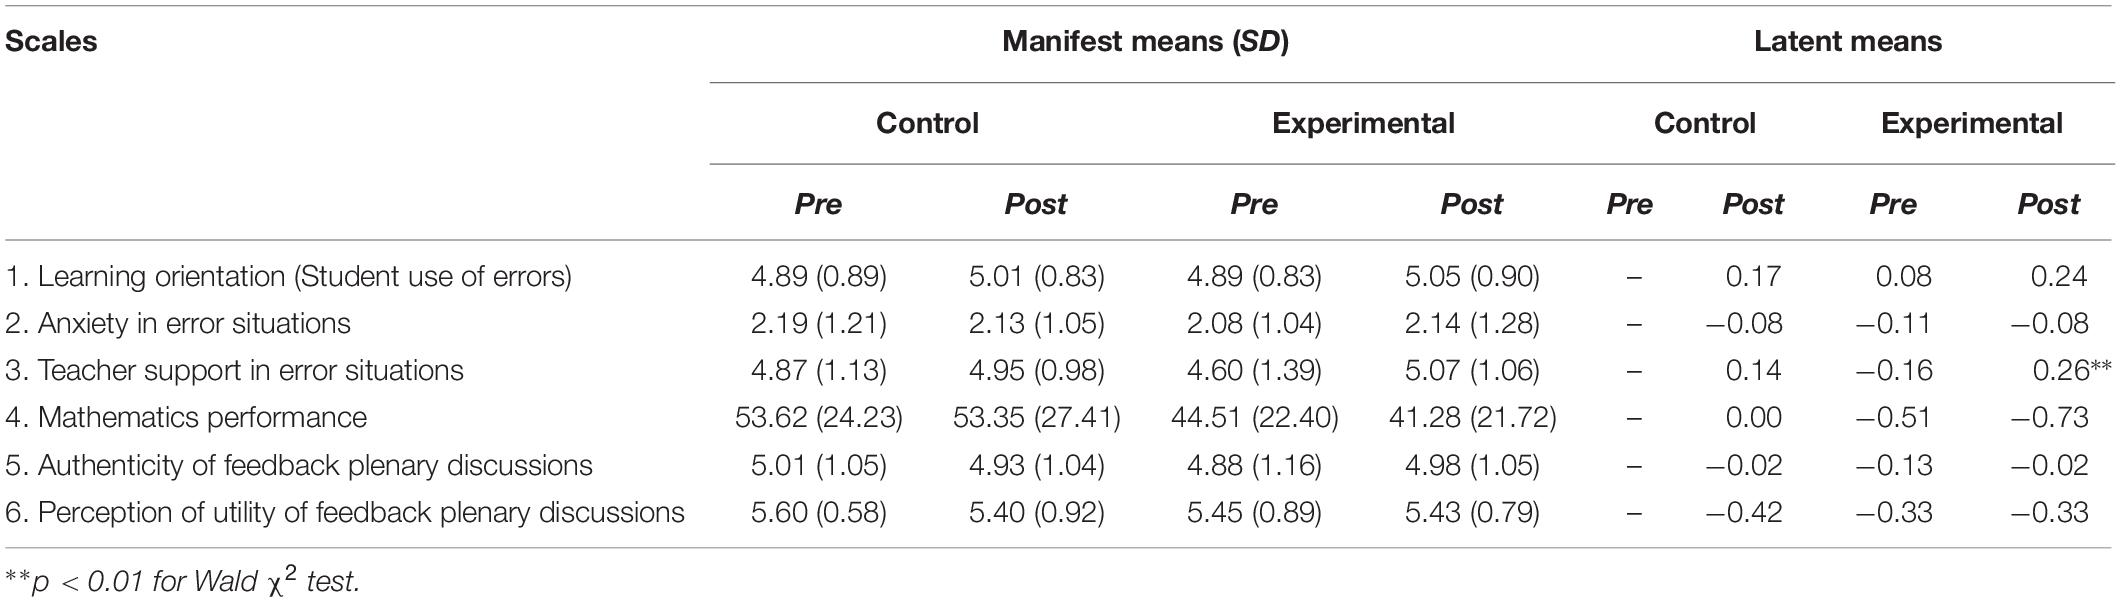
Table 3. Manifest and latent means for scales.
Student Perceptions of Errors and Teacher Support in Error Situations
The descriptive statistics in Table 3 show that with the exception of students’ ‘anxiety in error situations’, manifest means were close to or above ‘mostly agree’ (5.00) suggesting that the students had a positive learning orientation and perceived their mathematics teachers as supportive in error situations. Descriptively, the experimental group was somewhat more positive at the pre-test for learning orientation and less positive for anxiety and teacher support in error situations than the control group. By the end of the intervention, latent mean analyses indicated that the experimental group had slightly (but not statistically different) higher scores for learning orientation (student use of errors for learning) (M = 5.05, SD = 0.90) than the control group (M = 5.01, SD = 0.83). Likewise, student perception of teacher support in error situations was higher in the experimental group (M = 5.07, SD = 1.06) than the control group (M = 4.95, SD = 0.98). However, at the post-test, students in the experimental group reported higher anxiety in error situations than during the pre-test. Generally, latent mean analyses indicated that gains for the experimental group over the control group were only statistically significant in student perception of teacher support in error situations (d = 0.12). See Table 3 for a detailed representation of manifest and latent means across conditions and measurement occasions.
Furthermore, within-group comparisons were conducted for the latent means of student perception of teacher support in error situations. The change in student perceptions of teacher support in error situations within the experimental group was moderate (z = 0.356, Wald χ2(1, 130) = 10.86, p = 0.037), whereas the change within the control group was not statistically significant (z = 0.139, Wald χ2(1, 121) = 1.097, p = 0.295). Thus, students in the experimental group changed moderately and became more positive in their perception that their mathematics teacher handled errors in a friendly manner and used errors formatively.
Exploratory Case Studies of Teacher Error Handling Strategies
Analysis of the sixteen videotaped lessons showed that the mathematics teachers employed three main pedagogical approaches to feedback plenary discussions, namely, student-centered, teacher-centered, and shared marking scheme. In the student-centered approach the teacher invited and encouraged students to solve mathematical questions on the blackboard and provided students with scaffolding support only if most students failed to solve the question. This approach was observed in 8 out of 16 (50%) lessons; four lessons in the experimental group and four in the control group. In the teacher-centered approach the teacher solved questions on the blackboard with little student involvement. This approach was identified in 6 out of 16 (38%) lessons; four lessons in the experimental group and two in the control group. Finally, the shared marking scheme approach was observed in 2 out of 16 (12%) lessons; both from the same teacher. In this approach the teacher provided each student with a marking scheme for the purpose of self-correction. In the remainder of this section we present two exploratory case studies of the observed plenary feedback discussions to illustrate some differences in the application of error handling strategies at the pre-test and post-test. We selected these two cases to represent both research groups and because the lessons at the pre-test and post-test covered similar content, i.e., a mathematics task from the topic of functions and relations.
Case 1: Error Handling Practices of a Teacher in the Experimental Condition
Tables 4, 5 contain excerpts of the error handling strategies employed by Teacher 1, who was part of the experimental condition, at the pre-test and the post-test, respectively.
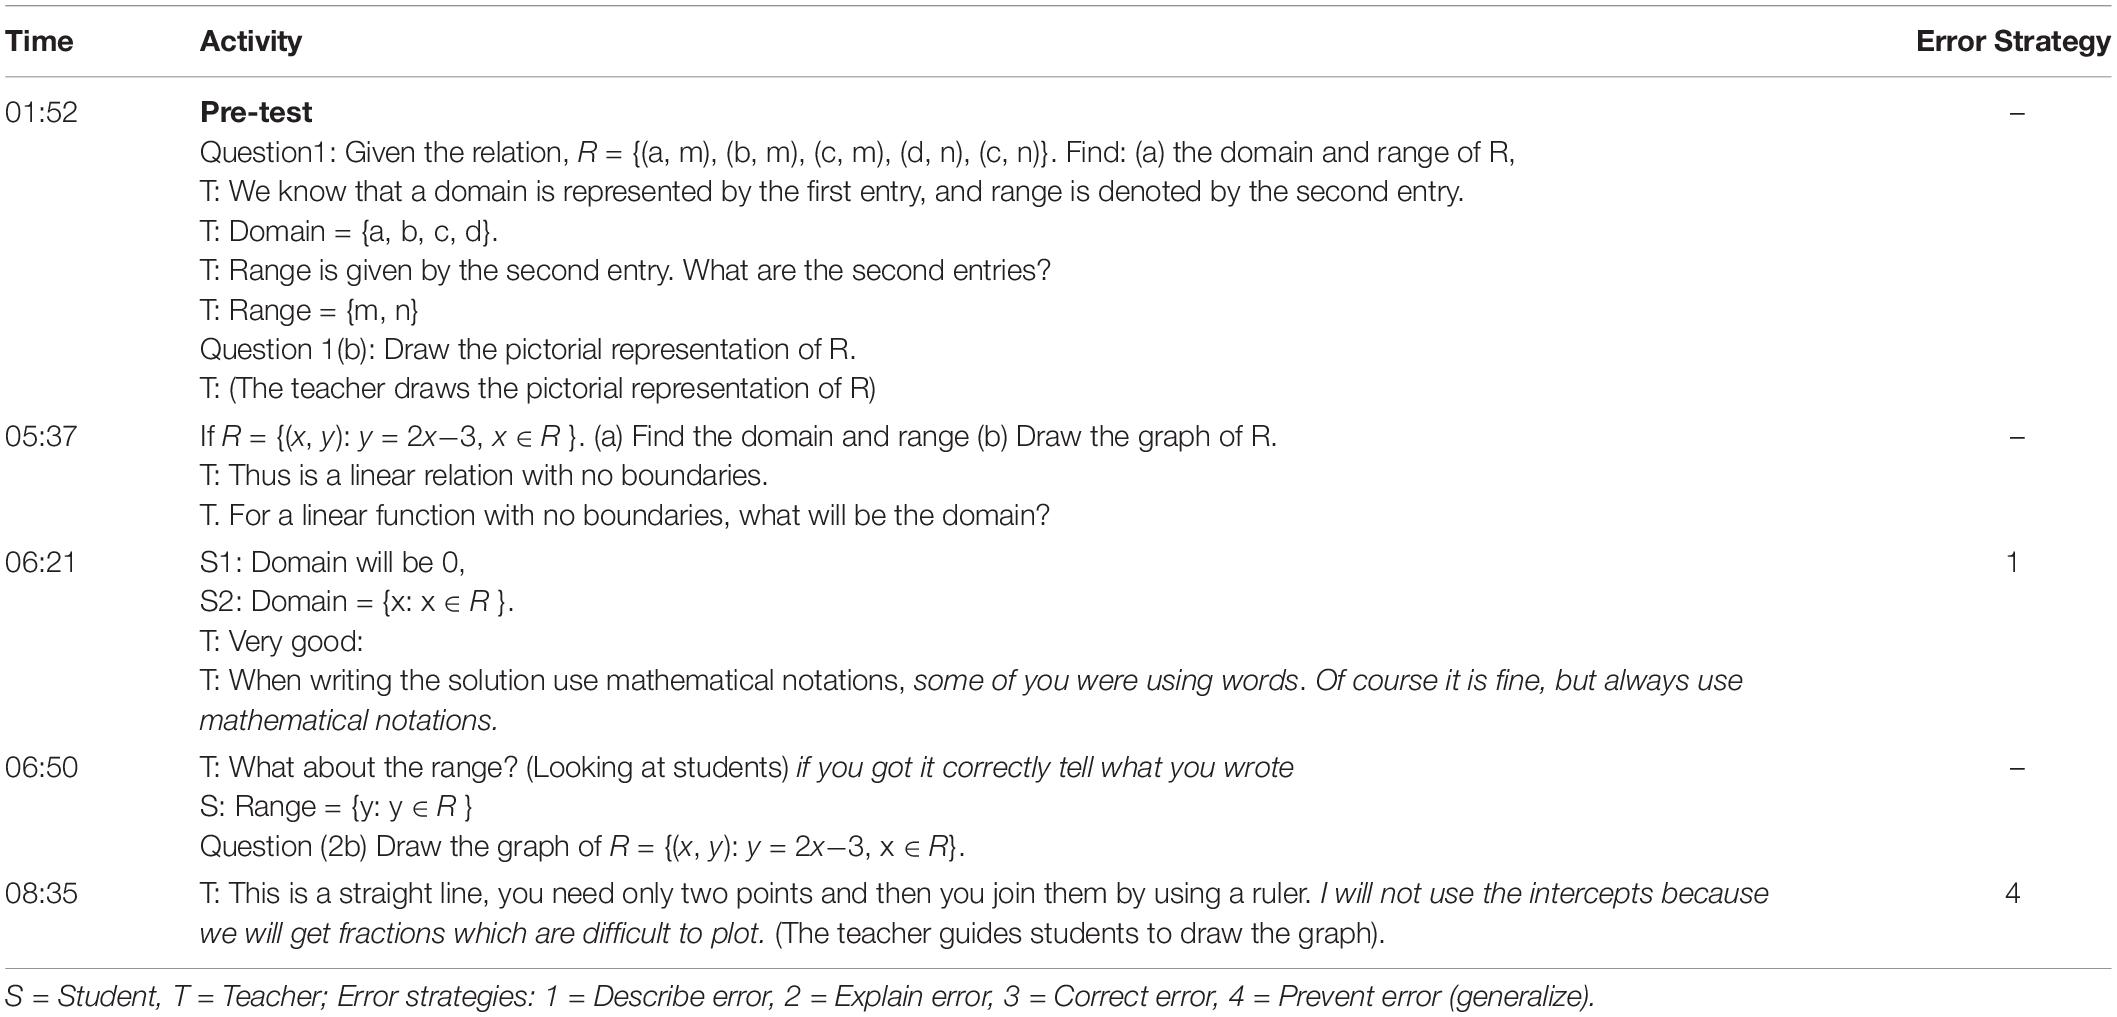
Table 4. Examples of error handling strategies by Teacher 1 in the experimental conditionat the pre-test.
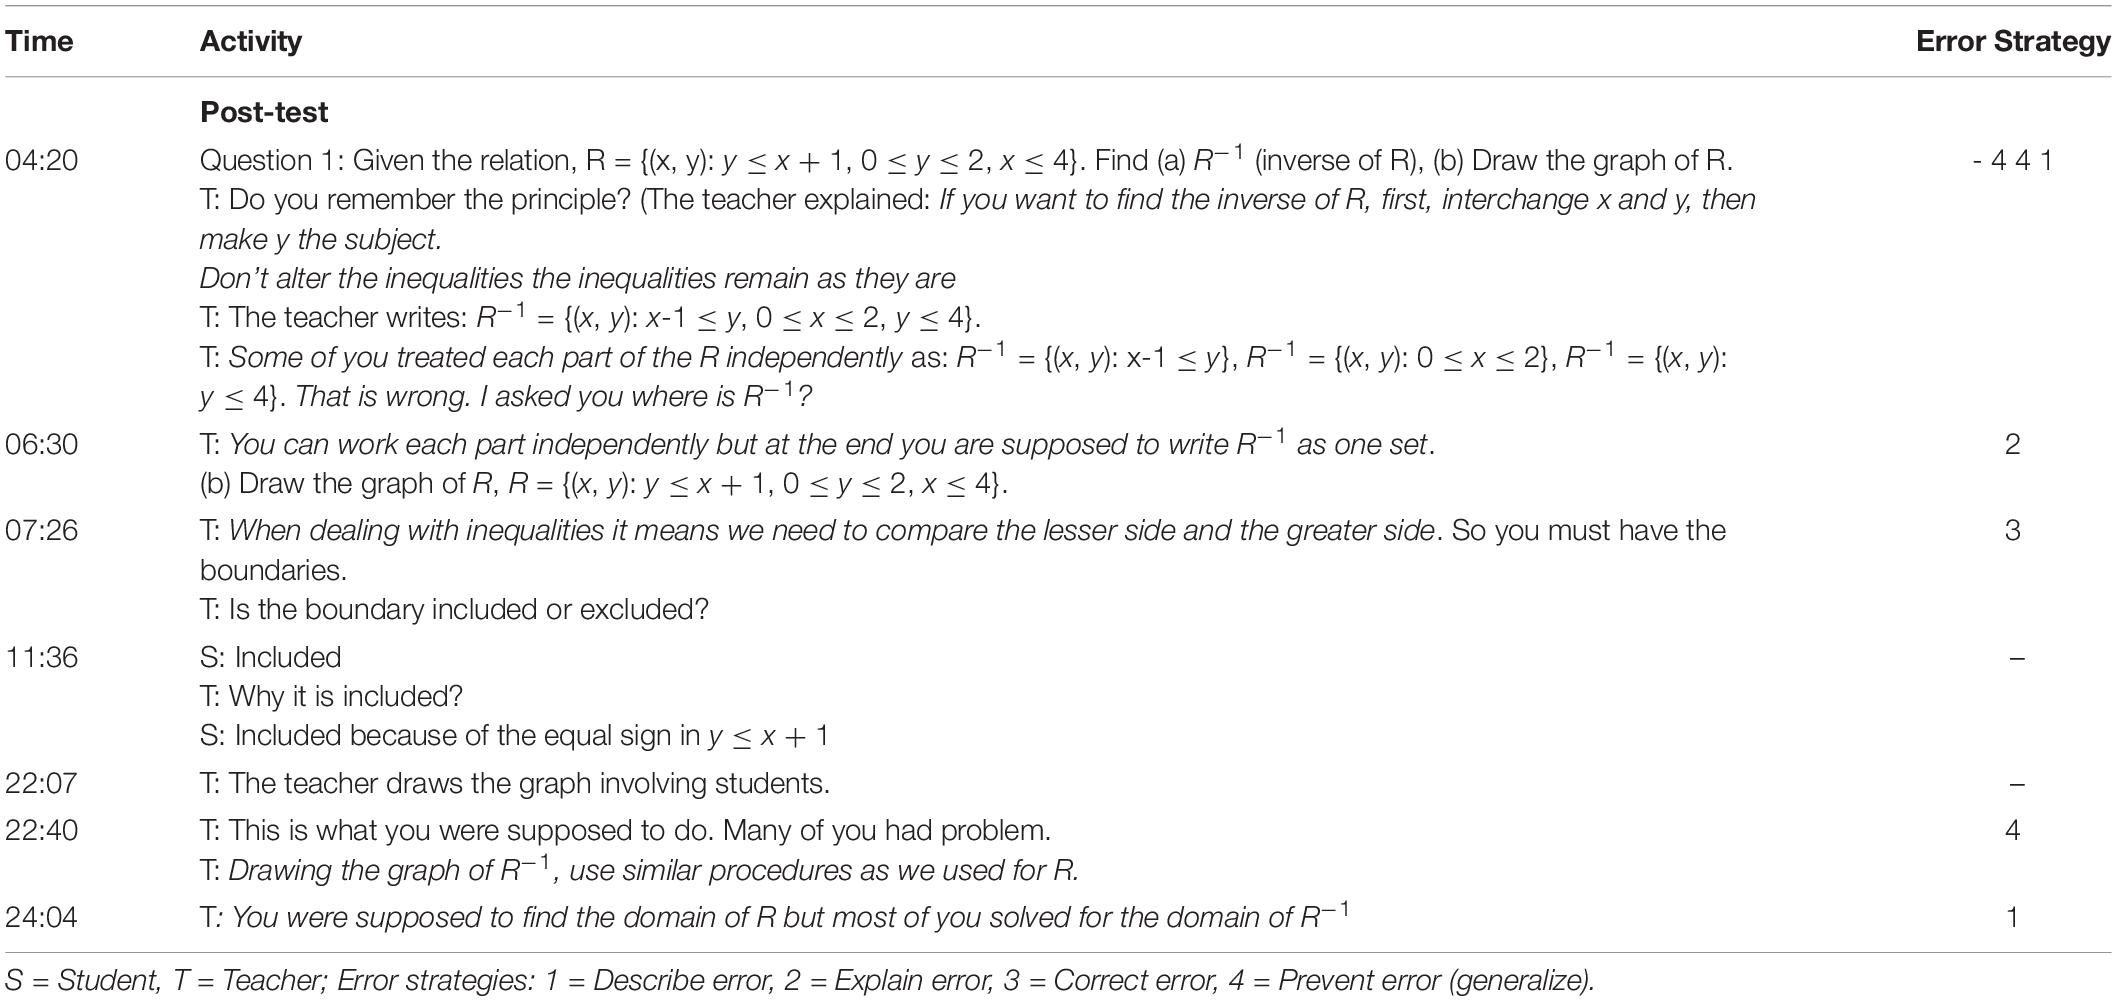
Table 5. Examples of error handling strategies by Teacher 1 in the experimental condition at the post-test.
With reference to Table 4, it can be noticed that to some extent Teacher 1 displayed some error handling strategies at the pre-test. For example, the teacher described the error made by the students (“some of you were using words instead of mathematical terms”) and highlighted a situation where the students were likely to make more errors (“I will not use intercepts because we will get fractions which are difficult to plot”). Nevertheless, the teacher failed to reflect on and use the error made by the first student (S1) (06.21 min in the excerpt) to improve the lesson, and instead accepted the answer from another student (S2). Table 5 illustrates some of the error handling strategies by the same teacher at the post-test.
During the post-test, the teacher practiced more error handling strategies than at the pre-test. First, Teacher 1 described a student error by citing specific errors made by students in the test (“some of you treated each part of the R independently, many of you solved for the domain of R–1 instead of domain of R”). Secondly, the teacher explained the student errors (“You can work each part independently but at the end you were supposed to write R–1 as one set”), and finally the teacher generalized the solution strategy to other test-questions (“to draw the graph of R–1, use similar procedures as we used for R”). Table 5 indicates that Teacher 1 appeared more error friendly at the post-test by explaining student errors and showing how to correct them than during the pre-test. Moreover, apart from implementing more error handling strategies at the post-test, the teacher concentrated not only on correcting student errors but also focused on error prevention strategies which is the highest step of error handling as part of the analytic, process oriented approach (see Figure 1). In particular, it can be noticed that the teacher collected and reflected on student errors while marking their tests as illustrated by the remark at the start of the transcript: “If you want to find the inverse of R, first, interchange x and y, then make y the subject. Don’t alter the inequalities the inequalities remain as they are”.
Case 2: Error Handling Strategies of a Teacher in the Control Condition
Tables 6, 7 contain excerpts of the error handling strategies employed by Teacher 7, who was part of the control condition, at the pre-test and the post-test, respectively.
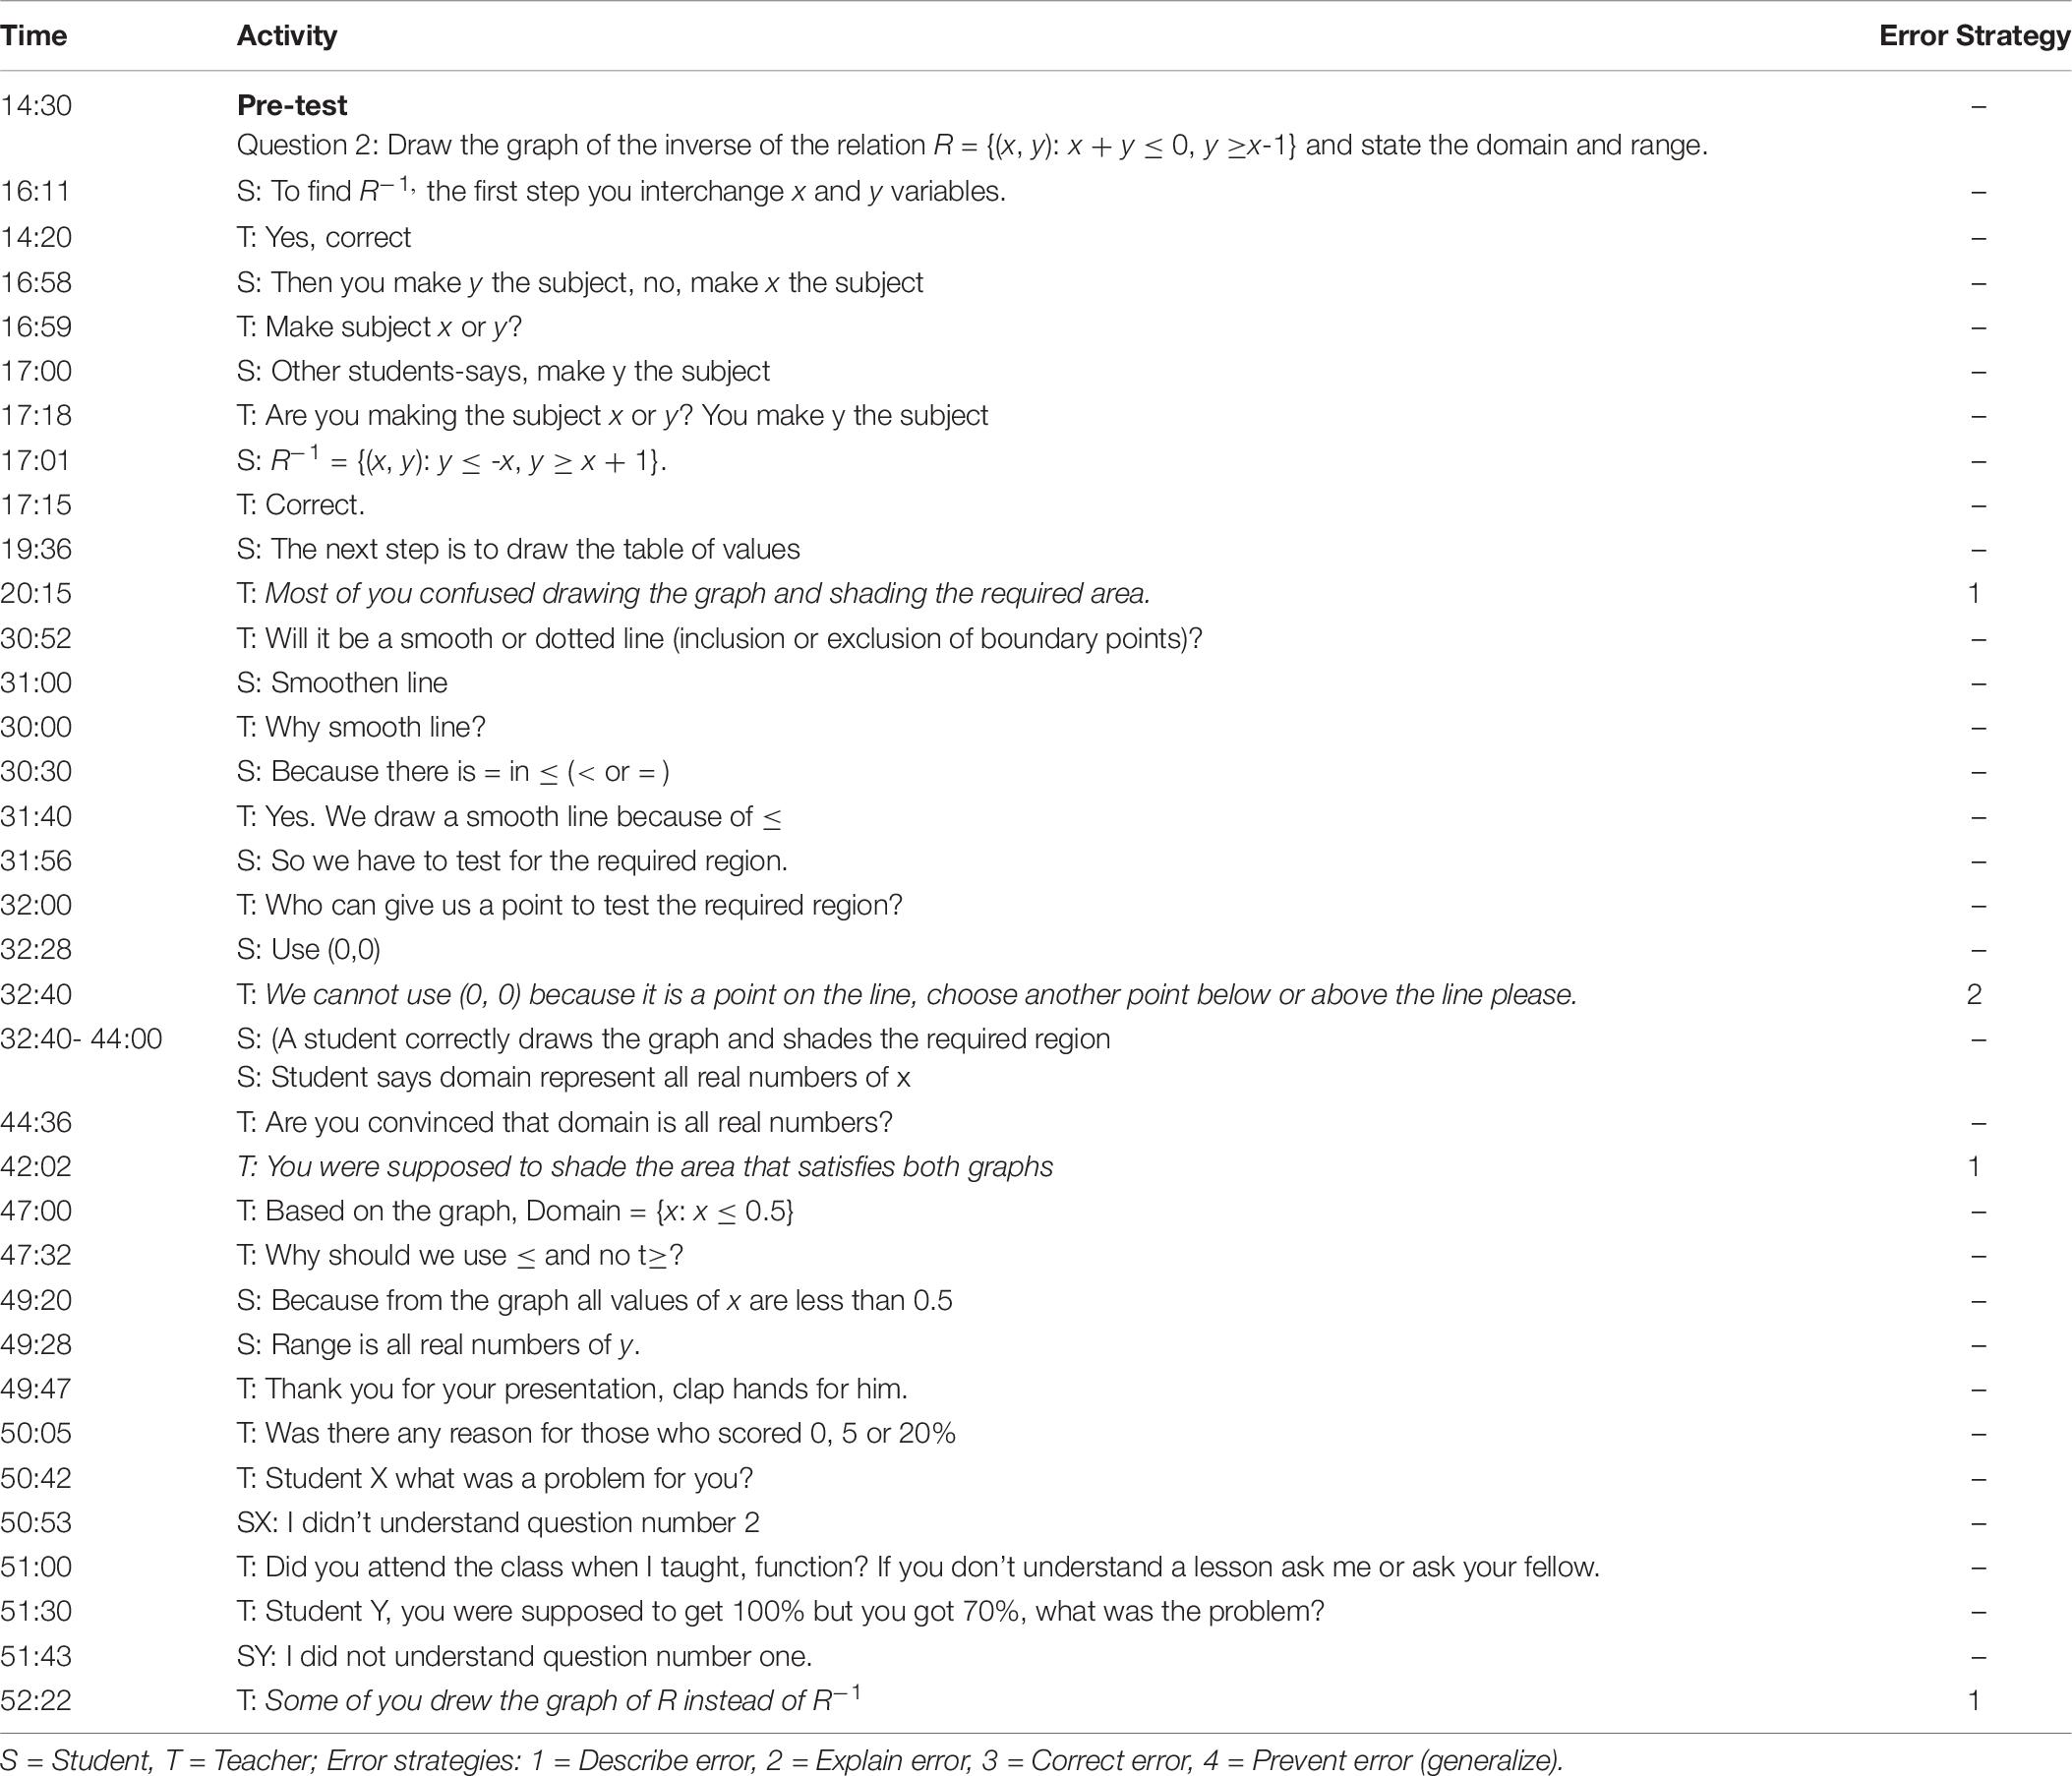
Table 6. Examples of error handling strategies by Teacher 7 in the control condition at the pre-test.
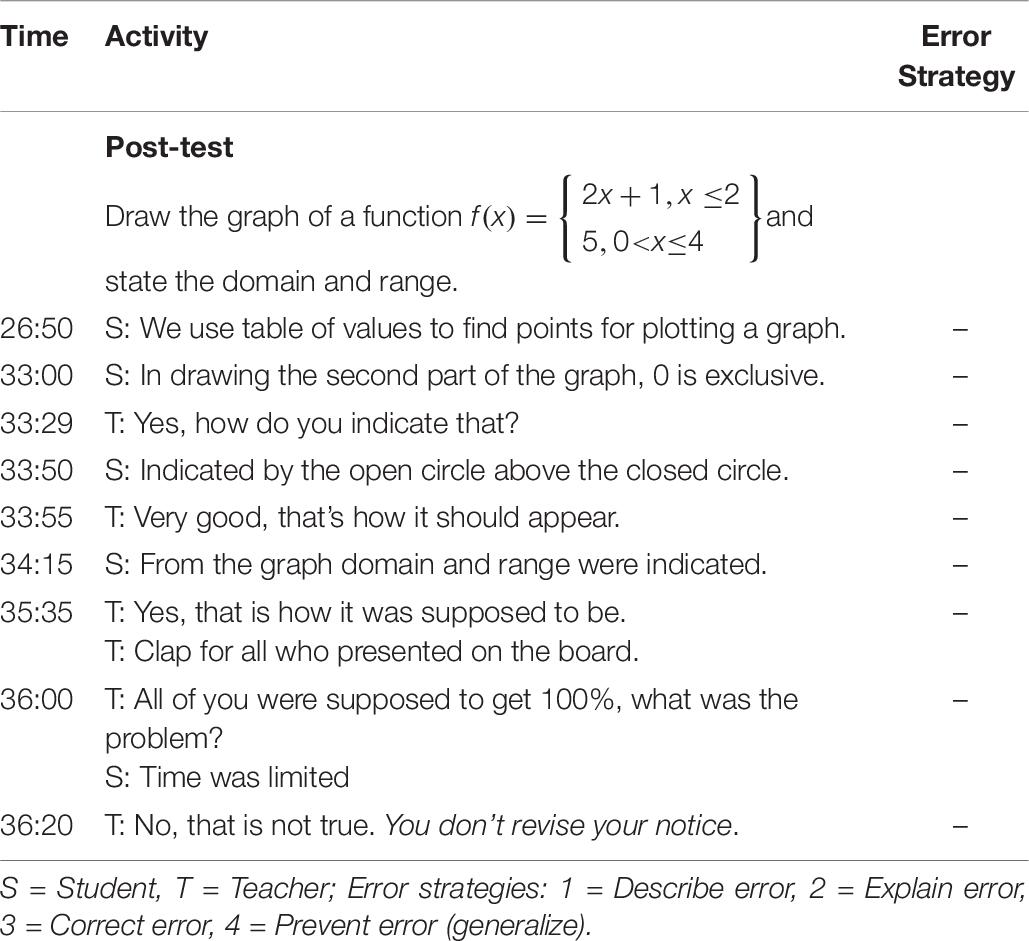
Table 7. Examples of error handling strategies by Teacher 7 in the control condition at the post-test.
In Table 6 it can be noticed that Teacher 7 employed some error handling strategies at the pre-test such as describing student errors (“some of you drew the graph of R instead of R–1”) and explaining why it is an error (“we cannot use the origin (0,0) to test our inequality because it is a point in the line”). However, these practices did not persist during the post-test. Table 7 illustrates some of the error handling strategies by Teacher 7 at the post-test.
At the post-test Teacher 7 seemed to use the pragmatic approach to error handling given that a student was reprimanded for poor treatment of errors (“you don’t revise your notes”). Generally, although Teacher 7 displayed awareness of some error handling practices at the pre-test, such as describing the student error before correcting them, those practices were absent at the post-test which suggests that this behavior was not systematic. Given that Teacher 7 attributed errors to students’ poor revising practices indicates that the teacher might have lacked the broader spectrum of potential sources of errors which go beyond student-related features. Generally, the mathematics teachers did not adequately engage in intensive use of the analytic approach to error handling to foster student use of their own errors. It is essential that students are empowered on how to use errors as a learning opportunity that could ultimately promote meaningful learning.
Discussion
The present study explored the impact of a short-term professional development teacher training on (a) students’ perceptions of their mathematics teacher’s support in error situations as part of instruction, (b) students’ perceptions of error situations while learning, and (c) mathematics teacher’s actual error handling practices.
Students’ Perceptions of Teacher’s Support in Error Situations
The first question investigated the effect of the short-term professional development teacher training on students’ perceptions of their mathematics teacher’s support in error situations. Based on the descriptive mean scores, students perceived their teacher’s support in error situations as positive, implying that students – regardless of whether their teacher received professional development training – had positive perceptions of their teacher’s support in error situations. Furthermore, latent mean analyses indicated from the pre-test to post-test for the experimental group a significant, but moderate positive change in perceptions of teacher support in error situations, whereas there was no other statistically significant difference observed. However, the relatively low observed effect of the short-term professional development teacher training on student perceptions of teacher support may be attributed to the nature and teacher orientation toward errors. Metcalfe (2017) clearly showed that people who are error-prevention focused are likely to be error intolerant and would like students to avoid errors for the sake of passing high-stakes examinations. In general, these results show that an intensive short-term professional development training for a specific situation had direct effects on teacher behavior during the plenary feedback discussions. This supports results from previous studies that it is feasible to improve practices of teacher support in students’ error situations (Heinze and Reiss, 2007); even with a short-term professional development teacher training – which is most likely due to the random assignment of teachers to research conditions (Heller et al., 2012). Whereas the Rach et al. (2013) study used an intensive long-term professional development intervention and found effects only on students’ affect and perception of affective teacher support, this study found a positive effect on student perceptions of their mathematics teacher’s behavior with a short-term professional development teacher training within a specific classroom context. Moreover, the findings also support Lizzio and Wilson (2008) who found that students are readily capable of identifying the qualities of assessment practices they do and do not value.
Students’ Perceptions of Use of Errors in Learning
The second question investigated the effect of the professional development teacher training on students’ perceptions of individual use of errors in their learning. The results showed that the secondary school students in our sample were inclined to use errors for learning. However, the change from pre-test to post-test latent means – with the control group pre-test means as a reference category – revealed no significant differences for students’ use of errors for learning. These results further support that students’ use of errors for learning is challenging for them (Heinze and Reiss, 2007; Rach et al., 2012), and they are in line with the evidence that student learning from their own errors is more challenging than learning from correct situations (Siegler and Chen, 2008). Although previous research showed that it is possible to promote student use of their own errors through a student-based intervention (Heemsoth and Heinze, 2016), it would be desirable to help teachers foster such strategies. More specifically, teachers should encourage and/or train students to use their own errors for learning rather than correcting student errors.
Students’ Anxiety in Error Situations
The second question further investigated the effect of the professional development teacher training on students’ anxiety in error situations. The results showed that the secondary school students in our sample overall reported low levels of anxiety in error situations. Furthermore, although Rach et al. (2013) successfully showed that it is possible to reduce student anxiety in error situations via an error handling professional development teacher training, our results – similar to the study by Heinze and Reiss (2007) – do not support this. A potential explanation might be the social impact or consequences of failing a test. Moreover, the result does not support a recent study by Tsujiyama and Yui (2018) who showed the potential advantage of students’ reflection on unsuccessful proof examples in actual learning. In particular, in a high-stakes examinations educational context such as that of Tanzania, failing a test exposes students to social impact such as reduced status due to social comparison with peers or negative emotions (e.g., shame) in response to accountability reports to parents and school authority. Students’ productive use of errors for learning calls for a detailed error management strategy that involves development of a mind-set on how to deal with errors (Frese and Keith, 2015). It was further noted that students’ had low mathematics performance in teacher made tests which among other reasons could be attributed to the fact that mathematics tests at the post-tests were in general more difficult than at the pre-test because material that is covered in a test is accumulative and becomes gradually more difficult over a certain time period.
Teacher Error Handling Strategies Before and After a Short-Term Professional Development Teacher Training
The third question aimed at identifying teacher practices of dealing with errors in a formative plenary feedback discussion of student performance on a mathematics test. Exploratory case studies of representative teachers were reported to illustrate these practices in the experimental and control group, and indicate to some extent the potential of a (short-term) professional development training to affect how teachers in the experimental group dealt with student errors. Most teachers were aware of student errors and corrected them without necessarily discussing why those errors occurred and how they could be prevented. Such practices support Monteiro et al. (2019) who noted that most of the teacher feedback focused on the task level (correcting the error) rather than discussing the underlying process level. In particular, the exploratory case studies to some extent support the descriptive results that teachers in the experimental group responded more positively to student errors than teachers in the control group. The observations from the exploratory case studies are in line with previous studies which showed that it is possible to improve assessment and feedback practices through a professional development teacher training (Rach et al., 2012; Van de Pol et al., 2014). At the same time, teachers in both the experimental and control group used student- and teacher-centered approaches to plenary feedback discussion, which aligns with previous studies from Tanzania that even though the curriculum emphasizes student-centered approaches, teaching remains teacher-centered (Kitta and Tilya, 2010; Tilya and Mafumiko, 2010).
Future research could investigate whether a longer professional development teacher training as well as continued practice and support during and after the training could substantially improve teacher error handling practices. Finally, unlike studies by Borasi (1994) and Heemsoth and Heinze (2016) which showed that promoting an error friendly environment leads to productive learning outcomes, our data did not yield such outcomes. This shows that effects of a short-term error handling professional development teacher training on students’ performance are not easy to achieve, in particular on the short-term. Also, this might be accounted for by the small teacher sample and non-uniformity of the teacher-made mathematics tests.
Limitations and Implications
Although we systematically drew our sample and applied a quasi-experimental design (i.e., professional development teacher training vs. no training), the results should be interpreted bearing in mind some limitations. First, the professional development teacher training was conducted among eight schools and only involved eight mathematics teachers. Second, since the eight schools and teachers were randomly assigned to the experimental and control group, the number of sampled students provides some evidence for generalizations beyond our sample. Third, the short duration of the professional development teacher training – which positively affected students’ perceptions of teacher support in error situations, shows some promise for developing a more rigorous intervention as part of an extensive and large-scale professional development program (Hill et al., 2013). The current short-term professional development teacher training could be improved by examining teacher beliefs about sources of student errors as well as by enabling teachers to teach the analytic error-based learning strategy. These results may be substantiated by future studies using a longer intervention and/or longitudinal data to examine other potential factors that might influence the quality of teacher feedback practices such as the feedback content, students’ dispositions toward mathematics, and the quality of mathematics instructions. Despite these limitations, the systematic random sampling of schools and rigorous data analyses techniques used (e.g., invariance testing and latent mean analysis), complemented by the exploratory case studies, provided substantial insights into the error handling practices of mathematics teachers and the potential of a short-term professional development teacher training to affect these practices.
Conclusion
In light of our findings we encourage teachers and students to use student errors formatively as learning opportunities and to improve the instructional process, that is, teachers should improve their teaching strategies while students are expected to improve their learning strategies. Moreover, teachers are encouraged to utilize the analytic process-oriented approach for learning from errors; in particular linking their (plenary) feedback discussions to typical examples of student errors that were observed when marking tests or examinations. Finally, teachers are encouraged to use student assessment results; in particular errors made in mathematics tests to scaffold students’ learning in areas where they need more help.
Data Availability Statement
While data analyzed for this study cannot be made publicly available due to ethics requirements (individual participants are potentially identifiable), data and syntax code for analysis are available on request.
Ethics Statement
The studies involving human participants were reviewed and approved by the University of Dar es Salaam. Written informed consent to participate in this study was provided by the participants’ legal guardian/next of kin.
Author Contributions
All authors contributed to the conception and design of the study, performed statistical analysis as well as reviewed the manuscript and manuscript revision, read, and approved the submitted version. FK administered the questionnaire, organized the database and wrote the first draft of the manuscript.
Funding
This study was funded 80% by the Ministry of Education of Tanzania, with a 20% supplemental by the German DAAD.
Conflict of Interest
The authors declare that the research was conducted in the absence of any commercial or financial relationships that could be construed as a potential conflict of interest.
Acknowledgments
We cordially thank Prof. Gavin Brown for his assistance with the measurement invariance and latent mean technique and feedback on the reporting of the analyses.
Supplementary Material
The Supplementary Material for this article can be found online at: https://www.frontiersin.org/articles/10.3389/feduc.2020.559122/full#supplementary-material
References
Basic Educational Statistics in Tanzania [BEST] (2014). Basic Education Statistics in Tanzania (National Data). Dodoma: Prime Minister’s Office Regional Administration and Local Government.
Bennett, R. E. (2011). Formative assessment: a critical review. Assess. Educ. Principl. Policy Pract. 18, 5–25. doi: 10.1080/0969594X.2010.513678
Black, P., and Wiliam, D. (2009). Developing the theory of formative assessment. Educ. Assess. Eval. Acc. 21, 5–31. doi: 10.1007/s11092-008-9068-5
Borasi, R. (1994). Capitalizing on errors as ‘springboards for inquiry’: a teaching experiment. J. Res. Math. Educ. 25, 166–208. doi: 10.2307/749507
Brousseau, G. (2002). Theory of Didactical Situations in Mathematics. New York, NY: Kluwer Academic Publishers.
Brown, G. T. L., and Chai, C. (2012). Assessing instructional leadership: a longitudinal study of new principals. J. Educ. Admin. 50, 753–772. doi: 10.1108/09578231211264676
Brown, G. T. L., Harris, L. R., O’Quin, C., and Lane, K. E. (2017). Using multi-group confirmatory factor analysis to evaluate cross-cultural research: identifying and understanding non-invariance. Intern. J. Res. Method Educ. 40, 66–90. doi: 10.1080/1743727X.2015.1070823
Brown, G. T. L., Peterson, E. R., and Yao, E. S. (2016). Student conceptions of feedback: impact on self-regulation, self-efficacy, and academic achievement. Br. J. Educ. Psychol. 86, 606–629. doi: 10.1111/bjep.12126
Byrne, B. M. (2010). Structural Equation Modeling with AMOS: Basic Concepts, Applications and Programming. London: Routledge.
Cheung, G. W., and Rensvold, R. B. (2002). Evaluating goodness-of-fit indexes for testing measurement invariance. Struct. Equ. Model. 9, 233–255. doi: 10.1207/S15328007SEM0902_5
Desimone, L. M. (2009). Improving impact studies of teachers’ professional development: Toward better conceptualizations and measures. Educ. Res. 38, 181–199. doi: 10.3102/0013189X08331140
Fan, X., and Sivo, S. A. (2007). Sensitivity of fit indices to model misspecification and model types. Multiv. Behav. Res. 42, 509–529. doi: 10.1080/00273170701382864
Finney, S. J., and DiStefano, C. (2013). “Nonnormal and categorical data in structural equation modeling,” in Structural Equation Modeling: a Second Course, 2nd Edn, eds G. R. Hancock and R. O. Mueller (Charlotte, NC: Information Age Publishing), 439–492.
Frese, M., and Keith, N. (2015). Action errors, error management, and learning in organizations. Annu. Rev. Psychol. 66, 661–687. doi: 10.1146/annurev-psych-010814-015205
Ginsburg, H. P. (2009). The challenge of formative assessment in mathematics education: children’s minds, teachers’ minds. Hum. Dev. 52, 109–128. doi: 10.1159/000202729
Hallman-Thrasher, A. (2017). Prospective elementary teachers’ responses to unanticipated incorrect solutions to problem-solving tasks. J. Math. Teach. Educ. 20, 519–555. doi: 10.1007/s10857-015-9330-y
Hattie, J., and Timperley, H. (2007). The power of feedback. Rev. Educ. Res. 77, 81–112. doi: 10.3102/003465430298487
Heemsoth, T., and Heinze, A. (2016). Secondary school students learning from reflections on the rationale behind self-made errors: a field experiment. J. Exper. Educ. 84, 98–118. doi: 10.1080/00220973.2014.963215
Heinze, A. (2005). “Mistake-handling activities in the mathematics classroom,” in Proceedings of the 29th Conference of the International Group for the Psychology of Mathematics Education, Vol. 3, eds H. L. Chick and J. L. Vincent (Melbourne: PME), 105–112.
Heinze, A., and Reiss, K. (2007). “Mistake-handling activities in the mathematics classroom: effects of an in-service teacher training on students’ performance in Geometry,” in Proceedings of the 31st Conference of the International Group for the Psychology of Mathematics Education, Vol. 3, eds J. H. Woo, H. C. Lew, K. S. Park, and Y. D. Seo (Seoul: PME), 9–16.
Heller, J. I., Daehler, K. R., Wong, N., Shinohara, M., and Miratrix, L. W. (2012). Differential effects of three professional development models on teacher knowledge and student achievement in elementary science. J. Res. Sci. Teach. 49, 333–362. doi: 10.1002/tea.21004
Hill, C. H., Beisiegel, M., and Jacob, R. (2013). Professional development research: consensus, crossroads, and challenges. Educ. Res. 42, 476–487. doi: 10.3102/0013189X13512674
Hu, L., and Bentler, P. M. (1999). Cutoff criteria for fit indexes in covariance structure analysis: conventional criteria versus new alternatives. Struct. Equ. Model. 6, 1–55. doi: 10.1080/10705519909540118
Hussein, M. H. (2010). The peer interaction in primary school questionnaire: testing for measurement equivalence and latent mean differences in bullying between gender in Egypt, Saudi Arabia and the USA. Soc. Psychol. Educ. 13, 57–76. doi: 10.1007/s11218-009-9098-y
Ingram, J., Pitt, A., and Baldry, F. (2015). Handling errors as they arise in whole-class interactions. Res. Math. Educ. 17, 183–197. doi: 10.1080/14794802.2015.1098562
Jacobs, J., Garnier, H., Gallimore, R., Hollingsworth, H., Givvin, K. B., Rust, K., et al. (2003). Third International Mathematics and Science Study 1999 Video Study Technical Report: Volume 1-Mathematics (Technical Report, NCES 2003-012). Washington, DC: National Center for Education Statistics.
Käfer, J., Kuger, S., Klieme, E., and Kunter, M. (2019). The significance of dealing with mistakes for student achievement and motivation: results of doubly latent multilevel analyses. Eur. J. Psychol. Educ. 34, 731–753. doi: 10.1007/s10212-018-0408-7
Kapur, M. (2014). Productive failure in learning math. Cogn. Sci. 38, 1008–1022. doi: 10.1111/cogs.12107
King, P. E., Schrodt, P., and Weisel, J. J. (2009). The instructional feedback orientation scale: conceptualizing and validating a new measure for assessing perceptions of instructional feedback. Commun. Educ. 58, 235–261. doi: 10.1080/03634520802515705
Kitta, S., and Tilya, F. (2010). The status of learner-centred learning and assessment in Tanzania in the context of the competence based curriculum. Pap. Educ. Dev. 29, 77–91.
Komba, W. L. M. (2007). Teacher professional development in Tanzania: perceptions and practices. Pap. Educ. Dev. 27, 1–27.
Kyaruzi, F., Strijbos, J. W., Ufer, S., and Brown, G. T. L. (2018). Teacher AfL perceptions and feedback practices in mathematics education among secondary schools in Tanzania. Stud. Educ. Eval. 59, 1–9. doi: 10.1016/j.stueduc.2018.01.004
Lizzio, A., and Wilson, K. (2008). Feedback on assessment: students’ perceptions of quality and effectiveness. Asses. Eval. High. Educ. 33, 263–275. doi: 10.1080/02602930701292548
Marsh, H. W., Guo, J., Parker, P. D., Nagengast, B., Asparouhov, T., Muthén, B., et al. (2017). What to do when scalar invariance fails: the extended alignment method for multi-group factor analysis comparison of latent means across many groups. Psychol. Methods 23, 524–545. doi: 10.1037/met0000113
McArdle, J. J. (2007). “Five steps in the structural factor analysis of longitudinal data,” in Factor Analysis at 100: Historical Developments and Future Directions, eds R. Cudeck and R. C. MacCallum (Mahwah, NJ: Lawrence Erlbaum Associates Publishers), 99–130.
Metcalfe, J. (2017). Learning from errors. Annu. Rev. Psychol. 68, 465–489. doi: 10.1146/annurev-psych-010416-044022
Monteiro, V., Mata, L., Santos, N., Sanches, C., and Gomes, M. (2019). Classroom talk: the ubiquity of feedback. Front. Educ. 4:140. doi: 10.3389/feduc.2019.00140
Musil, C. M., Warner, C. B., Yobas, P. K., and Jones, S. L. (2002). A comparison of imputation techniques for handling missing data. West. J. Nurs. Res. 24, 815–829. doi: 10.1177/019394502762477004
National Examinations Council of Tanzania [NECTA] (2014). Certificate of Secondary Education Examinations (CSEE) Schools Ranking. Available online at: http://www.necta.go.tz/brn (accessed August 13, 2015).
Oser, F., and Spychiger, M. (2005). Lernen ist Schmerzhaft. Zur Theorie des Negativen Wissens und zur Praxis der Fehlerkultur [Learning Ispainful. On the Theory of Negative Knowledge and the Practice of Error Culture]. Weinheim: Beltz.
Ottevanger, W., Akker, J., and Feiter, L. (2007). Developing Science, Mathematics, and ICT Education in Sub-Saharan Africa: Patterns and Promising Practices. Working paper no. 101. Washington: The World Bank.
Peugh, L. J., and Enders, C. K. (2004). Missing data in educational research: a review of reporting practices and suggestions for improvement. Rev. Educ. Res. 74, 525–556. doi: 10.3102/00346543074004525
Qorro, M. (2013). Language of instruction in Tanzania: why are research findings not heeded? Intern. Rev. Educ. 59, 29–45. doi: 10.1007/s11159-013-9329-5
Rach, S., Ufer, S., and Heinze, A. (2012). Learning from Errors: Effects of a teacher training on students’ attitudes toward and their individual use of errors. In T. Tso (Ed.): Proceedings of the 36th Conference of the International Group for the Psychology of Mathematics Education, Vol. 3, 329–336. Taipei, Taiwan: PME.
Reise, S. P., Widaman, K. F., and Pugh, R. H. (1993). Confirmatory factor analysis and item response theory: two approaches for exploring measurement invariance. Psychol. Bull. 114, 552–566. doi: 10.1037/0033-2909.114.3.552
Santagata, R. (2004). Are you joking or are you sleeping? Cultural beliefs and practices in Italian and U.S. teachers’ mistake-handling strategies. Linguist. Educ. 15, 141–164. doi: 10.1016/j.linged.2004.12.002
Sass, D. A. (2011). Testing measurement invariance and comparing latent factor means within a confirmatory factor analysis framework. J. Psychoeduc. Assess. 29, 347–363. doi: 10.1177/0734282911406661
Seidel, T., Prenzel, M., Dalehefte, M. I., Meyer, H. C., Lehrke, M., and Duit, R. (2005). “The IPN video study: an overview,” in How to Run a Video Study, eds T. Seidel, M. Prenzel, and M. Korbag (Waxmann: Münster), 7–19.
Sfard, A. (2007). When the rules of discourse change, but nobody tells you: making sense of mathematics learning from a commognitive standpoint. J. Learn. Sci. 16, 565–613. doi: 10.1080/10508400701525253
Siegler, R. S., and Chen, Z. (2008). Differentiation and integration: guiding principles for analyzing cognitive change. Dev. Sci. 11, 433–448. doi: 10.1111/j.1467-7687.2008.00689.x
Spychiger, M., Küster, R., and Oser, F. (2006). Dimensionen von fehlerkultur in der schule und deren messung: der schülerfragebogen zur fehlerkultur im unterricht für mittel und oberstufe [Dimensionsoferrorculture in educationanditsmeasurement: the studentquestionnaire on errorculture in secondaryeducation]. Schweizerische Zeitschrift Bildungswissenschaften 28, 87–110.
Strijbos, J. W., Narciss, S., and Dünnebier, K. (2010). Peer feedback content and sender’s competence level in academic writing revision tasks: are they critical for feedback perceptions and efficiency? Learn. Instruct. 20, 291–303. doi: 10.1016/j.learninstruc.2009.08.008
Takker, S., and Subramaniam, K. (2019). Knowledge demands in teaching decimal numbers. J. Math. Teach. Educ. 22, 257–280. doi: 10.1007/s10857-017-9393-z
Thompson, A. G. (1992). “Teachers’ beliefs and conceptions: a synthesis of the research,” in Handbook of Research on Mathematics Teaching and Learning, ed. D. A. Grouws (New York, NY: MacMillan), 127–146.
Tilya, F., and Mafumiko, F. (2010). The compatibility between teaching methods and competence-based curriculum in Tanzania. Pap. Educ. Dev. 29, 37–54.
Tsujiyama, Y., and Yui, K. (2018). “Using examples of unsuccessful arguments to facilitate students’ reflection on their processes of proving,” in Advances in Mathematics Education Research on Proof and Proving, eds J. Stylianides and G. Harel (Cham: Springer), 269–281. doi: 10.1007/978-3-319-70996-3_19
Van de Pol, J., Volman, M., Oort, F., and Beishuizen, J. (2014). Teacher scaffolding in small-group work: an intervention study. J. Learn. Sci. 23, 600–650. doi: 10.1080/10508406.2013.805300
Vandenberg, R. J., and Lance, C. E. (2000). A review and synthesis of the measurement invariance literature: suggestions, practices, and recommendations for organizational research. Organ. Res. Methods 3, 4–70. doi: 10.1177/109442810031002
Veldhuis, M., and Van den Heuvel-Panhuizen, M. (2014). “Exploring the feasibility and effectiveness of assessment techniques to improve student learning in primary mathematics education,” in Proceedings of the 38th Conference of the International Group for the Psychology of Mathematics Education and the 36th Conference of the North American Chapter of the Psychology of Mathematics Education, Vol. 5, eds C. Nicol, S. Oesterle, P. Liljedahl, and D. Allan (Vancouver: PME), 329–336.
Wagner, R. F. (1981). Remediating common math errors. Acad. Ther. 16, 449–453. doi: 10.1177/105345128101600409
Keywords: learning from errors, perceptions of errors, professional development training, secondary mathematics education, quasi-experimental
Citation: Kyaruzi F, Strijbos J-W and Ufer S (2020) Impact of a Short-Term Professional Development Teacher Training on Students’ Perceptions and Use of Errors in Mathematics Learning. Front. Educ. 5:559122. doi: 10.3389/feduc.2020.559122
Received: 05 May 2020; Accepted: 25 August 2020;
Published: 24 September 2020.
Edited by:
Chris Ann Harrison, King’s College London, United KingdomReviewed by:
Peter Nyström, University of Gothenburg, SwedenJade Caines Lee, University of New Hampshire, United States
Copyright © 2020 Kyaruzi, Strijbos and Ufer. This is an open-access article distributed under the terms of the Creative Commons Attribution License (CC BY). The use, distribution or reproduction in other forums is permitted, provided the original author(s) and the copyright owner(s) are credited and that the original publication in this journal is cited, in accordance with accepted academic practice. No use, distribution or reproduction is permitted which does not comply with these terms.
*Correspondence: Florence Kyaruzi, c2FreWFydXppQGdtYWlsLmNvbQ==; ZmxvcmVuY2Uua3lhcnV6aUBkdWNlLmFjLnR6