 Yaiza Viñuela
 Ana María de Caso Fuertes*
- Faculty of Education, Department of Psychology, Sociology and Philosophy, University of León, León, Spain
Introduction: The emphasis on skills-based learning has caused curricular change in education systems across the European Union, particularly in terms of the increased use of active teaching methodologies at all stages of education. These sorts of methodology are proven to have a positive impact on students’ motivation to learn and involve teaching strategies that represent a significant departure from traditional approaches. In this way, teachers in Pre-school Education can employ play-based strategies, which not only foster students’ acquisition of new skills but also their motivation. The objective of this study is to assess the impact of using active methodologies on the intrinsic motivation of students in the second cycle of Pre-school Education (3–6 years old) toward the process of teaching and learning.
Methods: To this end, a quantitative investigation was undertaken involving a non-probabilistic, convenience sample of 77 students in publicly funded Pre-schools. The selected students were asked to complete an ad hoc questionnaire to measure their motivation with respect to the methodology implemented in their classroom. Data were analyzed using the statistical program SPSS v.26 statistical significance was reached for all motivation variables (p < 0.05).
Results: A particularly important result was the finding that motivation among our pre-school cohort varied strongly in relation to sex with girls demonstrating greater motivation than boys.
Discussion: Also of interest are the findings that older pupils showed higher levels of motivation and students in the rural center were more motivated than those who study in the urban center. In conclusion, the implementation of active methodologies in Pre-school Education appears to foster students’ motivation to learn.
1. Introduction
In recent years, educational systems across the European Union have undergone huge curricular change with the aim of firstly, guaranteeing high-quality education for all and secondly, offering opportunities for life-long learning (United Nations Educational. Scientific and Cultural Organization, 2016). In Spain, this change has been reflected in the legal framework through the establishment of a new Organic Law whereby the Organic Law for Education is modified (the so-called LOMLOE; Ministry of the President, Constitutional Affairs, and Democratic Memory [MPR], 2020). This law gives particular importance to the use of active methodologies at all educational levels, including that of Pre-school Education due to the way in which such methodologies enable the acquisition of basic skills through play-based learning as set out in the Legal Order, ECI/3960/2007 of 19th December, which defines the curriculum and regulates the organization of Pre-school Education (Ministry of the President, Constitutional Affairs, and Democratic Memory, 2007). This particular piece of legislation was designed to accommodate the recommendations of the European Union (European Commission, 2020) and the International Bureau of Education (Marope et al., 2018), concerning the embedding of skills-based learning to optimize processes of teaching and learning.
The legislative changes outlined above have become of even greater importance in the field of education due to the effects of the COVID-19 pandemic, specifically, highlighting the need to implement innovative methodologies in order to deliver on-line learning successfully (García-Peñalvo et al., 2021). The impact of the pandemic has highlighted the need to use active methodologies to offer students a high-quality education (Souza and Bezerra, 2021) something that is further supported by work such as the study completed by Izagirre-Olaizola and Morandeira-Arca (2020), which concluded that employing active methodologies during the COVID-19 was of significant benefit to students’ acquisition of new skills. In the same context, active methodologies have been proven to increase students’ learning motivation in the Pre-school Education phase (Jamilah et al., 2021).
2. Theoretical background
The curricular changes affected with respect to skills-based learning are designed to enable students to acquire the learning (knowledge, skills, values, and attitudes) fundamental to their future development as citizens in society (Mutale and Malambo, 2019). The skills that students learn during the pre-school phase of their education form the basis of this process, that is, they are integral to students’ personal and social development (Ministry of the President, Constitutional Affairs, and Democratic Memory, 2022). Thus, with skills-based learning at the heart of all phases of education, it must be considered as the ongoing basis for the teaching and learning process (Delors, 1996).
Curricular change has had repercussions at methodological level, lending the role of teachers a particular importance in the ongoing process of adapting educational systems (Longobardi et al., 2016). In this respect, the implementation of active methodologies is becoming increasingly relevant because these are precisely the methodologies that foster skills-based learning and thus, must be considered good teaching practice (Arruabarrena et al., 2019). The methodologies in question are best defined as constructivist educational practice based on interaction, and as such are personalized learning experiences that involve students in the process of learning, so improving that process (Erbil, 2020; Bastos et al., 2021; Nguyen et al., 2021). Furthermore, active methodologies favor an active role for students enabling them to become sufficiently competent to take charge of their own learning resulting in deeper, more meaningful and long-lasting learning and as skills set can then be applied in other contexts (March 2006; Murillo, 2007).
Studies show that the type of methodology employed by teachers is a contextual variable, which plays a part in early school leaving (ESL) and as a result academic attainment (González-Pienda, 2003; de Dios and Rico, 2021). Reducing rates of ESL is one of the European Union’s priorities, the aim being to bring rates to 10% across the union’s member states by 2020 (European Commission, 2013). Regarding the latest available data, the median level of ESL across Europe is 10.6% (European Commission, 2020), while in Spain, this figure is 17.9% (Instituto Nacional de Estadística, 2022). It has also been found that the use of active methodologies in Pre-school Education by promoting more meaningful learning has a positive impact on academic achievement among students (Halili and Razak, 2018; Muntamer et al., 2020).
The use of active methodologies not only has repercussions for academic achievement; indeed, it has also been shown that such approaches are beneficial to student motivation in primary education, compulsory secondary education, and in university education (Gómez et al., 2021). Some of those active methodologies are Project-Based Learning (PBL) and Cooperative Learning (CL). PBL is a technique that allows students to be more creative and think critically (Talib et al., 2018) so that they become more active by presenting learning content in a real-world way and participating in projects that can attract their minds. CL is defined as a methodology where students work in small groups in which individuals have independence in the completion of whatever task they are working on and where the teacher acts as a guide throughout the teaching and learning process (Shinde and Shinde, 2022).
Increased motivation due to the use of active methodologies in pre-school education has additionally been shown to promote student involvement in learning activities (Bizarro et al., 2018). Thus, motivation or lack of it among students is hugely relevant as it represents a personal variable with huge influence over both ESL and academic achievement with good motivation being essential to educational success (Figure 1; Llanga et al., 2019; European Commission, 2020).
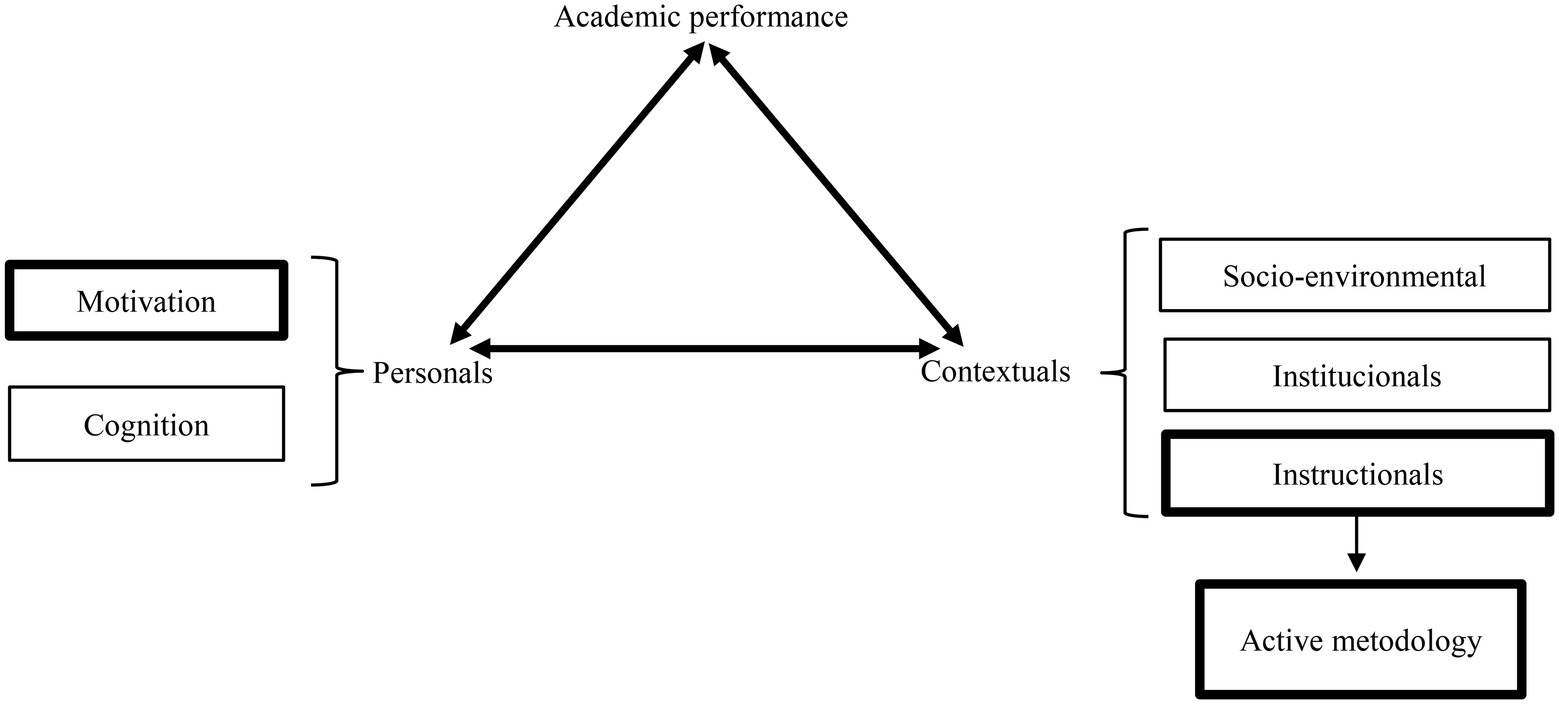
Figure 1. Relationship between academic performance, learning motivation, and teaching methodology.
Motivation is a psychological construct about which there is little unanimity as to its conceptualization; rather, its description varies depending on the academic discipline within which it is being studied. However, there are certain common characteristics among the various available definitions of motivation. Thus, it is possible to give a generalized description of motivation as an internal, non-observable process composed of a set of internal strengths or personal traits that a given individual will exhibit under a particular stimulus. This leads to the idea of motivation as a dynamic process that drives the activation, direction, and persistence of certain behaviors (Perret, 2016; Armas, 2019). In the framework of self-determination theory (SDT), motivation can be categorized into two types (Ryan and Deci, 2020): intrinsic or extrinsic. The former is characterized as deriving from the individual themselves such that committing to completing a given task is their own decision and motivated purely due to personal interest and pleasure in completing the said task (Prieto, 2020; Swiatczak, 2021). The latter, in contrast, is where an individual commits to completing a given task in order to subsequently obtain some reward or feedback, that is, their activity is instrumental to a separable consequence (di Domenico and Ryan, 2017).
Likewise, motivation is often considered as being determined by a set of components, and as with the definition of motivation itself, there is little consensus as to what these components might be. According to Clark and Saxberg (2018), motivation is composed of three components (Table 1). The first component is “beliefs and expectations” that is the set of perceptions an individual holds, derived from their own sense of self, concerning their ability to complete a given task adequately. This component is considered a good predictor of academic success (Dweck, 1986; De Caso Fuertes and García, 2006; Steinmayr et al., 2019). The second component is “task value,” which addresses the individual’s orientation to either intrinsic or extrinsic goals (Hasan et al., 2020; Zainuddin et al., 2021). Finally, the third component is “attributions” which concern the perceptions an individual has about the causes of their success or failure in a given task and which are mediated by the individual’s emotional state (Wolters and Pintrich, 2001).
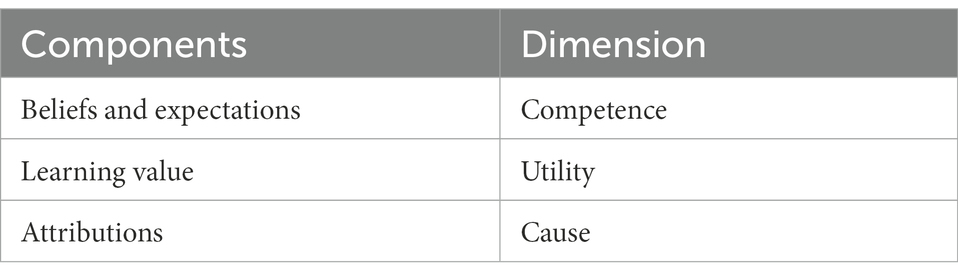
Table 1. Motivation components.
Thus, taking into consideration all the elements cited above, learning motivation is best described as the impulse to persevere in a given behavior in terms of both direction and intensity, to achieve academic success (Colquitt et al., 2000; Talida, 2021). The need to study motivation in the context of learning has been an ongoing topic of interest for many years and this trend continues (Navas and de Caso Fuertes, 2017). This is due to the complex interaction of cognitive and emotional factors at play as well as the significant impact student motivation can have on learning success (Pintrich and de Groot, 1990; Pintrich, 2000).
In summary, the educational system, in Spain as elsewhere in the EU, has undergone significant curricular change and this needs to be addressed through appropriate measures. One such measure is the increased use of active methodologies in classrooms, since teaching based on this approach enables the skills-based learning around which the curricular changes have been based (Organization for Economic Co-operation and Development [OECD], 2019). This type of constructivist methodology fosters motivation and this, in turn, increases students’ chances of academic success. In this way, it is necessary to understand more about the long-term impact of active methodologies in pre-school education and their positive influence on motivation inasmuch as these methodologies promote student’s holistic development (Villamizar, 2021).
In light of the previous discussion, the specific question tackled in this research is whether the use of active methodologies does indeed promote motivation even in pre-school education. From this research question, the general objective of this study is to assess the impact of active methodologies with respect to students’ intrinsic motivation in the teaching and learning process within a cohort of students in the second cycle of pre-school education (3–6 years old). The importance of this objective lies in improving understanding of how fostering motivation in the early years of education could promote students’ interest in learning tasks and thus have positive repercussions in subsequent stages of education perhaps even reducing levels of ESL (European Commission, 2015; Jamilah et al., 2021). Furthermore, reinforcing intrinsic rather than extrinsic motivation implies that students will persevere more in their learning tasks even when their outcomes are not always ideal (Msane et al., 2020). In order to achieve our general objective, we have defined the following specific objectives: (a) to design an instrument specifically to evaluate students’ learning motivation in the second cycle of pre-school education; (b) to assess whether there are differences in motivation among students with respect to sex; (c) to assess whether there are differences in motivation among students with respect to age; (d) to assess whether there are differences in motivation among students with respect to the class in which they are taught (class ID); and (e) to assess whether there are differences in motivation among students with respect to the type of school they attend (rural or urban).
3. Materials and methods
3.1. Design
This is a transversal study considering the correlations between two principal variables: on the one hand that of motivation, taking into account all its components; and on the other hand, active methodologies. The instrument used in this investigation produced quantifiable data, thus this is a quantitative study; it is also experimental as it involves the direct manipulation of experimental conditions once the type of classroom methodology was selected. Furthermore, this is a comparative study as it considers differences between three groups: a control group and two experimental groups under two different experimental conditions. The control group experienced a combined methodology comprising traditional methods and PBL. The first of the two experimental groups experienced PBL, while the second experienced a combination of PBL and CL.
It should be noted that, for the purposes of this investigation, traditional methods are defined as those where the teacher follows a rigid lesson plan and students are required to complete well-defined tasks based around this, generally using worksheets. PBL methods include approaches where students work collaboratively on topics linked to real-life contexts and give students an active role in the teaching and learning process (Shin, 2018). Specifically, the teacher proposes a discussion theme, according to the time of the year, and let students to decide what they want to work about that issue; this was the start of the PBL method. CL starts when the teacher divides the class in groups of four students according to their characteristics in order they can help each other to complete the tasks.
3.2. Participants
The corpus was selected by non-probabilistic convenience sampling according to the schools and classes the researcher had access to. The initial corpus comprised 79 students in the second cycle of pre-school education from two publicly funded schools located in the province of León (Spain). Due to the fact that two students in the corpus had Special Educational Needs, they were removed from the sample as their circumstances represented a set of additional variables that would need to be controlled for. This left a corpus of 77 students all in the second cycle of pre-school education. Of the 77 participants in the sample, 9% were in the 1st year of pre-school; 31% in the 2nd year; and 60% in the 3rd year. The cohort had a median age of 57 months and an age range of 3 to 7 years old. 53% of the sample were girls and 47% were boys.
The first center included in the study (center 1) was a publicly funded rural school collective (Colegio Rural Agrupado: C.R.A) which can be defined, according to Ponce et al. (2000), as: “organizations based on the grouping together of various units to comprise a school and which can extend across various locations.” (pp. 316). The C.R.A. used for this study has three sections used for teaching and learning: section A which had 25 students of which 15 were girls and 10 were boys; section B which had 7 students of which 3 were girls and 4 were boys; and section C which had 10 students of which 6 were girls and 4 were boys.
The second center (center 2) included in this work was a Center for Pre-school and Primary Education (Centro de Educación Infantil y Primaria: C.E.I.P.) situated in the provincial capital. Thus, in contrast to the first school, this is an urban center. The total number of participants from this center was 37 of which 17 were girls and 20 were boys (see Table 2).
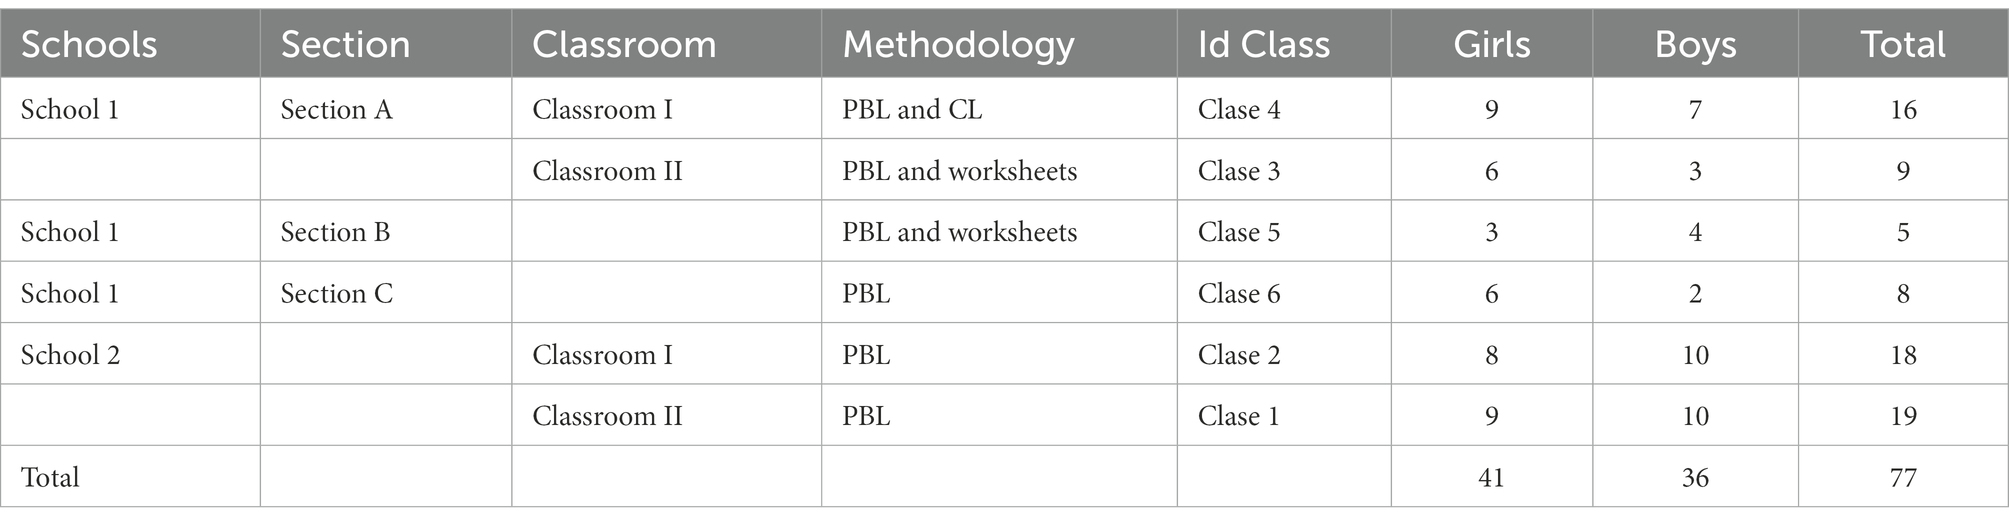
Table 2. Distribution of participants according to their sex and school.
3.3. Instrument
The Pre-school Learning Motivation Scale (Escala de Motivación hacia el Aprendizaje Infantil: EMAPI; Blanco, 2014) was used as the basis for the ad hoc questionnaire used in the present study. This instrument was judged to be a suitable theoretical foundation for our own as it was designed especially for use with preschoolers and in addition has been assessed for validity in terms of correlation analysis and construction. Furthermore, the internal consistency of this instrument has been assessed giving a reliability of 0.87 (Cronbach’s Alpha).
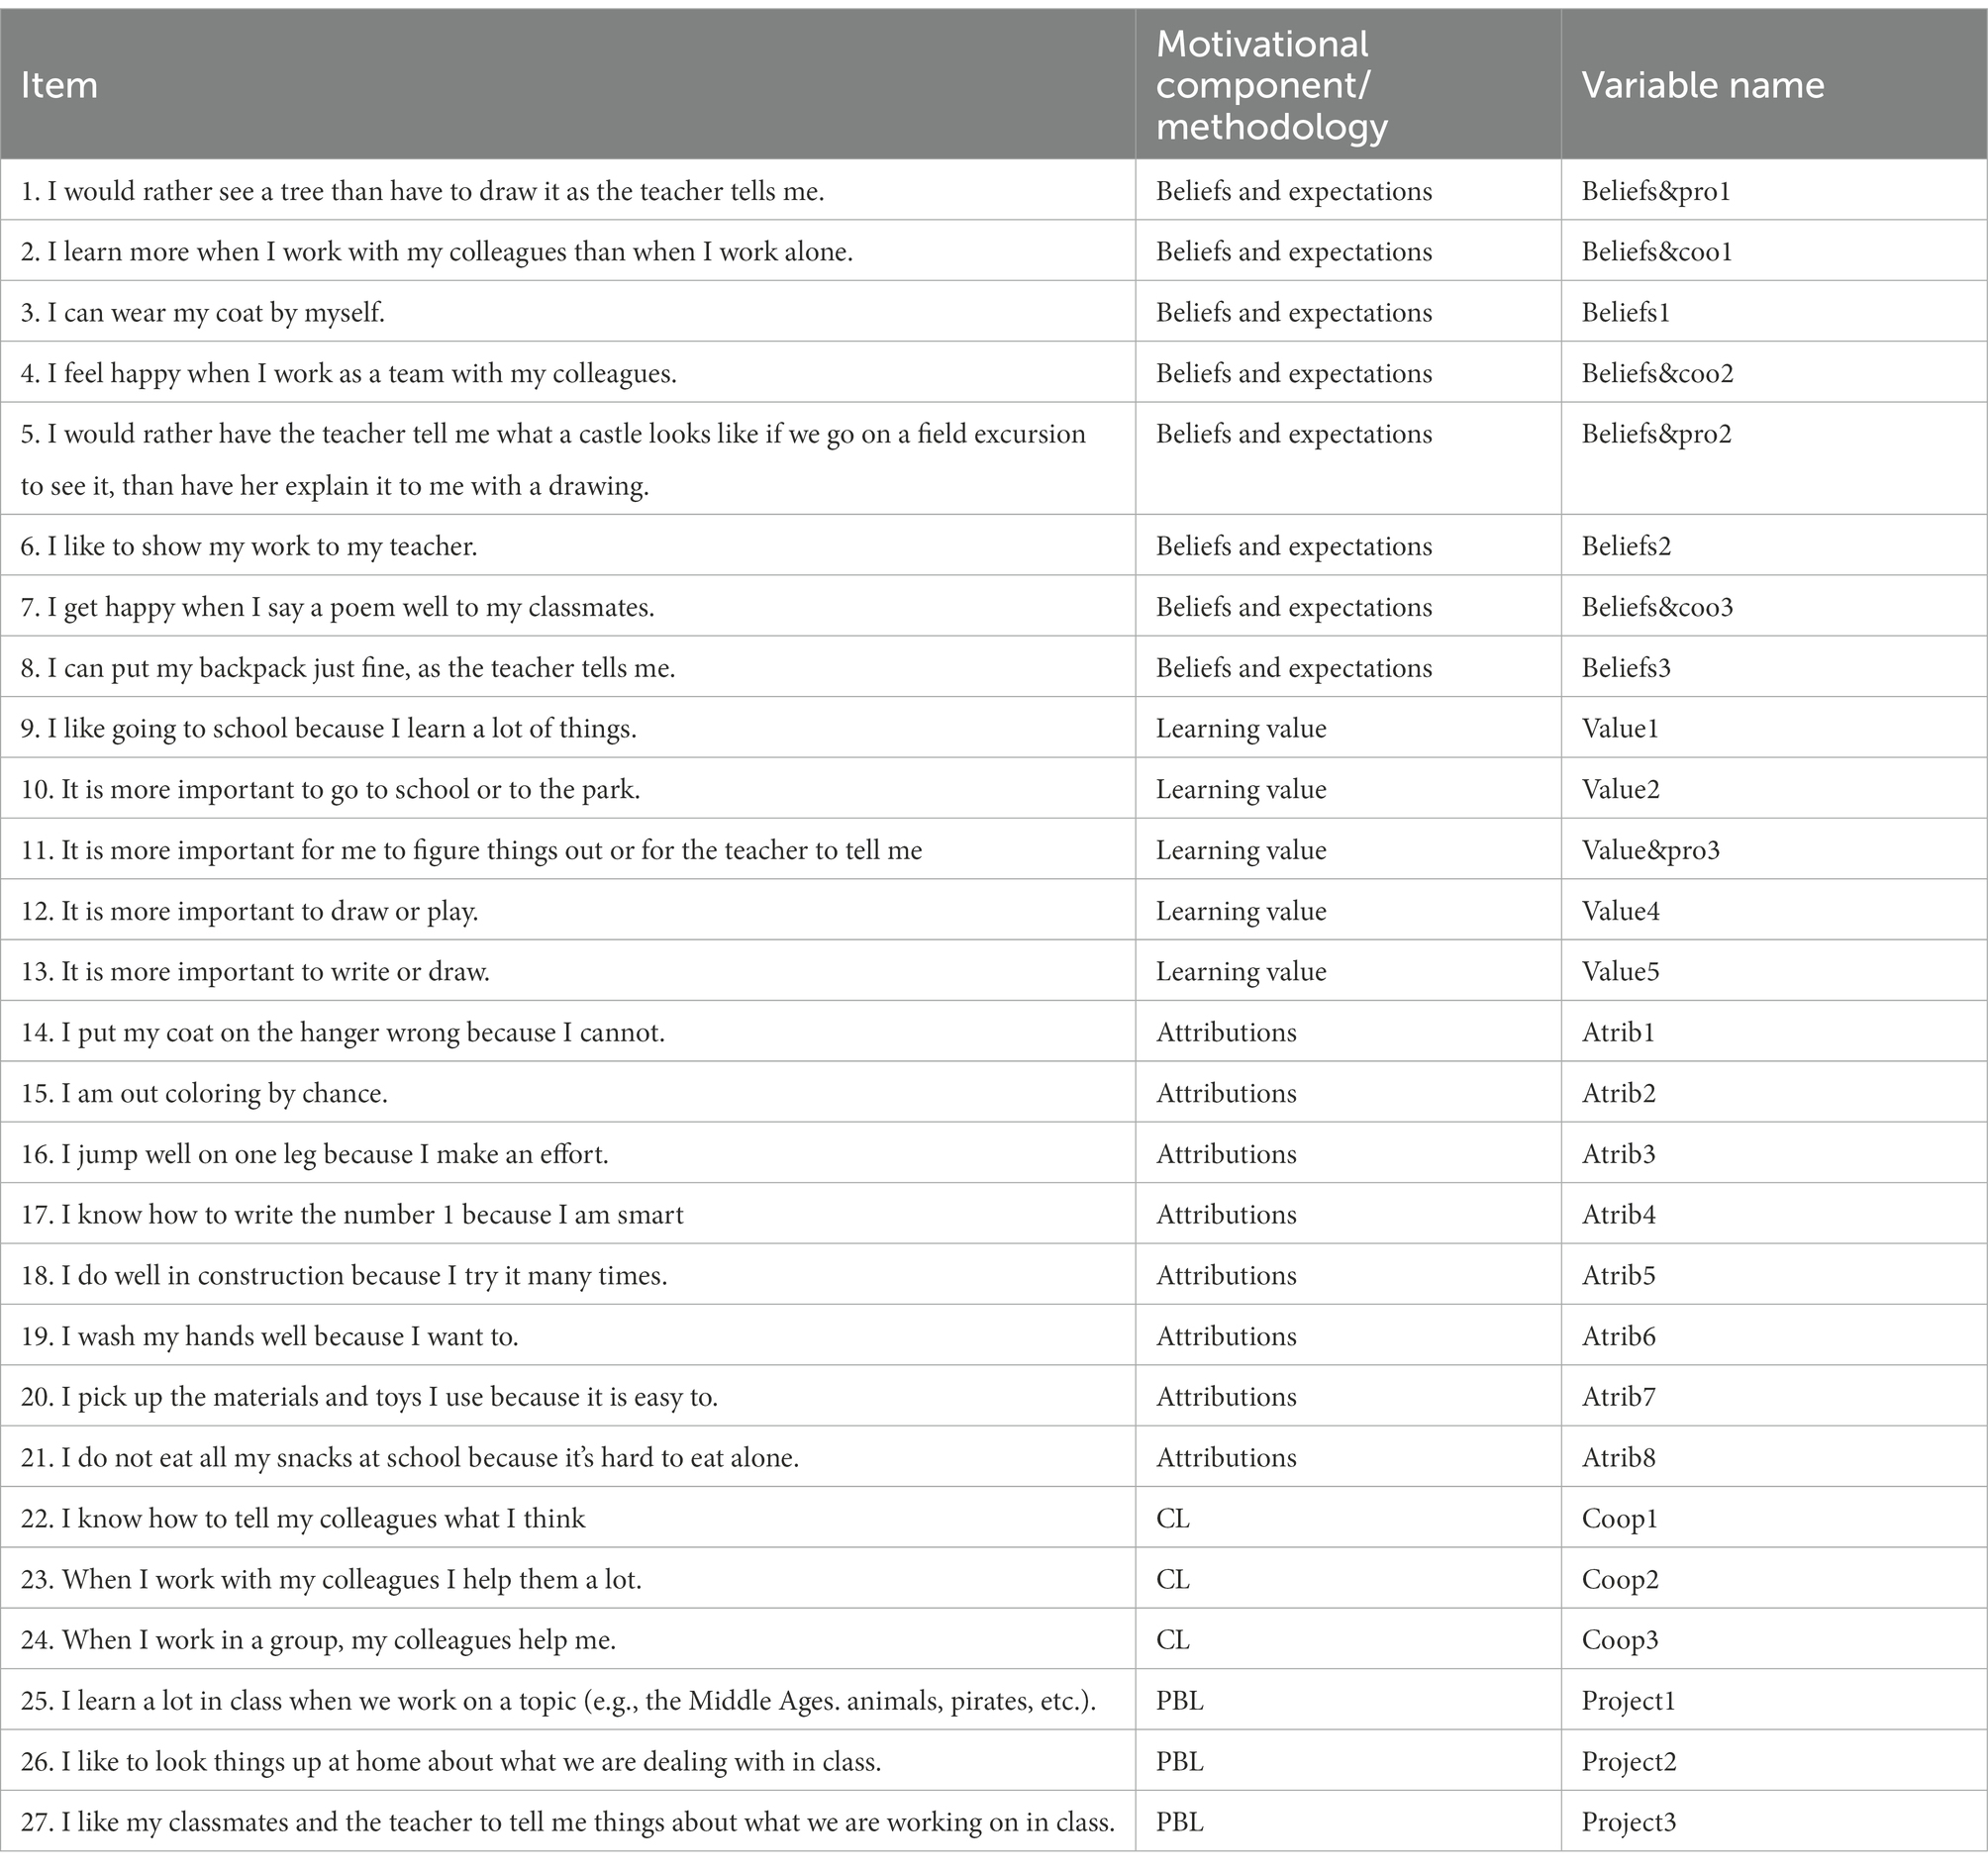
The ad hoc questionnaire used in this study is included in Appendix Table A1 and it is intended to measure the variable of student motivation with respect to the teaching methodology. The questionnaire was designed to gather information from the corpus concerning the three components of motivation, that is, beliefs and expectations, task value, and attributions as well as how these are related to the use of particular active methodologies. The instrument used integrates all these components into 27 items measured on a Likert-type scale with three levels: agree, neither agree nor disagree, and disagree. The students in the corpus used for the present study are all at the ‘preoperational’ stage of their development, thus they can manage tasks with concrete elements but will struggle with abstraction and clearly, the assessment of their motivation must take into account their developmental stage (de Caso Fuertes, 2014). In this way, to evaluate correlations between the variables used in this investigation, various visual aids were used to assist students in their understanding of the items in the study questionnaire, specifically, all items contained an illustrated section (Figure 2) as well as a written one.
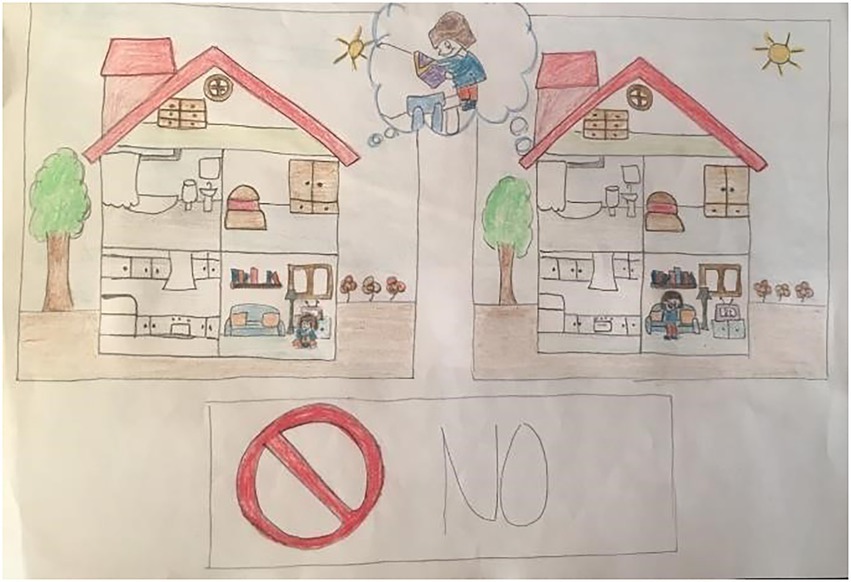
Figure 2. Sample of a questionnaire item.
The component of motivation associated with beliefs and expectations was assessed in three items (Beliefs1, 2, and 3 corresponding to questionnaire items 3, 6, and 8), for example: “I can put my coat on by myself.” A total for this motivation component was calculated as the sum of scores for each individual belief scores (TotalBeleifs).”
Four items were used to measure students’ perceptions of task value (Value 1–4 corresponding to questionnaire items 9, 10, 12, and 13), for example: “I like going to school because I learn lots of things.” A total score for this component was calculated as the sum of individual value scores (TotalValue) (see Table 3).
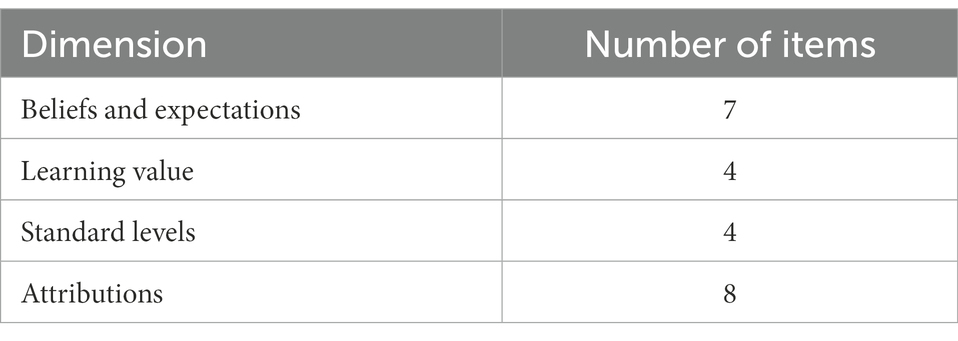
Table 3. Motivation dimensions in the EMAPI questionnaire.
Seven items were used to measure students’ perceptions of attributions (Attributions 1–7, corresponding to questionnaire items 14, 15, 16, 17, 18, 19, 20, and 21), for example: “I know how to write the number 1 because I’m very smart.” A total score for this component was calculated as the sum of individual value scores (TotalValue).
Two items concerning beliefs and expectations and one concerning task value also measured the motivation of students with respect to active methodologies (Beliefs&pro1, Beliefs&pro2, and Value&pro3, corresponding to questionnaire items 1, 5, and 11), for example: “It’s better to discover things for myself than that my teacher tells me everything.”
Three items were used to measure motivation in relation to CL methods and students’ beliefs and expectations (Beliefs&coo1, Beliefs&coo2 y Beliefs&coo3, corresponding to questionnaire items 2, 4, and 7), for example: “I feel happy when I work as a team with my classmates.”
Six items were included to gather together all the information concerning how positively students responded to the use of active methodologies (Coop1, Coop2, Coop3, Project1, Project2, and Project3, corresponding to questionnaire items 22, 23, 24, 25, 26, and 27), for example: “When I work with my classmates, I help them a lot.”; “I like to find things at home that have to do with things we learn in class.”
3.4. Procedure
Before the start of the investigation, the centers used were contacted to ensure that teachers in the classes that formed the corpus for the present work would be making use of the methodologies of interest so that the study could proceed (traditional methods, PBL, and CL). The classroom implementation of the methodologies forming the focus of this research took place over a period of time from the beginning of the academic year to its end. Thus, to assess the effectiveness of these methodologies, the study questionnaire was completed at the end of the academic year.
Because the corpus for this study comprised under-age individuals and the questionnaire would be administered during school hours, before the study could take place, informed consent was obtained from their families and their schools. Thus, both families and schools were given information about the nature of the study and anonymity was guaranteed for all participants. Once this process was completed, the researcher in charge of administering the questionnaires went into classrooms to make initial contact with participants. Due to the ages of participants, the completion of the questionnaire was presented as a game and was administered face-to-face on an individual basis so that questionnaire items could be explained or even read to students by the researcher. Administration of the questionnaire took place outside the classroom itself in the form of a one-to-one interview and before beginning, the researcher would explain to participants how the questionnaire was to be completed making clear that there were no right or wrong answers. The researcher would then give participants a paper copy of the questionnaire and show them the response options as three emoji faces in different colors representing the different degrees of agreement: “agree,” smiling face in green; “neither agree nor disagree,” neutral face in orange; and “disagree,” angry face in red. The researcher would then carefully read each questionnaire item to ensure that participants understood the question. At the same time, the researcher would show a piece of card on which the three possible responses were shown pictorially. Once the question had been asked, participants were asked to give their response verbally and also indicate the picture on the researcher’s card that corresponded to the answer they had given. Wherever necessary, clarifications were made concerning the questionnaire items to ensure that there would be no ambiguities in participants’ understanding of questions and thus the investigation’s findings would be reliable.
The questionnaire was administered by the same researcher in both centers and all classrooms in order to control for factors such as the researcher’s own response to the test situation and those concerned with researcher-participant interactions. Furthermore, to control for factors that might threaten the questionnaire’s internal validity, it was administered at the same time of day in all cases.
3.5. Statistical analysis
Statistical analysis of data was carried out using the program IBM SPSS Statistics v.26. Normality was tested using the Lilliefors-corrected Kolmogorov–Smirnov test and for all variables, p-values were less than the significance level of 0.05, indicating that the null hypothesis of normality should be rejected. As a result, data were analyzed using non-parametric methods, specifically the Mann–Whitney U-test and Kruskal–Wallis tests for comparisons between independent samples, and Rosenthal’s r for effect size. With regard to this last statistical test, Coolican’s (2018) interpretation was used.
4. Results
In the following, the results of the investigation are described looking at the different variables assessed in relation to the specific objectives of the present study. All results shown here had a significance level equal to or less than 0.05 for which the null hypothesis was considered true.
4.1. Motivation components and sex
With respect to the results obtained concerning the relationship between specific motivation components and the variable “sex of participant,” statistically significant results were found for five questionnaire items and the variable termed Total value (using the Mann–Whitney U-test, see Table 4). The variation in statistical significance ranged from 0.17 (Project3) to 0.05 (Beliefs1). Comparing median scores for individual questionnaire items, the lowest score recorded for the girls was 41 whereas for the boys it was 37.15. This indicates that girls tended to be more motivated than boys.
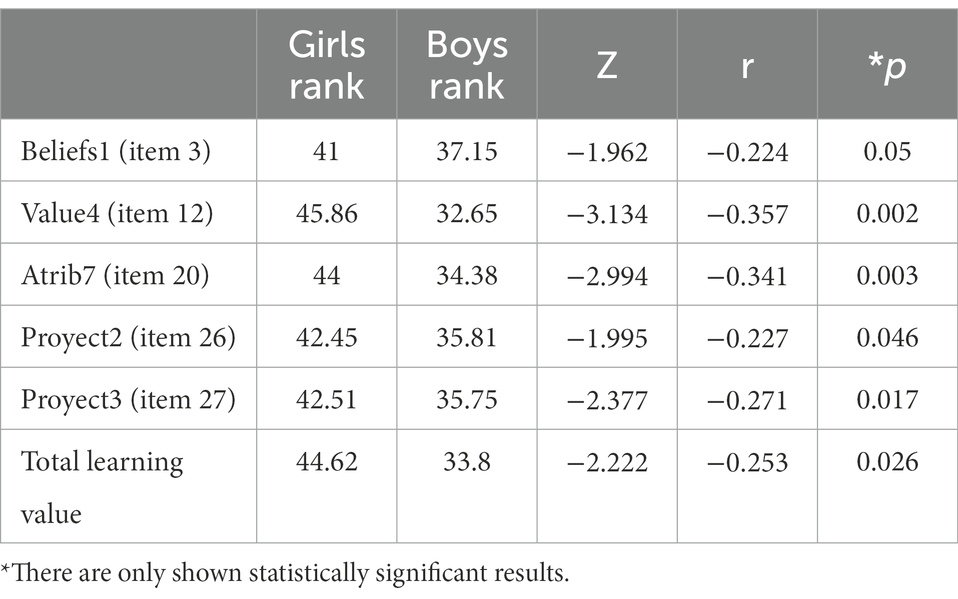
Table 4. Analysis using the Mann–Whitney U-test to evaluate how motivation depends on sex.
The effect strengths calculated through the r of Rosenthal show a negative r in all variables, which means that the second group (girls) is larger than the first one (boys), which it is usual talking about educational studies. With respect to the differences seen for four of the variables considered Beliefs1, Project2, Project3, and Total value, the r value calculated was equal to or less than 0.3, thus demonstrating a moderate-small effect size. However, the differences seen for the remaining variables have a range of r values from 0.30 to 5.0, demonstrating a moderate-large effect size.
4.2. Motivation components and age
Concerning the results obtained for motivation components and their relationship to the variable, age of participant, here statistically significant results were found in the case of seven variables (using the Kruskal–Wallis test, see Table 5). In order to complete this analysis participants were split into three age groups: group 1 (41 to 53 months old); group 2 (54 to 66 months); and group 3 (67 to 76 months old).
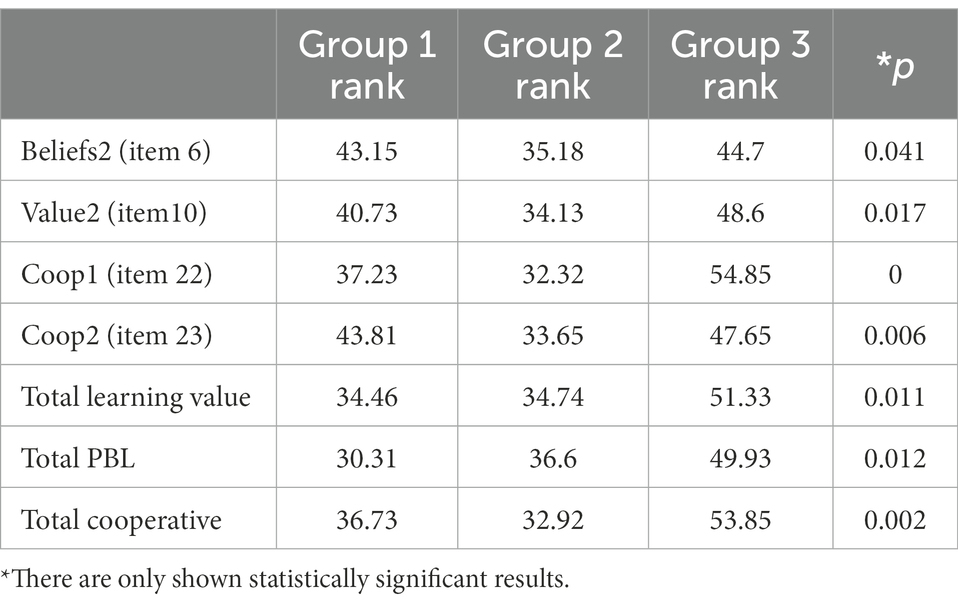
Table 5. Kruskal–Wallis analysis to evaluate how motivation depends on age.
Results of this analysis showed there were significant differences for 11 significant differences between groups in a total of seven variables (Beliefs2, Value2, Coop1, Coop2, Total value, and Total cooperative) with greatest motivation seen among the oldest group (group 3: children aged 67 to 76 months) in every case. This group also had the highest scores in all questionnaire items compared to other age groups. However, to verify precisely between which groups statistically significant differences existed, further post-hoc analysis was completed using the Mann–Whitney U-test (Table 6). This demonstrated that group 2 and group 3 showed statistically significant differences for all seven variables previously identified (4 questionnaire items and 3 total scores), while groups 1 and 3 showed statistically significant differences in only four of these variables (1 questionnaire item and 3 total scores). No statistically significant differences were observed between groups 1 and 2 (children aged 41–53 months and those aged 54–66 months).
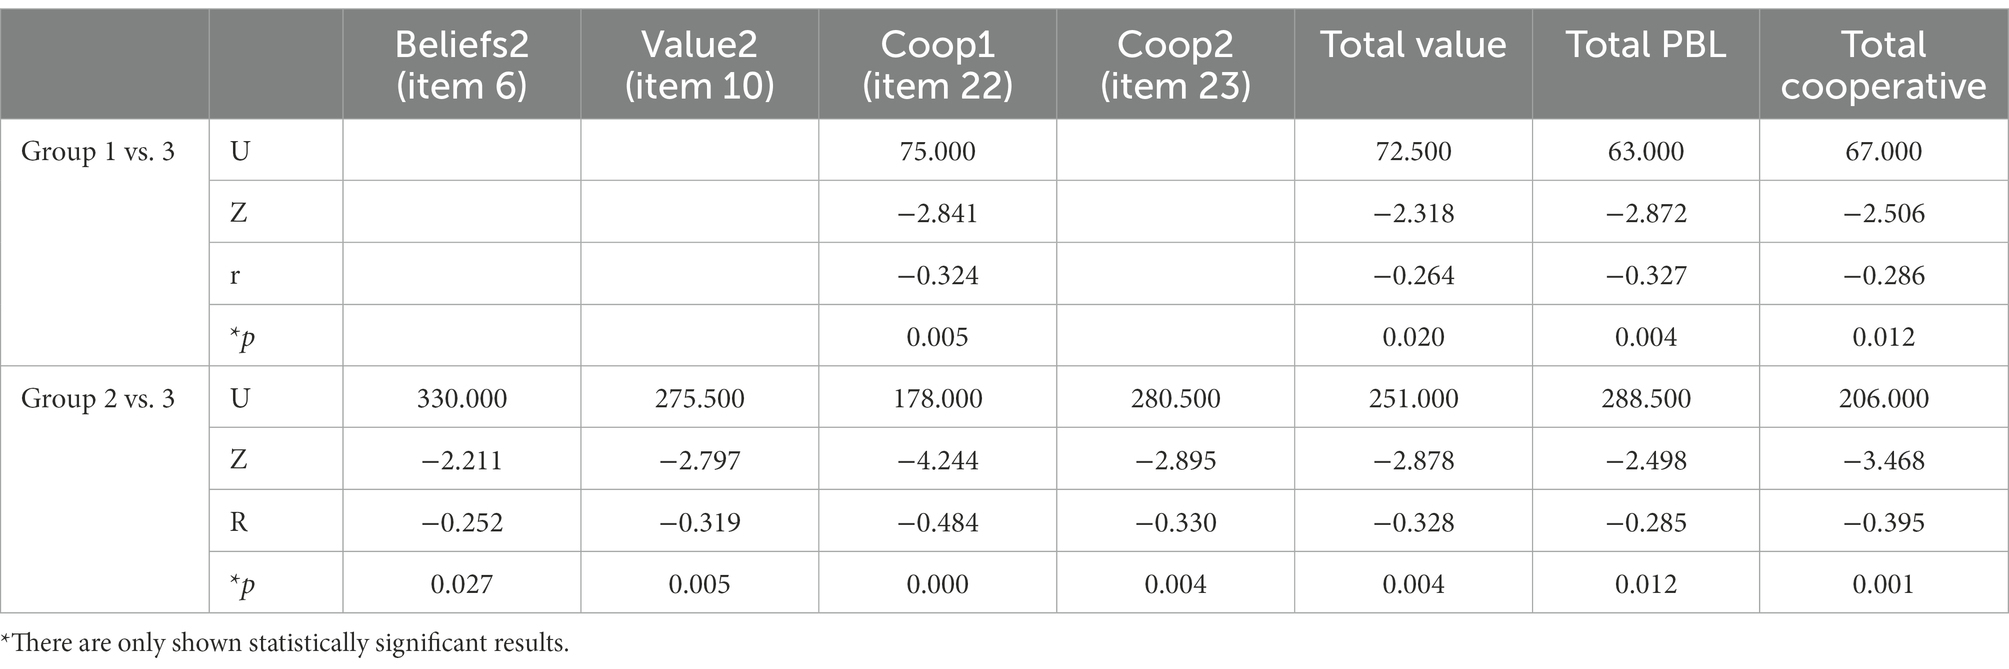
Table 6. Post-hoc Mann–Whitney U-test analysis to evaluate how motivation depends on age.
Effect sizes (calculated as Rosenthal’s r) were once again negative since group 3 was larger than either group 1 or group 2. For seven of the 11 statistically significant differences found, effect sizes were moderate or moderate-high with r > 0.3 (comparing groups 1 and 3 for the variables Coop1 and Total PBL and comparing groups 2 and 3 for the variables Value2, Coop1, Coop2, Total value, and Total cooperative). In contrast, for the remaining differences, small or small-moderate effect sizes were found (comparing groups 1 and 3 for the variables Total value and Total cooperative and comparing groups 2 and 3 for Beliefs2 and Total PBL).
4.3. Motivation components and class ID
For this analysis, the corpus was divided into groups according to class ID. This gave a total of 6 class ID groups (see Table 6): group 1 (center 2, classroom I, class 2); group 2 (center 2, classroom II, class1); group 3 (center 1: section A, classroom I, class 4); group 4 (center 1: section A, classroom II, class 3); group 5 (center 1: section B, class 5); and group 6 (center 1: section C, class 6).
Results of analysis using the Kruskal–Wallis test show that there were significant differences for 16 variables with respect to class ID (11 questionnaire items and 5 total scores) with significance levels varying from 0.000 to 0.04 (see Table 7).

Table 7. Kruskal-Wallis analysis to evaluate how motivation depends on class ID.
Once it had been established that significant differences existed between groups, a further post-hoc analysis was completed using the Mann–Whitney U-test to determine the specific pairs of groups between which these differences occurred (Tables 8, 9). These tests confirmed the existence of significant differences for the 16 variables highlighted in the previous analysis. The following sections will outline the differences existing between class ID groups first in relation to the 11 questionnaire items and secondly in relation to the 5 total scores.
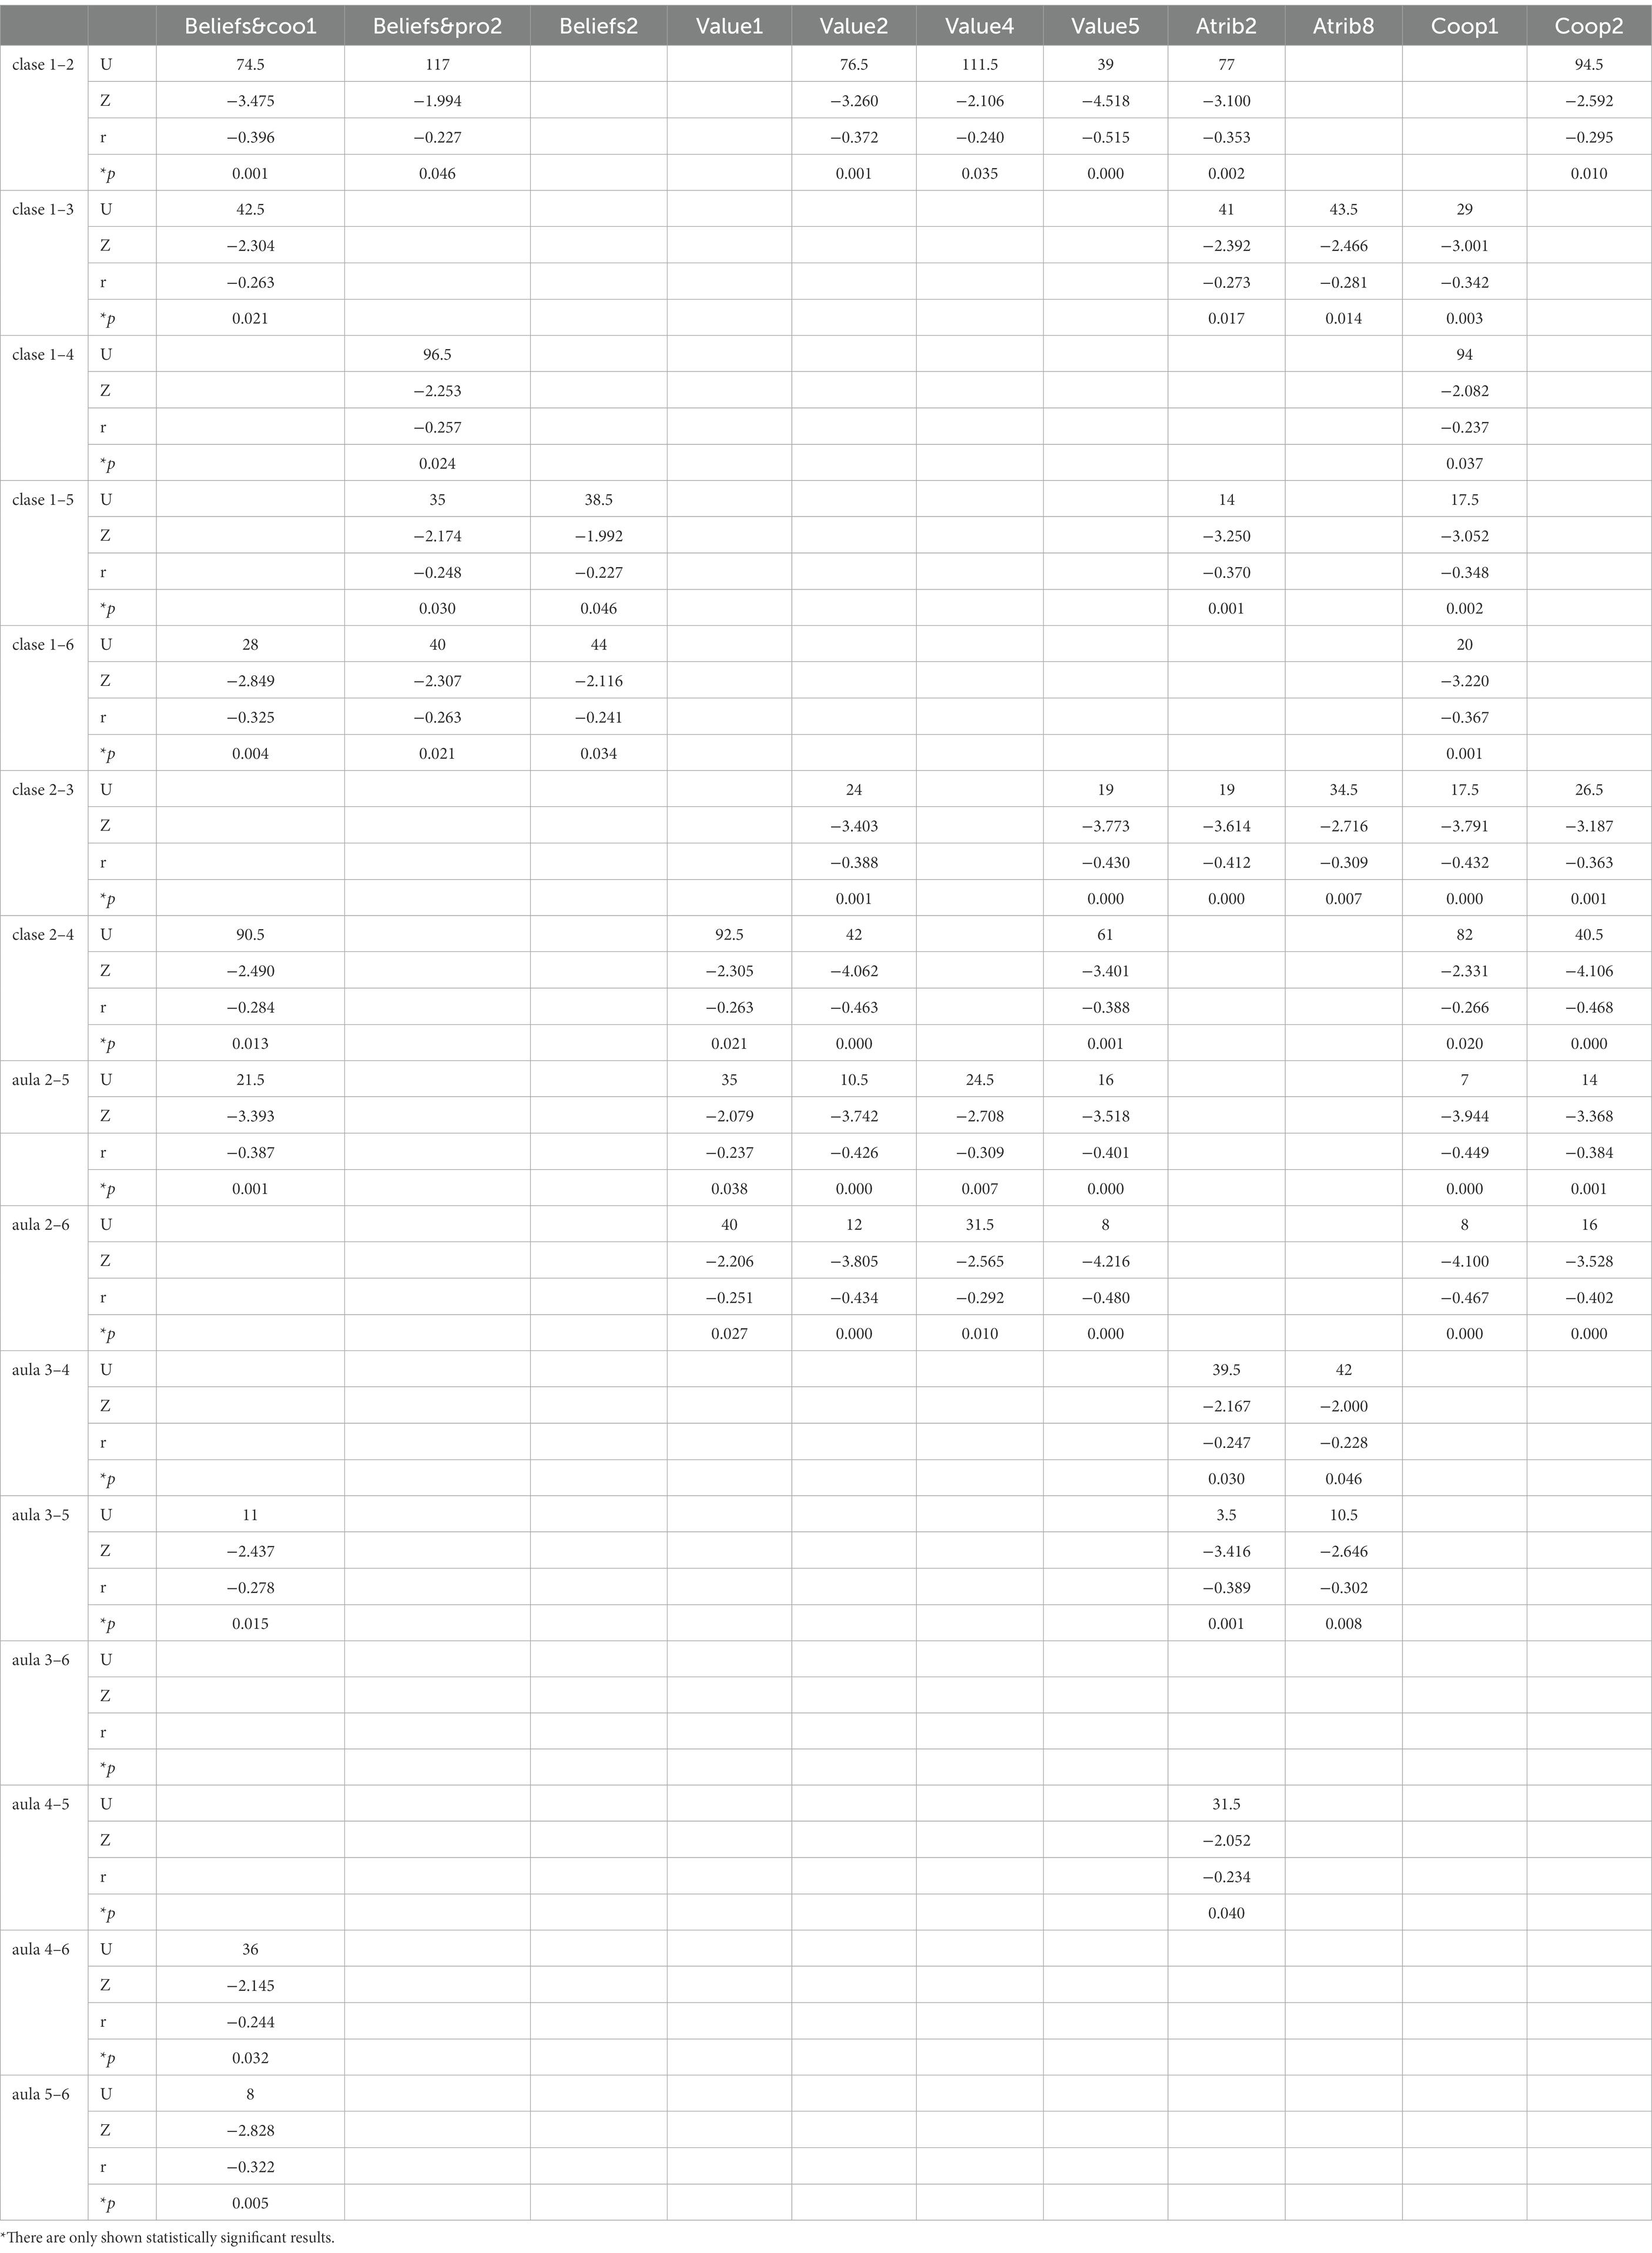
Table 8. Post-hoc Mann–Whitney U-Test analysis to evaluate how motivation depends on class ID I.
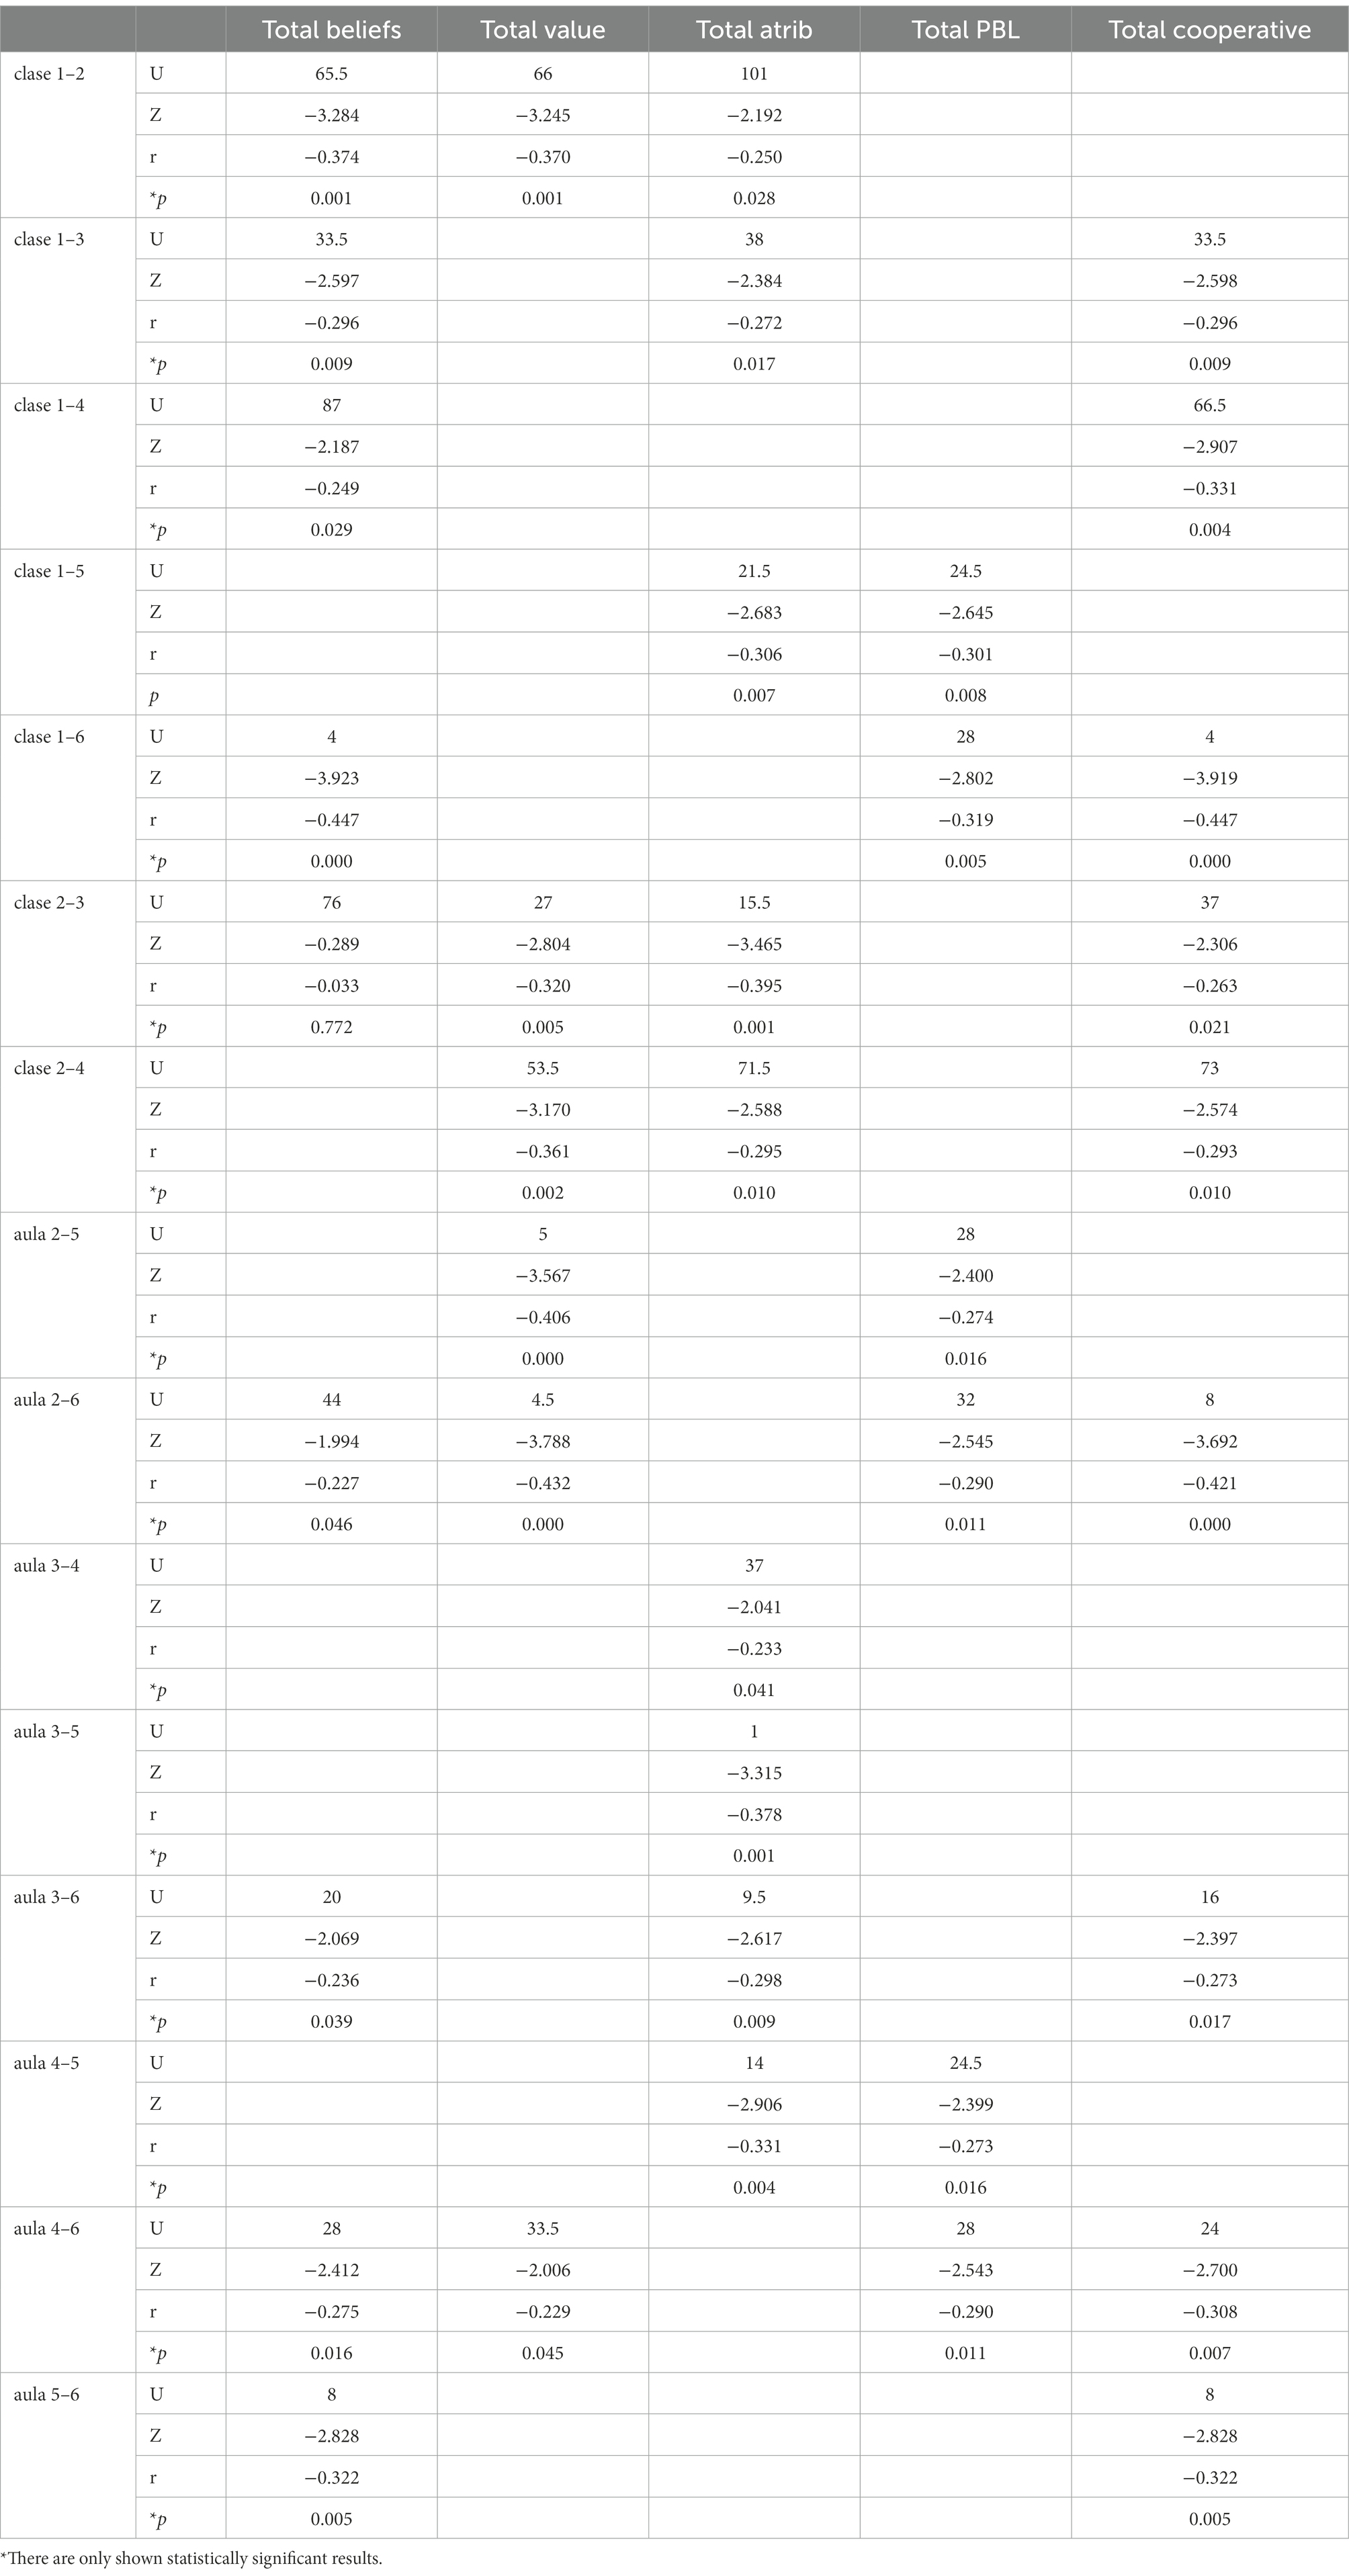
Table 9. Post-hoc Mann–Whitney U-Test analysis to evaluate how motivation depends on class ID II.
4.3.1. Motivation components in terms of questionnaire item and class ID
Where statistically significant differences were found between groups, it was necessary to refer to the scores in Table 7 in order to identify which of the two groups being compared demonstrated the greater degree of motivation. It is noteworthy that the variables shown in Table 8 all correspond to individual questionnaire items.
For all of the following, refer to Table 8.
Considering differences between groups 1 and 2, here statistically significant differences were found for seven questionnaire items. In the case of items related to both beliefs and expectations, and attributions, group1 demonstrated more motivation than group 2. However, for components of motivation connected with task value and CL, group 2 was the more motivated group.
Groups 1 and 3 showed statistically significant differences for four items. Differences related to the motivation component, beliefs, and expectations, and to CL all showed group 3 to be most motivated while for differences related to the component, attributions, group 1 appeared to be most motivated.
Concerning groups 1 and 4, two items showed statistically significant differences. For both of these (Beliefs&pro2 and Coop1), group 4 was seen to be most motivated.
Differences were found between groups 1 and 5 for four items. For all four of these (Beliefs&pro2, Beliefs2, Atrib2, and Coop2), group 5 was the more motivated group.
With respect to groups 1 and 6, statistically significant differences were found for four items (Beliefs&coop1, Beliefs&pro2, and Beliefs2 y Coop1). In all cases, group 6 was seen to be the more motivated group.
Classes 2 and 3 showed statistically significant differences for six variables. Here, all differences concerning items related to attributions showed group 2 to be more motivated while the differences seen concerning items related to task value and CL showed group 3 was the more motivated of these two groups.
Concerning differences between groups 2 and 4, statistically significant differences were found for six items. For one item, Beliefs&coo1, group 2 was shown to be more motivated while for items related task value and CL group 4 appeared to be most motivated.
For groups 2 and 5, differences were found for seven items. Concerning the item Beliefs&coo1, here group 2 was more motivated. For the other six items, which related to the motivation components of task value and attributions, as well as several concerning CL, group 5 was shown to be most motivated.
With respect to groups 2 and 6, six variables showed statistically significant differences. These items concerned task value and CL, and, in every case, group 6 was shown to be most motivated.
Groups 3 and 4 demonstrated differences for two items, both related to the motivation component of attributions. In both cases, group 4 showed more motivation than group 3.
Concerning groups 3 and 5, here statistically significant differences were seen for three items. The item Beliefs&coo1 showed that group 3 was more motivated; however, for the other two items, both concerning attributions, group 5 appeared to be most motivated.
Groups 4 and 5 showed differences for the item Atrib2 and this showed group 5 to be the more motivated group.
Finally, comparing groups 4 and 6, and groups 5 and 6. In both cases, statistically significant differences occurred for the item, Beliefs&coo1, and both comparisons showed group 6 to be the more motivated group.
Effect sizes (calculated as Rosenthal’s r) were negative in all cases reflecting the fact that group 6 was the largest. Analysis shows that there was a large effect size in one instance, Value5, comparing groups 1 and 2, with r > 0.5. For 30 other statistically significant differences found, the effect sizes would be considered moderate-large with r > 0.3, while the remaining 23 significant differences had small-moderate effect size, with r < 0.3.
4.3.2. Motivation components in terms of total scores and class ID
For the following, refer to Table 9.
With respect to groups 1 and 2, statistically significant differences were seen for three total scores: task value, beliefs and expectations, and attributions. Concerning the first of these, results showed that group 1 were more motivated and concerning the latter two, here group 2 appeared most motivated.
Comparing groups 1 and 3, in this case, statistically significant differences were seen for three total scores. For attributions, group 1 appeared more motivated while for the components, beliefs and expectation, and CL, group 3 was the more motivated group.
Concerning groups 1 and 4, statistically significant differences were found for two total scores, specifically those of beliefs and expectations, and CL. In both instances, group 4 was shown to be most motivated.
For groups 1 and 5, statistically significant differences were found for two total scores: attributions and PBL. In both cases group 5 was most motivated.
With respect to the differences between groups 1 and 6, here statistically significant differences were found for three total scores: beliefs and expectations, PBL, and CL. In all cases, group 6 was seen to be most motivated.
Groups 2 and 3 showed statistically significant differences in three total scores. In the case of attributions, group 2 appeared more motivated while in the case of the totals for task value and CL, the situation was reversed, and group 3 seemed to be most motivated.
Concerning the comparison of groups 2 and 4, here statistically significant differences were found for three total scores. With respect to the total for attribution, group 2 was more motivated; however, the totals for task value and CL showed group 4 to be most motivated.
With respect to groups 2 and 5, statistically significant differences were found for two total scores: task value and PBL. In both cases, group 5 appeared to be most motivated.
Comparing groups 2 and 6, statistically significant differences were found for four total scores, specifically, beliefs and expectations, task value, PBL, and CL. In all instances, group 6 was seen to be the most motivated group.
Turning to the comparison of groups 3 and 4, here statistically significant differences were found only in the total score for attributions with class 4 showing most motivation.
With respect to groups 3 and 5, statistically significant differences were found once again in the total score for attributions with class 5 showing most motivation.
For groups 3 and 6, statistically significant differences were found for three total scores: beliefs and expectations, attributions, and CL and group 6 was most motivated in terms of all these components.
With respect to groups 4 and 5, statistically significant differences were found for two total scores. These were attributions and PBL and results showed that group 5 was more motivated.
Concerning groups 4 and 6, statistically significant differences were found for four total scores: beliefs and expectations, task value, PBL, and CL. In all cases, group 6 was most motivated.
Lastly, in the comparison between groups 5 and 6, statistically significant differences were found for two total scores, specifically, beliefs and expectations, and CL. In all cases, group 6 was shown to be most motivated.
As before, effect sizes (calculated as Rosenthal’s r) were negative in all instances. Effect sizes were calculated in 19 instances with 0.30 < r < 0.50. However, for 19 of the significant differences found, the effect size would be considered small-moderate with 0.10 < r < 0.30.
4.4. Motivation components and teaching methodology
Here analysis centered on whether or not motivation appeared to correlate with the teaching methodology used in the classroom. Segmenting the data according to teaching methodology gave three groups: group 1 (PBL); group 2 (PBL + traditional); and group 3 (PBL + CL). Results showed there to be statistically significant differences for seven variables (using the Kruskal–Wallis test, see Table 10).
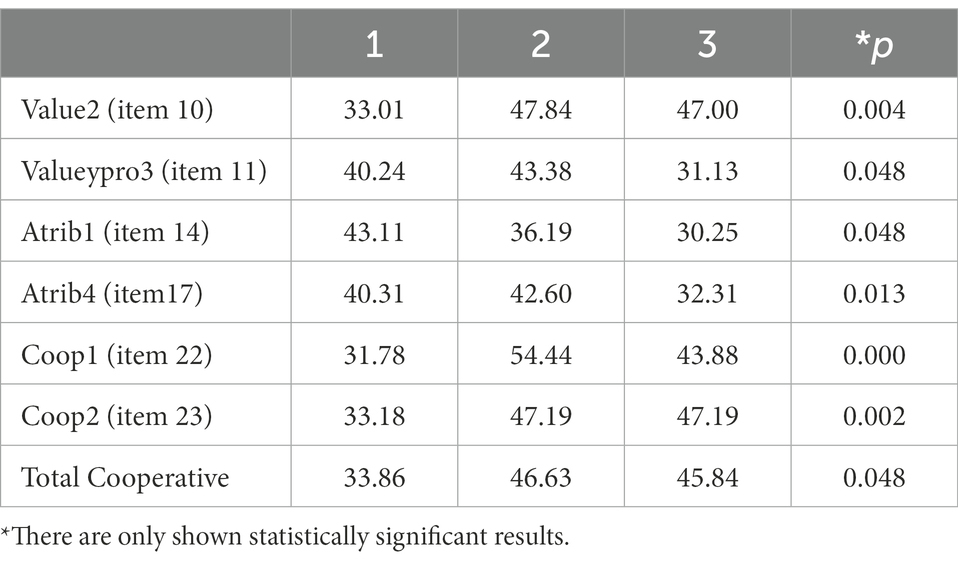
Table 10. Kruskal–Wallis analysis to evaluate how motivation depends on the teaching methodology used.
Statistically significant differences between groups were found for questionnaire items measuring motivation based on the use of PBL and CL, specifically, Value&pro3; Coop1, and Coop2 with significance levels between 0.000 and 0.048. It should be noted that in the case of items that referred purely to CL, statistically significant differences were found for all three groups (significance values = 0.048).
To determine precisely how the groups compared, a post hoc analysis was completed using the Mann–Whitney U-test (Table 11) and this demonstrated 11 instances of statistically significant difference. Comparing groups 1 and 2, statistically significant differences were found for three variables, all showing group 2 to be most motivated. In the case of groups 1 and 3, statistically significant differences were found for 6 variables (5 questionnaire items and one total score) and while three (Value&pro3, Atrib1, and Atrib4) showed group 1 to be most motivated, the other three (Value2, Coop2, and Total cooperative) showed group 2 to be the more motivated group. Considering groups 2 and 3, here statistically significant differences were found for two variables (Value&pro3 and Atrib4) with group 2 shown to be most motivated in both cases.
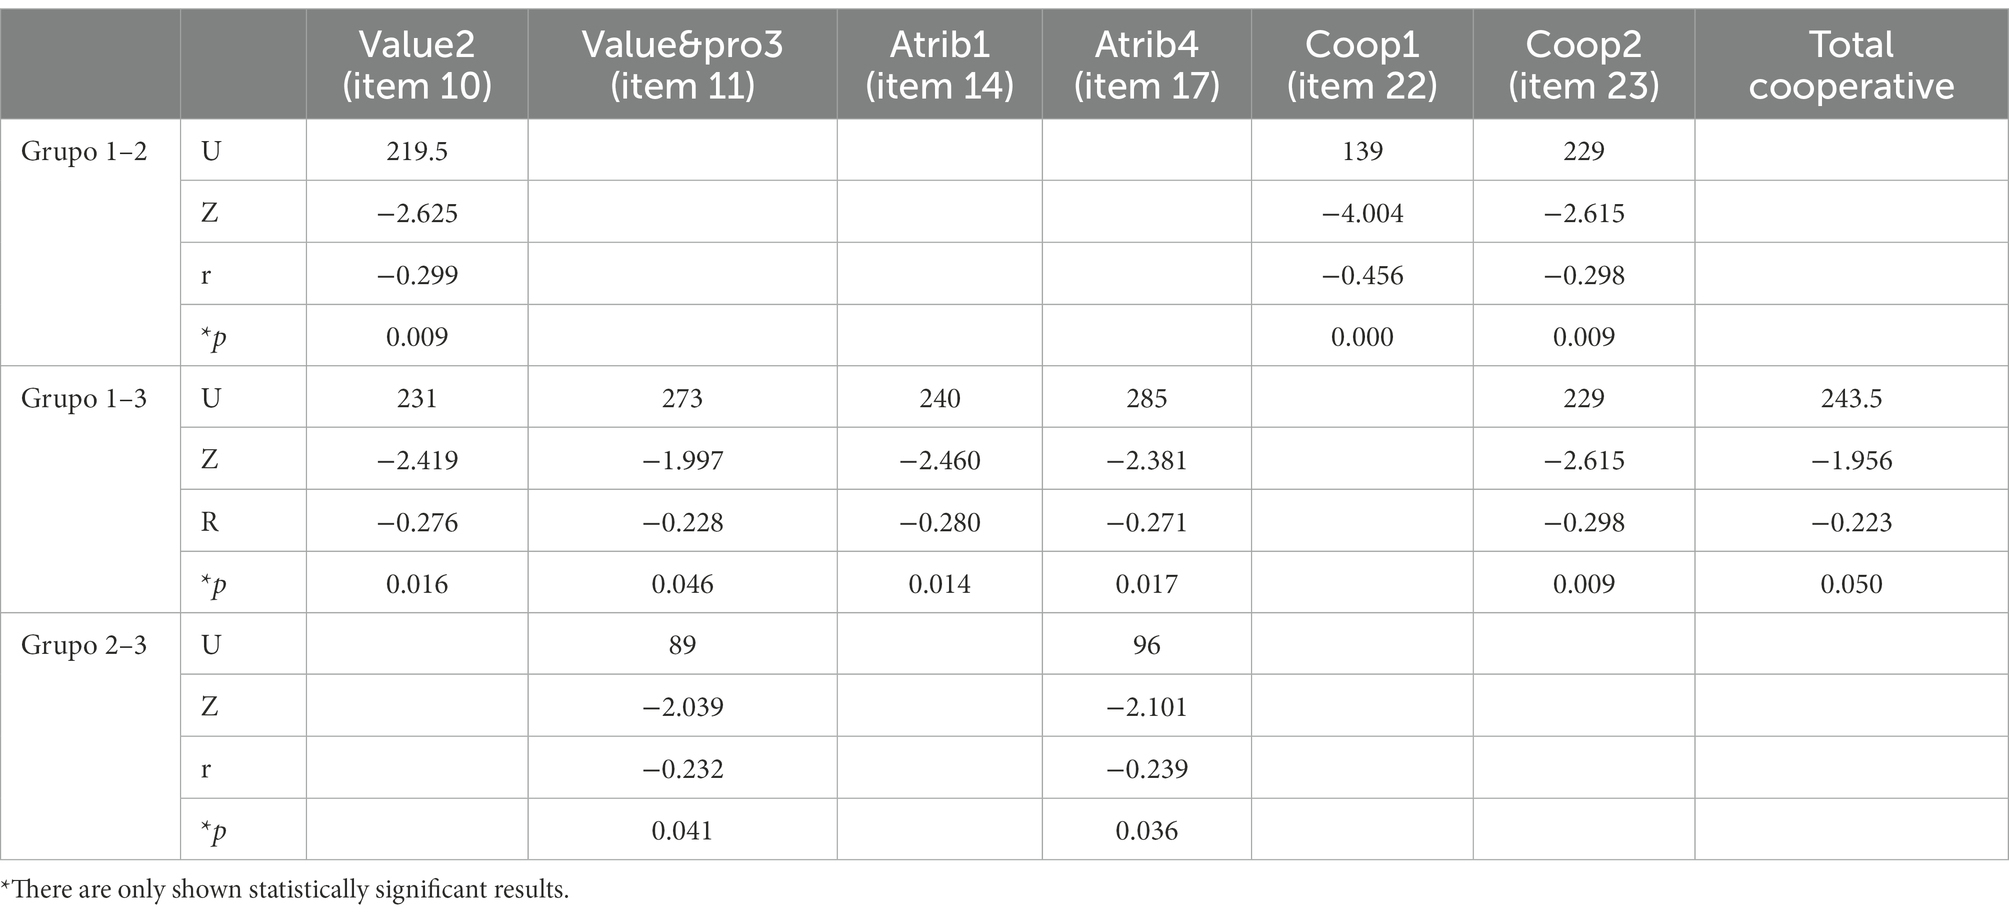
Table 11. Post-hoc Mann–Whitney U-Test to evaluate how motivation depends on teaching methodology.
The effect sizes (calculated as Rosenthal’s r) were again negative in all instances. Effect size was medium-large in one case (Coop1), with r > 0.30. However, medium-small effect sizes were calculated in all other cases of statistically significant difference with r in a range between 0.10 and 0.30.
4.5. Motivation components and type of center
Concerning the relationship between motivation components and the type of center attended by participants (either an urban or rural school in this case). Thus, the corpus was divided according to which school center participants attended, either the urban (group 1) or rural (group 2) school and results obtained through an analysis using the Mann–Whitney U-test indicated that 11 of the variables tested here showed statistically significant differences (Table 12). It was shown that group 2 was more motivated than group 2 since, in all cases where statistically significant differences were found, group 2 always obtained the higher score.
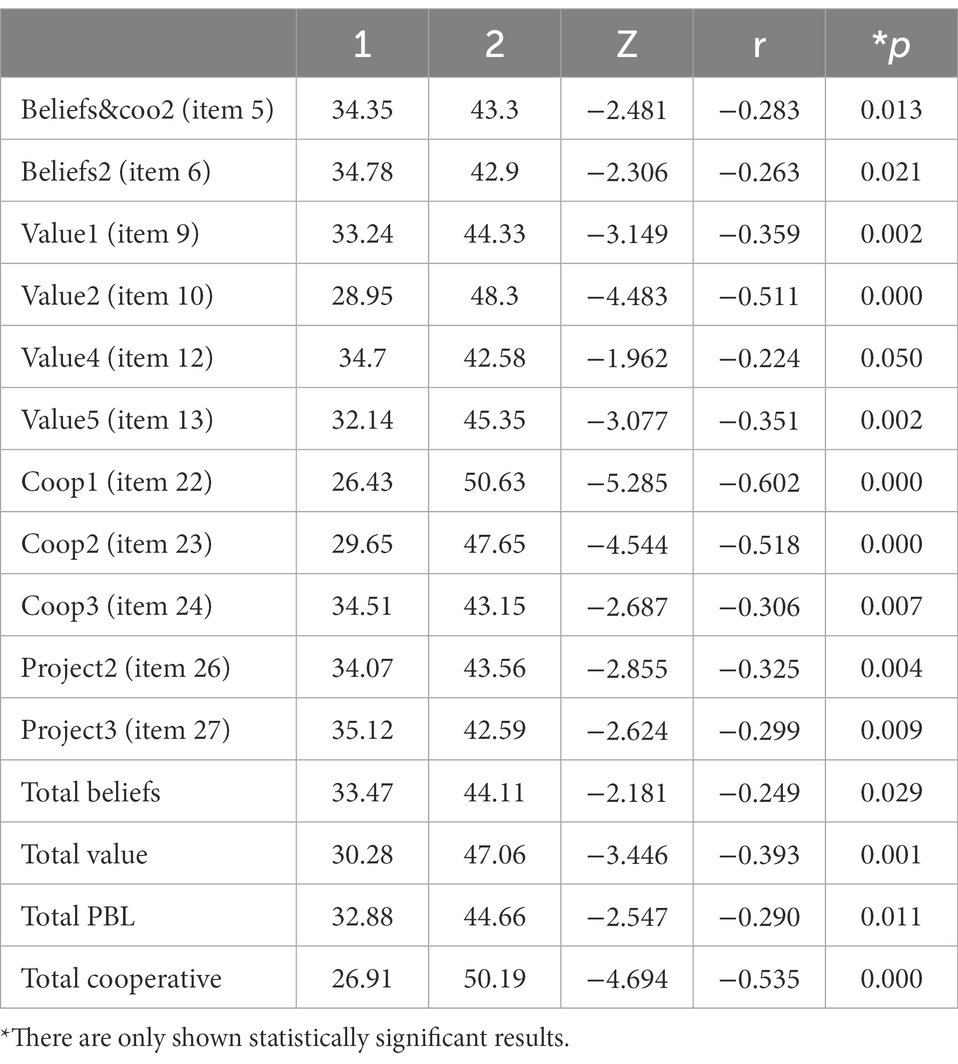
Table 12. U Mann–Whitney analysis to assess how motivation is affected by center type.
Effect sizes (calculated as Rosenthal’s r) were negative in all cases, reflecting the fact that the rural school group (group 2) was larger than the urban school group (group 2). In the case of differences seen for 4 of the variables (Value2, Coop1, Coop2, and Total cooperative), the effect size would be considered large, with r > 0.50. In the case of five variables (Value1, Value5, Coop3, and Project2 and Total value), the differences found had effect sizes that would be considered medium-large with 0.30 < r < 0.50, while differences seen for the remaining variables demonstrated small effect size with 0.10 < r < 0.30.
5. Conclusion and discussion
The objective of this study was “to assess the impact of using active methodologies on the intrinsic motivation of students in the second cycle of pre-school education (3–6 years) towards the process of teaching and learning.” With reference to this general aim, the findings of this study are that the use of active methodologies in the process of teaching and learning in pre-school education does indeed improve learning motivation among students. It is necessary to recall that the areas of study in Pre-school are not well differenced so that motivation that PBL improves is general academic motivation in this sample. Results of this study show the importance of incorporating active learning methodologies at the pre-school stage of education to foster learning motivation among students as good learning motivation also promotes students’ overall development (Abeles et al., 2017). To further emphasize the importance of active methodologies, it has been shown that students in this early phase of education are particularly predisposed toward active learning methodologies (Ansari et al., 2019).
Using a specially designed ad hoc questionnaire, this investigation was able to quantify the motivation of students in the second phase of pre-school education. To account for the developmental stage of the students participating in this study, a particular feature of this questionnaire was the use of both written and pictorial elements. It should also be mentioned that questionnaires were administered on a one-to-one basis to facilitate the understanding of all its items and ensure that students did not copy one another.
Our findings demonstrate the existence of a correlation between learning motivation and sex, specifically, girls appear more motivated than boys. This result is in agreement with those of Aljohani and Alajlan (2020) and several factors have been cited to explain this phenomenon. On the one hand, it could be the effect of biases even in these early stages of development which prevent the achievement of equality in education (Su et al., 2022), or on the other hand, as suggested by Rusillo (2017), academic goals, causal attributions, and learning strategies all vary according to sex hence giving rise to differences in levels of motivation between boys and girls.
Findings also show a relationship between age and levels of learning motivation. In the present study, students in the age bracket 67 to 76 months (3rd year of pre-school in Spain) demonstrated higher levels of motivation compared to students in either of the two younger age brackets assessed and differences were statistically significant. This result coincides with the findings of a study by Gottfried et al. (2001), which concluded that the intrinsic motivation of students increases until the ages of 10–11 years after which it begins to decrease.
Considering the type of classroom in which students were taught (class ID), here, two classes, in particular, showed higher degrees of learning motivation among students compared to other classes. One of the highly motivated classes was taught using PBL and this result agrees with the findings of research by Shin (2018), showing that the use of active methodologies was beneficial to learning motivation. Here, it is also interesting to note that PBL has been proven to foster the development of interpersonal skills and a good attitude to learning (Shin, 2018; Shinde and Shinde, 2022). The other highly motivated class was that in which traditional methods were used in conjunction with PBL. This finding is in line with those of Manchado Cardoso et al.’s (2021) study.
Concerning the influence on learning motivation of the type of methodology implemented in the classroom, here students taught using a combination of traditional worksheets and PBL showed the highest levels of motivation. In this regard, it must be said that the traditional worksheet methods used in the classrooms examined for the present study were integrated with the PBL being implemented at the same time. As a result, the findings presented here tend to reaffirm the idea that active methodologies make a positive impact on students’ learning motivation, enhancing interest in learning and in the task (Manzano-León et al., 2022). It would seem then that the combination of two methods with a focus on student-centered active methodologies increases learning motivation and also academic achievement, a phenomenon that has been observed in the case of university students who experienced a combination of active and traditional methods (Pérez-Poch et al., 2019; Manchado Cardoso et al., 2021). Leading from this, one conclusion would be that when resources deemed to be traditional are used in innovative ways, both in terms of how they are used and where they are applied, this can have a positive impact on students’ learning motivation.
Turning to consider the effect on learning motivation of the type of center—rural or urban—where participants were taught, here it was found that students attending the rural school were more motivated than those attending the urban school. This result is in line with a study completed by de Caso Fuertes (2017) and is potentially down to three factors. Firstly, it has been shown that rural schools tend to construct positive relations between the teacher and their students which, in turn, fosters an environment of trust so increasing levels of learning motivation among students (Hardré and Sullivan, 2008). The second factor lies in the increased ability of rural schools to individualize the education students receive due to the links created between teachers and students. This enables teachers to get to know their students better and thus they can adjust their teaching to the needs of each student (Ylimaki et al., 2020). The third and final factor concerns the fact that where students find themselves in a learning environment where they do not feel under pressure, their self-esteem is bolstered and this has a positive impact on their intrinsic motivation since it allows them to see their skills in a positive light (Liukkonen et al., 2010; Halvari et al., 2011). The findings presented here go further than those of previous studies in that while other studies have focused on demonstrating the positive effects of active methodologies on learning motivation in primary education, compulsory secondary education, and university education (Gómez et al., 2021; Mula-Falcón et al., 2022), this work shows that such methods are beneficial even at the earliest stages of education.
Very few empirical studies exist concerning the pre-school phase of education, perhaps due to the difficulties of objectively assessing the youngest learners in terms of such abstract concepts as learning motivation. Thus, the results presented here make a significant contribution to the field of educational research since they clearly indicate the importance of using active methodologies from the very beginning of students’ educational journey. The three main contributions of this work can be summarized as follows: firstly, helping to improve the methodological practices of pre-school teachers by showing the overall positive value of active methodologies; secondly, reaffirming the importance of the teaching environment as, one might say, the third agent in the teaching and learning process by highlighting how it is not only the methodology implemented that can make a difference to motivation but also the classroom environment; and thirdly providing an insight into a methodological approach that can be implemented in subsequent stages of the educational process with the aim of ensuring that students’ learning motivation does not decrease, and more specifically avoiding reductions in students’ intrinsic motivation in favor of extrinsic motivation as is shown to occur for students over the age of 11 years (Gottfried et al., 2001; Lieury and Fenouillet, 2016).
6. Limitations and strengths
The present study has three main limitations: (1) although the sample size used for this work was large, we are aware that it could have been broader allowing us to generalize our conclusions to the wider population of infants receiving pre-school education; (2) we were unable to find a classroom that used only traditional methodologies to assess the effectiveness of such methods when used on their own. Although this is a limitation of the present study, it also reflects an evolution in terms of educational methodologies toward more constructivist approaches in line with recent changes in the relevant legislation; (3) it would have been informative to complete a base-line test of learning motivation at the beginning of the academic year. This would be useful firstly to assess changes in learning motivation and secondly to test the assumption we made in the present study that because all participants were pre-school students at a similar developmental stage, no fundamental differences existed between them.
As future lines of investigation, we suggest first that this study be repeated with a larger corpus and taking into account a wider range of teaching methodologies. Secondly, it would be interesting to complete a longitudinal study including a control group and two experimental groups with the questionnaire administered both at the beginning of the academic year and at the end such that changes in motivation between the beginning and the end of the year could be assessed as well as differences in motivation between groups. Another interesting line of investigation would be to analyze how PBL changes motivation in different areas of study, what can be probed in Primary studies as they have well-defined areas as language, maths, and sciences, etc.
Data availability statement
The original contributions presented in the study are included in the article/supplementary material, further inquiries can be directed to the corresponding author.
Ethics statement
Ethical review and approval was not required for the study on human participants in accordance with the local legislation and institutional requirements. Written informed consent to participate in this study was provided by the participants' legal guardian/next of kin.
Author contributions
YV: concept and questionnaire implementation. YV and AC: methodology, questionnaire design, results, resources, and writing-original draft. AC: validation, formal analysis, and review. All authors contributed to the article and approved the submitted version.
Acknowledgments
The authors would like to thank the schools, teachers, and students who volunteered to participate in this study. Without their cooperation and contributions this work would not have been possible. We would also like to thank the parents of participating students for their support. In addition, we thank the Servicio de traducción científica at the University of Leon for the English translation of this article.
Conflict of interest
The authors declare that the research was conducted in the absence of any commercial or financial relationships that could be construed as a potential conflict of interest.
Publisher’s note
All claims expressed in this article are solely those of the authors and do not necessarily represent those of their affiliated organizations, or those of the publisher, the editors and the reviewers. Any product that may be evaluated in this article, or claim that may be made by its manufacturer, is not guaranteed or endorsed by the publisher.
References
Abeles, H., Hoffer, C., and Klotman, R. (2017). Foundations of music education. Revista Electrónica de LEEME 20, 104–107. doi: 10.7203/LEEME.44.15679
Aljohani, O. H., and Alajlan, S. M. (2020). Motivating adult learners to learn at adult-education schools in Saudi Arabia. Adult Learn. 31, 150–160. doi: 10.1177/1045159519899655
Ansari, A., Pianta, R. C., Whittaker, J. V., Vitiello, V. E., and Ruzek, E. A. (2019). Starting early: the benefits of attending early childhood education programs at age 3. Am. Educ. Res. J. 56, 1495–1523. doi: 10.3102/0002831218817737
Armas, M. M. (2019). Hacer fluir el aprendizaje. Int. J. Dev. Educ. Psychol. 2, 299–310. doi: 10.17060/ijodaep.2019.n1.v2.1443
Arruabarrena, R., Sánchez, A., Blanco, J. M., Vadillo, J. A., and Usandizaga, I. (2019). Integration of good practices of active methodologies with the reuse of student-generated content. Int. J. Educ. Technol. High. Educ. 16, 1–20. doi: 10.1186/s41239-019-0140-7
Bastos, J. C. F., Sales, G. L., and Monteiro, J. A. (2021). Object of learning in the teaching of simple harmonic motion: a case study using active methodology (ISLE type). Res. Soc. Dev. 10, 1–18. doi: 10.33448/rsd-v10i14.21137
Bizarro, N., Luego, R., and Carvalho, J. L. (2018). “Development of basic spatial notions through work with educational robotics in the early childhood education classroom and analysis of qualitative data with WebQDA software,” in World conference on qualitative research. eds. A. P. Costa, L. P. Costa, and A. Moreira (Warsaw, Poland: Springer), 22–33.
Blanco, J. (2014). Evaluación de la motivación hacia el aprendizaje en niños de 2 a 3 años. Int. J. Dev. Educ. Psychol. 6, 259–266. doi: 10.17060/ijodaep.2014.n1.v6.741
Clark, R. E., and Saxberg, B. (2018). Engineering motivation using the belief-expectancy-control framework. Interdisciplin. Educ. Psychol. 2, 1–26. doi: 10.31532/InterdiscipEducPsychol.2.1.004
Colquitt, J. A., LePine, J. A., and Noe, R. A. (2000). Toward an integrative theory of training motivation: a meta-analytic path analysis of 20 years of research. J. Appl. Psychol. 85, 678–707. doi: 10.1037/0021-9010.85.5.678
Coolican, H. (2018). Research methods and statistics in psychology. London: Psychology Press. p. 86.
de Caso Fuertes, A. M. (2014). Pautas para el estudio de la motivación académica. Int. J. Dev. Educ. Psychol. 6, 213–220. doi: 10.17060/ijodaep.2014.n1.v6.736
de Caso Fuertes, A. M. (2017). “Importancia del tipo de centro educativo, rural o urbano, en los determinantes motivacionales,” in Temas actuales de investigación en las áreas de la Salud y la Educación. eds. J. C. Núñez, M. C. Pérez-Fuentes, M. M. Molero, J. J. Gázquez, A. Martos, and A. B. Barragán (Cantabria, España: SCINFOPER), 109–118.
De Caso Fuertes, A. M., and García, J. N. (2006). Relación entre la motivación y la escritura. Revista Latinoamericana de Psicología 3, 477–492.
de Dios, J., and Rico, J. C. (2021). El currículo de la etapa primaria. In J. Moya and F. Luengo (coord.), Educar para el siglo XXI: REFORMAS Y MEJORAS. LOMLOE: DE LA NORMA AL AULA (pp. 219–233). Madrid: Anaya S.A.
Delors, J. (1996). La educación encierra un tesoro: Informe a la Unesco de la Comisión Internacional sobre la educación para el siglo XXI. Ediciones UNESCO. Available at: https://unesdoc.unesco.org/ark:/48223/pf0000109590_spa
di Domenico, S. I., and Ryan, R. M. (2017). The emerging neuroscience of intrinsic motivation: a new frontier in self-determination research. Front. Hum. Neurosci. 11:145. doi: 10.3389/fnhum.2017.00145
Dweck, C. S. (1986). Motivational processes affecting learning. Am. Psychol. J. 41, 1040–1048. doi: 10.1037/0003-066X.41.10.1040
Erbil, D. G. (2020). A review of flipped classroom and cooperative learning method within the context of Vygotsky theory. Front. Psychol. 11, 1–9. doi: 10.3389/fpsyg.2020.01157
European Commission (2013). Education and training in Europe. Publications Office. Available at: https://op.europa.eu/en/publication-detail/-/publication/25626e01-1bb8-403c-95da-718c3cfcdf19/language-en
European Commission. (2015). Resumen ejecutivo Eurydice. La lucha contra el abandono temprano de la educación y la formación en Europa: estrategias. Políticas y medidas. Secretaría General Técnica. Available at: https://sede.educacion.gob.es/publiventa/resumen-ejecutivo-eurydice-la-lucha-contra-el-abandono-temprano-de-la-educacion-y-la-formacion-en-europa-estrategias-politicas-y-medidas/uropaón-formacion-europa/20556
European Commission. (2020). Comunicación de la comisión al parlamento europeo, al consejo, al comité económico y social europeo y al comité de las regiones. Publications Office. Available at: https://eur-lex.europa.eu/legal-content/ES/TXT/?uri=CELEX%3A52020DC0456
García-Peñalvo, F. J., García-Holgado, A., Vázquez, A., and Sánchez-Prieto, J. C. (2021). Planning, communication and active methodologies: online assessment of the software engineering subject during the COVID-19 crisis. RIED: Revista iberoamericana de educación a distancia 24, 41–66. doi: 10.5944/ried.24.2.27689
Gómez, C. J., Rodríguez-Medina, J., Miralles-Martínez, P., and López-Facal, R. (2021). Motivation and perceived learning of secondary education history students. Analysis of a Programme on initial teacher training. Front. Psychol. 12, 1–14. doi: 10.3389/fpsyg.2021.661780
González-Pienda, J. A. (2003). El rendimiento escolar. Un análisis de las variables que lo condicionan. Revista galego-portuguesa de psicoloxía e educación 7, 247–258.
Gottfried, A. E., Fleming, J. S., and Gottfried, A. W. (2001). Continuity of academic intrinsic motivation from childhood through late adolescence: a longitudinal study. J. Educ. Psychol. 93, 3–13. doi: 10.1037/0022-0663.93.1.3
Halili, S. H., and Razak, R. A. (2018). Flipped classroom approach for preschool students in learning English language. Int. J. Learn. Technol. 13, 203–219. doi: 10.1504/ijlt.2018.095962
Halvari, H., Skjesol, K., and Bagoien, T. E. (2011). Motivational climates, achievement goals, and physical education outcomes: a longitudinal test of achievement goal theory. Scand. J. Educ. Res. 55, 79–104. doi: 10.1080/00313831.2011.539855
Hardré, P. L., and Sullivan, D. W. (2008). Rural teachers’ best motivating strategies: a blending of teachers’ and students’ perspectives. Teach. Teach. Educ. 24, 2059–2075. doi: 10.1016/j.tate.2008.04.007
Hasan, H., Karwan, D. H., Haenilah, E. Y., Rini, R., and Suparman, U. (2020). Motivation and learning strategies: motivation affects student learning strategies. Eur. J. Educ. 10, 39–49. doi: 10.12973/eu-jer.10.1.39
Instituto Nacional de Estadística (2022). Tasa de abandono escolar temprano. INE. Available at: https://acortar.link/qwizbK
Izagirre-Olaizola, J., and Morandeira-Arca, J. (2020). Business management teaching-learning processes in times of pandemic: flipped Classroomat a distance. Sustainability 12, 1–17. doi: 10.3390/su122310137
Jamilah, J., Sukitman, T., and Mulyadi, M. (2021). Flipped classroom: innovative learning to increase the learning motivation of elementary school students in the digital age. Muallimuna: Jurnal Madrasah Ibtidaiyah 7, 33–41. doi: 10.31602/muallimuna.v7i1.4802
Lieury, A., and Fenouillet, F. (2016). Motivación y éxito escolar. Buenos Aires: Fondo de cultura económica (FCE).
Liukkonen, J., Watt, A., Barkoukis, V., and Jaakkola, T. (2010). Motivational climate and students’ emotional experiences and effort in physical education. J. Educ. Res. 103, 295–308. doi: 10.1080/00220670903383044
Llanga, E. F., Silva Ocaña, M. A., and Vistin, J. J. (2019). Motivación extrínseca e intrínseca en el estudiante. Atlante Cuadernos de Educación y Desarrollo 13, 38–47. doi: 10.51896/atlante
Longobardi, C., Prino, L. E., Marengo, D., and Settanni, M. (2016). Student-teacher relationships as a Prtotective factor for school adjustment during the transition from middle to high school. Front. Psychol. 7, 1–9. doi: 10.3389/fpsyg.2016.01988
Manchado Cardoso, A. M., Reis, F. M. D., Moreira, L. C., Lanzini, M., and Lopes, M. L. S. L. S. (2021). Use of case reports and fish-bowl to complement the teaching of biochemistry for medical courses. Rev. Med. 100, 554–560. doi: 10.11606/issn.1679-9836.v100i6p554-560
Manzano-León, A., Aguilar-Parra, J. M., Rodríguez-Moreno, J., and Ortiz-Colón, A. M. (2022). Gamification in initial teacher training to promote inclusive practices: a qualitative study. Int. J. Environ. Res. Public Health 19:8000. doi: 10.3390/ijerph19138000
Marope, M., Griffin, P., and Gallagher, C. (2018). Future competences and the future of curriculum. IBE-UNESCO. Available at: http://www.ibe.unesco.org/sites/default/files/resources/future_competences_and_the_future_of_curriculum.pdf
Ministry of the President, Constitutional Affairs, and Democratic Memory (2007). OrderECI/3960/2007, December 19, which establishes the curriculum and regulates the organization of early childhood education. Spain: State official newsletter.
Ministry of the President, Constitutional Affairs, and Democratic Memory (2020). Organic law 3/2020, of December 29, which modifies organic law 2/2006, of may 3, on education, vol. 340. Spain: State official newsletter, 1–83.
Ministry of the President, Constitutional Affairs, and Democratic Memory (2022). Royal Decree 95/2022. Of February 1. Which establishes the organization and the minimum teachings of early childhood education. Spain: State official newsletter.
Msane, J., Mutanga, B., and Chani, T. (2020). Students’ perception of the effect of cognitive factors in determining success in computer programming: a case study. Int. J. Adv. Comput. Sci. Appl. 11, 185–190. doi: 10.14569/IJACSA.2020.0110724
Mula-Falcón, J., Moya-Roselló, I., and Ruiz-Ariza, A. (2022). The active methodology of gamification to improve motivation and academic performance in educational context: a meta-analysis. Rev. Eur. Stud. 14, 32–46. doi: 10.5539/res.v14n2p32
Muntamer, J. J., Pinya, C., and Mut, B. (2020). El impacto de las metodologías activas en los resultados académicos. Profesorado: Revista de Currículum y Formación del Profesorado 24, 96–114. doi: 10.30827/profesorado.v24i1.8846
Murillo, P. (2007). “Nuevas formas de trabajar en la clase: metodologías activas y colaborativas” in El desarrollo de competencias docentes en la formación del profesorado. ed. S. G. Técnica (Madrid: Ministerio de Educación y Ciencia), 129–154.
Mutale, I., and Malambo, Y. A. (2019). Competency-based curriculum for Zambian primary and secondary schools: learning from theory and some countries around the world. Int. J. Educ. Res. 7, 117–130.
Navas, G., and de Caso Fuertes, A. M. (2017). ¿Existen diferencias Motivacionales en el paso de la Educación Infantil a la Educación Primaria?. J. C. In, M. C. Núñez, M. M. J. J. Pérez-Fuentes, and A. Gázquez, Simón Martos, M. M. (comps.), Temas actuales de investigación en las áreas de Salud y la Educación (pp. 117–124). España: SCINFOPER.
Nguyen, T., Netto, C. L. M., Wilkins, J. F., Bröker, P., Vargas, E. E., Sealfon, C. D., et al. (2021). Insights into students’ experiences and perceptions of remote learning methods: from the COVID-19 pandemic to best practice for the future. Frontiers. Education 6:647986. doi: 10.3389/feduc.2021.647986
Organization for Economic Co-operation and Development (2019). PISA 2018. Technical report. Paris: OCDE Publishing.
Pérez-Poch, A., Sánchez-Carracedo, F., Salán, N., and López, D. (2019). Cooperative learning and embedded active learning methodologies (R) for improving Students' motivation and academic results. Int. J. Eng. Educ. 35, 1851–1858.
Pintrich, P. R. (2000). “The role of goal orientation in self-regulated learning” in Handbook of self-regulation: Theory, research and applications. eds. M. Boekaerts, P. R. Pintrich, and M. Zeidner (Cambridge, MA: Academic Press), 451–450.
Pintrich, P. R., and de Groot, E. V. (1990). Motivational and self-regulated learning components of classroom performance. J. Educ. Psychol. 82, 33–40. doi: 10.1037/0022-0663.82.1.33
Ponce, A., Bravo, E., and Torroba, T. (2000). Los colegios rurales agrupados. primer paso al mundo docente. Contextos Educativos. Revista de Educación 8, 315–347. doi: 10.18172/con.428
Prieto, J. M. (2020). Una revisión sistemática sobre gamificación. motivación y aprendizaje en universitarios. Revista Interuniversitaria 32, 73–99. doi: 10.14201/teri.20625
Rusillo, M. T. C. (2017). Diferencias de género en la motivación académica de los alumnos de Educación Secundaria Obliga. Revista Electrónica de Investigación Psicoeducativa y Psigopedagógica 2, 97–112.
Ryan, R. M., and Deci, E. L. (2020). Intrinsic and extrinsic motivation from a self-determination theory perspective: definitions, theory, practices and future directions. Contemp. Educ. Psychol. 61:101860. doi: 10.1016/j.cedpsych.2020.101860
Shin, M. H. (2018). Effects of project-based learning on students’ motivation and self-efficacy. Engl. Teach. 73, 95–114. doi: 10.15858/engta.73.1.201803.95
Shinde, S. M., and Shinde, M. B. (2022). Effectiveness of cooperative learning techniques in teaching communication skills: ESP Learners’Perspective. J. Teach. Engl. Spec. Acad. Purposes 10, 001–012. doi: 10.22190/JTESAP2201001S
Souza, I., and Bezerra, S. R. (2021). “Remote teaching and learning of software testing using active methodologies in the COVID-19 pandemic context” in 2021 IEEE Frontiers in education conference (Lincoln, NE, USA). 1–9.
Steinmayr, R., Weidinger, A. F., Schwinger, M., and Spinath, B. (2019). The importance of students’ motivation for their academic achievement – replicating and extending previous findings. Front. Psychol. 10:730. doi: 10.3389/fpsyg.2019.01730
Su, J., Yang, W., and Zhong, Y. (2022). Influences of gender and socioeconomic status on Children’s use of robotics in early childhood education: a systematic review. Early Educ. Dev. 1-17, 1–17. doi: 10.1080/10409289.2022.2078617
Swiatczak, M. D. (2021). Towards a neo-configurational theory of intrinsic motivation. Motiv. Emot. 45, 769–789. doi: 10.1007/s11031-021-09906-1
Talib, C. A., Ramin, N., Rajan, S. T., Aliyu, F., Surif, J., Ibrahim, N. H., et al. (2018). Online project-based learning with integration of STEAM in chemistry: Challenges and opportunities to create 21st century skills. AIP Conference Proceedings. AIP Publishing LLC.
United Nations Educational. Scientific and Cultural Organization (2016). Education 2030: Incheon declaration and framework for action for the implementation of sustainable development goal 4: Ensure inclusive and equitable quality education and promote lifelong learning opportunities for all. París: UNESCO.
Villamizar, M. D. L. Á. (2021). Metodologías activas a través del juego y el interés de los niños y niñas de 5 a 6 años en Preescolar. Revista de Educación 2, 566–576. doi: 10.15517/revedu.v45i1.42861
Wolters, C. A., and Pintrich, P. R. (2001). “Contextual differences in student motivation and self-regu-lated learning in mathematics. English and social studies classrooms” in Metacognition in learning and Instructionf: Theory, research and practice. ed. H. J. Hartman (Netherlands: Kluwer Academic Publishers), 103–124.
Ylimaki, R., Moyi, P., Gause, S., Hardie, S., and Tran, H. (2020). Leveraging the perspectives of rural educators to develop realistic job previews for rural teacher recruitment and retention. Rural Educ. 41, 31–46. doi: 10.35608/ruraled.v41i2.866
Zainuddin, A., Abd Rahim, M., Yusof, R., Abd, S., Samad, N. H. M. H., and Rahmat, N. H. (2021). Analyzing postgraduates’ motivation in writing master dissertation. Int. J. Acad. Res. Bus. Soc. Sci. 11, 1199–1220. doi: 10.6007/IJARBSS/v11-i12/11460
Appendix
TABLE A1 Questionnaire items.
Keywords: motivation, methodology, active methodology, learning, pre-school education, quality of education
Citation: Viñuela Y and de Caso Fuertes AM (2023) Improving motivation in pre-school education through the use of project-based learning and cooperative learning. Front. Educ. 7:1094004. doi: 10.3389/feduc.2022.1094004
Edited by:
Milan Kubiatko, J. E. Purkyne University, CzechiaReviewed by:
Otilia Clipa, Ștefan cel Mare University of Suceava, RomaniaVanessa Camilleri, University of Malta, Malta
Copyright © 2023 Viñuela and de Caso Fuertes. This is an open-access article distributed under the terms of the Creative Commons Attribution License (CC BY). The use, distribution or reproduction in other forums is permitted, provided the original author(s) and the copyright owner(s) are credited and that the original publication in this journal is cited, in accordance with accepted academic practice. No use, distribution or reproduction is permitted which does not comply with these terms.
*Correspondence: Ana María de Caso Fuertes,  YW1jYXNmQHVuaWxlb24uZXM=