 Badyi Sai1,2
 Baaziz Mohamed1,3
 Ismail Dergaa3
 Halil İbrahim Ceylan4*
 Noomen Guelmemi5
 Valentina Stefanica6
 Mohamed Jaraya2†
 Muntean Raul-Ioan7*†
 Abderraouf Ben Abderrahman3†
- 1High Institute of Sport and Physical Education of Gafsa, University of Gafsa, Gafsa, Tunisia
- 2High Institute of Sport and Physical Education of Sfax, University of Sfax, Sfax, Tunisia
- 3High Institute of Sport and Physical Education of Ksar Said, University of Manouba, Manouba, Tunisia
- 4Physical Education of Sports Teaching Department, Faculty of Sports Sciences, Ataturk University, Erzurum, Türkiye
- 5High Institute of Sport and Physical Education of Kef, University of Jendouba, El Kef, Tunisia
- 6Department of Physical Education and Sport, Faculty of Sciences, Physical Education and Informatics, National University of Science and Technology Politehnica Bucharest, Pitesti University Center, Pitesti, Romania
- 7Department of Physical Education and Sport, Faculty of Law and Social Sciences, University “1 Decembrie 10 1918” of Alba Iulia, Alba Iulia, Romania
Background: The Teacher Stress Inventory (TSI) is an instrument for assessing the multifaceted stressors experienced by educators. However, its original English format necessitates cultural adaptation to ensure relevance for Arabic-speaking contexts.
Aim: This study aimed to validate the TSI in Arabic for Tunisian teachers, assessing its psychometric properties, including factorial structure, internal reliability, construct validity, and sensitivity.
Methods: We used back-translation to validate the Arabic version of the Teacher Stress Inventory (TSI-A). We collected data from a total of 1,292 teachers aged 45.22 ± 5.99 years. These participants from primary and secondary schools across Tunisia formed an exploratory sample of 544 teachers (52.60% female) to determine the factor structure and a confirmatory sample of 748 teachers (50.50% female) to test validity.
Results: The results from the EFA indicate that the TSI-A scale is aligned well with the theoretical model, demonstrating strong internal consistency across all factors. All 49 items of the TSI-A exhibited excellent reliability, as indicated by McDonald’s omega (0.912), Cronbach’s alpha (0.923), and Gutmann’s lambda-6 (0.954) coefficients, and solid temporal stability (ICC = 0.90, 95% CI = 0.83–0.94) over 2 weeks. Similarly, the CFA fit indices were satisfactory.
Conclusion: This study’s results confirmed the TSI-A’s validity for Tunisian teachers, illustrating its robust reliability and psychometric soundness. The tool is essential for identifying stressors in Tunisia’s educational environment, marked by issues such as overcrowded classrooms and resource constraints. The TSI-A can assist school administrators and policymakers in executing targeted actions to mitigate teacher stress. It establishes a foundation for cross-cultural comparisons among Arabic-speaking countries, enhancing comprehension of educator well-being in the Arab world.
Introduction
Teachers have a vital role in molding the future of societies by providing knowledge to the upcoming generation. Nevertheless, the teaching profession is frequently associated with elevated levels of stress, which can have a substantial effect on both educators and the quality of education they deliver (Haydon et al., 2018; McLean and Connor, 2015; Steiner and Woo, 2021).
Teacher stress has been defined as the experience of unpleasant negative emotions such as anger, frustration, anxiety, depression, and nervousness, resulting from some aspect of work (Kyriacou, 2001). This stress can arise from a range of issues, including workload, student behavior, and employment conditions (Ferguson et al., 2022). Teachers frequently experience additional pressures such as an overwhelming workload, challenging student behaviors, unattainable goals, insufficient compensation, time constraints, overcrowded classrooms, and limited opportunities for career progression (Collie and Mansfield, 2022; Skaalvik and Skaalvik, 2017).
Teachers in high-stress roles face increasing psychological distress underscoring the need for validated assessment instruments (Cao et al., 2023). The Teacher Stress Inventory (TSI), developed by Fimian (1984), is an instrument designed to assess the professional stress of teachers by examining both its sources and manifestations, including behavioral and physiological dimensions, within the framework of the transactional stress model. According to this model, stress occurs when there is a perceived imbalance between the demands placed on an individual and the resources available to cope with these demands effectively (Sapolsky, 2004). The TSI assesses this interaction through 10 subscales, divided into two categories: Sources of Stress and Manifestations of Stress. The Sources of Stress subscales measure aspects such as workload, relationships with students, and administrative expectations, while the Manifestations of Stress subscales examine the behavioral and physiological effects of stress. Each subscale reflects a specific domain of stress perceived by the teacher, and the inventory as a whole captures the complexity of the professional stress experience. The TSI has demonstrated its validity and reliability, and it is widely used to enhance the understanding and management of stress in teachers (Fimian, 1984, 1986).
The TSI’s effectiveness comes from its thorough assessment of several stressors, including workload concerns and interpersonal difficulties seen in educational establishments (Kourmousi et al., 2015). The TSI can contribute to the creation of evidence-based treatments that aim to enhance teacher well-being and job satisfaction by offering a detailed comprehension of these stressors (Kourmousi and Alexopoulos, 2016; Von der Embse et al., 2019).
In an increasingly globalization and culturally diverse educational context, it is important to ensure that evaluation tools like the TSI are adapted for use in different linguistic and cultural settings. Arabic-speaking countries must consider their distinct societal, economic, and educational attributes that influence teachers’ experiences and sources of stress (Chalghaf et al., 2019; Chennoufi et al., 2012; Regaieg et al., 2024).
There is a lack of extensive research on teacher stress in Arabic-speaking nations, and there are only a few reliable tools to measure this significant problem (Chalghaf et al., 2019; Desouky and Allam, 2017; Moussa et al., 2017). Moreover, there is a lack of systematic understanding of how stress is measured, its prevalence globally, what factors lead to stress, and what causes the associated negative outcomes among teachers (Agyapong et al., 2022).
To fill these knowledge gaps, the objective of this study was to validate the Teacher Stress Inventory (TSI) in the Arabic language across Tunisian teachers and to test its psychometric properties, specifically its factorial structure, internal reliability, construct validity, and sensitivity.
Methods and equipment
Population
We obtained cross-sectional data from a sample of 1,292 teachers. The data were collected via the administration of paper-and-pencil questionnaires directly to the participants. This approach facilitated direct, face-to-face interactions, which enhanced the response rates and the completeness of the surveys. The questionnaire survey was conducted between October 16 and November 25, 2023, approximately 1 month after the start of the school year. The research project gathered participants with an average age of 45.22 ± 5.99 years from college and secondary schools in different regions of Tunisia. The sample was split into two groups: an exploratory sample consisting of 544 participants, with 52.60% being female, and a confirmatory sample consisting of 748 participants, with 50.50% being female.
Instrument
An Arabic version of the Teacher Stress Inventory (TSI) was used to assess teachers’ occupational stress. The questionnaire consists of 49 items conceptualized into 10 subscales, grouped into two main categories: Stress Sources and Stress Manifestations. Stress Sources include time management (which evaluates the teacher’s ability to manage time for both professional and personal needs), work-related stressors (including workload associated with teaching or administration, class size, and professional responsibilities), professional distress (stress factors such as income, career development, promotion opportunities, and recognition), discipline and motivation (which determines whether a teacher feels capable of managing the classroom while motivating students), and professional investment (which assesses the teacher’s commitment and beliefs regarding their work). Stress Manifestations include emotional manifestations (teachers’ emotional responses to stress, such as anxiety, frustration, anger, sadness, etc.), fatigue manifestations (teachers’ physical responses to stress, such as sleep disturbances, headaches, fatigue, etc.), cardiovascular manifestations (teachers’ cardiovascular responses to stress, such as elevated blood pressure and increased heart rate), gastrointestinal manifestations (teachers’ gastrointestinal responses to stress, such as stomach pain, loss of appetite, cramps, etc.), and behavioral manifestations (strategies teachers adopt to cope with stress, such as self-medication, use of prescribed medications, alcohol consumption, etc.). Response modalities are measured on a 5-point Likert scale, with five statements ranging from 1 ‘Strongly Disagree’ to 5 ‘Strongly Agree.’ To simplify the response options, a brief description was provided: ‘Strongly Agree’ corresponded to ‘Extremely Perceptible,’ ‘Agree’ corresponded to ‘Very Perceptible,’ ‘Neutral’ corresponded to ‘Moderately Perceptible,’ ‘Disagree’ corresponded to ‘Barely Perceptible,’ and ‘Strongly Disagree’ corresponded to ‘Not Perceptible.’
Measurement
Procedure
To ensure a robust and culturally sensitive translation of Fimian’s (1988) “Teacher Stress Inventory” (TSI) into Arabic. This process was conducted following the guidelines established by Brislin (1970) and the International Test Commission (ITC) (Beaton et al., 2000; Gana et al., 2020). The first step, direct translation, involved two bilingual translators, both native Arabic speakers. The first translator, with a deep understanding of the subjects addressed in the questionnaire, and the second, chosen for their unfamiliarity with the measured concepts, independently translated the tool from English to Arabic, ensuring an objective and balanced translation (Beaton et al., 2000; Gana et al., 2020). Subsequently, in the synthesis phase, a committee consisting of the authors and linguistic experts carefully reviewed the translated versions, identified and corrected discrepancies, and merged the translations into a unified, consensus-based Arabic version, known as the TSI-A questionnaire. The back-translation of the TSI-A questionnaire was carried out by two independent bilingual translators, who were not involved in the initial translation process. They transcribed the Arabic version into English without referring to the original text. This step allowed for a comparison between the translated version and the original English version to ensure equivalence of meaning and intent, while maintaining clarity and fidelity of the items, and avoiding any informational bias. A panel of five experts, all holding doctorates and proficient in both Arabic and English, with expertise in psychology and education, then conducted a thorough review of all versions (original, translated, and back-translated). Based on their consensus, the experimental version of the questionnaire was developed to ensure intercultural consistency between the original and final versions. A pre-test phase followed, involving 16 Arabic-speaking teachers aged 28–60, who completed the questionnaires and participated in cognitive interviews to assess their understanding of the items and selected responses. Feedback from this phase led to minor adjustments. Finally, cognitive interviews, conducted face-to-face in Arabic with two sets of eight participants, allowed for further refinement of the questionnaire items, with modifications made after each interview series to enhance clarity and understanding.
A total of 1,292 questionnaires were distributed, and administered by a team of 15 trained data collectors, who were deployed across various primary and secondary schools in Tunisia: 473 teachers were surveyed in the northern region, 445 in the central region, and 374 in the southern region. The teachers, contacted at their respective workplaces, were invited to complete a paper questionnaire, which was fully explained to them. Participants provided information on their gender, teaching experience, age, daily teaching load, student level (middle or high school), student category (non-disabled or disabled), highest degree obtained (bachelor’s, master’s, or doctorate), as well as the availability of support from colleagues and supervisors. Before data collection, all team members underwent specialized online training via Zoom, spread over 3 days, aimed at ensuring standardized administration of the questionnaire. These sessions included instructions on managing responses, verifying data accuracy, addressing ethical considerations, and effective communication with teachers, along with simulation exercises designed to replicate data collection scenarios, followed by a pilot test to refine the data collectors’ approach. The questionnaire was distributed traditionally, using paper and pen. Regular supervision and quality checks were conducted throughout the data collection period to ensure the accuracy of the data and its compliance with the study’s guidelines. Thanks to this systematic and collaborative approach, data collection was completed in 40 days.
All participants provided informed consent to participate in the study, which was conducted by the principles of anonymity and confidentiality. The data collection process was conducted following the ethical standards outlined in the Declaration of Helsinki and its subsequent amendments. Before the commencement of data collection, ethical approval was obtained from the Ethics Committee at the National Center of Medicine and Sports Sciences of Tunisia. The questionnaire was administered in a traditional pen-and-paper format. Before the administration of the questionnaires, the participants were provided with a comprehensive overview of the study’s primary objective and its specific aims. They were then asked to provide written informed consent.
Statistical analysis
The normality of the data was demonstrated by skewness values ranging from −0.249 to 0.723 and kurtosis values ranging from −1.116 to −0.279 (see Table 1). Skewness values in the range of +2 to −2 are considered acceptable for a normal distribution (Elliott and Woodward, 2007; Tabachnick and Fidell, 2013), indicating that the data distribution is normal.
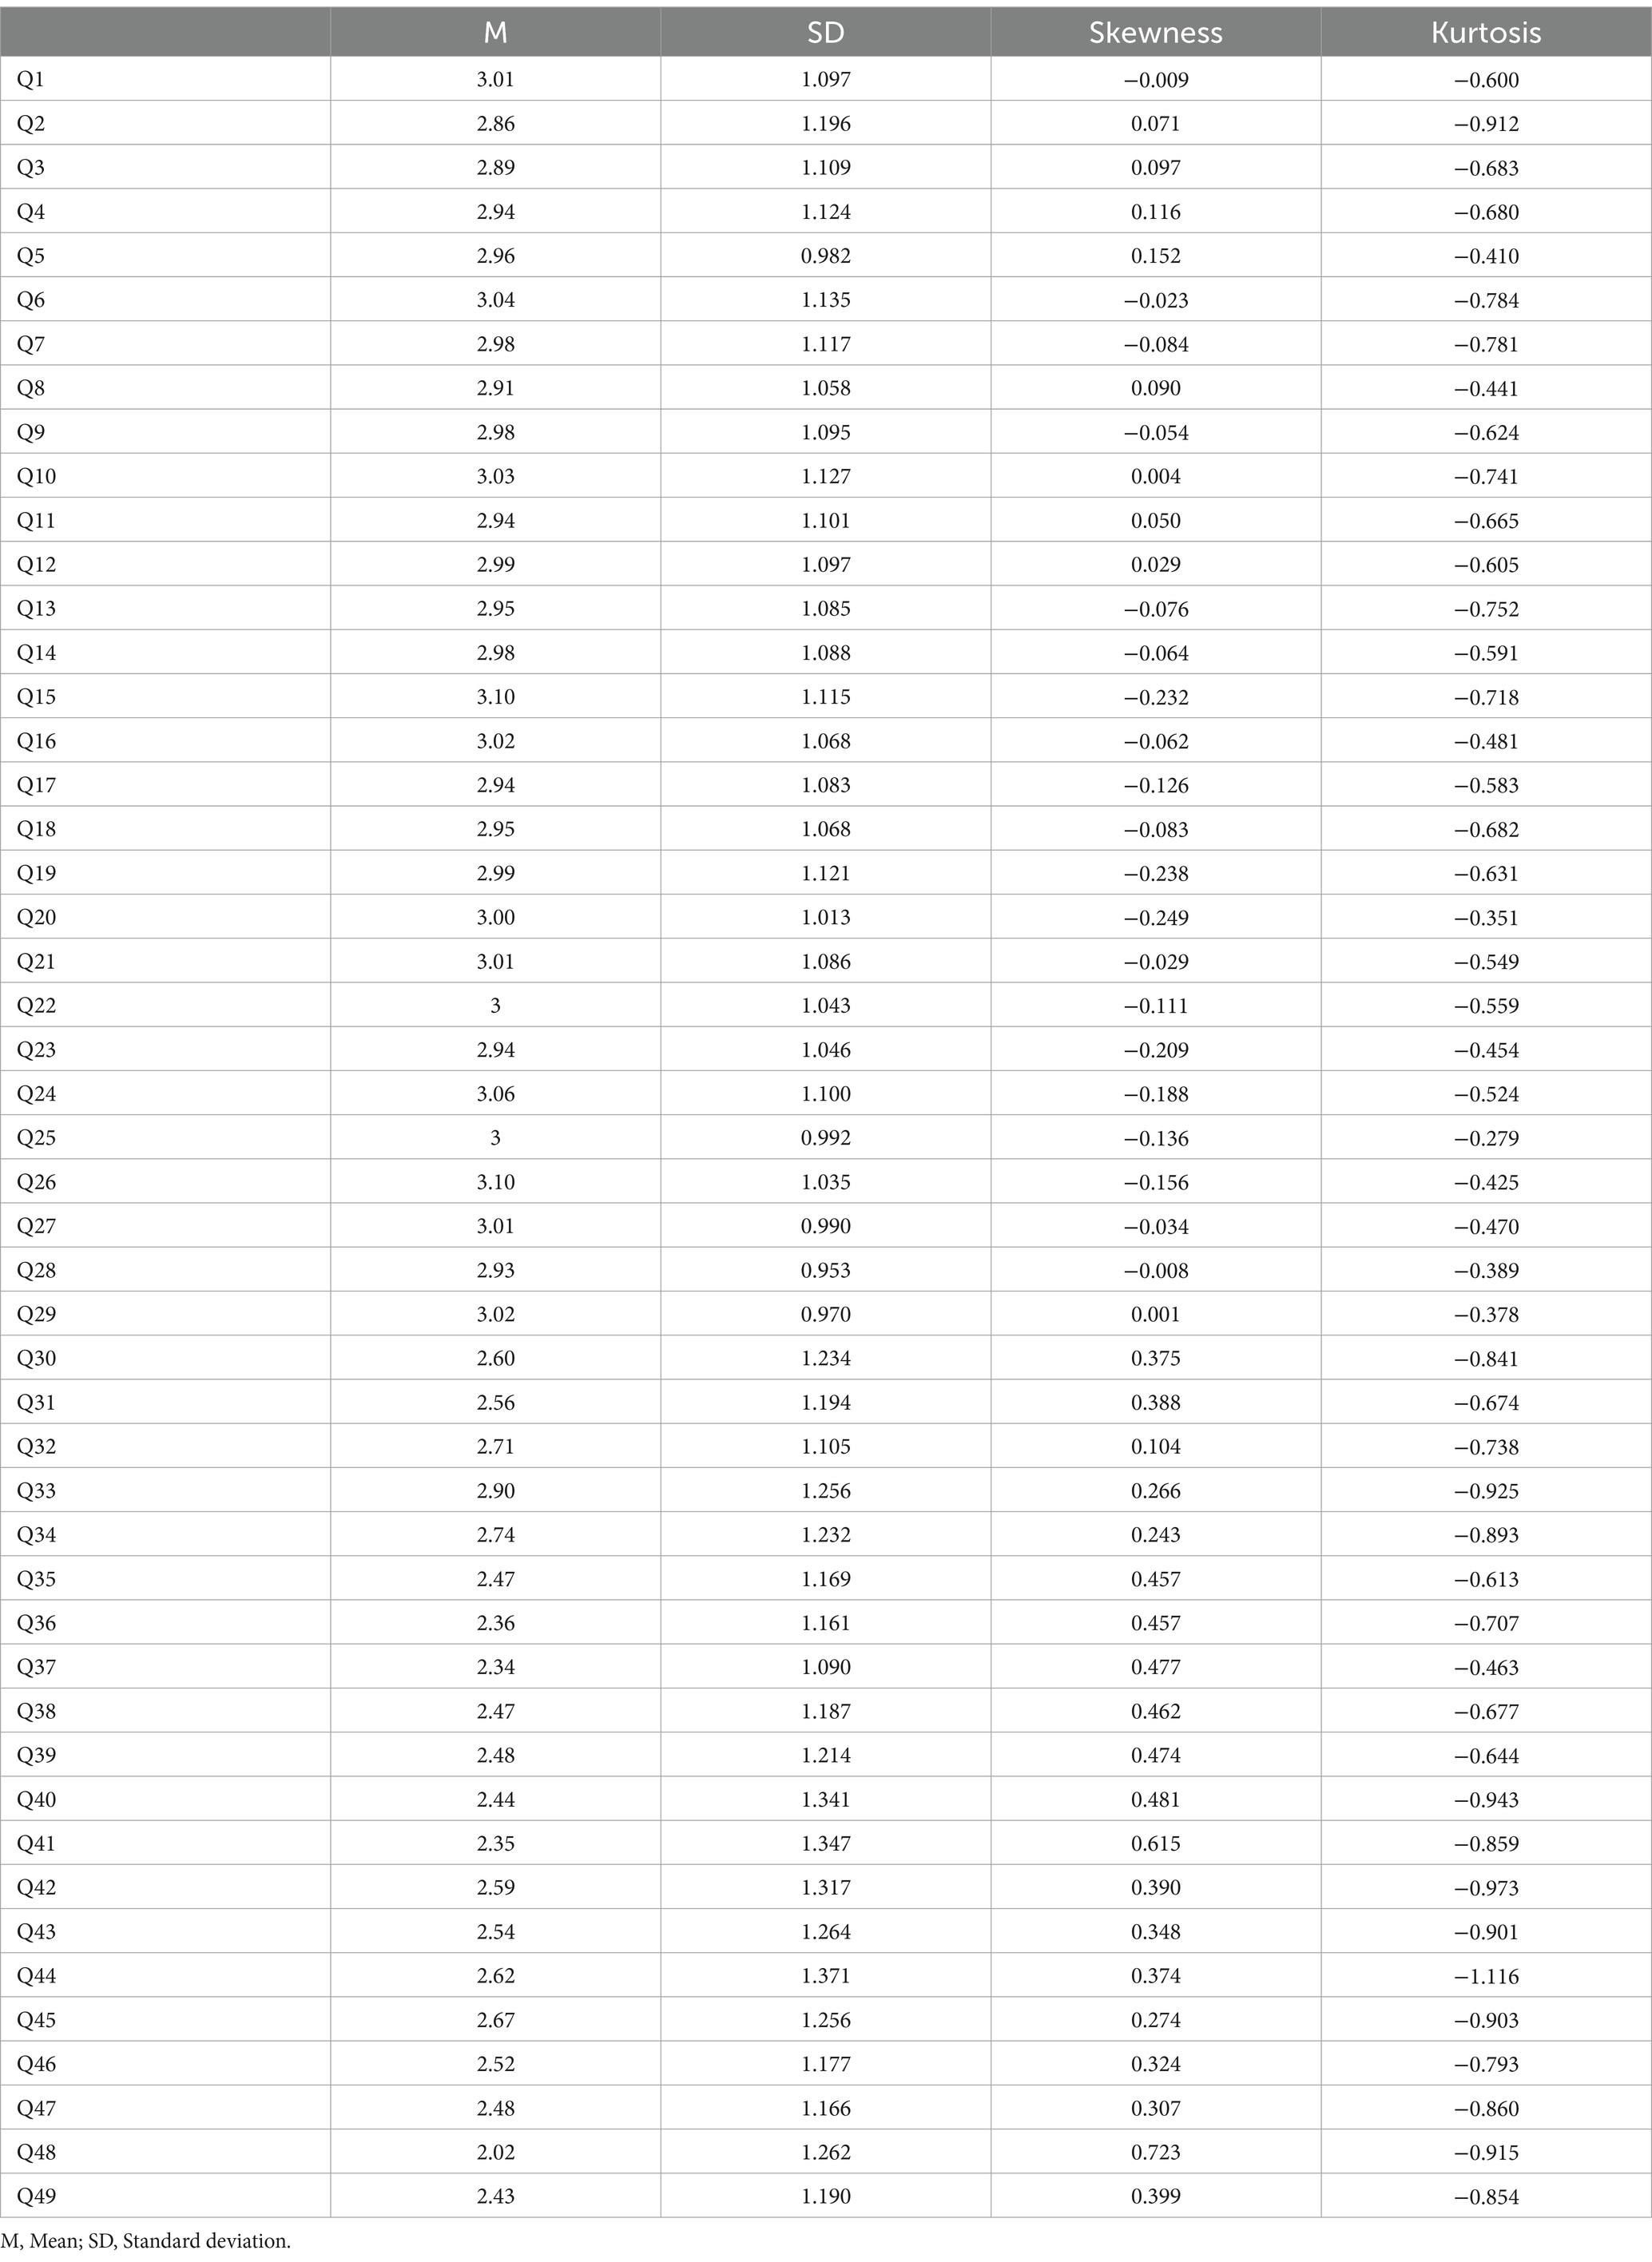
Table 1. Descriptive statistics and normality of the 49-Item TSI-A (N = 544).
To examine the factor structure of the scale, we conducted an orthogonal varimax exploratory factor analysis (EFA) using Kaiser’s varimax criterion with principal component analysis (PCA) on our 49-item scale (Everitt and Dunn, 1991; Kaiser, 1958; Rummel, 1988; Bollen, 2014). Items were retained if their factor loadings were 0.40 or greater (Pett et al., 2003). Sampling adequacy was assessed using the Kaiser-Meyer-Olkin (KMO) test and Bartlett’s sphericity test (Bartlett, 1950). A KMO value greater than 0.6 and a significant p-value for Bartlett’s test is recommended (Worthington and Whittaker, 2006).
A first-order confirmatory factor analysis (CFA) with maximum likelihood estimation was conducted to verify the factor structure across ten dimensions of the TSI-49. Several indices were analyzed to assess the fit of the model to the collected data. We used the goodness of fit index (GFI) (Hooper et al., 2008; Bollen, 2014; Marsh et al., 1988; Schermelleh-Engel et al., 2003) and its adjusted index (AGFI), both of which should be 0.90 and higher for a good fit (Muenjohn and Armstrong, 2008). In addition, the root mean square error of approximation (RMSEA) should be ≤0.05 for a good fit (MacCallum et al., 1996). The standardized root mean square residual (SRMR) should be ≤0.10 for an acceptable fit (Hu and Bentler, 1999). We also checked the comparative fit index (CFI) (Watchravesringkan et al., 2008), the non-normed fit index (NNFI), the normed fit index (NFI), the parsimony comparative fit index (PCFI), and the parsimony NFI (PNFI). Values for CFI, NFI, TLI, PCFI, and PNFI should be ≥0.95, and NFI should be ≥0.90 (Schermelleh-Engel et al., 2003). A significant χ2 value compared to the degrees of freedom indicates that the proposed model does not fit the observed data well, while a non-significant χ2 value indicates that the model fits adequately (Satorra and Bentler, 1994). The ratio of χ2 to degrees of freedom (χ2/df) was used to compare model fit indices. A ratio of χ2/df < 3 indicates an acceptable model fit (De Carvalho and Chima, 2014). However, chi-square (χ2) is affected by sample size and model complexity, with more complex models being more sensitive to χ2 (Kelloway, 1995).
In addition, a sensitivity analysis (ANOVA) was conducted to assess the effect of age, gender, and teaching experience on the scores of each dimension of the instrument.
An exploratory factor analysis (EFA) was conducted on a random sample of 544 participants, while a confirmatory factor analysis (CFA) was performed on a sample of 748 participants. EFA was conducted using the Statistical Package for Social Sciences (SPSS, version 28, IBM, Armonk, NY, USA) and JASP software (version 0.18.3.0), while CFA was analyzed using AMOS software (version 28, IBM, Armonk, NY, USA).
Results
Instrument quality
Table 2 presents the key characteristics of the sample population.
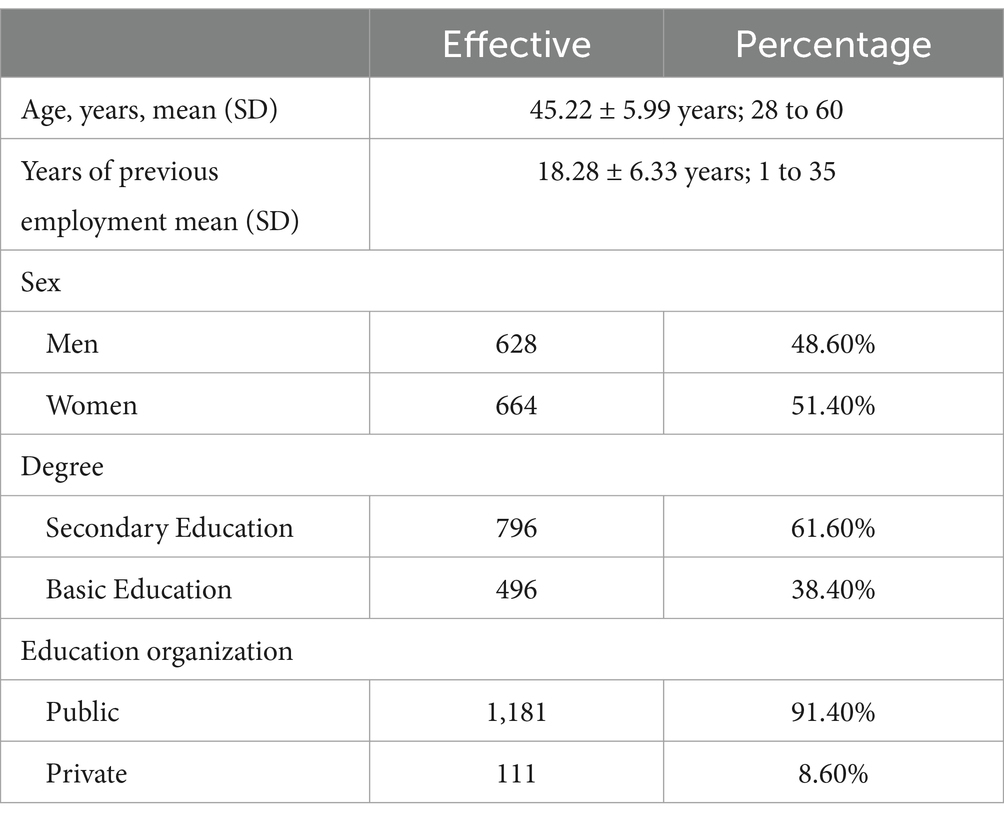
Table 2. Basic characteristics of the sample population (N = 1,292).
Table 1 displays the means, standard deviations, kurtosis, and skewness for the TSI-A items. The data were normally distributed regarding skewness and kurtosis.
The data demonstrated a normal distribution in terms of skewness and kurtosis. Furthermore, the results indicated that the TSI scale demonstrated robust temporal stability (r = 0.91 at p < 0.001; ICC = 0.90) (Table 3 and Figure 1).
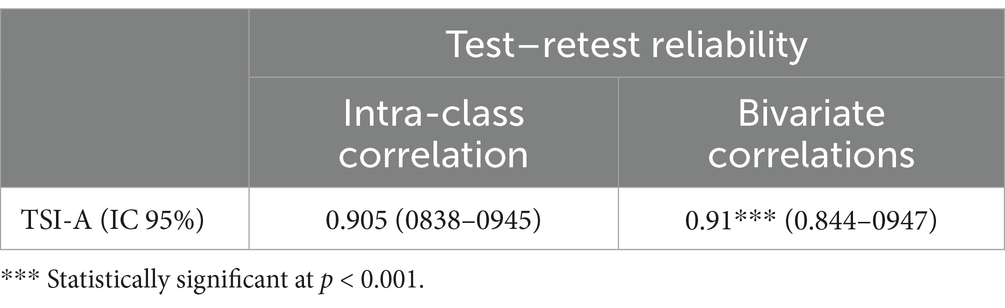
Table 3. Test–retest reliability of the TSI-A (n = 50).
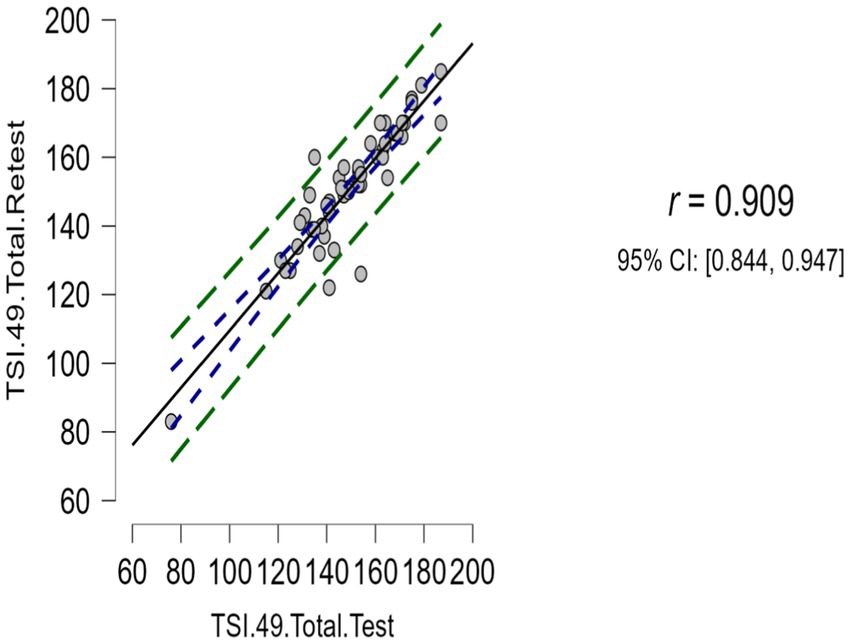
Figure 1. The relationship between the TSI-A scores reported at time 1 and time 2.
The principal component analysis of the TSI version yielded a 10-factor solution, indicating that the 49 items of the scale can be aggregated to generate scores for these indices. Ten factors exhibited eigenvalues greater than one. The scree plot indicated a distinct point of inflection after the first factor (Figure 2). The initial eigenvalues for the 10 factors ranged from 1.15 (Time Management) to 10.68 (Behaviors Manifestations). The first 10 factors accounted for more than 62.37% of the total variance. In light of the eigenvalue and the proportion of variance accounted for, the 10-factor solution was deemed optimal for the subsequent analysis. The loadings of the 49 items on the 10 factors were substantial (Table 4).
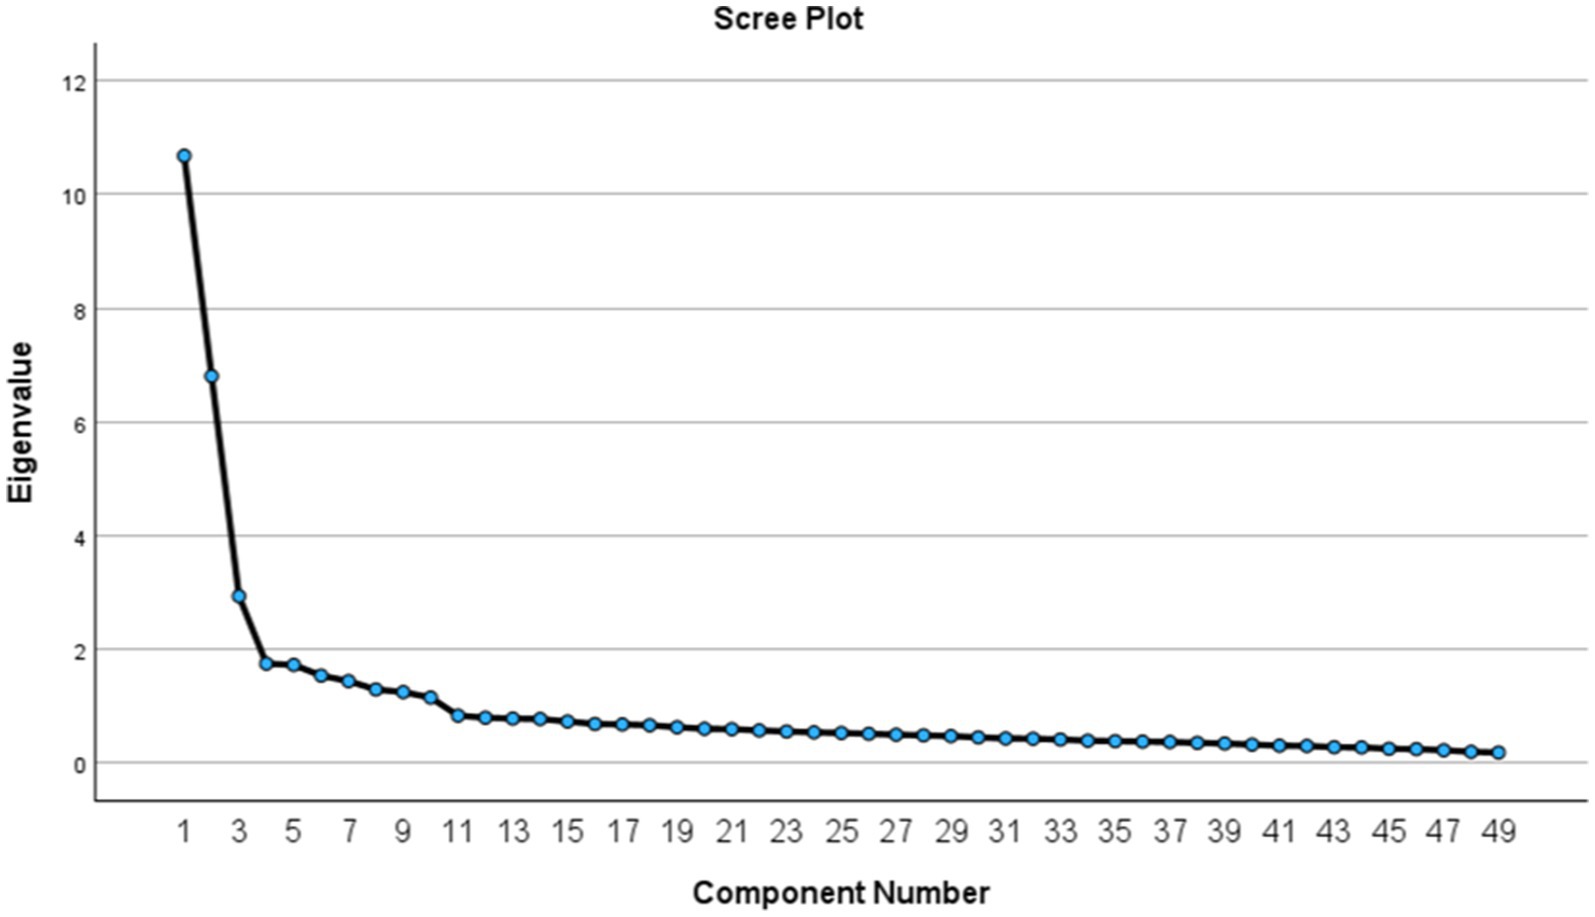
Figure 2. Scree plots of eigenvalues in factor analyses of the TSI-A.
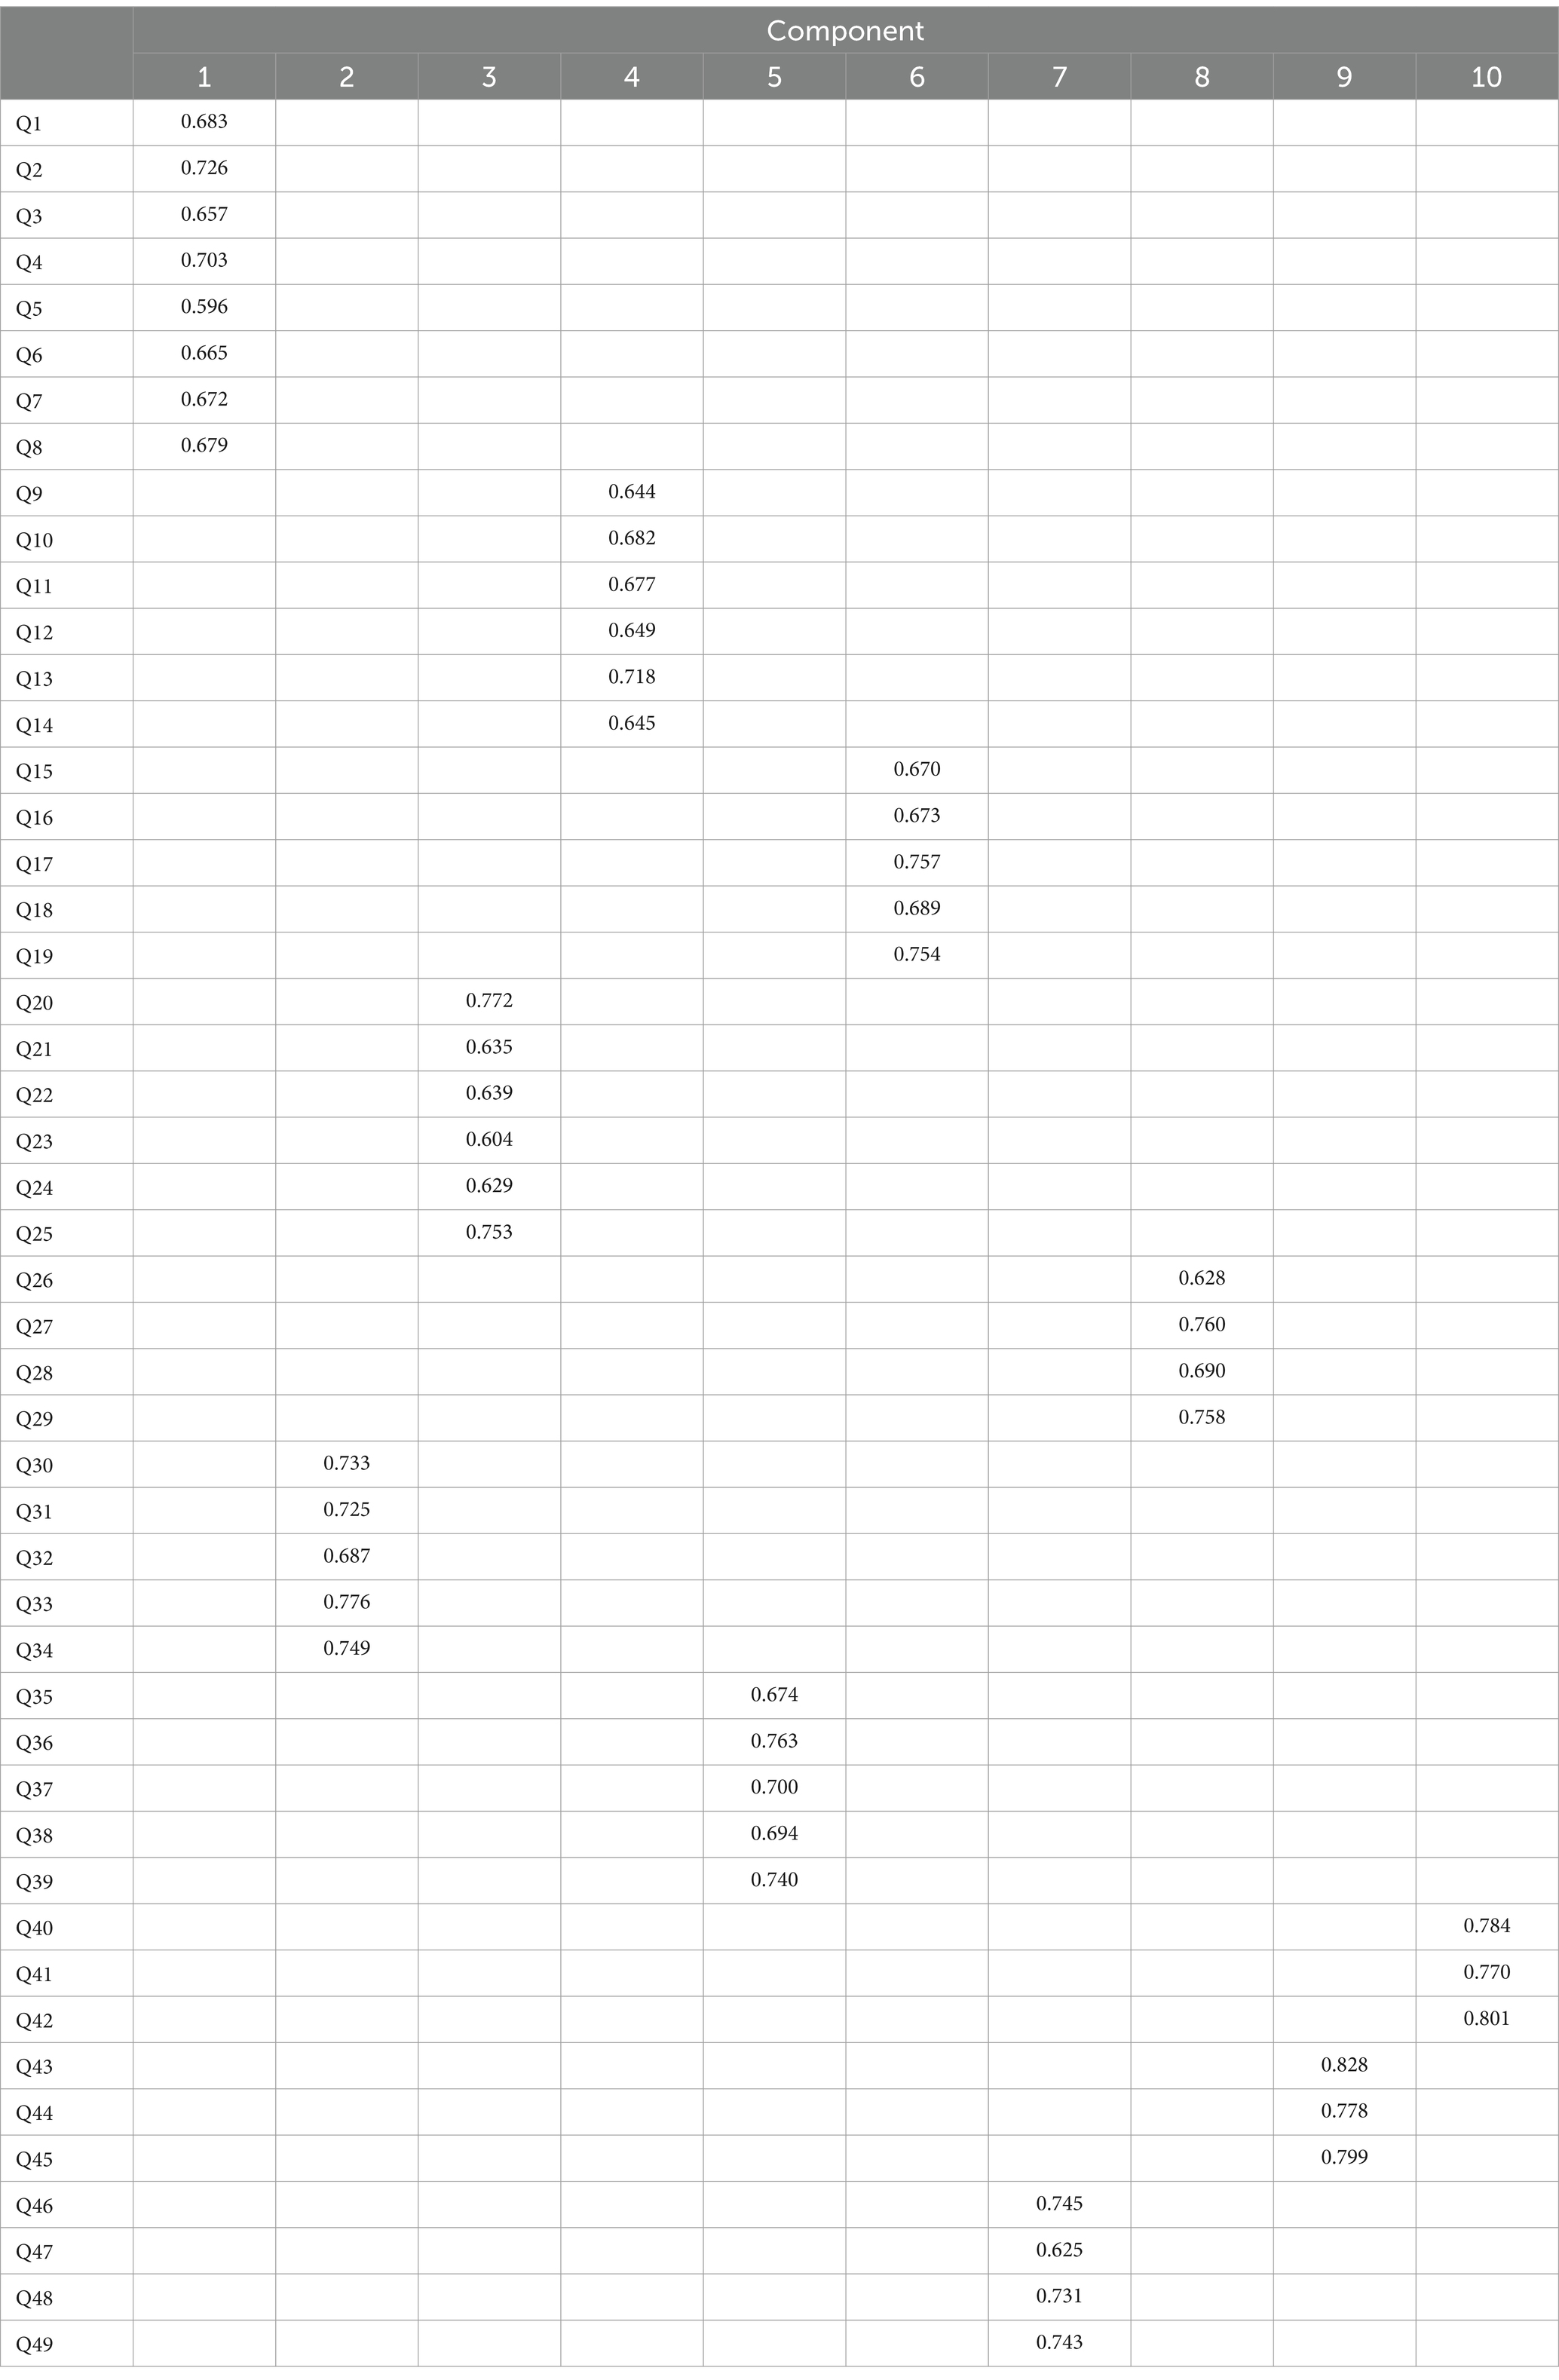
Table 4. Standardized solutions for factor loadings for the scale TSI-A (N = 544).
In conclusion, based on the screen plot, it is appropriate to consider the first 10 principal components for further analysis, as they capture most of the variance in the data. Subsequent components contribute little additional information, as indicated by the leveling off the curve after the tenth component.
Exploratory factor analysis
The EFA results indicated that the TSI-A showed a high degree of alignment with the expected theoretical model and demonstrated good overall internal reliability. The internal consistency of the Arabic version of the scale was evaluated using McDonald’s omega, Cronbach’s alpha, and Guttman’s λ6 values, which demonstrated strong reliability (ω TSI-A = 0.912; α TSI-A = 0.923; λ6 TSI-A = 0.954). McDonald’s omega is regarded as a more robust measure of internal reliability for the scale (Béland et al., 2017), as illustrated in Table 5. A number of statisticians (Béland et al., 2017; Cortina, 1993; Field, 2013; Kline, 2016; Taber, 2017; Taber, 2018; Vaske, 2008) have proposed that reliability coefficients above 0.60 are acceptable. Consequently, the majority of parameters demonstrated significantly high correlations with excellent values (see Table 5).

Table 5. Reliability coefficients of the scale TSI-A (N = 544).
The results of the factor analysis (KMO = 0.910, Bartlett’s test of sphericity p < 0.001) supported the factor analysis and identified 10 independent main factors with values above the thresholds set by Schönbrodt and Perugini (2013), Cattell (1966) and Staw (1980). These factors accounted for 62.37% of the variance in the data. The initial principal component “Time Management” explained 21.80% of the total variance (eigenvalue = 10.68), while “Behaviors Manifestations” accounted for 62.37% (eigenvalue = 1.15). Following the recommendations set forth by Horn (1965), all dimensions with eigenvalues exceeding 1 were taken into consideration.
Concerning the EFA, the factor loadings of the 10-factor model items exhibited a range from 0.596 to 0.828, as illustrated in Table 4.
Confirmatory factor analysis
The CFA employed a range of model fit indices, by the criteria established by various researchers. Following the established critical standards, the optimal standardized Chi-Square value with the number of degrees of freedom (χ2/df) is within the range of 2 to 3 (2 ≤ χ2/df ≤ 3). This conclusion is supported by the findings of Wheaton et al. (1977) and Tabachnick and Fidell (2013). The results of the Chi-Square and normalized χ2 (χ2/df) statistics indicated that the model fit was satisfactory.
A variety of fit indices were calculated, including the AGFI, GFI, CFI, NNFI (TLI), NFI, PNFI, PCFI, RMSEA, and SRMR. The critical values for NFI, CFI, and NNFI (TLI) should exceed 0.95, by the recommendations of Bryant and Yarnold (1995), Hu and Bentler (1999), Fan (1998), and Byrne (2014). Nevertheless, for the present scale, the AGFI and GFI values indicate 0.90, which some researchers, such as Schermelleh-Engel et al. (2003), consider to be acceptable. Furthermore, the PNFI and PCFI values exceeded the acceptable threshold of 0.50 (PNFI = 0.86; PCFI = 0.90). As indicated by Byrne (2001), the RMSEA and SRMR values should not exceed 0.05.
Overall, the 49-item model demonstrated an excellent fit to the theoretical model across all tested indices, thereby supporting the factor structure for the Tunisian teacher sample. The confirmatory factor analysis yielded a good fit for the 10-factor Arabic version of the TSI-A model (χ2 = 2059.607, degrees of freedom = 1,112, p < 0.001; NFI = 0.391; CFI = TLI = IFI = 0.95; GFI = AGFI = 0.90; SRMR = 0.04; RMSEA = 0.03, 90% CI = 0.031–0.036). All of the hypothesized parameters of this model were found to be statistically significant at the p < 0.05 level.
Additionally, CFA was used to assess whether the number of factors and variables observed were consistent with the theory initially proposed. The latent variable “sources of stress” was associated with the following dimensions: time management, work-related stressors, professional distress, discipline and motivation, and professional investment. In parallel, the latent variable “Stress Manifestations” grouped emotional manifestations, fatigue manifestations, cardiovascular manifestations, and gastronomic and behavioral manifestations. To validate this structure, one- and two-factor models were tested. The two-factor model, named Model 2, obtained the best fit, confirming its relevance. This optimal fit to the theoretical model validates the two-factor structure of the IST model in the Arabic-speaking context (see Table 6 and Figure 3).
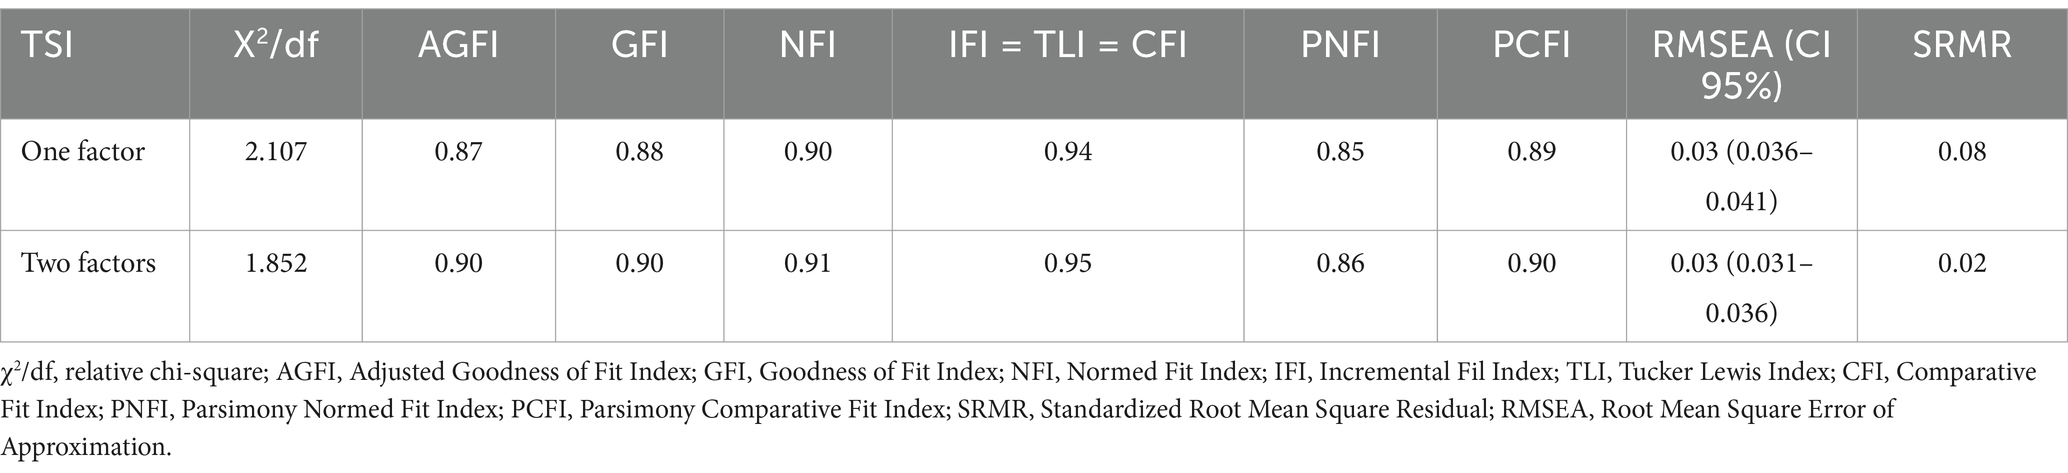
Table 6. Summary of fit indices for the TSI-A confirmatory factor analysis models (N = 748).
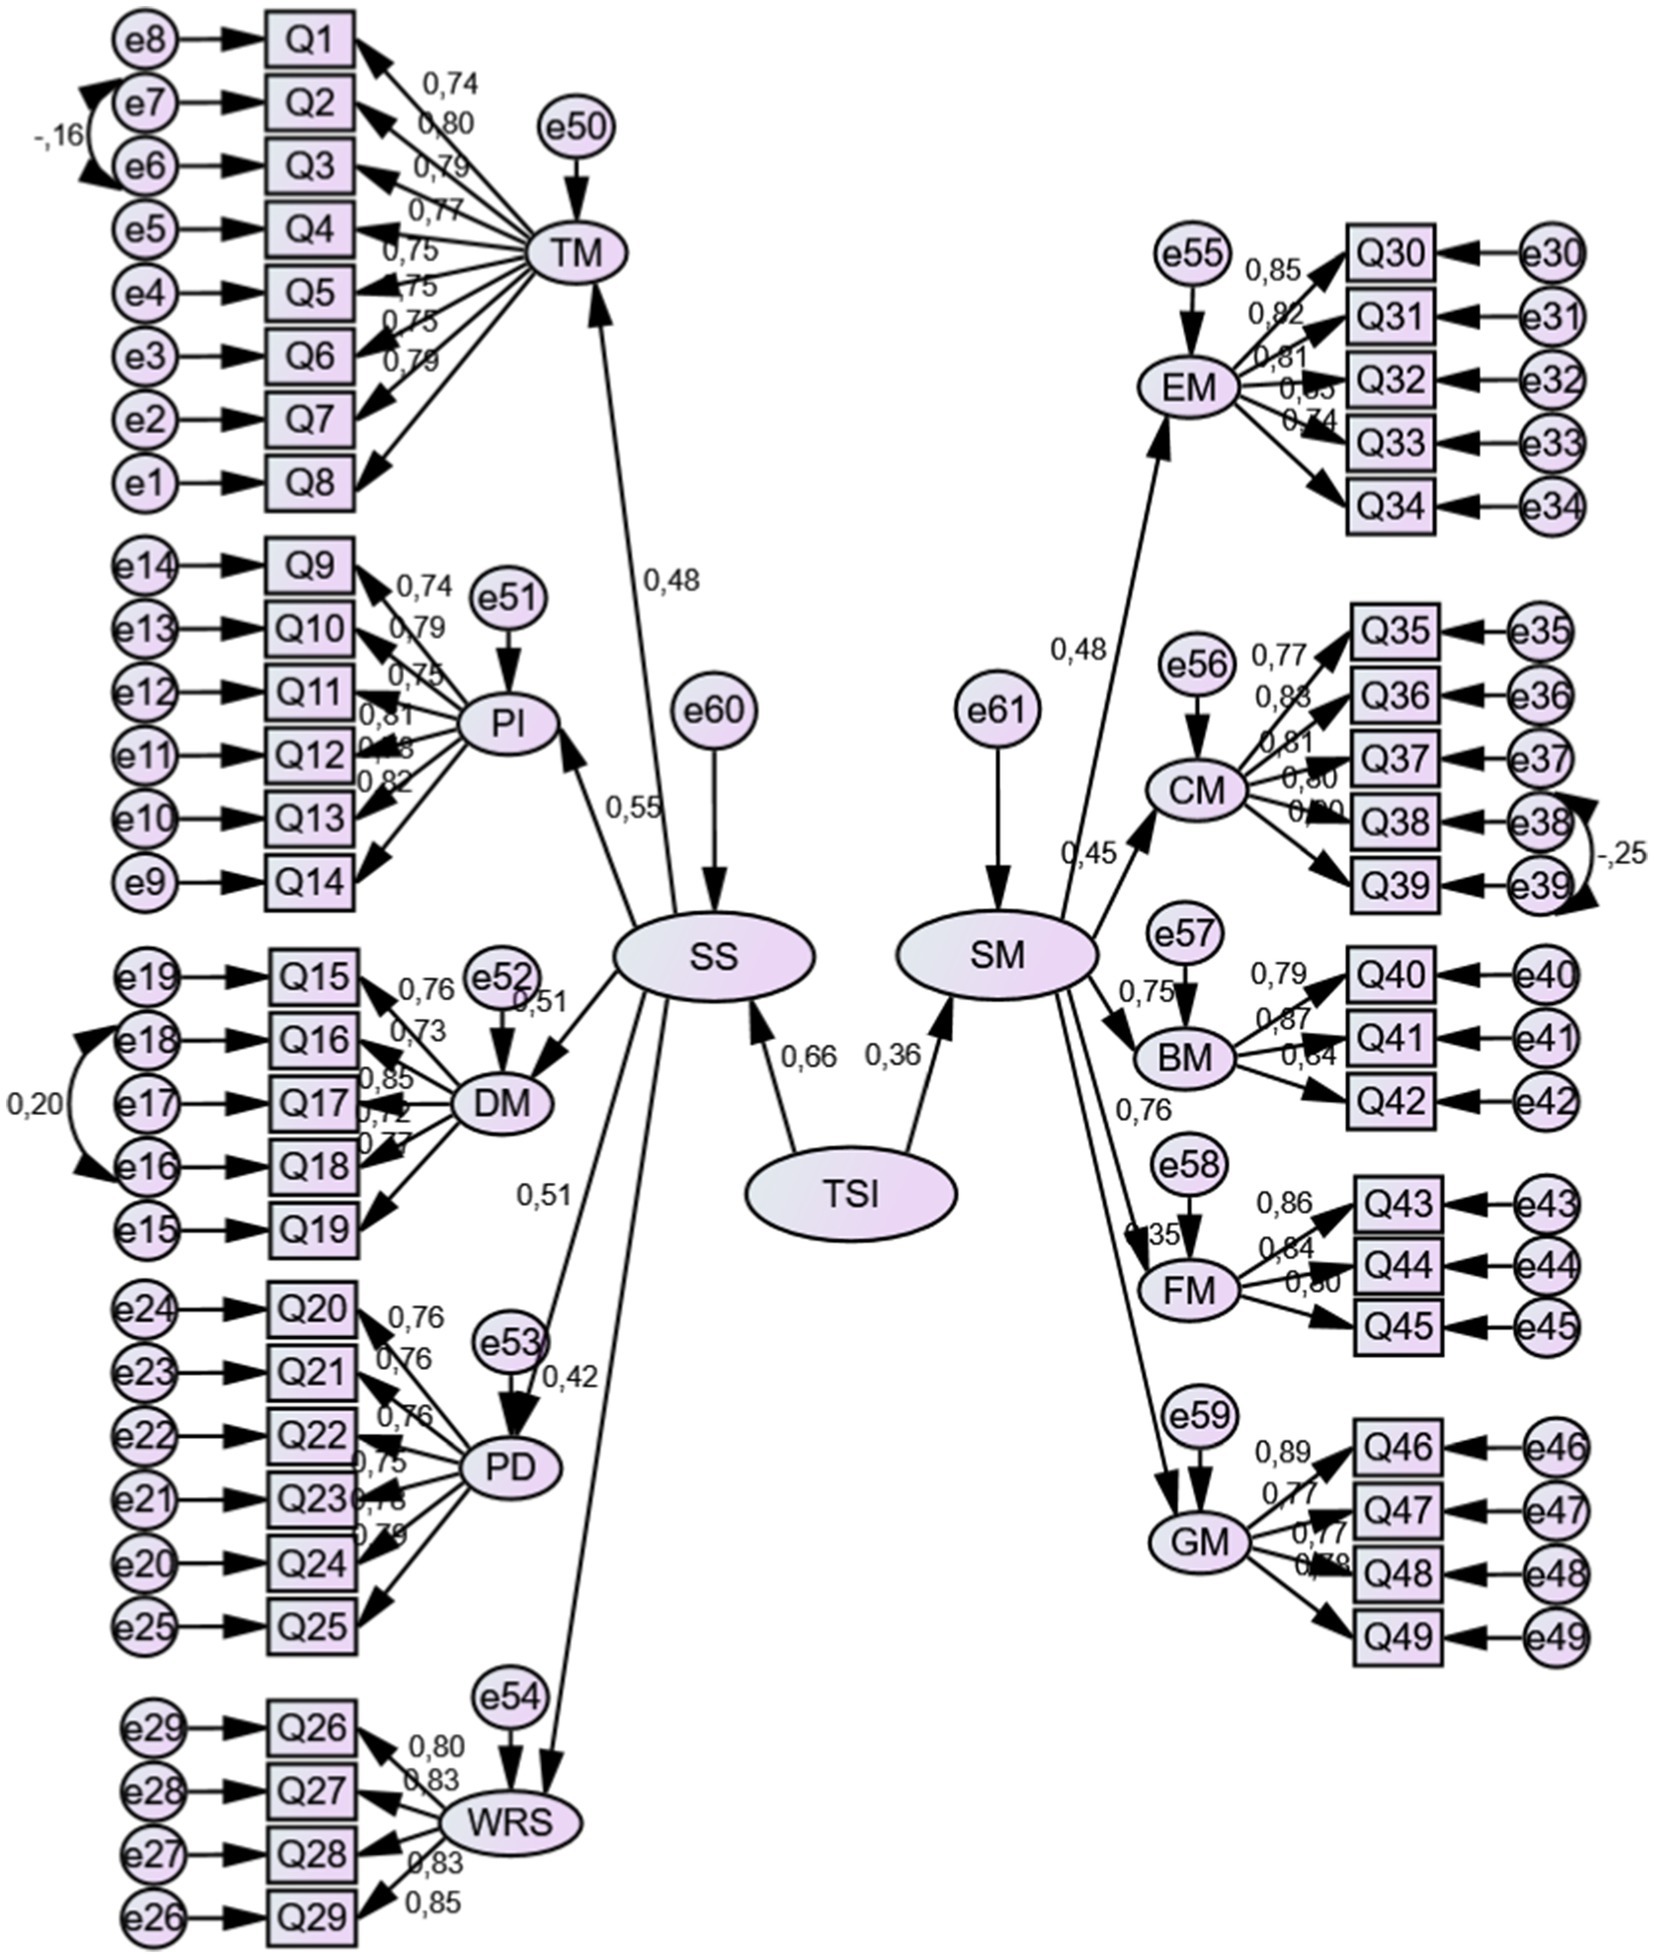
Figure 3. Standardized results of the confirmatory factor analysis (CFA) of the Arabic version of TSI-A (N = 748).
The ANOVA results, along with the sensitivity analysis, reveal no significant effect between the different dimensions of the scale and the various factors.
To assess convergent validity, we examined the magnitude and significance of the loadings of the first-order factors onto the second-order factor. The standardized factor loadings for the first-order factors ranged from 0.768 to 0.836 (p < 0.001), indicating moderate to strong relationships between individual items (I1- I49) and their corresponding latent constructs. These loadings suggest that the items effectively capture the essence of their respective constructs.
At the second-order level, each of the first-order factors demonstrated significant standardized loadings onto the overall construct, with loadings ranging from 0.768 for discipline and motivation to 0.836 for cardiovascular manifestations (all p < 0.001). Cardiovascular manifestations emerged as the strongest contributor to the second-order construct, while discipline and motivation, although weaker, still exerted a notable influence. This confirms the multidimensional nature of the model and highlights the interrelatedness of its components.
Similarly, the fit indices support the convergent validity of the second-order factor model. Both the CFI and TLI are equal to 0.95, indicating an excellent fit between the model and the observed data. The RMSEA is 0.03, with a 90% CI = 0.031–0.036, providing further evidence that the model fits the data well. Additionally, the SRMR value of 0.04 reflects a good model fit. These fit indices confirm that the first-order factors are appropriately modeled as indicators of the second-order factor.
Results for discriminant validity showed that AVE values ranged from 0.588 for time management to 0.698 for cardiovascular manifestations. The square root of the AVE values, reported along the diagonal, were as follows: 0.767 for time management, 0.782 for work-related stress factors, 0.774 for professional distress, 0.768 for discipline and motivation, 0.829 for professional investment, 0.800 for emotional manifestations, 0.802 for fatigue manifestations, 0.836 for cardiovascular manifestations, 0.832 for gastronomical manifestations, and 0.791 for behaviors manifestations. Comparing each AVE square root with the correlation coefficients between the constructs showed that the AVE square roots were higher, thus demonstrating good discriminant validity. These findings confirm that the factors evaluated in this model are consistent with their items (good convergent validity) and distinct from each other (good discriminant validity).
Discussion
The primary objective of this study was to translate and validate an Arabic version of the Teacher Stress Inventory (TSI-A) specifically designed for Arabic-speaking educational environments.
The findings of our study confirm the validity and reliability of the TSI-A, highlighting its potential as a valuable tool for assessing teacher stress in Arabic-speaking countries. The 49-item scale underwent exploratory factor analysis (EFA), which validated a 10-factor structure, consistent with previous research on teacher stress by Fimian and Fastenau (1990) and Kourmousi et al. (2015). However, analyzing the Nigerian version of the IST required the modification of nine questions (Lasebikan, 2016). The authors attribute these modifications to specific cultural factors. The EFA also indicated that no items needed to be removed from the Arabic version of the scale. Confirmatory factor analysis (CFA) further validated the robustness of the instrument’s second-order structure, with excellent fit indices: NFI = 0.91, CFI = TLI = IFI = 0.95, PNFI = 0.85, PCFI = 0.89, GFI = AGFI = 0.90, SRMR = 0.04 and RMSEA = 0.03 (90% CI = 0.031–0.036). However, the CFA also identified some error correlations, specifically between e6 and e7, e16 and e18, and e38 and e39. This can be attributed to how the items were formulated, and more significantly, to the extent of their overlap in content. These factors include time management, work-related stress factors, professional distress, discipline and motivation, professional investment, emotional manifestations, fatigue manifestations, cardiovascular manifestations, gastronomical manifestations, and behavioral manifestations. This structure demonstrates that teacher stress in Arabic-speaking environments shares similar characteristics with those identified in other cultural settings. The consistent factor structure across different cultures serves as a basis for making cross-cultural comparisons and highlights the universal character of specific stressors in the teaching profession. The TSI-A demonstrated strong alignment with the proposed theoretical model, exhibiting good internal consistency across all dimensions. It showcased robust psychometric properties, with high reliability indicated by McDonald’s omega (0.912), Cronbach’s α (0.923), and Gutmann’s λ6 (0.954). Additionally, the scale exhibited remarkable temporal stability, evidenced by an ICC of 0.905 and a correlation of r = 0.909 (p < 0.001). The reported values in assessments of the original TSI and its adaptations in other languages are similar to these values (Fimian, 1988; Hanif and Pervez, 2003; Kourmousi et al., 2015; Mallen et al., 2022). The high internal consistency suggests that the TSI-A reliably evaluates teacher stress throughout its different components. The results demonstrate that the TSI-A provides consistent evaluations of teacher stress over an extended period, which is an essential feature for its application in longitudinal research and intervention studies.
Convergent validity was confirmed with significant standardized factor loadings for first-order factors, as noted by Hair (2010). At the second-order level, all factors also showed strong loadings, with cardiovascular manifestations being the most significant. These results reaffirm the multidimensional structure of the model and the interrelated nature of its components (Cheung et al., 2024). The moderate strength of these relationships indicates that stress is linked to a variety of interconnected factors, reflecting multidimensional complexity. Furthermore, concurrent validity was confirmed by significant correlations with other measures of perceived stress, as well as links with indicators of distress and well-being (Kourmousi et al., 2015; Mallen et al., 2022). This suggests that the sources of stress among teachers are diverse and that the components of the model remain consistent across different educational contexts. Understanding this differentiation is essential for creating precise interventions that target certain dimensions of teacher well-being. The results of our study on gender variations in stress levels are consistent with prior research conducted by Katsantonis (2020) and Antoniou et al. (2006), but contradict the findings of Klassen and Chiu (2010). The heterogeneity of teacher stress underscores the intricate nature of this phenomenon and the potential impact of cultural influences on how it is expressed. The inconclusive findings highlight the necessity for additional research on the interplay of gender, cultural, and contextual elements in influencing teacher stress in Arabic-speaking educational institutions. This research has the potential to contribute to the creation of stress management programs and policies that are sensitive to gender differences. This work provides an important foundation for the future use of the TSI-A in assessing the sources and manifestations of stress among Arabic-speaking teachers. The introduction of the TSI-A will enhance the precision of evaluating teacher stress in Arabic-speaking educational environments, hence permitting cross-cultural comparisons and the creation of focused treatments. This tool has the potential to stimulate and promote more study on teacher stress in Arabic-speaking nations. Taking the whole stress process into account, using more appropriate measures of stress and addressing potential moderators of stress could contribute to a more holistic understanding of the distinct difficulties faced by educators in these particular contexts (von Haaren-Mack et al., 2020). The TSI-A has practical consequences for individuals involved in education. School administrators can utilize it to pinpoint stressors impacting their teaching staff, facilitating the creation of supportive work environments and focused professional development programs. Policymakers can employ TSI-A data to inform evidence-based decisions about educational reforms and the allocation of resources. The TSI-A can function as a self-reflection tool for teachers, enabling them to identify their stress tendencies and seek suitable support.
Limitations
Despite the promising results, it is important to recognize the main limitation of the present study. The investigation was limited to Tunisian instructors, which might have limited the applicability of the results to other Arabic-speaking nations. Tunisia exhibits numerous cultural and linguistic similarities with other Arabic-speaking countries; however, it also displays distinct variations in dialects, educational systems, and cultural subtleties throughout the Arab world. These variations have the potential to affect how teachers perceive and react to stress-related elements in the TSI-A. Future research should prioritize the validation of the TSI-A with educators from diverse Arabic-speaking nations to verify its appropriateness and efficacy across different Arabic dialects and educational contexts within the broader Arabic-speaking world.
Conclusion
Finally, this research created and verified the Arabic edition of the TSI, providing a dependable and culturally suitable instrument for evaluating teacher stress in Arabic-speaking educational environments. The TSI-A demonstrates robust psychometric qualities, characterized by a consistent factor structure, high internal consistency, and reliable test–retest results. These findings have significant implications for schooling in nations where Arabic is spoken. The TSI-A can be utilized by school administrators to ascertain the stress levels of their teaching staff and establish support solutions. Policymakers can utilize TSI-A data to enhance decision-making about workload management and resource allocation. The tool also facilitates cross-cultural study on teacher stress, so enhancing our comprehension of teacher well-being on a global scale. Moreover, the TSI-A can provide guidance for the implementation of professional development programs, shape teacher training curricula, and facilitate the establishment of workplace wellness initiatives. Although acknowledging the study’s limitations, the TSI-A suggests advancements in comprehending and tackling teacher stress in Arabic-speaking nations, potentially enhancing teacher welfare and educational achievements.
Data availability statement
The original contributions presented in the study are included in the article/Supplementary material, further inquiries can be directed to the corresponding authors.
Ethics statement
The studies involving humans were approved by the data collection process was conducted following the ethical standards outlined in the Declaration of Helsinki and its subsequent amendments. Before the commencement of data collection, ethical approval was obtained from the Ethics Committee at the National Center of Medicine and Sports Sciences of Tunisia. The questionnaire was administered in a traditional pen-and-paper format. Before the administration of the questionnaires, the participants were provided with a comprehensive overview of the study’s primary objective and its specific aims. They were then asked to provide written informed consent. The studies were conducted in accordance with the local legislation and institutional requirements. The participants provided their written informed consent to participate in this study. Written informed consent was obtained from the individual(s) for the publication of any potentially identifiable images or data included in this article.
Author contributions
BS: Conceptualization, Investigation, Project administration, Supervision, Validation, Writing – original draft, Writing – review & editing. BM: Conceptualization, Formal analysis, Methodology, Project administration, Supervision, Validation, Visualization, Writing – original draft, Writing – review & editing. ID: Data curation, Supervision, Validation, Writing – original draft, Writing – review & editing. HC: Investigation, Project administration, Software, Validation, Writing – original draft, Writing – review & editing. NG: Formal analysis, Investigation, Visualization, Writing – original draft, Writing – review & editing. VS: Formal analysis, Validation, Visualization, Writing – original draft, Writing – review & editing. MJ: Data curation, Software, Writing – original draft, Writing – review & editing. MR-I: Funding acquisition, Resources, Validation, Visualization, Writing – original draft, Writing – review & editing. AB: Project administration, Supervision, Validation, Writing – original draft, Writing – review & editing.
Funding
The author(s) declare that no financial support was received for the research and/or publication of this article.
Acknowledgments
We would like to thank all the participants for their time and effort in helping us finish the study, as well as all the teachers who participated in the research.
Conflict of interest
The authors declare that the research was conducted in the absence of any commercial or financial relationships that could be construed as a potential conflict of interest.
Generative AI statement
The authors declare that no Gen AI was used in the creation of this manuscript.
Publisher’s note
All claims expressed in this article are solely those of the authors and do not necessarily represent those of their affiliated organizations, or those of the publisher, the editors and the reviewers. Any product that may be evaluated in this article, or claim that may be made by its manufacturer, is not guaranteed or endorsed by the publisher.
Supplementary material
The Supplementary material for this article can be found online at: https://www.frontiersin.org/articles/10.3389/feduc.2025.1513330/full#supplementary-material
References
Agyapong, B., Obuobi-Donkor, G., Burback, L., and Wei, Y. (2022). Stress, burnout, anxiety and depression among teachers: a scoping review. Int. J. Environ. Res. Public Health 19:10706. doi: 10.3390/ijerph191710706
Antoniou, A. S., Polychroni, F., and Vlachakis, A. N. (2006). Gender and age differences in occupational stress and professional burnout between primary and high-school teachers in Greece. J. Manag. Psychol. 21, 682–690. doi: 10.1108/02683940610690213
Beaton, D. E., Bombardier, C., Guillemin, F., and Ferraz, M. B. (2000). Guidelines for the process of cross-cultural adaptation of self-report measures. Spine 25, 3186–3191. doi: 10.1097/00007632-200012150-00014
Béland, S., Cousineau, D., and Lachance, N. (2017). Utiliser le coefficient omega de McDonald à la place de l’alpha de Cronbach. McGill J. Educ. 52, 791–804. doi: 10.7202/1050915ar
Bollen, K. A. (2014). Structural equations with latent variables. Hoboken, New Jersey: John Wiley & Sons.
Brislin, R. W. (1970). Back-translation for cross-cultural research. J. Cross-Cult. Psychol. 1, 185–216. doi: 10.1177/135910457000100301
Bryant, F. B., Yarnold, P. R., Grimm, L. G., and Yarnold, P. R. (1995). “Principal-components analysis and exploratory and confirmatory factor analysis” in Reading and understanding multivariate statistics, Eds. Laurence G. Grimm and P. R. Yarnold (Washington, DC: American Psychological Association), 99–136.
Byrne, B. M. (2001). Structural equation modeling with AMOS: basic concepts, applications, and programming. Mahwah, NJ: Lawrence Erlbaum Associates.
Byrne, B. M. (2014). Structural equation modeling with LISREL, PRELIS, and SIMPLIS: basic concepts, applications, and programming. New York: Psychology Press.
Cao, C.-H., Liao, X.-L., Jiang, X.-Y., Li, X.-D., Chen, I. H., and Lin, C.-Y. (2023). Psychometric evaluation of the depression, anxiety, and stress scale-21 (DASS-21) among Chinese primary and middle school teachers. BMC Psychol. 11:209. doi: 10.1186/s40359-023-01242-y
Cattell, R. B. (1966). The scree test for the number of factors. Multivar. Behav. Res. 1, 245–276. doi: 10.1207/s15327906mbr0102_10
Chalghaf, N., Guelmami, N., Slimani, M., Del Puente, G., Re, T. S., Zerbetto, R., et al. (2019). Development and preliminary validation of the “teacher of physical education burnout inventory” (TPEBI) in Arabic language: insights for sports and occupational psychology. Front. Psychol. 10:456. doi: 10.3389/fpsyg.2019.00456
Chennoufi, L., Ellouze, F., Cherif, W., Mersni, M., and M’Rad, M. F. (2012). Stress and burnout among Tunisian teachers. L’Encephale 38, 480–487. doi: 10.1016/j.encep.2011.12.012
Cheung, G. W., Cooper-Thomas, H. D., Lau, R. S., and Wang, L. C. (2024). Reporting reliability, convergent and discriminant validity with structural equation modeling: a review and best-practice recommendations. Asia Pac. J. Manag. 41, 745–783. doi: 10.1007/s10490-023-09871-y
Collie, R. J., and Mansfield, C. F. (2022). Teacher and school stress profiles: a multilevel examination and associations with work-related outcomes. Teach. Teach. Educ. 116:103759. doi: 10.1016/j.tate.2022.103759
Cortina, J. M. (1993). What is coefficient alpha? An examination of theory and applications. J. Appl. Psychol. 78, 98–104. doi: 10.1037//0021-9010.78.1.98
De Carvalho, J., and Chima, F. O. (2014). Applications of structural equation modeling in social sciences research. Am. Int. J. Contemp. Res. 4, 6–11. Available at: available https://d1wqtxts1xzle7.cloudfront.net/78064891/Applications_of_Structural_Equation_Modeling_in_Social_Sciences_Research-libre.pdf?1641340168=&response-content-disposition=inline%3B+filename%3DApplications_of_Structural_Equation_Mode.pdf&Expires=1741311533&Signature=efTLLb3Jm4T~Nbow4ngTAnfiemaPbTG89-qdyGaYdr2rvPCq0aqGwimaA-JO1sPY81MU3jPbmnL5yJWJDmgAirB9F9smlSZhExo9gNwbiYGMlRuHeBrPmP771UDcbGeq-fKSu4l4GFCLvJC4RnkzoeDEYlNCSTQvHENIQ8JcOIlXroyCxpvFmTrYGSJOvZvr-1xTr8aNaAMQ6LqfhxsxAZ5a3uYtMqRLiUgz~0MTOFnxWCfZYk2fAgvE~Q-tOhE3rjtLF6lz2yAvzYWEHTHth0cU57vk18MObSAaIgZfy7aOnr-GUuulVlgNGms089~Xdcy~uiYp44ObF7vuB5dfvQ__&Key-Pair-Id=APKAJLOHF5GGSLRBV4ZA
Desouky, D., and Allam, H. (2017). Occupational stress, anxiety and depression among Egyptian teachers. J. Epidemiol. Global Health 7, 191–198. doi: 10.1016/j.jegh.2017.06.002
Elliott, A. C., and Woodward, W. A. (2007). Statistical analysis quick reference guidebook: with SPSS examples. Los Angeles, CA: Sage Publications.
Fan, X. (1998). Review of structural equation modeling with LISREL, PRELIS, and SIMPLIS: basic concepts, applications, and programming by B.M. Byrne. Educ. Psychol. Meas. 58, 1035–1041. doi: 10.1177/0013164498058006011
Ferguson, K., James, Y., and Bourgeault, I. (2022). Teacher mental health and leaves of absences: a pilot study examining gender and care. Can. J. Educ. 45, 315–349. doi: 10.53967/cje-rce.v45i2.4485
Fimian, M. J. (1984). The development of an instrument to measure occupational stress in teachers: the teacher stress inventory. J. Occup. Psychol. 57, 277–293. doi: 10.1111/j.2044-8325.1984.tb00169.x
Fimian, M. J. (1986). Social support and occupational stress in special education. Except. Child. 52, 436–442. doi: 10.1177/001440298605200505
Fimian, M. (1988). Teacher stress inventory. Brandon, VT, États-Unis: Clinical Psychology Publishing.
Fimian, M. J., and Fastenau, P. S. (1990). The validity and reliability of the teacher stress inventory: a re-analysis of aggregate data. J. Organ. Behav. 11, 151–157. doi: 10.1002/job.4030110206
Gana, K., Broc, G., Boudouda, N. E., Calcagni, N., and Ben Youssef, S. (2020). The ITC guidelines for translating and adapting tests (second edition). Prat. Psychol. 27, 175–200. doi: 10.1016/j.prps.2020.06.005
Hair, J. (2010). Multivariate data analysis: Exploratory factor analysis. Upper Saddle River, NJ, USA: Pearson.
Hanif, R., and Pervez, S. (2003). Translation and adaptation of teacher stress inventory. Pak. J. Psychol. Res. 18:45. Available at: https://pjpr.scione.com/newfiles/pjpr.scione.com/501/120-116-1-PB-501-PJPR.pdf
Haydon, T., Leko, M. M., and Stevens, D. (2018). Teacher stress: sources, effects, and protective factors. J. Special Educ. Leadership 31, 99–107. Available at: https://www.researchgate.net/profile/Todd-Haydon/publication/327703860_Teacher_Stress_Sources_Effects_and_Protective_Factors/links/5b9ff5c292851ca9ed11ae5e/Teacher-Stress-Sources-Effects-and-Protective-Factors.pdf
Hooper, D., Coughlan, J., and Mullen, M. R. (2008). Structural equation modelling: guidelines for determining model fit. Electron. J. Bus. Res. Methods 6, 53–60. Available at: https://books.google.fr/books?hl=fr&lr=&id=ZZoHBAAAQBAJ&oi=fnd&pg=PA195&dq=Hooper+et+al.,+2008,+Evaluating+model+fit:+a+synthesis+of+the+structural+equation+modelling+literature&ots=gX_MZyVr65&sig=l9uHzWRYz4o1lZ9j08AHSVRf7Xk#v=onepage&q=Hooper%20et%20al.%2C%202008%2C%20Evaluating%20model%20fit%3A%20a%20synthesis%20of%20the%20structural%20equation%20modelling%20literature&f=false
Horn, J. L. (1965). A rationale and test for the number of factors in factor analysis. Psychometrika 30, 179–185. doi: 10.1007/BF02289447
Hu, L. T., and Bentler, P. M. (1999). Cutoff criteria for fit indexes in covariance structure analysis: conventional criteria versus new alternatives. Struct. Equ. Model. 6, 1–55. doi: 10.1080/10705519909540118
Kaiser, H. F. (1958). The varimax criterion for analytic rotation in factor analysis. Psychometrika 23, 187–200. doi: 10.1007/BF02289233
Katsantonis, I. (2020). Factors associated with psychological well-being and stress: a cross-cultural perspective on psychological well-being and gender differences in a population of teachers. Pedagogical Res. 5, 1–12. doi: 10.29333/pr/8235
Kelloway, E. K. (1995). Structural equation modelling in perspective. J. Organ. Behav. 16, 215–224. doi: 10.1002/job.4030160304
Klassen, R. M., and Chiu, M. M. (2010). Effects on teachers’ self-efficacy and job satisfaction: teacher gender, years of experience, and job stress. J. Educ. Psychol. 102, 741–756. doi: 10.1037/a0019237
Kline, R. B. (2016). Principles and practice of structural equation modeling (fourth edition) New York, NY: The Guilford Press.
Kourmousi, N., and Alexopoulos, E. C. (2016). Stress sources and manifestations in a nationwide sample of pre-primary, primary, and secondary educators in Greece. Front. Public Health 4:73. doi: 10.3389/fpubh.2016.00073
Kourmousi, N., Darviri, C., Varvogli, L., and Alexopoulos, E. C. (2015). Teacher stress inventory: validation of the Greek version and perceived stress levels among 3,447 educators. Psychol. Res. Behav. Manag. 8, 81–88. doi: 10.2147/PRBM.S74752
Kyriacou, C. (2001). Teacher stress: directions for future research. Educ. Rev. 53, 27–35. doi: 10.1080/00131910120033628
Lasebikan, V. O. (2016). Expert panel’s modification and concurrent validity of the teacher stress inventory among selected secondary school teachers in Nigeria. Psicologia 29:42. doi: 10.1186/s41155-016-0047-3
MacCallum, R. C., Browne, M. W., and Sugawara, H. M. (1996). Power analysis and determination of sample size for covariance structure modeling. Psychol. Methods 1, 130–149. doi: 10.1037/1082-989X.1.2.130
Mallen, C., Sumathipala, A., Wickramasinghe, E., Senevirathne, R. D. A., and Gunawardena, N. (2022). Validity & reliability of teacher stress inventory to measure occupational stress among secondary school teachers in Sri Lanka. J. Coll. Commun. Phys. Sri Lanka. 28, 532–540. doi: 10.4038/jccpsl.v28i1.8442
Marsh, H. W., Balla, J. R., and McDonald, R. P. (1988). Goodness-of-fit indexes in confirmatory factor analysis: the effect of sample size. Psychol. Bull. 103, 391–410. doi: 10.1037/0033-2909.103.3.391
McLean, L., and Connor, C. M. (2015). Depressive symptoms in third-grade teachers: relations to classroom quality and student achievement. Child Dev. 86, 945–954. doi: 10.1111/cdev.12344
Moussa, M. T., Lovibond, P., Laube, R., and Megahead, H. A. (2017). Psychometric properties of an Arabic version of the depression anxiety stress scales (DASS). Res. Soc. Work. Pract. 27, 375–386. doi: 10.1177/1049731516662916
Muenjohn, D. N., and Armstrong, P. A. (2008). Evaluating the structural validity of the multifactor leadership questionnaire (MLQ), capturing the leadership factors of transformational-transactional leadership. Contemp. Manag. Res. 4, 3–14. doi: 10.7903/cmr.704
Pett, M., Lackey, N., and Sullivan, J. (2003). Making sense of factor analysis. Thousand Oaks, CA, USA: SAGE Publications, Inc. doi: 10.4135/9781412984898
Regaieg, N., Zouari, L., Mejdoub, Y., Elleuch, O., Smaoui, N., Feki, R., et al. (2024). Prevalence and factors for anxiety and depression among secondary school teachers from Sfax city of Tunisia in times of the coronavirus disease 2019 pandemic: a cross-sectional study. Pan Afr. Med. J. 47:27. doi: 10.11604/pamj.2024.47.27.39550
Sapolsky, R. M. (2004). Stressed-out memories. Scientific American. Mind 14, 28–33. Available at: https://www.braintrainuk.com/wp-content/uploads/2013/06/Scientific-American-Mind-Premier-Edition-December-2004.pdf#page=29
Satorra, A., Bentler, P. M., von Eye, A., and Clogg, C. C. (1994). “Corrections to test statistics and standard errors in covariance structure analysis” in Latent variables analysis: applications for developmental research, Eds. A. von Eye and C. C. Clogg (Thousand Oaks, CA: Sage Publications, Inc), 399–419.
Schermelleh-Engel, K., Moosbrugger, H., and Müller, H. (2003). Evaluating the fit of structural equation models: tests of significance and descriptive goodness-of-fit measures. Methods Psychol. Res. 8, 23–74. Available at: https://www.stats.ox.ac.uk/~snijders/mpr_Schermelleh.pdf
Schönbrodt, F. D., and Perugini, M. (2013). At what sample size do correlations stabilize? J. Res. Pers. 47, 609–612. doi: 10.1016/j.jrp.2013.05.009
Skaalvik, E. M., and Skaalvik, S. (2017). Dimensions of teacher burnout: relations with potential stressors at school. Soc. Psychol. Educ. 20, 775–790. doi: 10.1007/s11218-017-9391-0
Steiner, E. D., and Woo, A. (2021). Job-related stress threatens the teacher supply. Rand Corporation, 25, 08–01. Available at: https://www.rand.org/content/dam/rand/pubs/research_reports/RRA1100/RRA1108-1/RAND_RRA1108-1.pdf
Tabachnick, B. G., and Fidell, L. S. (2013). Using multivariate stats PNIE. 6th Edn. Boston, MA: Pearson Australia Pty Ltd.
Taber, K. S. (Ed.). (2017). The use of Cronbach’s alpha when developing research instruments in science education. Dordrecht, Netherlands: Springer. 48.
Taber, K. S. (2018). The use of Cronbach’s alpha when developing and reporting research instruments in science education. Res. Sci. Educ. 48, 1273–1296. doi: 10.1007/s11165-016-9602-2
Vaske, J. J. (2008). Survey research and analysis: applications in parks, recreation and human dimensions. State Collage, PA: Venture Publishing.
von der Embse, N., Ryan, S. V., Gibbs, T., and Mankin, A. (2019). Teacher stress interventions: a systematic review. Psychol. Sch. 56, 1328–1343. doi: 10.1002/pits.22279
von Haaren-Mack, B., Schaefer, A., Pels, F., and Kleinert, J. (2020). Stress in physical education teachers: a systematic review of sources, consequences, and moderators of stress. Res. Q. Exerc. Sport 91, 279–297. doi: 10.1080/02701367.2019.1662878
Watchravesringkan, K., Yan, R. N., and Yurchisin, J. (2008). Cross-cultural invariance of consumers’ price perception measures. Int. J. Retail Distrib. Manag. 36, 759–779. doi: 10.1108/09590550810900982
Wheaton, B., Muthén, B., Alwin, D. F., and Summers, G. F. (1977). Assessing reliability and stability in panel models. Sociol. Methodol. 8, 84–136. doi: 10.2307/270754
Keywords: burnout, educational environment, factor analysis, occupational stress, psychometrics, reliability, validity, well-being
Citation: Sai B, Mohamed B, Dergaa I, Ceylan Hİ, Guelmemi N, Stefanica V, Jaraya M, Raul-Ioan M and Ben Abderrahman A (2025) Transcultural validation of the “Teacher Stress Inventory” (TSI) in Arabic: an exploratory study on stress among Tunisian teachers. Front. Educ. 10:1513330. doi: 10.3389/feduc.2025.1513330
Edited by:
Esther Lopez-Zafra, University of Jaén, SpainReviewed by:
Nejmeddine Ouerghi, Hôpital La Rabta, TunisiaKarima El Ghoudani, Hassan Premier University, Morocco
Copyright © 2025 Sai, Mohamed, Dergaa, Ceylan, Guelmemi, Stefanica, Jaraya, Raul-Ioan and Ben Abderrahman. This is an open-access article distributed under the terms of the Creative Commons Attribution License (CC BY). The use, distribution or reproduction in other forums is permitted, provided the original author(s) and the copyright owner(s) are credited and that the original publication in this journal is cited, in accordance with accepted academic practice. No use, distribution or reproduction is permitted which does not comply with these terms.
*Correspondence: Halil İbrahim Ceylan, aGFsaWwuaWJyYWhpbWNleWxhbjYwQGdtYWlsLmNvbQ==; Muntean Raul-Ioan, bXVudGVhbi5yYXVsQHVhYi5ybw==
†These authors have contributed equally to this work and share senior authorship