 Susana K. Lingán-Huamán1*
 Sergio Dominguez-Lara2
 Indira Orbegoso Postillos1
 Rosmery Matysek Medina1
 Renzo Felipe Carranza Esteban1
- 1Grupo de Investigación Avances en Investigación Psicológica, Facultad de Ciencias de la Salud, Universidad San Ignacio de Loyola, Lima, Peru
- 2Instituto de Investigación FCCTP, Universidad de San Martín de Porres, Lima, Peru
Introduction: This study aimed to translate and analyze the psychometric properties of the Academic Major Satisfaction Scale in the context of assessing academic dropout intention among Peruvian university students. Shifting the focus of the AMSS scale will provide significant practical value to institutions, as measuring dropout intention will yield directly applicable insights to address student dropout and enhance retention.
Methods: An instrumental, cross-sectional research was carried out with 443 Peruvian university students, 56.2% of whom were women aged between 18 and 25 years (Mage = 20.7; SDage = 2.08).
Results: The factor analysis confirmed the satisfactory one-dimensional structure of four items, omitting items 5 and 6 (CFI = 1.000; RMSEA = 0.029, CI90% 0.000, 0.103; SRMR = 0.007). Factor loadings fluctuate between 0.64 and 0.91, and reliability was found to be adequate (α = 0.80; ω = 0.883). In addition, evidence of factorial invariance according to sex and academic cycle is reported. Regarding the evidence of validity by association with other variables, acceptable associations were found with self-efficacy, satisfaction with studies, and engagement, which are consistent with the current literature.
Conclusion: The new measure introduced in this study, known as the Academic Dropout Intention Scale (ADIS), is a brief scale that presents adequate psychometric properties and is useful for assessing academic dropout intention among Peruvian university students.
1 Introduction
Choosing a professional career path is among the main developmental challenges that individuals face, and it is based on the implementation of one’s self-concept (Super, 1953). This complex process is influenced by individual characteristics, the social environment, and life experiences (Super, 1980), so that people make decisions that reflect their self-concept and the representations they have constructed of their own identities (Savickas, 2005). In this sense, if vocational or career choices are congruent with an individual’s needs, interests, abilities, and goals, a feeling of satisfaction with their choice will emerge (Super, 1953; Savickas, 2005; Nauta, 2007). In turn, this satisfaction will positively impact the students’ academic performance and other roles played by the individual, and the success and satisfaction experienced will lead to a sense of balance in different aspects of life (Super, 1980).
The above is consistent with research findings reporting that students with higher satisfaction with their chosen majors are more likely to remain at school (Nauta, 2007; Behr et al., 2020) and exhibit better academic performance (Graunke and Woosley, 2005; Kim and Lee, 2015; Cox et al., 2016; Milsom and Coughlin, 2017); higher levels of engagement and motivation (Cox et al., 2016; Navarro et al., 2019); increased academic self-efficacy (Ojeda et al., 2011; Lent et al., 2015; Navarro et al., 2019); and better career adaptability (McIlveen et al., 2013; Rudolph et al., 2017).
Further, career satisfaction is an indicator of subsequent job satisfaction and life satisfaction (Super, 1953). Having a strong professional identity has been reported to be related to higher job satisfaction and lower intention to quit (Hu et al., 2022). Individuals who are satisfied with their professional choices are more likely to find satisfaction in their careers and excel in the labor field. As for life satisfaction, it has been shown that the choice of an appropriate career, based on self-knowledge and introspection, can easily lead to life satisfaction (Cimsir, 2019), so that the greater the satisfaction with the specialty, the higher one’s life satisfaction (Ojeda et al., 2011; Sovet et al., 2014; Silva Soares et al., 2021). Thus, if vocational decisions are considered to be based on an individual’s own abilities, interests, values, and personality, there is a greater probability that these characteristics will be adjusted to work situations and lifestyles that are perceived as pleasant, in which a projection of personal growth is easily identified (Super, 1953).
Despite the relevance of career satisfaction and its impact on the different spheres of people’s lives, little research has addressed this variable in the Peruvian context, although it has been demonstrated that the situation of university students merits it. In Peru, a significant increase in the number of universities has been observed in recent years, which has led to greater access to higher education and a considerable increase in the number of university students, such that university enrollment increased by 164% in private universities and 108% in public universities between 2012 and 2022 (Instituto Nacional de Estadística e Informática, 2024).
In many cases, pressure from family, teachers, and society encourages students to start a university major without having a clear idea about their career preferences. In fact, according to the last university census, the average age of university entrants in Peru is 18.1 years, with a significant proportion of students being 16 years of age (Instituto Nacional de Estadística e Informática, 2010). In some cases, Peruvian adolescents are accepted into universities before finishing compulsory secondary education and without having chosen a professional career. Careers are also chosen for prestige or perceived job opportunities, with high rates of enrollment in majors linked to administration and business [Superintendencia Nacional de Educación Superior Universitaria (SUNEDU), 2021], without considering one’s own interests, skills, or motivations. As a result, most Peruvian students do not receive sufficient guidance to explore their vocational interests and reflect on the congruence between these interests, their personal skills, the opportunities offered by the labor market, and the career chosen. The problem described is reflected in the high percentage of students who interrupt their studies or transfer to other majors during their university education. Recent data show that the cumulative dropout rate, considering students who did not complete their university education and who did not enroll in a university, was 48.6% in 2021 [Secretaria Nacional de la Juventud (SENAJU), 2021]. In light of this problem, some studies have identified that the most important factors contributing to university dropout in Peru are economic and family problems, inadequate study techniques, and lack of motivation and vocation for the chosen career (Dávila-Morán et al., 2022; Escalante López et al., 2023).
The above shows that the issue of choosing a fulfilling professional career is challenging, in terms of both research and providing professional vocational counseling and guidance. Therefore, measurement tools with adequate psychometric properties to use in research and professional practice are significant, so that worries related to satisfaction with the chosen major can be identified, thus addressing this problem early and avoiding dropouts.
While measurement scales have been developed to assess satisfaction with the environment of college students for several decades, most of them are multidimensional measures that assess satisfaction with different facets of the academic environment, such as satisfaction with the teacher, the university campus, interaction with peers, etc. These scales include the College Student Satisfaction Questionnaire (CSSQ) with 92 items and six dimensions (Betz et al., 1970), the Program Evaluation Survey (PES) with 15 items and two dimensions (Braskamp et al., 1979), the College Descriptive Index (CDI) with 51 items and eight dimensions (Reed et al., 1984), the Course Experience Questionnaire (CEQ) with 30 items and five dimensions (Ramsden, 1991), and the Student Satisfaction Inventory (SSI) with 79 items and six dimensions (Schreiner and Juillerat, 1993). Among the recently created multidimensional scales are the College Satisfaction Scale (CSS) (Lodi et al., 2017) with 20 items measuring five dimensions, and other measures created for specific academic contexts, such as the Nursing Student Satisfaction Scale (NSSS) (Chen and Lo, 2012) and the Undergraduate Nursing Student Academic Satisfaction Scale (UNSASS) (Dennison and El-Masri, 2012).
Despite the multiple existing instruments to measure academic satisfaction, a recent systematic review concluded that all student satisfaction scales included in this study reported at least one inadequate psychometric property (Rahmatpour et al., 2019). Furthermore, the length of multidimensional scales is often a limitation, as the large number of items needed to assess each dimension of university student satisfaction makes their application difficult. Additionally, considering these scales as predictive measures of dropping out or remaining in university may introduce biases because not all dimensions of satisfaction are equally relevant. For example, a student may be satisfied with teachers’ quality of pedagogy or with the infrastructure and services of the educational institution but still be dissatisfied with their career choice (Nauta, 2007). The aforementioned limitation is also present in the Escala de Satisfacción Académica (ESA) by Medrano and Pérez (2010), published in Spanish and widely used. Despite being a brief (eight-item) and unidimensional measure, the items it comprises refer to aspects that may be associated in different ways with satisfaction regarding the chosen major. For example, item 3 states: “I like my professors,” an assertion with which students at various levels of satisfaction with their major may agree, particularly if they are taking general education courses, which are common during the early years of university education.
Therefore, to overcome the limitations of multidimensional scales and criticisms of single-item measures to assess college students’ major satisfaction, Nauta (2007) developed the Academic Major Satisfaction Scale (AMSS), based on an approach that considers cognitive and emotional dimensions, with the intention that the total AMSS score reflects overall career satisfaction. This is a self-report measure consisting of six items, four of which are reverse-scored (e.g., item 1: “I often wish I had not gotten into this major”). Its items are scored using a Likert-type scale with five response options, ranging from strongly disagree (1) to strongly agree (5). In this way, its brevity and factorial simplicity stand out as its main advantages compared to other existing measures. In any case, the AMSS is a versatile measure that can be used for screening satisfied and dissatisfied students and can subsequently be complemented with multidimensional measures if the goal is to obtain comprehensive information on academic aspects. For this reason, in the present study, it was decided to translate and explore its psychometric properties in the Peruvian context.
However, in terms of the psychometric approach of the AMSS, reliability was addressed consistently using Cronbach’s alpha coefficient, with high coefficients (> 0.80) reported in all the studies reviewed (Gür Erdoğan and Arsal, 2015; Nauta, 2007; Sacramento et al., 2023; Silva Soares et al., 2021; Sovet et al., 2014). On the other hand, the factorial structure was analyzed through confirmatory factor analysis (CFA), but some complications have been noted with respect to the joint processing of direct and reverse items since its inception, despite not being recommended (Suárez-Álvarez et al., 2018) and often being removed during psychometric research (Sánchez-Villena et al., 2021). For example, the original study (Nauta, 2007) chose a method that correlated the residuals of both types of items (direct and inverse) and while a good fit is reported, the magnitude of the RMSEA is still high (0.12) for the typical standards. A similar outcome was observed in another study (Sovet et al., 2014) in which after obtaining an unacceptable value of the RMSEA (0.168), Nauta’s (Nauta, 2007) methodology was replicated with respect to the association between residuals, and the fit was improved. Another work also only showed improvement after correlating two pairs of residuals (Gür Erdoğan and Arsal, 2015). More recently, a good fit was reported in an AMSS analysis conducted in Brazil, but the RMSEA was high (0.235), and no adjustments were made to the specifications (Silva Soares et al., 2021).
Some clarifications to the above are necessary regarding CFA and the management of reverse items. First, the magnitude of the RMSEA generally informs about the presence of misspecifications (ME), which in this case would be due to under-parameterization (Hu and Bentler, 1999), that is, the need to specify new parameters. Previous studies have suggested specifying correlations between the residuals of the direct and inverse items, which improves model fit. However, this improvement is not attributable to the construct itself, and thus, it does not guarantee that the model is a good one. Second, while the fit indices reach more acceptable magnitudes after performing this procedure, the correlation between residuals only constitutes a methodological artifact to improve the fit (Dunn et al., 2014), but it does not help to understand the construct (Dominguez-Lara, 2019) because the resulting variance comes from other sources, such as the proximity between items, similarities in wording, response style, etc. So, its implementation would not be necessary (Saris et al., 2009). Moreover, this would lead to reliability calculation problems because some kind of bias would be present (Meyer, 2010) and corrections to the magnitude of the coefficient would have to be made (Raykov, 2001), since by involving these parameters (correlated residuals) in the measurement model, the magnitudes of the factor loadings are altered. In this way, since the reliability of the construct is based on the factor loadings, the possible influence of the correlated residuals on this calculation should be removed using a mathematical formula (Raykov, 2001).
Finally, another Brazilian study (Sacramento et al., 2023) also found an unacceptable RMSEA (0.151), and although the initial response was to correlate the residuals of the direct and inverse items as in previous works, they decided to eliminate items 5 (direct) and 6 (inverse), arguing that factorial solutions with correlated residuals are not parsimonious.
Because of the methodological challenges noted above and considering that four of the six items of the AMSS are inverse items to measure career satisfaction, this study’s objective was to translate the AMSS into Spanish and evaluate its psychometric properties among Peruvian university students. Furthermore, considering that the intention to abandon the chosen career can be defined as the conscious and voluntary predisposition of a student to stop attending classes, interrupt their studies, or change majors, we believe that if the scores of the AMSS items are not reversed, they have semantic and conceptual content that directly targets the measurement of this aspect (intention to abandon studies). Indeed, two of the six AMSS items are clear indicators of the intention to leave the career (“I am seriously considering a career change” and “I would like to talk to someone about a career change”).
Therefore, the direct scores of four items (1, 2, 3, and 6) and the conversion of the scores of items 4 (“In general, I am happy with the career I have chosen”) and 5 (“I feel good about the career I have chosen”) were considered so that the items jointly measure students’ propensity to drop out rather than their academic satisfaction. This is supported by Nauta (2007) original study in which, with the purpose of confirming the predictive validity of the AMSS, its use allowed for distinguishing students who continued studying their major from those who moved to other careers. This demonstrates that, although the reverse-scored items of the AMSS were not originally designed to measure the intention to drop out, they are relevant for assessing this new construct, which would provide benefits at the institutional level.
In this way, the shift in focus in the use of the AMSS scale will provide significant practical value to the institution, as measuring the intention to drop out will offer information directly applicable to addressing student drop-out and promoting retention by educational institutions. Thus, this study’s relevance is highlighted by the fact that to scientifically understand and professionally address intentions to drop out of a university major in the Peruvian context, having measurement instruments with proven psychometric properties is necessary.
Based on the above, this study hypothesizes that the AMSS, as a measure of academic dropout intention, and henceforth called Academic Dropout Intention Scale (ADIS), has a one-dimensional structure (hypothesis 1), is invariant according to gender (hypothesis 2) and academic cycle (hypothesis 3), has adequate reliability (hypothesis 4), and is indirectly related to satisfaction with studies (hypothesis 5) and academic self-efficacy and academic engagement (hypothesis 6).
2 Methods
2.1 Participants
Five hundred and thirty-nine (539) university students completed the online questionnaire created for the purposes of this study. However, considering the established inclusion criteria 81 cases were not included, and after the statistical data cleaning process, 15 students were also excluded. Finally, the responses of only 443 participants were considered (Mage = 20.7; SDage = 2.08; 56.2% women). Among other characteristics, most of these women are enrolled in majors related to engineering and industry (29.6%), followed by health sciences (27.5%), business sciences (14.4%), and social sciences (10.4%), being in-person learning the most common modality (82.4%). Participants were selected through non-probabilistic convenience sampling.
2.2 Instrument design
2.2.1 Academic dropout intention scale (ADIS)
The ADIS is a measure derived from the Academic Major Satisfaction Scale (AMSS) (Nauta, 2007), a one-dimensional scale comprising six items. In its original version, the AMSS was created to measure the satisfaction of students with their career, so it should be, therefore, considered that the scores of four of the six items should be inverted. For this study’s purposes, the direct scores of items 1, 2, 3, and 6 were used, in addition to converting the scores of items 4 (“In general, I am happy with the career I have chosen”) and 5 (“I feel good about the career I have chosen”) so that it is aimed at measuring the intention to drop out of university rather than the students’ satisfaction. The items are scored using a Likert-type scale with five response options, ranging from strongly disagree (1) to strongly agree (5).
2.2.2 Brief scale of satisfaction with studies (EBSE)
The EBSE (Merino-Soto et al., 2017) is an instrument created in Peru that evaluates university student satisfaction with their way of studying, their performance, and their overall experience with studies. It consists of three items with five response options, ranging from strongly disagree (1) to strongly agree (5). The reliability obtained with the data from the present study was found to be adequate (α = 0.853).
2.2.3 Scale of perceived self-efficacy specific to academic situations (EAPESA)
The EAPESA (Palenzuela, 2012) assesses academic self-efficacy in a one-dimensional way using nine items using an ordinal scale with four response options ranging from never (1) to always (4). This study used the version created for Peruvian university students (Dominguez-Lara et al., 2023), obtaining high magnitude reliability (α = 0.936).
2.2.4 Utrech work engagement scale—3student (UWES-3S)
A three-item version of the UWES-S (Schaufeli et al., 2002) with evidence of validity in Peruvian university students (UWES-3S) (Dominguez-Lara et al., 2021) was used. The UWES-3S measures academic engagement at a one-dimensional level with six items arranged in seven response options, ranging from never (0) to always (6). Acceptable reliability was obtained for this study (α = 0.787).
2.3 Procedure
The translation of the ADIS was carried out following the guidelines proposed by Guillemin et al. (1993), which include the phases of initial translation, back-translation by translators who had no knowledge of the instrument’s content in its original version, and evaluation by a review committee and a focus group as pre-testing. In the initial translation phase, three professional translators with advanced English proficiency participated to translate the original version of the scale into Peruvian Spanish. The clarity and relevance of the translations were reviewed, compared, and assessed by a review committee, formed by the authors of the present study, with the purpose of making the necessary adjustments to ensure that the content of the items was properly understood. After choosing the most appropriate Spanish version for each of the items, a back-translation was performed, requesting the participation of two different linguists who independently provided their translations of the scale from Spanish to English. The responses of the second group of translators and the original version of the instrument were compared, and a consolidated version of the translated scale was developed.
The clarity of the items of the consolidated version was evaluated using a focus group made up by 15 students who were attending a private university in Lima and who endorsed their understanding of the translated items. Finally, the judgment of six experts with training in psychology and experience in research related to higher education was requested for their evaluation of the clarity, relevance, and representativeness of the items.
As for data collection, an online form was designed using Google Forms, which included informed consent and a personal data sheet in addition to the measurement instruments presented above. The online form was shared via email and social networks, such as Facebook and WhatsApp.
As part of ethical considerations, the data collection form included an informed consent section that explained the purpose of the study, the voluntary and anonymous nature of participation, and information about data confidentiality. Only those who provided their consent through the online form were able to complete the questionnaires and, therefore, participate in the research. Additionally, the research was approved by the Ethics Committee of the Graduate School of Universidad Peruana Unión (Reference: 2023-CE-EPG-00027).
2.4 Data analysis
Preliminarily, the presence of multivariate outliers was explored according to the Mahalanobis distance, and the statistically significant cases (p < 0.001) were eliminated. In addition, the approximation to univariate normality was analyzed using skewness (< 2) and kurtosis (< 2) (Gravetter and Wallnau, 2013); multivariate normality was explored using Mardia’s coefficient (G2 < 70) (Domínguez Lara et al., 2022). Prior to the descriptive analyses, the scores of items 4 and 5 of the ADIS were recoded to ensure that the scores of all items were targeted at dropping out.
As for validity evidence regarding internal structure, and although the evidence is based on the assumption of a unidimensional theoretical model, an exploratory analysis was conducted to understand how the items are organized, considering that direct items (associated with dropout) and reverse items (associated with retention) coexist. Thus, an exploratory factor analysis (EFA) was performed using the diagonally weighted least squares (DWLS) method. Prior to this, the number of factors to be extracted was determined through parallel analysis (Timmerman and Lorenzo-Seva, 2011). The factorial solution was evaluated considering the KMO (> 0.70) and Bartlett’s test of sphericity.
Subsequently, a CFA was implemented with the WLSMV method based on polychoric correlations. In this sense, the original one-dimensional model of six items (M1) (Nauta, 2007) and an alternative one-dimensional model consisting of four items that dispenses with two of them (5 and 6) (M2) (Sacramento et al., 2023) were tested.
As for the assessment of fit for EFA and CFA, general indices such as the Comparative Fit Index (CFI > 0.90) (McDonald and Ho, 2002), the Root Mean Square Error of Approximation (RMSEA <0.08) (Browne and Cudeck, 1993), and the SRMR (< 0.08) (Hu and Bentler, 1999) were used for CFA, while the Root Mean Square of Residuals (RMSR) was used for EFA, and if it exceeds Kelley’s criterion (> 0.048; Harman, 1962); and specifically, the magnitude of factor loadings (> 0.50) (Dominguez-Lara, 2018) was assessed as a measure of empirical representation of the construct. Complementarily, the potential presence of ME associated with correlated residuals was analyzed under an approach based on modification indices (MI; χ2 > 10) and expected non-standardized parameter change (EPC) (Saris et al., 2009). After determining the model with the greatest empirical support, an invariance analysis was performed according to sex (males and females) and academic cycle (students completing the initial semesters and students completing the final semesters).
The measurement invariance analysis was performed by implementing a multiple group factor analysis (MGFA); further, configural invariance (equivalence of the internal structure), weak invariance (equivalence of the factor loadings), strong invariance (equivalence of the thresholds), and strict invariance (equivalence of the residuals) were analyzed (Pendergast et al., 2017). Invariance presented favorable evidence based on the variability of the fit indices between less restricted models and more restricted models (ΔCFI > −0.01, ΔRMSEA <0.015, ΔSRMR <0.030) (Chen, 2007) and of χ2 (p > 0.05) (Asparouhov and Muthén, 2006). However, a specific analysis was also performed where the factorial parameters of the analyzed groups were compared from an effect size approach (Pornprasertmanit, 2022). Along these lines, coefficient q (< |0.10|) was used to compare factor loadings; for thresholds, the d (< |0.20|); and for residuals, coefficient h (< |0.10|).
In terms of reliability, score reliability was assessed using the α coefficient, with expected values >0.70 because the scale has fewer than seven items and more than 300 individuals were evaluated (Ponterotto and Charter, 2009), and construct reliability was assessed using the ω coefficient, with expected values >0.80 (Raykov and Hancock, 2005), considering the expected magnitude of the factor loadings (> 0.50).
Evidence of validity by association with other variables was analyzed in two stages using exploratory structural equation modeling (ESEM) (Asparouhov and Muthén, 2009) through the WLSMV calculation method and polychoric correlation matrix. An oblique target rotation (ε = 0.05) (Asparouhov and Muthén, 2009) was used, in which principal loadings were freely calculated and secondary loadings were specified as close to zero (~0). Complementarily, the relevance of the secondary loadings was analyzed with the factorial simplicity index (FSI), considering that values below 0.70 indicate that more than one factor significantly influences the item (Fleming and Merino Soto, 2005).
The first stage consisted of exploring the relationship of the ADIS with the measure of satisfaction with studies (EBSE), under the premise that these measures can be interpreted independently despite sharing a common aspect (satisfaction), considering that the ADIS is derived from a measure of career satisfaction. In the second stage, the relationship of the ADIS measure with academic self-efficacy and academic engagement was analyzed using the assessment parameters set out above.
As for analytical support, EFA was performed using FACTOR, version 12.04.05 (Ferrando and Lorenzo-Seva, 2017), while confirmatory factor analyses (CFA, MGFA, ESEM) and reliability analyses were performed using the Mplus program, version 8.4 (Muthén and Muthén, 2019). The MEs were evaluated using modules developed in MS Excel (Dominguez-Lara and Merino-Soto, 2018) as well as the analysis of the magnitude of the effect on measurement invariance (Dominguez-Lara and Merino-Soto, 2019).
3 Results
3.1 Evidence of validity in relation to internal structure
Fifteen cases that were considered multivariate outliers were eliminated. The AMSS items satisfactorily approached univariate (Table 1) and multivariate normality (G2 = 17.436).
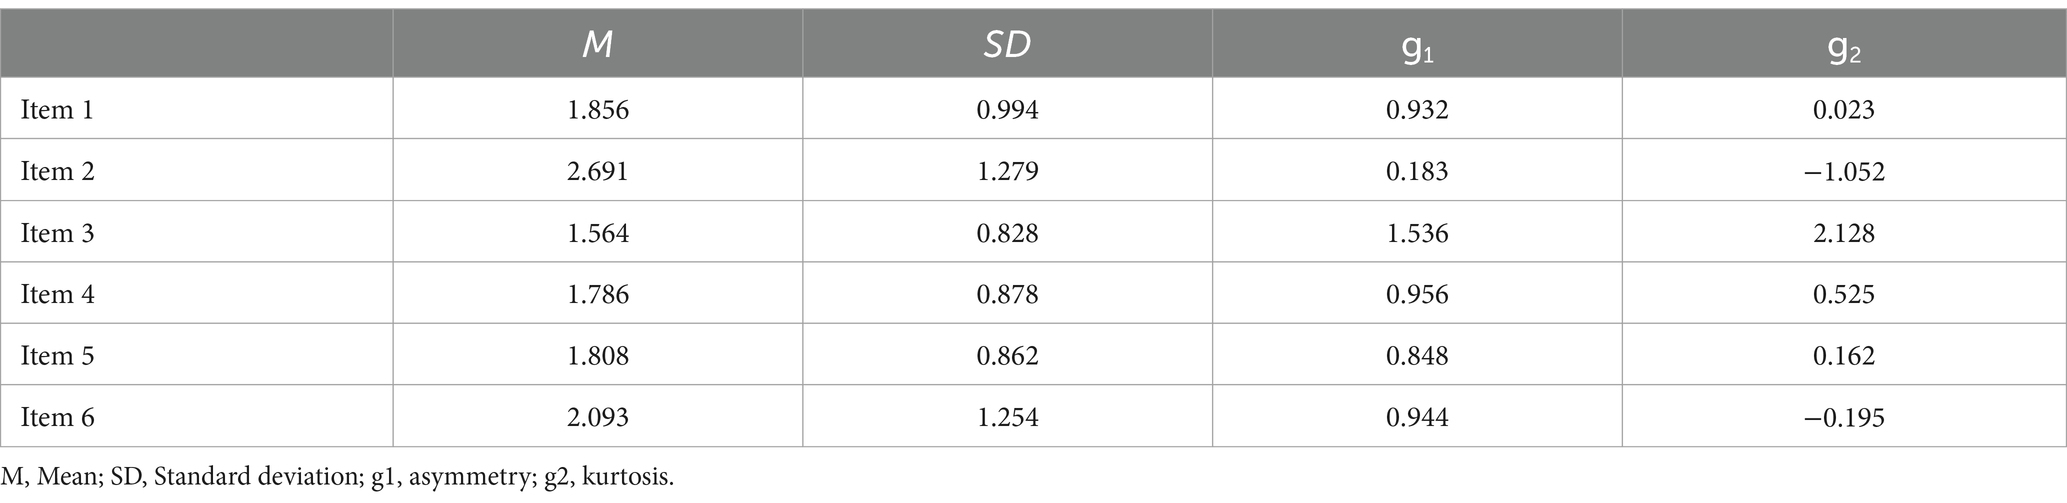
Table 1. Descriptive statistics of the ADIS items.
Regarding structural analysis, the parallel analysis prior to the EFA suggests extracting one factor that explains 44.06% of the variance. The extracted factor shows an acceptable KMO (0.824) and a statistically significant Bartlett’s test. While the CFI was acceptable (0.984), the RMSR was high (0.079), and the lower limit of its confidence interval (CI) suggests an excess relative to Kelley’s criterion (CI 0.062, 0.099), and the RMSEA was 0.182 (CI 0.139, 0.225). Additionally, it was found that two pairs of residuals could be associated (items 4 and 6; items 3 and 6).
Thus, since the original six-item structure was inconclusive under an exploratory approach, the models proposed in the literature were analyzed from a confirmatory perspective. The original one-dimensional measurement model (M1) presented a poor fit in terms of one of the indicators (Table 2) and, regarding potential MEs, it was suggested to specify the association between the residuals of items 4 and 5, 3 and 4, 3 and 5, and 5 and 6 (in all cases: χ2 > 25; EPC > |1|). Given that the item that appears consistently is item 5, a model was evaluated by eliminating it. Although the fit improves by a certain magnitude (Table 2), there is still the suggestion of ME associated with the residual correlations of items 1 and 3, 1 and 4, and 3 and 6 (in all cases: χ2 > 15; EPC > |0.5|), so it is still not an adequate model. Finally, the second one-dimensional model (M2), in which items 5 and 6 are eliminated, presented better fit indices (Table 2), whereas there were no suggestions of association between residuals, making it the most parsimonious model.
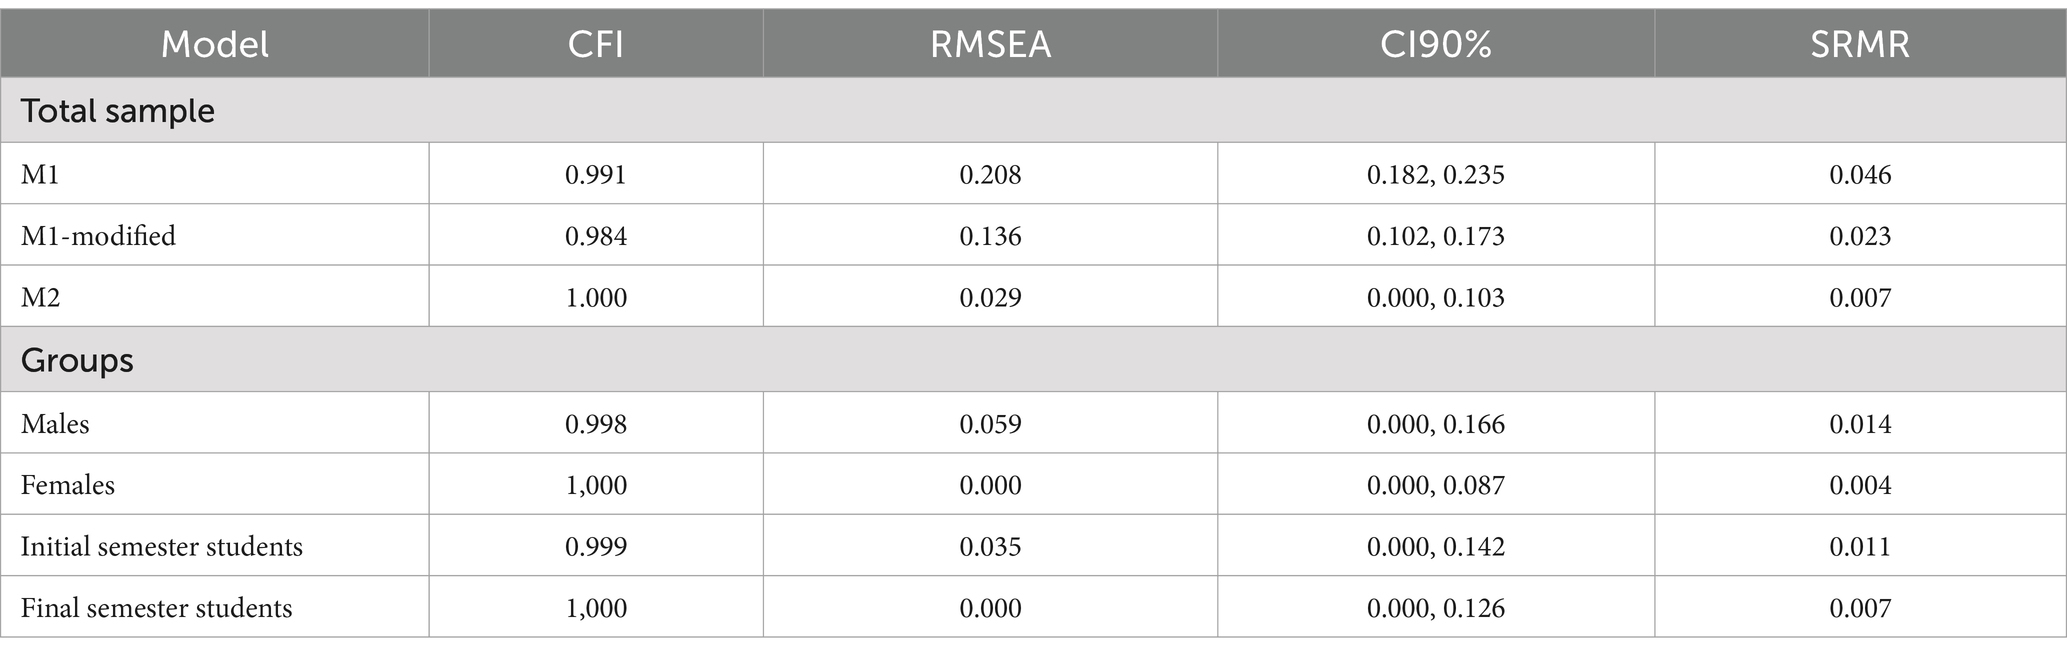
Table 2. CFA of the ADIS.
More specifically, adequate fit was found in all groups involved in the variance analyses: males, females, final semester students and initial semester students (Table 2) and overall presented factor loadings above the expectations (Table 3). In summary, the one-dimensional structure found supports the first research hypothesis.

Table 3. Factor loadings of the ADIS items, by group.
3.2 Measurement invariance by sex and academic semester
The results indicate that there is favorable evidence of measurement invariance by sex and academic semester according to the variation of the fit indices (Table 4) and to the effect size measures associated with the comparison of factorial parameters between groups (Tables 5, 6). Therefore, the second and third hypotheses are empirically supported.
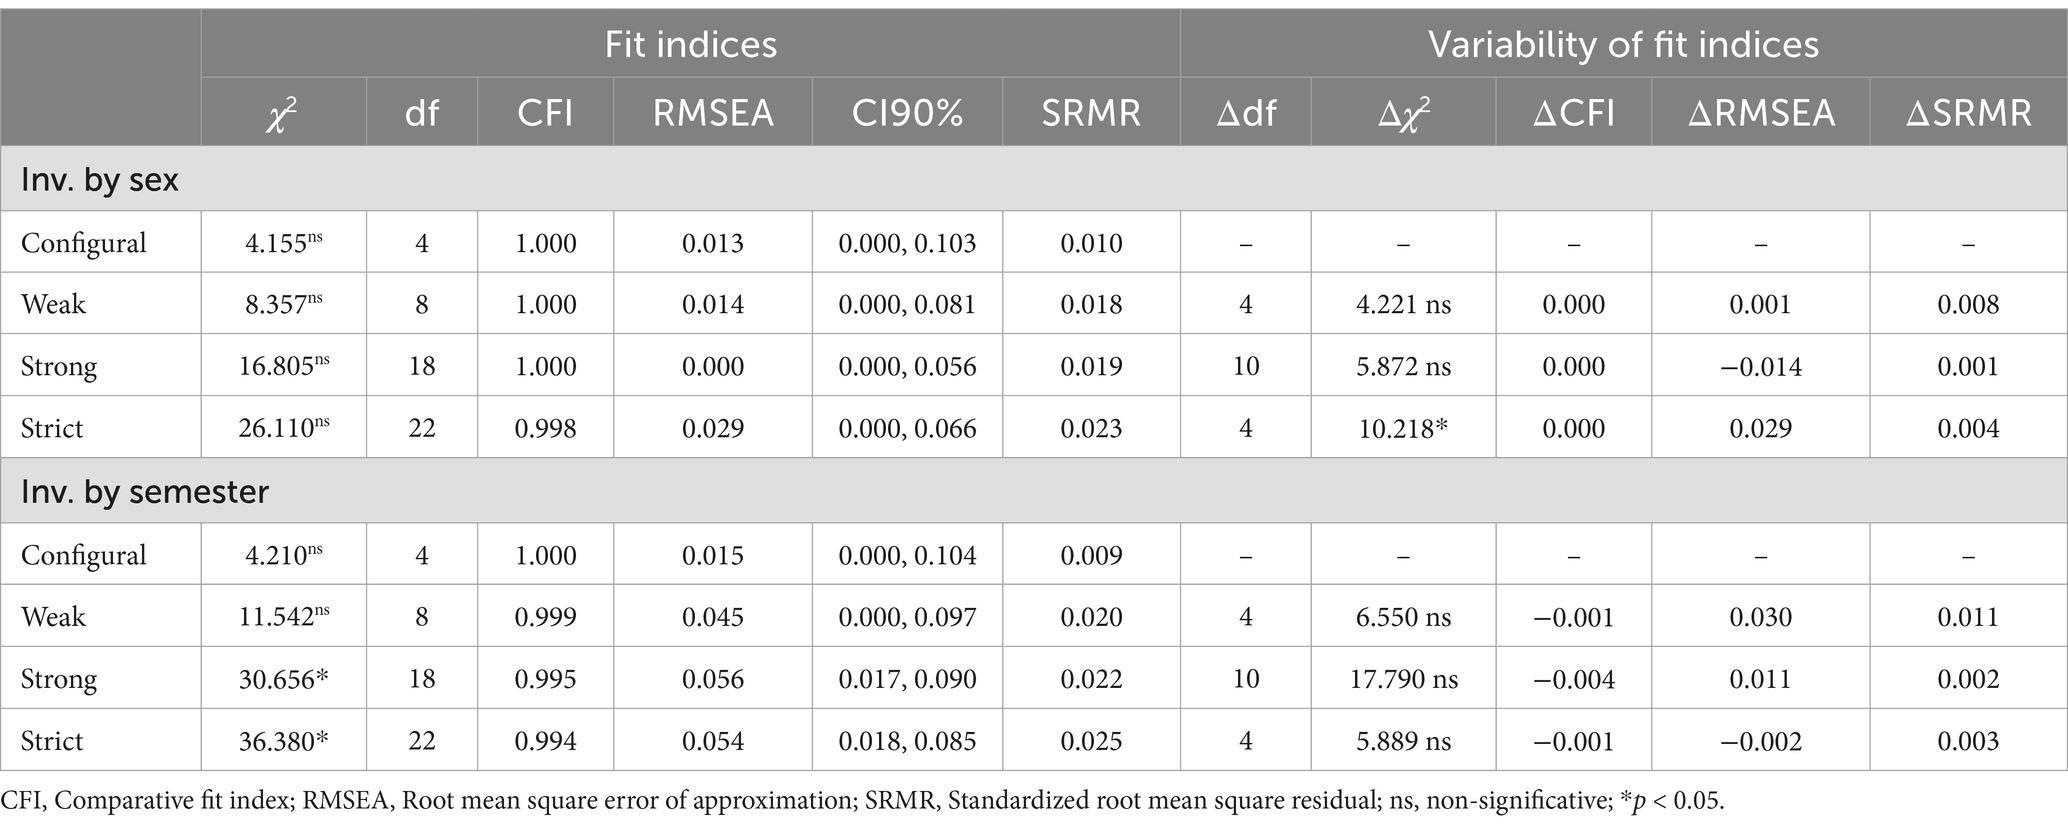
Table 4. Measurement invariance by sex and academic semester: fit indices and variations.
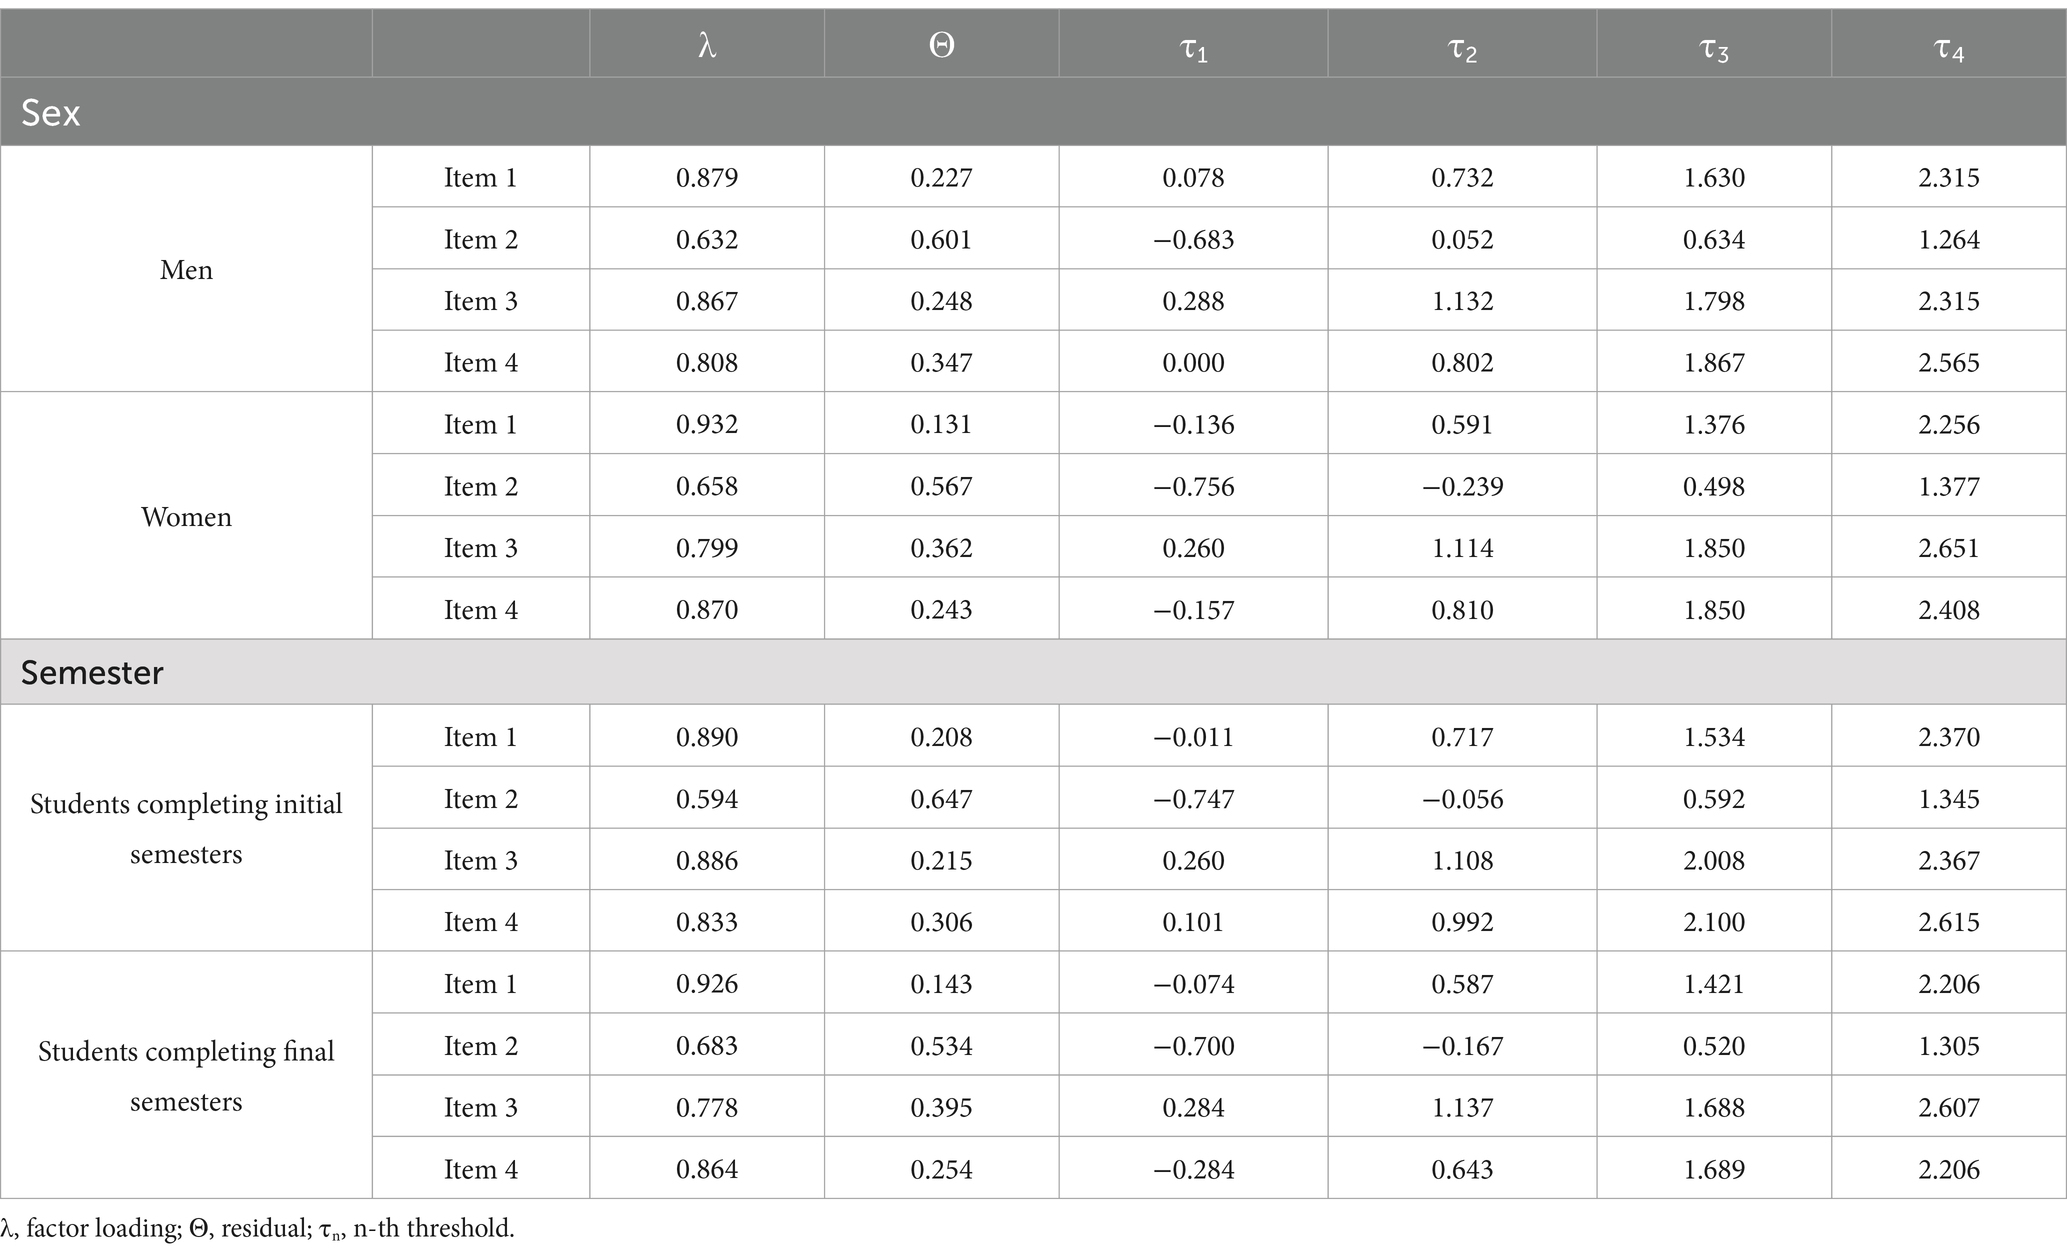
Table 5. Measurement invariance by sex and academic semester: parameters per group.
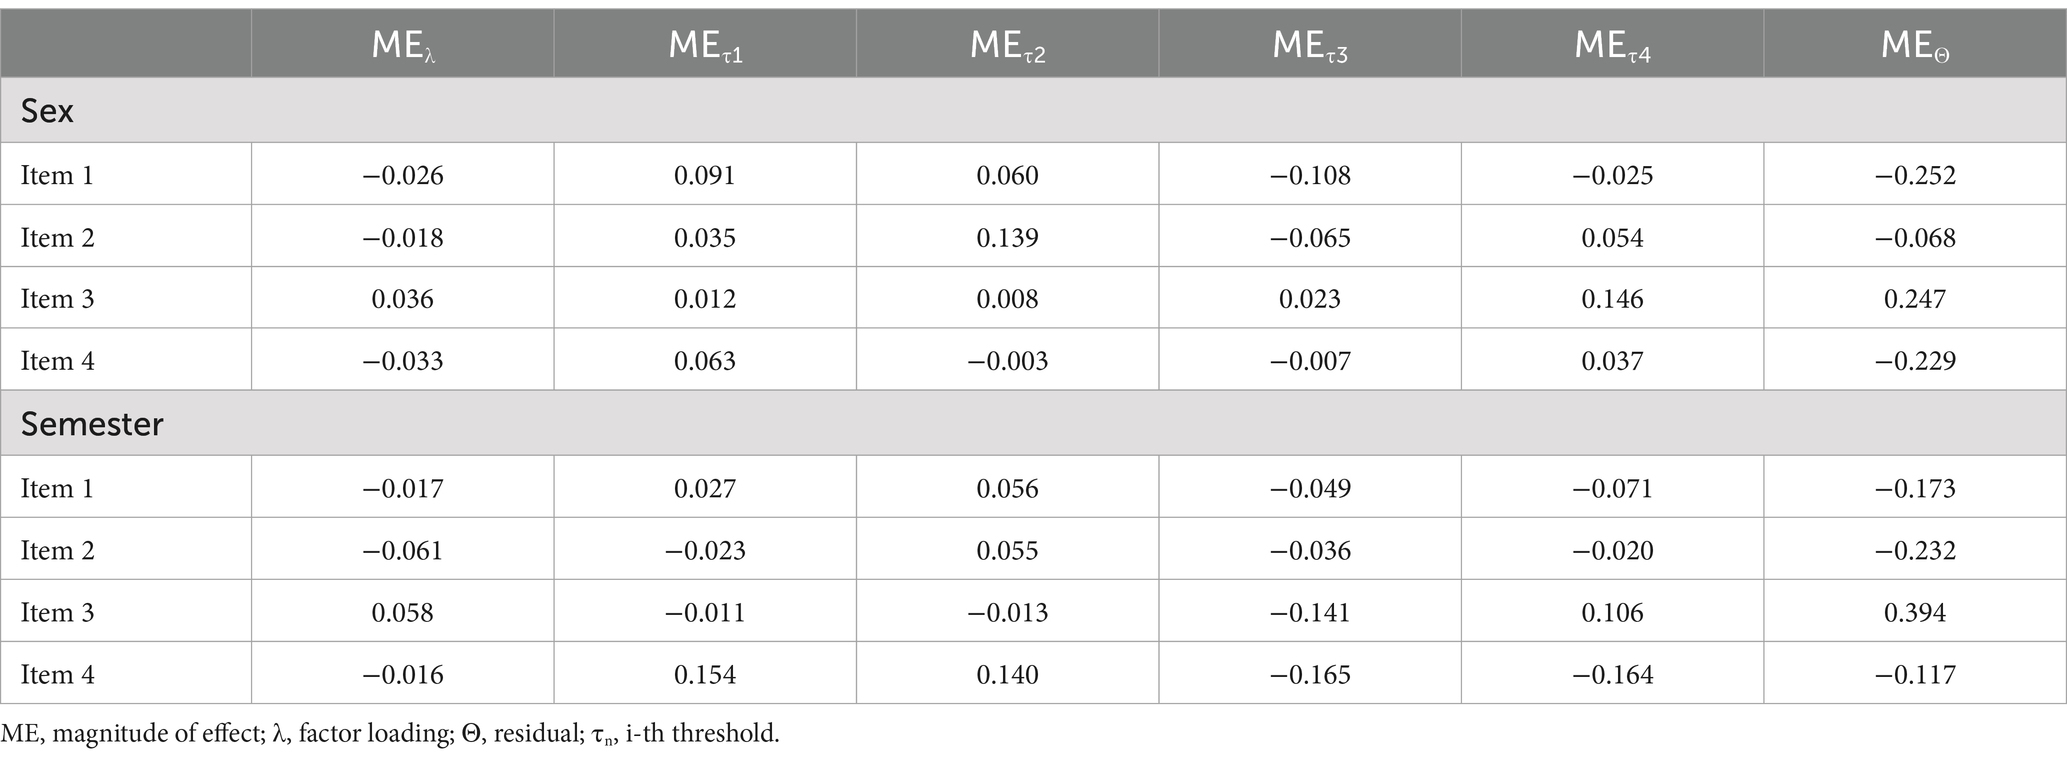
Table 6. Measurement invariance by sex and semester: effect size.
3.3 Reliability
The reliability of the scores (α = 0.806) and reliability of the construct (ω = 0.883) were adequate, which supports the fourth research hypothesis.
3.4 Evidence of validity by association with other variables
The first analysis involved the ADIS items with satisfaction with studies, which indicated an acceptable fit (CFI = 1.000; RMSEA = 0.000, CI90% 0.000, 0.042; SRMR = 0.006). Furthermore, factor loadings were high in all cases, and the ISF indicated that each item is predominantly influenced by its theoretical factor (Table 7), thus supporting the fifth research hypothesis.
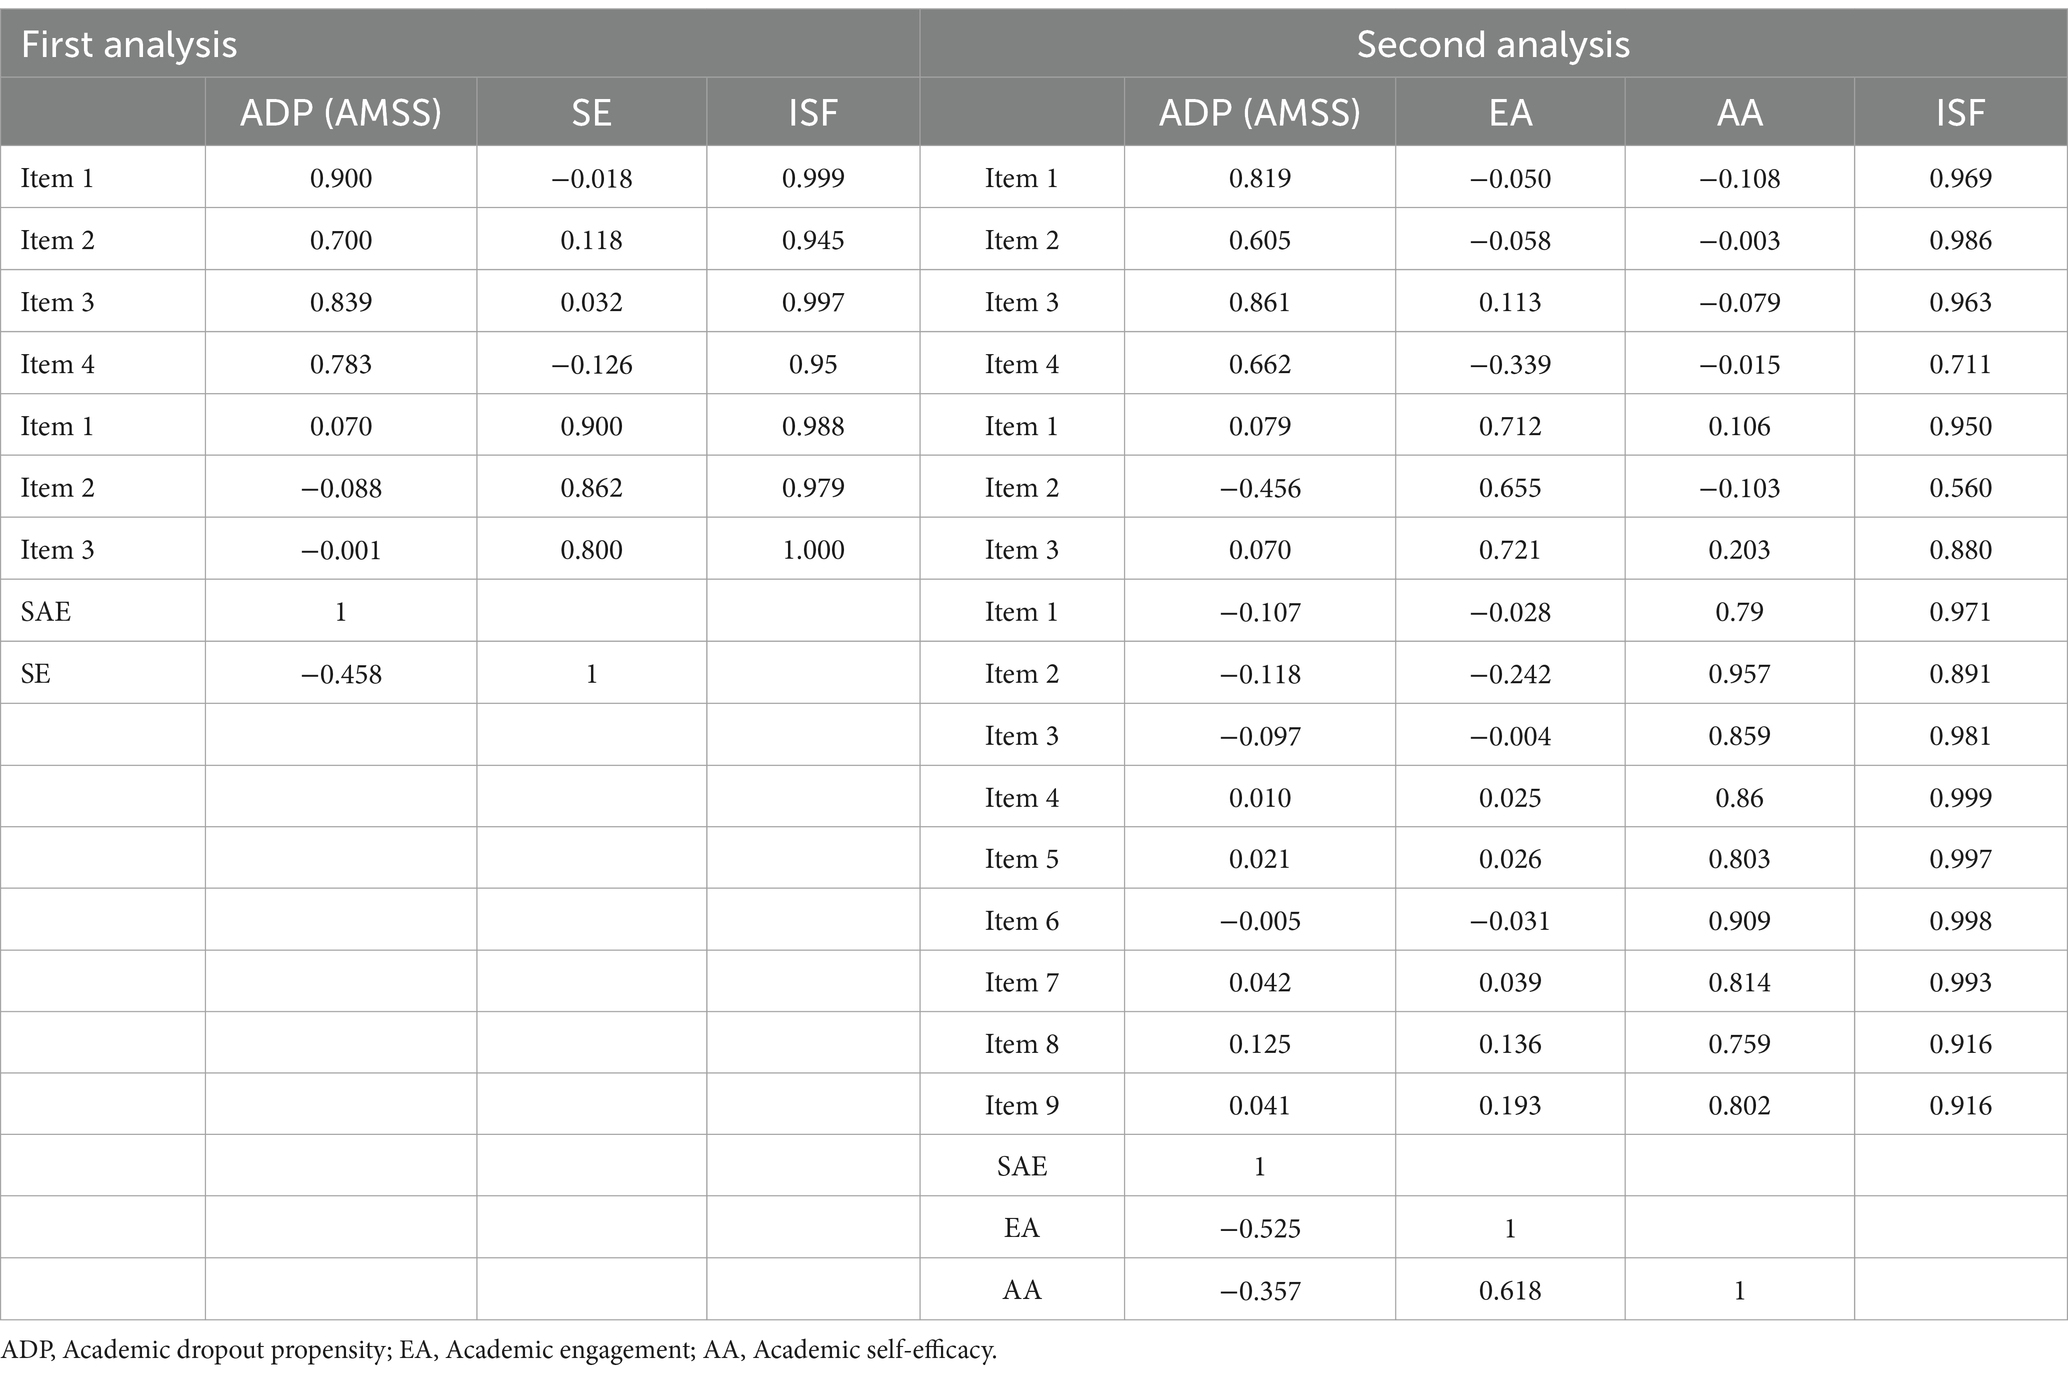
Table 7. Relationship between variables according to the ESEM approach.
A notable fit (CFI = 0.990; RMSEA = 0.070, CI90% 0.060, 0.080; SRMR = 0.021) was also obtained by the second analysis (association of the ADIS items with self-efficacy and engagement). The FSI indicated that each item receives support from its own factor, and the association between constructs was indirect (Table 7), thus supporting the last research hypothesis.
4 Discussion
This study’s purpose was to translate and analyze the psychometric properties of the ADIS among Peruvian university students. During the translation and adaptation process, the term “academic majors,” which is not used in the Peruvian context, was replaced with carrera (career) since this word better represents the meaning related to the specialty students are enrolled in. As a result of the translation process, the completed instrument was approved in terms of its comprehension and clarity by a group of university students who met the inclusion criteria of the study sample.
Regarding the first research hypothesis (ADIS has a one-dimensional structure), the results of the EFA and CFA support a one-dimensional structure. However, after the CFA, items 5 (“I feel good about the career I have selected”), and 6 (“I would like to talk to someone about a career change”), were removed. These results are consistent with previous studies confirming the one-dimensionality of the AMSS (Sacramento et al., 2023), and the fit indices reported in this study are even better.
Specifically, the magnitude of the RMSEA was consistently higher than that reported in previous research that psychometrically evaluated the AMSS in its original version (Sovet et al., 2014; Gür Erdoğan and Arsal, 2015; Silva Soares et al., 2021), even after specifying the correlations between item residuals (Nauta, 2007). In fact, correlations between residuals of direct and inverse items were specified in the studies in which the RMSEA’s magnitude improved (Nauta, 2007; Sovet et al., 2014; Gür Erdoğan and Arsal, 2015). However, this practice lacks theoretical support if these specifications do not help to substantively understand but are only used as a methodological tactic to achieve acceptable fit indices (Dunn et al., 2014). This source of variance does not originate from the construct being evaluated and can be explained by individual participant factors (state or trait) or by instrument-related factors (two or more items with similar error sources, such as wording or shared words). For instance, the study by Sacramento et al. (2023) found that while the correlation between residuals of the inverse and direct items increased the magnitude of the RMSEA, it also affected the parsimony of the factor solution, which led to the removal of items 5 and 6.
Additionally, we consider that the removal of item 5 does not affect the representativeness of the construct being measured, as its content addresses aspects already covered by item 2 (“I wish I was happier with my choice of an academic major”), given that both refer to emotional aspects (“I feel good…” and “I wish I was happier…”) and to the choice of an academic major (“…about the major I’ve selected” and “…with my choice of an academic major”). Moreover, item 5 consistently appeared in multiple suggestions of correlated residuals, which would suggest that its response involves the presence of other aspects such as positive emotions (I feel good…), which is why its removal proved favorable for the internal structure.
On the other hand, the difficulties associated with item 6 (“I would like to talk to someone about changing my major”) may be related to a lack of clarity in its content, as the phrase “talk to someone” is ambiguous and could refer to multiple scenarios. These range from speaking with a friend, parents, or tutors to receive advice and clarify potential vocational doubts, to speaking with university staff to obtain administrative and academic information about changing majors—in other words, when the decision has already been made, and the student seeks to take action. Due to this lack of precision, we believe its removal is the most appropriate course of action, as it has also been removed in other studies (Sacramento et al., 2023).
With the elimination of those items in the present study, three of the remaining four items that compose the AMSS measure career satisfaction in an inverse manner, which can be problematic considering that inverse items have been reported to compromise a construct’s one-dimensionality by secondary sources of variance in addition to affecting the instrument’s reliability and reducing the variance of the scores (Woods, 2006; Suárez-Álvarez et al., 2018). Therefore, the need to remove items 5 and 6 provides an additional argument to support that the AMSS can be a useful instrument to measure academic dropout intention.
Furthermore, this one-dimensional structure is invariant by gender and academic semester, supporting hypotheses 2 (ADIS is invariant by gender) and 3 (ADIS is invariant by academic cycle). In this regard, previous studies had already demonstrated the invariance of the AMSS factor structure for both males and females (Sovet et al., 2014; Silva Soares et al., 2021). Additionally, there is evidence of ADIS’ invariance across academic semesters (students completing initial semesters and students completing final semesters). These findings suggest that the ADIS items have the same meaning for students, regardless of their sex or the academic semester they are completing, so this measure can be used to compare scores between these groups.
On the other hand, the ADIS obtained adequate reliability, which supports hypothesis 4 (ADIS has adequate reliability). While the indices obtained (α = 0.81; ω = 0.88) are below those of the original version (Nauta, 2007) (α = 0.94), they are similar to the ones obtained in the studies conducted by Sovet et al. (2014) (α = 0.87), Gür Erdoğan and Arsal (2015) (α = 0.83), and Silva Soares et al. (2021) (α = 0.87). Further, in the aforementioned studies, including the original version, no correction is reported for the magnitudes of the reliability coefficients in the presence of correlations between the item residuals, which may pose a problem when calculating the alpha coefficient as a major assumption for its calculation would be violated (Meyer, 2010). There is evidence that the higher the number of correlations between residuals in the instrument, the greater the reduction of the chosen reliability coefficient (Dominguez-Lara et al., 2020).
As for the evidence of validity based on its association with other variables, the ADIS is indirectly related to satisfaction with studies (hypothesis 5) and each item is predominantly influenced by its theoretical factor. Thus, despite sharing a common aspect (satisfaction/dissatisfaction), the two measures used can be interpreted independently. Regarding the direction of the relationship between the measures, the findings are consistent with the results in a recent literature review, which concludes that students who are satisfied with their studies are less likely to drop out and that they also have greater motivation, positive academic experiences, and a higher sense of belonging to the university and career they are pursuing (Behr et al., 2020).
The ADIS was found to be indirectly related to academic self-efficacy and academic engagement (hypothesis 6). In fact, considering that academic self-efficacy refers to the students’ confidence in their own abilities to successfully complete academic tasks (Dominguez-Lara et al., 2023), those with high self-efficacy are more likely to face the demands of university life with confidence and persevere to achieve their educational goals, while those with low self-efficacy tend to doubt their own abilities, leading to poor performance, frustration, stress, and a greater likelihood of dropping out of school (Behr et al., 2020). Along these lines, bearing in mind that academic engagement refers to the level of interest, dedication, and involvement of students with their academic activities (Schaufeli et al., 2002), students with high levels of engagement will be more committed and motivated to continue with their education, reducing the risk of dropping out.
These findings are consistent with previous research. In a longitudinal study with engineering students, Lent et al. (2015) found that self-efficacy was the most reliable predictor of academic satisfaction and student retention. Similarly, (Navarro et al., 2019) found that both self-efficacy and academic engagement were directly related to intentions to stay in school by a group of engineering students.
This study’s practical implications are fundamentally related to the fact that it has provided a brief and easy-to-use measurement instrument to be used as a one-dimensional measure of the intention to drop out of college among Peruvian university students. In this way, it will be possible to use it in the educational context for the prevention and addressing of university dropout. Its regular administration in the early stages of university education, as part of institutional policies, will allow the identification of students who regret enrolling in their chosen careers (“I often wish I had not gotten into this major”), those who wish they were happier with that choice (“I wish I was happier with my choice of an academic major”), or those who are considering changing their major (“I am strongly considering changing to another major”). In this way, they could receive the necessary guidance from counselors or academic advisors to make responsible decisions, based on information and self-knowledge. Furthermore, the ADIS will be useful in the context of institutional research, as it can be used by universities to carry out situational diagnoses as a starting point for implementing improvements in their educational programs. Additionally, researchers can use this scale to expand knowledge and understanding of university dropout by developing and evaluating explanatory models that address the needs of specific contexts.
Despite everything, there are some limitations. The first refers to the use of a non-probability sampling, which would hinder the generalization of the results and limit the external validity of the study. Although the results obtained are consistent with previous studies, it is recommended that future research use representative samples of the Peruvian university population, considering a greater diversity of professional careers. Furthermore, considering that Peru is a large country with very different idiosyncrasies and great cultural diversity, it would be appropriate to make linguistic adaptations of the scale that address the specific needs of these contexts.
Secondly, the reliability of the ADIS was explored solely from the perspective of internal consistency, leaving conclusions about the temporal stability of the measure pending. Thirdly, this study did not provide evidence of the ADIS’s predictive validity in relation to its ability to forecast students’ persistence or dropout. Therefore, it is recommended that future research evaluate additional psychometric properties of the proposed instrument, such as reliability by temporal stability, measurement invariance among students from different academic majors, and its predictive capacity regarding actual academic dropout in higher education through longitudinal studies that include both students who remain at the institution and those who drop out. Additionally, it would be enriching to contrast the obtained results with qualitative or mixed-method studies that explore the representativeness of the ADIS items for measuring dropout intention and confirm the dropout intention identified by this scale through semi-structured interviews with the university students who were previously assessed.
Fourthly, the instruments used for data collection are self-report measures, which may introduce biases associated with participants’ social desirability; however, the information collected was not of a sensitive nature, so there is little likelihood that participants were dishonest in providing their responses. Nevertheless, it is recommended that future research consider multimethod techniques for collecting information related to the academic context of university students, such as course attendance percentages, academic averages, or faculty reports, in order to complement the data gathered through self-reports.
In conclusion, the ADIS is a one-dimensional measure that, preliminarily, shows favorable psychometric evidence (robust internal structure, invariant factor structure according to gender and academic cycle, with adequate reliability coefficients, and evidence of a theoretically coherent association with satisfaction with studies, engagement, and academic self-efficacy) among Peruvian university students, although it is necessary for future studies to confirm the suitability of the four-item model and assess its predictive capacity for actual student dropout, with the aim of obtaining conclusive evidence.
Data availability statement
The raw data supporting the conclusions of this article will be made available by the authors, without undue reservation.
Ethics statement
The studies involving humans were approved by Ethics Committee of the Graduate School of Universidad Peruana Unión, with the approval number (Reference: 2023-CE-EPG-00027). The studies were conducted in accordance with the local legislation and institutional requirements. The participants provided their written informed consent to participate in this study.
Author contributions
SL-H: Conceptualization, Project administration, Supervision, Writing – original draft, Writing – review & editing. SD-L: Data curation, Formal analysis, Writing – original draft, Writing – review & editing. IP: Methodology, Project administration, Writing – review & editing. RM: Methodology, Project administration, Writing – review & editing. RE: Conceptualization, Project administration, Supervision, Writing – review & editing.
Funding
The author(s) declare that no financial support was received for the research, authorship, and/or publication of this article.
Conflict of interest
The authors declare that the research was conducted in the absence of any commercial or financial relationships that could be construed as a potential conflict of interest.
Generative AI statement
The author(s) declare that no Gen AI was used in the creation of this manuscript.
Publisher’s note
All claims expressed in this article are solely those of the authors and do not necessarily represent those of their affiliated organizations, or those of the publisher, the editors and the reviewers. Any product that may be evaluated in this article, or claim that may be made by its manufacturer, is not guaranteed or endorsed by the publisher.
Supplementary material
The Supplementary material for this article can be found online at: https://www.frontiersin.org/articles/10.3389/feduc.2025.1519475/full#supplementary-material
References
Asparouhov, T., and Muthén, B. (2006) Robust chi square difference testing with mean and adjusted test statistics. Available at: https://www.statmodel.com/download/webnotes/webnote10.pdf (accessed April 3, 2024).
Asparouhov, T., and Muthén, B. (2009). Exploratory structural equation modeling. Struct. Equ. Model. Multidiscip. J. 16, 397–438. doi: 10.1080/10705510903008204
Behr, A., Giese, M., Teguim Kamdjou, H. D., and Theune, K. (2020). Dropping out of university: a literature review. Rev. Educ. 8, 614–652. doi: 10.1002/rev3.3202
Betz, E. L., Klingensmith, J. E., and Menne, J. W. (1970). The measurement and analysis of college student satisfaction. Measur. Eval. Guidance 3, 110–118. doi: 10.1080/00256307.1970.12022448
Braskamp, L. A., Wise, S. L., and Hengstler, D. D. (1979). Student satisfaction as a measure of departmental quality. J. Educ. Psychol. 71, 494–498. doi: 10.1037/0022-0663.71.4.494
Browne, M. W., and Cudeck, R. (1993). “Alternative ways of assessing model fit” in Testing structural equation models. eds. K. A. Bollen and J. S. Long (London: Sage), 445–455.
Chen, F. F. (2007). Sensitivity of goodness of fit indexes to lack of measurement invariance. Struct. Equ. Model. Multidiscip. J. 14, 464–504. doi: 10.1080/10705510701301834
Chen, H.-C., and Lo, H.-S. (2012). Development and psychometric testing of the nursing student satisfaction scale for the associate nursing programs. J. Nurs. Educ. Pract. 2:25. doi: 10.5430/jnep.v2n3p25
Cimsir, E. (2019). Insight, academic major satisfaction and life satisfaction among college students majoring in education: implications for career counselling. J. Psychol. Couns. Sch. 29, 206–218. doi: 10.1017/jgc.2019.15
Cox, D. W., Bjornsen, A. L., Krieshok, T. S., and Liu, Y. (2016). Occupational engagement and academic major satisfaction: vocational Identity’s mediating role. Career Dev. Q. 64, 169–180. doi: 10.1002/cdq.12049
Dávila-Morán, R. C., Agüero Corzo, E. D. C., Portillo Rios, H., and Quimbita Chiluisa, O. R. (2022). Deserción universitaria de los estudiantes de una universidad peruana. Revista Universidad y Sociedad 14, 421–427.
Dennison, S., and El-Masri, M. M. (2012). Development and psychometric assessment of the undergraduate nursing student academic satisfaction scale (UNSASS). J. Nurs. Meas. 20, 75–89. doi: 10.1891/1061-3749.20.2.75
Domínguez Lara, S., Zavaleta Abad, R. A., Campos Uscanga, Y., and del Moral Trinidad, L. D. M. (2022). Nuevo análisis psicométrico de la Escala de Autorregulación de la Actividad Física en universitarios mexicanos: estructura interna y versión breve (new psychometric analysis of the physical activity self-regulation scale in Mexican college students: inte). Retos 45, 897–907. doi: 10.47197/retos.v45i0.93239
Dominguez-Lara, S. (2018). Propuesta de puntos de corte para cargas factoriales: una perspectiva de fiabilidad de constructo. Enferm. Clin. 28, 401–402. doi: 10.1016/j.enfcli.2018.06.002
Dominguez-Lara, S. (2019). Correlación entre residuales en análisis factorial confirmatorio: una breve guía para su uso e interpretación. Int. Rev. Avances Psicol. 5:e207. doi: 10.24016/2019.v5n3.207
Dominguez-Lara, S., Alarcón-Parco, D., Campos-Uscanga, Y., Tamayo-Agudelo, W., Merino-Soto, C., and Tumino, M. C. (2023). Propiedades psicométricas e invariancia de medida de una escala de autoeficacia académica en estudiantes universitarios de cinco países latinoamericanos. Ciencias Psicol. 17:3051. doi: 10.22235/cp.v17i1.3051
Dominguez-Lara, S. A., Fernández-Arata, M., and Seperak-Viera, R. (2021). Análisis psicométrico de una medida ultra-breve para el engagement académico: UWES-3S. Rev. Argentina Ciencias Comportamiento 13, 25–37. doi: 10.32348/1852.4206.v13.n1.27780
Dominguez-Lara, S., and Merino-Soto, C. (2018). Evaluación de las malas especificaciones en modelos de ecuaciones estructurales. Revista Argentina Ciencias Comportamiento 10, 19–24. doi: 10.32348/1852.4206.v10.n2.19595
Dominguez-Lara, S., and Merino-Soto, C. (2019). ‘Estimación de la magnitud del efecto en invarianza de medición’, Revista Avaliação. Psicológica 18:16248. doi: 10.15689/ap.2019.1803.16248.13
Dominguez-Lara, S. A., Sánchez-Villena, A. R., and Fernández-Arata, M. (2020). Psychometric properties of the UWES-9S in Peruvian college students. Acta Colombiana de Psicología 23, 7–39. doi: 10.14718/ACP.2020.23.2.2
Dunn, T. J., Baguley, T., and Brunsden, V. (2014). From alpha to omega: a practical solution to the pervasive problem of internal consistency estimation. Br. J. Psychol. 105, 399–412. doi: 10.1111/bjop.12046
Escalante López, J. I., Medina Valderrama, C. J., and Vásquez Muñoz, A. (2023). La deserción universitaria: un problema no resuelto en el Perú. Hacedor - AIAPÆC 7, 60–72. doi: 10.26495/rch.v7i1.2421
Ferrando, P. J., and Lorenzo-Seva, U. (2017). Program FACTOR at 10: origins, development and future directions. Psicothema 29, 236–240. doi: 10.7334/psicothema2016.304
Fleming, J. S., and Merino Soto, C. (2005). Medidas de simplicidad y de ajuste factorial: un enfoque para la evaluación de escalas construidas factorialmente. Revista Psicol. 23, 250–266. doi: 10.18800/psico.200502.002
Graunke, S. S., and Woosley, S. A. (2005). An exploration of the factors that affect the academic success of college sophomores. Coll. Stud. J. 39, 367–377.
Gravetter, F. J., and Wallnau, L. B. (2013). “Introduction to statistics” in Statistics for the behavioral sciences. eds. J. Hague, T. Matray, T. Williams, and L. Sarkisian (Boston, MA: Cengage Learning), 3–36.
Guillemin, F., Bombardier, C., and Beaton, D. (1993). Cross-cultural adaptation of health-related quality of life measures: literature review and proposed guidelines. J. Clin. Epidemiol. 46, 1417–1432. doi: 10.1016/0895-4356(93)90142-N
Gür Erdoğan, D., and Arsal, Z. (2015). The adaptation of academic major satisfaction scale to Turkish: the validity and reliability study. Int. J. Hum. Sci. 12:966. doi: 10.14687/ijhs.v12i1.3219
Hu, L., and Bentler, P. M. (1999). Cutoff criteria for fit indexes in covariance structure analysis: conventional criteria versus new alternatives. Struct. Equ. Model. Multidiscip. J. 6, 1–55. doi: 10.1080/10705519909540118
Hu, H., Wang, C., Lan, Y., and Wu, X. (2022). Nurses’ turnover intention, hope and career identity: the mediating role of job satisfaction. BMC Nurs. 21:43. doi: 10.1186/s12912-022-00821-5
Instituto Nacional de Estadística e Informática (2010). II Censo Nacional Universitario 2010. Available at: https://censos.inei.gob.pe/cenaun/redatam_inei/ (accessed May 2, 2024).
Instituto Nacional de Estadística e Informática (2024) Educación universitaria. Available at: https://m.inei.gob.pe/estadisticas/indice-tematico/university-tuition/ (accessed May 2, 2024).
Kim, Y. L., and Lee, S. M. (2015). Effect of satisfaction in major at university on academic achievement among physical therapy students. J. Phys. Ther. Sci. 27, 405–409. doi: 10.1589/jpts.27.405
Lent, R. W., Miller, M. J., Smith, P. E., Watford, B. A., Hui, K., and Lim, R. H. (2015). Social cognitive model of adjustment to engineering majors: longitudinal test across gender and race/ethnicity. J. Vocat. Behav. 86, 77–85. doi: 10.1016/j.jvb.2014.11.004
Lodi, E., Boerchi, D., Magnano, P., and Patrizi, P. (2017). College satisfaction scale (CSS): evaluation of contextual satisfaction in relation to college student life satisfaction and academic performance. Appl. Psychol. Bullet. 279, 51–64.
McDonald, R. P., and Ho, M.-H. R. (2002). Principles and practice in reporting structural equation analyses. Psychol. Methods 7, 64–82. doi: 10.1037/1082-989X.7.1.64
McIlveen, P., Beccaria, G., and Burton, L. J. (2013). Beyond conscientiousness: career optimism and satisfaction with academic major. J. Vocat. Behav. 83, 229–236. doi: 10.1016/j.jvb.2013.05.005
Medrano, L., and Pérez, E. R. (2010). Adaptación de la escala de satisfacción académica a la población universitaria de Córdoba. Suma Psicológica UST 7, 5–14. doi: 10.18774/448x.2010.7.117
Merino-Soto, C., Dominguez-Lara, S., and Fernández-Arata, M. (2017). Validación inicial de una Escala Breve de Satisfacción con los Estudios en estudiantes universitarios de Lima. Educación Médica 18, 74–77. doi: 10.1016/j.edumed.2016.06.016
Milsom, A., and Coughlin, J. (2017). Examining person–environment fit and academic major satisfaction. J. Coll. Couns. 20, 250–262. doi: 10.1002/jocc.12073
Muthén, L. K., and Muthén, B. O. (2019). Mplus User’s guide. 8th Edn. New York, NY: Muthén & Muthén.
Nauta, M. M. (2007). ‘Assessing college students’ satisfaction with their academic majors’. J. Career Assess. 15, 446–462. doi: 10.1177/1069072707305762
Navarro, R. L., Flores, L. Y., Legerski, J. P., Brionez, J., May, S. F., Suh, H. N., et al. (2019). Social cognitive predictors of engineering students’ academic persistence intentions, satisfaction, and engagement. J. Couns. Psychol. 66, 170–183. doi: 10.1037/cou0000319
Ojeda, L., Flores, L. Y., and Navarro, R. L. (2011). Social cognitive predictors of Mexican American college students’ academic and life satisfaction. J. Couns. Psychol. 58, 61–71. doi: 10.1037/a0021687
Palenzuela, D. L. (2012). Construcción y validación de una escala de autoeficacia percibida específica de situaciones académicas. Análisis Modificación Conducta 9:1649. doi: 10.33776/amc.v9i21.1649
Pendergast, L. L., von der Embse, N., Kilgus, S. P., and Eklund, K. R. (2017). Measurement equivalence: a non-technical primer on categorical multi-group confirmatory factor analysis in school psychology. J. Sch. Psychol. 60, 65–82. doi: 10.1016/j.jsp.2016.11.002
Ponterotto, J. G., and Charter, R. A. (2009). Statistical extensions of Ponterotto and Ruckdeschel’s (2007) reliability matrix for estimating the adequacy of internal consistency coefficients. Percept. Mot. Skills 108, 878–886. doi: 10.2466/pms.108.3.878-886
Pornprasertmanit, S. (2022) A Note on Effect Size for Measurement Invariance. Available at: http://cran.irsn.fr/web/packages/semTools/vignettes/partialInvariance.pdf (accessed April 3, 2024).
Rahmatpour, P., Sharif Nia, H., and Peyrovi, H. (2019). Evaluation of psychometric properties of scales measuring student academic satisfaction: a systematic review. J. Educ. Health Prom. 8:256. doi: 10.4103/jehp.jehp_466_19
Ramsden, P. (1991). A performance indicator of teaching quality in higher education: the course experience questionnaire. Stud. High. Educ. 16, 129–150. doi: 10.1080/03075079112331382944
Raykov, T. (2001). Bias of coefficient afor fixed congeneric measures with correlated errors. Appl. Psychol. Meas. 25, 69–76. doi: 10.1177/01466216010251005
Raykov, T., and Hancock, G. R. (2005). Examining change in maximal reliability for multiple-component measuring instruments. Br. J. Math. Stat. Psychol. 58, 65–82. doi: 10.1348/000711005X38753
Reed, J. G., Lahey, M. A., and Downey, R. G. (1984). Development of the college descriptive index: a measure of student satisfaction. Meas. Eval. Couns. Dev. 17, 67–82. doi: 10.1080/07481756.1984.12022750
Rudolph, C. W., Lavigne, K. N., and Zacher, H. (2017). Career adaptability: a meta-analysis of relationships with measures of adaptivity, adapting responses, and adaptation results. J. Vocat. Behav. 98, 17–34. doi: 10.1016/j.jvb.2016.09.002
Sacramento, A. M., Rodrigues, G. R., Oliveira, I. M., and Teixeira, M. A. P. (2023). Escala de Satisfação com Escolha do Curso: Adaptação e Evidências de Validade. Psico-USF 28, 239–251. doi: 10.1590/1413-82712023280203
Sánchez-Villena, A. R., Domínguez-Lara, S., Aranda, M., Fuentes Gutiérrez, V., and García-Domingo, M. (2021). Análisis estructural de la Escala de Dependencia y Adicción al Smartphone (EDAS) en universitarios peruanos. Health and Addictions 21, 93–113. doi: 10.21134/haaj.v21i2.572
Saris, W. E., Satorra, A., and van der Veld, W. M. (2009). Testing structural equation models or detection of misspecifications? Struct. Equ. Model. Multidiscip. J. 16, 561–582. doi: 10.1080/10705510903203433
Savickas, M. L. (2005). “The theory and practice of career construction” in Career development and counseling: Putting theory and research to work. eds. S. D. Brown and R. W. Lent (London: John Wiley & Sons, Inc), 42–70.
Schaufeli, W. B., Martínez, I. M., Pinto, A. M., Salanova, M., and Bakker, A. B. (2002). Burnout and engagement in university students. J. Cross-Cult. Psychol. 33, 464–481. doi: 10.1177/0022022102033005003
Schreiner, L. A., and Juillerat, S. L. (1993). The student satisfaction inventory. Cedar Rapids, IA: Inventory Noel-Levitz.
Secretaria Nacional de la Juventud (SENAJU) (2021). Informe Nacional de Juventudes. Reactivación económica y brechas pendientes. Available at: https://juventud.gob.pe/wp-content/uploads/2022/12/Informe-Nacional-de-Juventudes-2021-Reactivacion-economica-y-brechas-pendientes.pdf (accessed May 2, 2024).
Silva Soares, A. K., da Silva Nascimento, B., da Silva, J. S., da Cruz Serejo Barbosa, N., and Fernandes Kamazaki, D. (2021). Psychometric properties of the academic major satisfaction scale (AMSS) in Brazilian college students. Revista Psicol. 39, 229–252. doi: 10.18800/psico.202101.010
Sovet, L., Park, M. S.-A., and Jung, S. (2014). Validation and psychometric properties of academic major satisfaction scale among Korean college students. Soc. Indic. Res. 119, 1121–1131. doi: 10.1007/s11205-013-0537-y
Suárez-Álvarez, J., Pedrosa, I., Lozano, L. M., García-Cueto, E., Cuesta, M., and Muñiz, J. (2018). Using reversed items in Likert scales: a questionable practice. Psicothema 30, 149–158. doi: 10.7334/psicothema2018.33
Super, D. E. (1953). A theory of vocational development. Am. Psychol. 8, 185–190. doi: 10.1037/h0056046
Super, D. E. (1980). A life-span, life-space approach to career development. J. Vocat. Behav. 16, 282–298. doi: 10.1016/0001-8791(80)90056-1
Superintendencia Nacional de Educación Superior Universitaria (SUNEDU) (2021). III Informe bienal sobre la realidad universitaria en el Perú. Available at: https://cdn.www.gob.pe/uploads/document/file/3018068/III%20Informe%20Bienal.pdf (accessed May 2, 2024).
Timmerman, M. E., and Lorenzo-Seva, U. (2011). Dimensionality assessment of ordered Polytomous items with parallel analysis. Psychol. Methods 16, 209–220. doi: 10.1037/a0023353
Keywords: academic majors, academic satisfaction, career satisfaction, dropout intention, psychometric properties, university students
Citation: Lingán-Huamán SK, Dominguez-Lara S, Postillos IO, Medina RM and Esteban RFC (2025) Academic major satisfaction scale: psychometric properties and proposal for a measure of academic dropout intention. Front. Educ. 10:1519475. doi: 10.3389/feduc.2025.1519475
Edited by:
Ana Karla Silva Soares, Federal University of Mato Grosso do Sul, BrazilReviewed by:
Eduardo Hernández-Padilla, Autonomous University of the State of Morelos, MexicoDiego Boerchi, Catholic University of the Sacred Heart, Italy
Aleixandre Brian Duche-Pérez, Catholic University of Santa María, Peru
Copyright © 2025 Lingán-Huamán, Dominguez-Lara, Postillos, Medina and Esteban. This is an open-access article distributed under the terms of the Creative Commons Attribution License (CC BY). The use, distribution or reproduction in other forums is permitted, provided the original author(s) and the copyright owner(s) are credited and that the original publication in this journal is cited, in accordance with accepted academic practice. No use, distribution or reproduction is permitted which does not comply with these terms.
*Correspondence: Susana K. Lingán-Huamán, a2xpbmdhbkB1c2lsLmVkdS5wZQ==; a3N1c2FuYWxpbmdhbjM5QGdtYWlsLmNvbQ==