 Troy J. Smith
 Jason Ross
 Charles R. Breese
 Melissa A. Burmeister
- 1Department of Pharmacy Practice, William Carey University School of Pharmacy, Biloxi, MS, United States
- 2Higher Education Administration Program, William Carey University, Hattiesburg, MS, United States
- 3Department of Pharmaceutical Sciences, William Carey University School of Pharmacy, Biloxi, MS, United States
PharmD programs face the growing challenge of students matriculating with a lack of academic preparedness, particularly in the foundational sciences. One key component of pharmacy is organic chemistry. Here, we determined if the setting of where undergraduate organic chemistry coursework is taken [i.e., 4-year university (U) vs. community college (CC)], is associated with varied academic outcomes in an accelerated Doctor of Pharmacy program. Five student cohorts representing a total of 180 graduates were analyzed. Graduates were first divided into those who studied undergraduate organic chemistry I and II at a U vs. CC and the pharmacy year 1 (PY1) and pharmacy year 2 (PY2) grade point averages (GPAs) compared. Students were then dichotomized into two subcategories based on whether they received an above average (i.e., A or B) or average (i.e., C) grade in organic chemistry I or II. Linear regression analysis was performed to determine whether performance in undergraduate organic chemistry is associated with programmatic GPA. PY1 and PY2 GPAs reflecting the didactic curriculum did not differ between students who took organic chemistry I and II at a U vs. C. The grade distributions in both organic chemistry I and II differed between U vs. CC, with more average grades received at a U. Institution type was not associated with differences in GPA outcomes. However, average performance in organic chemistry I was associated with lower PY1 and PY2 GPAs. Taken together, admissions committees should consider using performance in undergraduate organic chemistry I when evaluating an applicant’s academic readiness.
Introduction
Over the past several years, pharmacy school enrollment nationally has steadily declined, possibly pressing programs to accept students whose academic qualifications are either at or closer to their minimum requirements and subsequently jeopardizing academic success and on-time graduation. Traditionally, undergraduate GPA (particularly science and math GPA), Pharmacy College Admission Test (PCAT) and other standardized test scores, completion of advanced science and math coursework, attendance of a 4-year university, student type (internal vs. transfer), bachelor’s degree conferral, and interview day performance have all been identified as positive predictors of academic success in pharmacy school as well as passing the North American Pharmacist Licensure Examination (NAPLEX) on the first attempt, albeit with variable predictive validity (i.e., how strongly each variable correlates to these future outcome) (Allen and Bond, 2001; Allen et al., 2016; Chisholm et al., 1995; Chisholm et al., 1997; Chisholm et al., 1999; Chisholm, 2001; Hardigan et al., 2001; Kelley et al., 2001; Kuncel et al., 2005; Lobb and Wilkin, 2003; McCall et al., 2007; Meagher et al., 2006; Meagher et al., 2011; Renzi et al., 2007; Schauner et al., 2013; Steinberg and Morin, 2015; Tejada et al., 2016; Thomas and Draugalis, 2002). The impact of gender, race/ethnicity, age, and socioeconomic disadvantage, including first-generation student status as well as English as a Second Language (ESL), on success in pharmacy school has also been examined (Allen and Diaz, 2013; Carroll and Garavalia, 2002; Cor and Brocks, 2018; Lounsbury et al., 2023; Wu-Pong and Windridge, 1997).
Specifically, science and math GPA as well as scores on the quantitative analysis and chemistry sections of the PCAT are predictive of improved academic outcomes in students taking a provisional vs. traditional pathway to a Doctor of Pharmacy (Schauner et al., 2013). Furthermore, scores on the math and chemistry sections of the PCAT are predictive of success in the first year of pharmacy school (Thomas and Draugalis, 2002). Earning a 4-year college degree is also associated with improved academic performance in pharmacy school, including on-time graduation (Allen et al., 2016). Performance in foundational science coursework, including biology I and II, general chemistry I and II, organic chemistry I and II, physiology I, as well as physics, is predictive of a student’s achievement level (Crow et al., 2018). High grades in advanced biology and biochemistry also correlate with improved academic performance in pharmacy school (Allen et al., 2016). Lower grades in organic chemistry are associated with an increased risk of being placed on academic probation, whereas higher grades are associated with increased success (Houglum et al., 2005). Of note, some studies report no impact of taking advanced-level science coursework, such as chemistry, biology, and math, on improved pharmacy school success (Cor and Brocks, 2018). Scholastic Aptitude Test (SAT) verbal scores and ESL have no bearing on a student’s success (Wu-Pong and Windridge, 1997).
The PCAT has been phased out entirely in the 2024–2025 pharmacy application cycle, so pharmacy school admissions committees have sought to identify alternative predictors of student academic preparedness. In this effort, many schools assess applicants using a holistic approach, whereby criteria other than PCAT score and GPA, such as socioeconomic background, gender, race/ethnicity, extracurricular activities, and life experiences, are considered (Carroll and Garavalia, 2002; Spivey et al., 2020). Female gender is positively correlated with academic success, whereas maturity (defined as being more than two standard deviations older than the average student) is correlated with lower academic performance (Cor and Brocks, 2018). The extent to which non-traditional factors, such as professionalism, empathy and motivation, affect academic performance remains inconclusive (Latif, 2005).
There has been less investigation on whether performance in organic chemistry I and II is associated with improved academic outcomes in pharmacy school. Anecdotally, there remains unfounded contention that the rigor of science prerequisite coursework offered at a community college (CC) is lower than that at a 4-year university (U) and that students coming from a CC are less prepared. Many students choose to complete pharmacy school prerequisites at a CC for logistical and/or financial reasons (Lobb and Wilkin, 2003). Although students who attend a CC have higher undergraduate science and math GPAs, students who attend a U, regardless of degree attainment, have higher PCAT scores, first-year pharmacy GPAs, and on-time graduation rates (Lobb and Wilkin, 2003; Steinberg and Morin, 2015). McCall et al. (2007) determined that multiple pre-pharmacy variables, including performance in organic chemistry, did not correlate with pharmacy school success in terms of GPA, irrespective of whether the students had an educational background at a U or CC (McCall et al., 2006). The authors also determined that organic chemistry taken at a U correlated with higher PCAT chemistry scores but not first-time NAPLEX pass rates (McCall et al., 2007). Collectively, these data could imply that students who attend a CC may lack the foundational knowledge required to succeed in pharmacy school (Lobb and Wilkin, 2003; Steinberg and Morin, 2015).
The present study was conducted at William Carey University School of Pharmacy, a private school in the southeastern United States, which offers an accelerated 3-year Doctor of Pharmacy program. The School’s inaugural class matriculated in 2018, and there have currently been five student cohorts that have completed the didactic portion of the curriculum. Here, we assessed whether performance in undergraduate organic chemistry I and II and/or if the setting in which a pharmacy school applicant studies organic chemistry (i.e., U vs. CC) are associated with academic success in an accelerated school of pharmacy. We also compared pre-pharmacy GPAs between U and CC students. We report that C grade-level performance in organic chemistry I, but not organic chemistry II, is associated with lower pharmacy year 1 (PY1) and pharmacy year 2 (PY2) GPAs. However, institution type is not associated with differences in overall pharmacy year 1 (PY1) and pharmacy year 2 (PY2) GPA.
Methods
Academic outcomes for five cohorts of students who matriculated between 2018 and 2022 were analyzed. Inclusion criteria were organic chemistry I and organic chemistry II taken solely at a U or CC and grades of a C- or better with the first attempt. Exclusion criteria were organic chemistry I and organic chemistry II taken at a U and CC and grades lower than a C- [i.e., retake(s) required]. Students who did not progress to pharmacy year 3 (PY3) Advanced Pharmacy Practice Experiences (APPEs) or who experienced delayed APPEs (e.g., leave of absence) were also excluded from the primary analysis. Eligible on-time students were first separated into two groups based on institution type of U or CC. For each group, pre-pharmacy overall, prerequisite, and science and math GPA were calculated. The percentage of students earning an A, B, or C grade in organic chemistry I and II at either a U or CC was determined. PY1 and PY2 GPA, which represent outcomes for the didactic (vs. experiential) portion of the curriculum, were also calculated. This same protocol was performed for non-progressing students, with the exception that D grades were assessed and PY1 and PY2 GPA were not calculated. For simplicity, performance in organic chemistry I and II was then categorized as either above average (i.e., A or B grade) or average (i.e., C grade).
Statistical analyses were performed using Graph Pad Prism (v. 8.3.1) and IBM SPSS Statistical (vs. 29.0.2.0) software. For categorical variables, a chi-squared test was performed to determine differences between groups. For continuous variables, an independent (unpaired) student’s t-test was performed; data are presented as mean ± standard error of the mean (SEM). Standard deviation (SD) is also provided for outcomes data. A two-way multivariate analysis of variance (2W-MANOVA) linear regression analysis was performed to determine the main effect and interactive effects of institution type, organic chemistry I category, and organic chemistry II category on PY1 and PY2 GPA. A 2W-MANOVA statistical test is applicable here because it examines differences across multiple continuous dependent variables (i.e., PY1 GPA and PY2 GPA) while considering one or more independent variables (i.e., institution type, performance in Organic Chemistry I and II), including how the independent variables may interact to affect the dependent variables. Effect size, calculated as Cohen’s d, was determined for all t-test and linear regression analyses. Effect size was interpreted as very small (0.00–0.19); small (0.20–0.49); medium (0.50–0.79); and large (≥0.80). Statistical power for regression analysis was calculated using the following parameters: power = 0.80, effect size = 0.15; total number of predictors in the model = 3; number of test predictors = 3). Statistical significance was set to p < 0.05.
Results
A total of 256 students from five cohorts matriculated between 2018 (i.e., Class of 2021) and 2022 (i.e., Class of 2025) (Figure 1). A total of 77 students were excluded, leaving 179 students eligible for analysis (Figure 1). A total of 107 students completed their organic chemistry prerequisite coursework at a U, whereas 72 did so at a CC (Figure 1). The study met statistical power, as power analysis determined that the minimum sample size required to detect an effect was 77. Pre-pharmacy overall, prerequisite, and science and math GPA are presented in Table 1. Similar to previous reports, science and math GPA for on-time students was higher (albeit statistically insignificant, p = 0.061) for CC vs. U attendees (3.40 ± 0.05 and 3.28 ± 0.04, respectively; Cohen’s d = 0.280; effect size: small). The grade distributions for both organic chemistry I and II differed between U and CC (p = 0.003 and < 0.001, respectively) (Table 1). These differences could be attributable to the fact that a larger percentage of CC students received an A or B in organic chemistry I and II (95.83 and 93.05%, respectively) vs. U students (77.57 and 69.16%, respectively) (Table 1). Furthermore, a larger percentage of U students received a C in organic chemistry I and II (22.43 and 30.84%) vs. CC students (4.17 and 6.94%, respectively). However, PY1 and PY2 were not different between U and CC students (3.30 ± 0.05 vs. 3.26 ± 0.06, Cohen’s d = 0.078, effect size: very small and 3.25 ± 0.05 vs. 3.24 ± 0.06, Cohen’s d = 0.018, effect size: very small, respectively) (Figure 2 and Table 1). Interestingly, pre-pharmacy science and math GPA for non-progressing students was lower than for progressing students within both institution types (U: 3.06 ± 0.13 vs. 3.28 ± 0.04, p = 0.086; Cohen’s d = 0.475; effect size: small; CC: 3.15 ± 0.08 vs. 3.40 ± 0.05, p = 0.023; Cohen’s d = 0.573; effect size: medium) (Table 1). Furthermore, a greater percentage of non-progressing students who attended a CC earned a C-level grade in organic chemistry I and II compared to on-time students (organic chemistry I: 44.44 vs. 4.17%; organic chemistry II: 44.44 vs. 6.95%, respectively). These findings indicate that poor performance in undergraduate science and math coursework at a CC could increase a student’s risk of not progressing. The data were normally distributed, and there were equal variances across samples, allowing for parametric statistical analysis. Linear regression analysis determined that weaker (i.e., C grade) performance in organic chemistry I, regardless of institution type, was associated with worse didactic curriculum outcomes in terms of PY1 and PY2 GPA (p = 0.034 and 0.020, respectively) (Table 2). However, institution type, organic chemistry II category, and interactions between all main variables (i.e., including organic chemistry I category), were not associated with varied PY1 and PY2 GPA outcomes (Table 2). Effect size was very small for all 2W-MANOVA analyses.
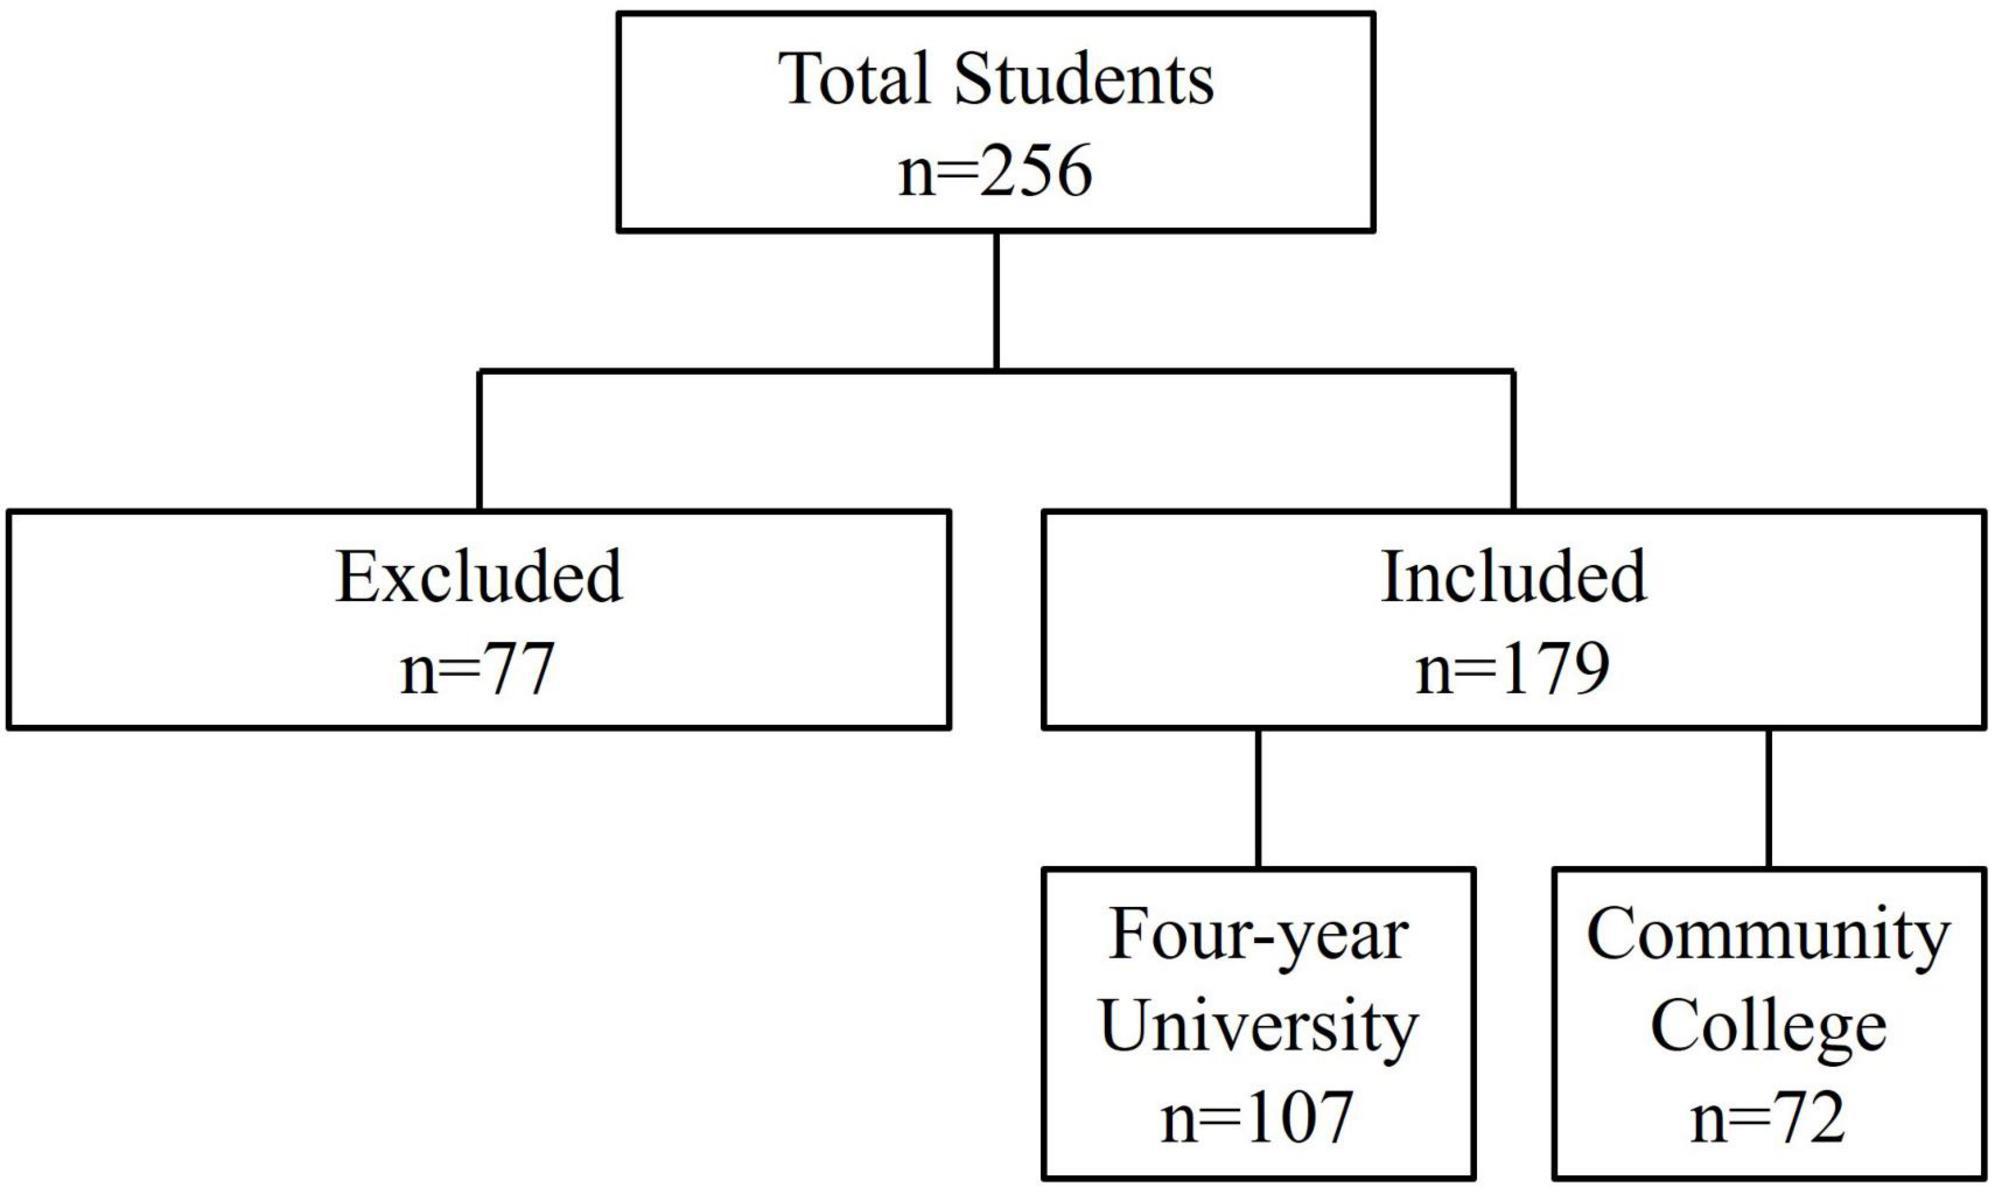
Figure 1. Study enrollment data. A total of 179 students were included in the study, with 107 students in the 4-year university group and 72 students in the community college group.
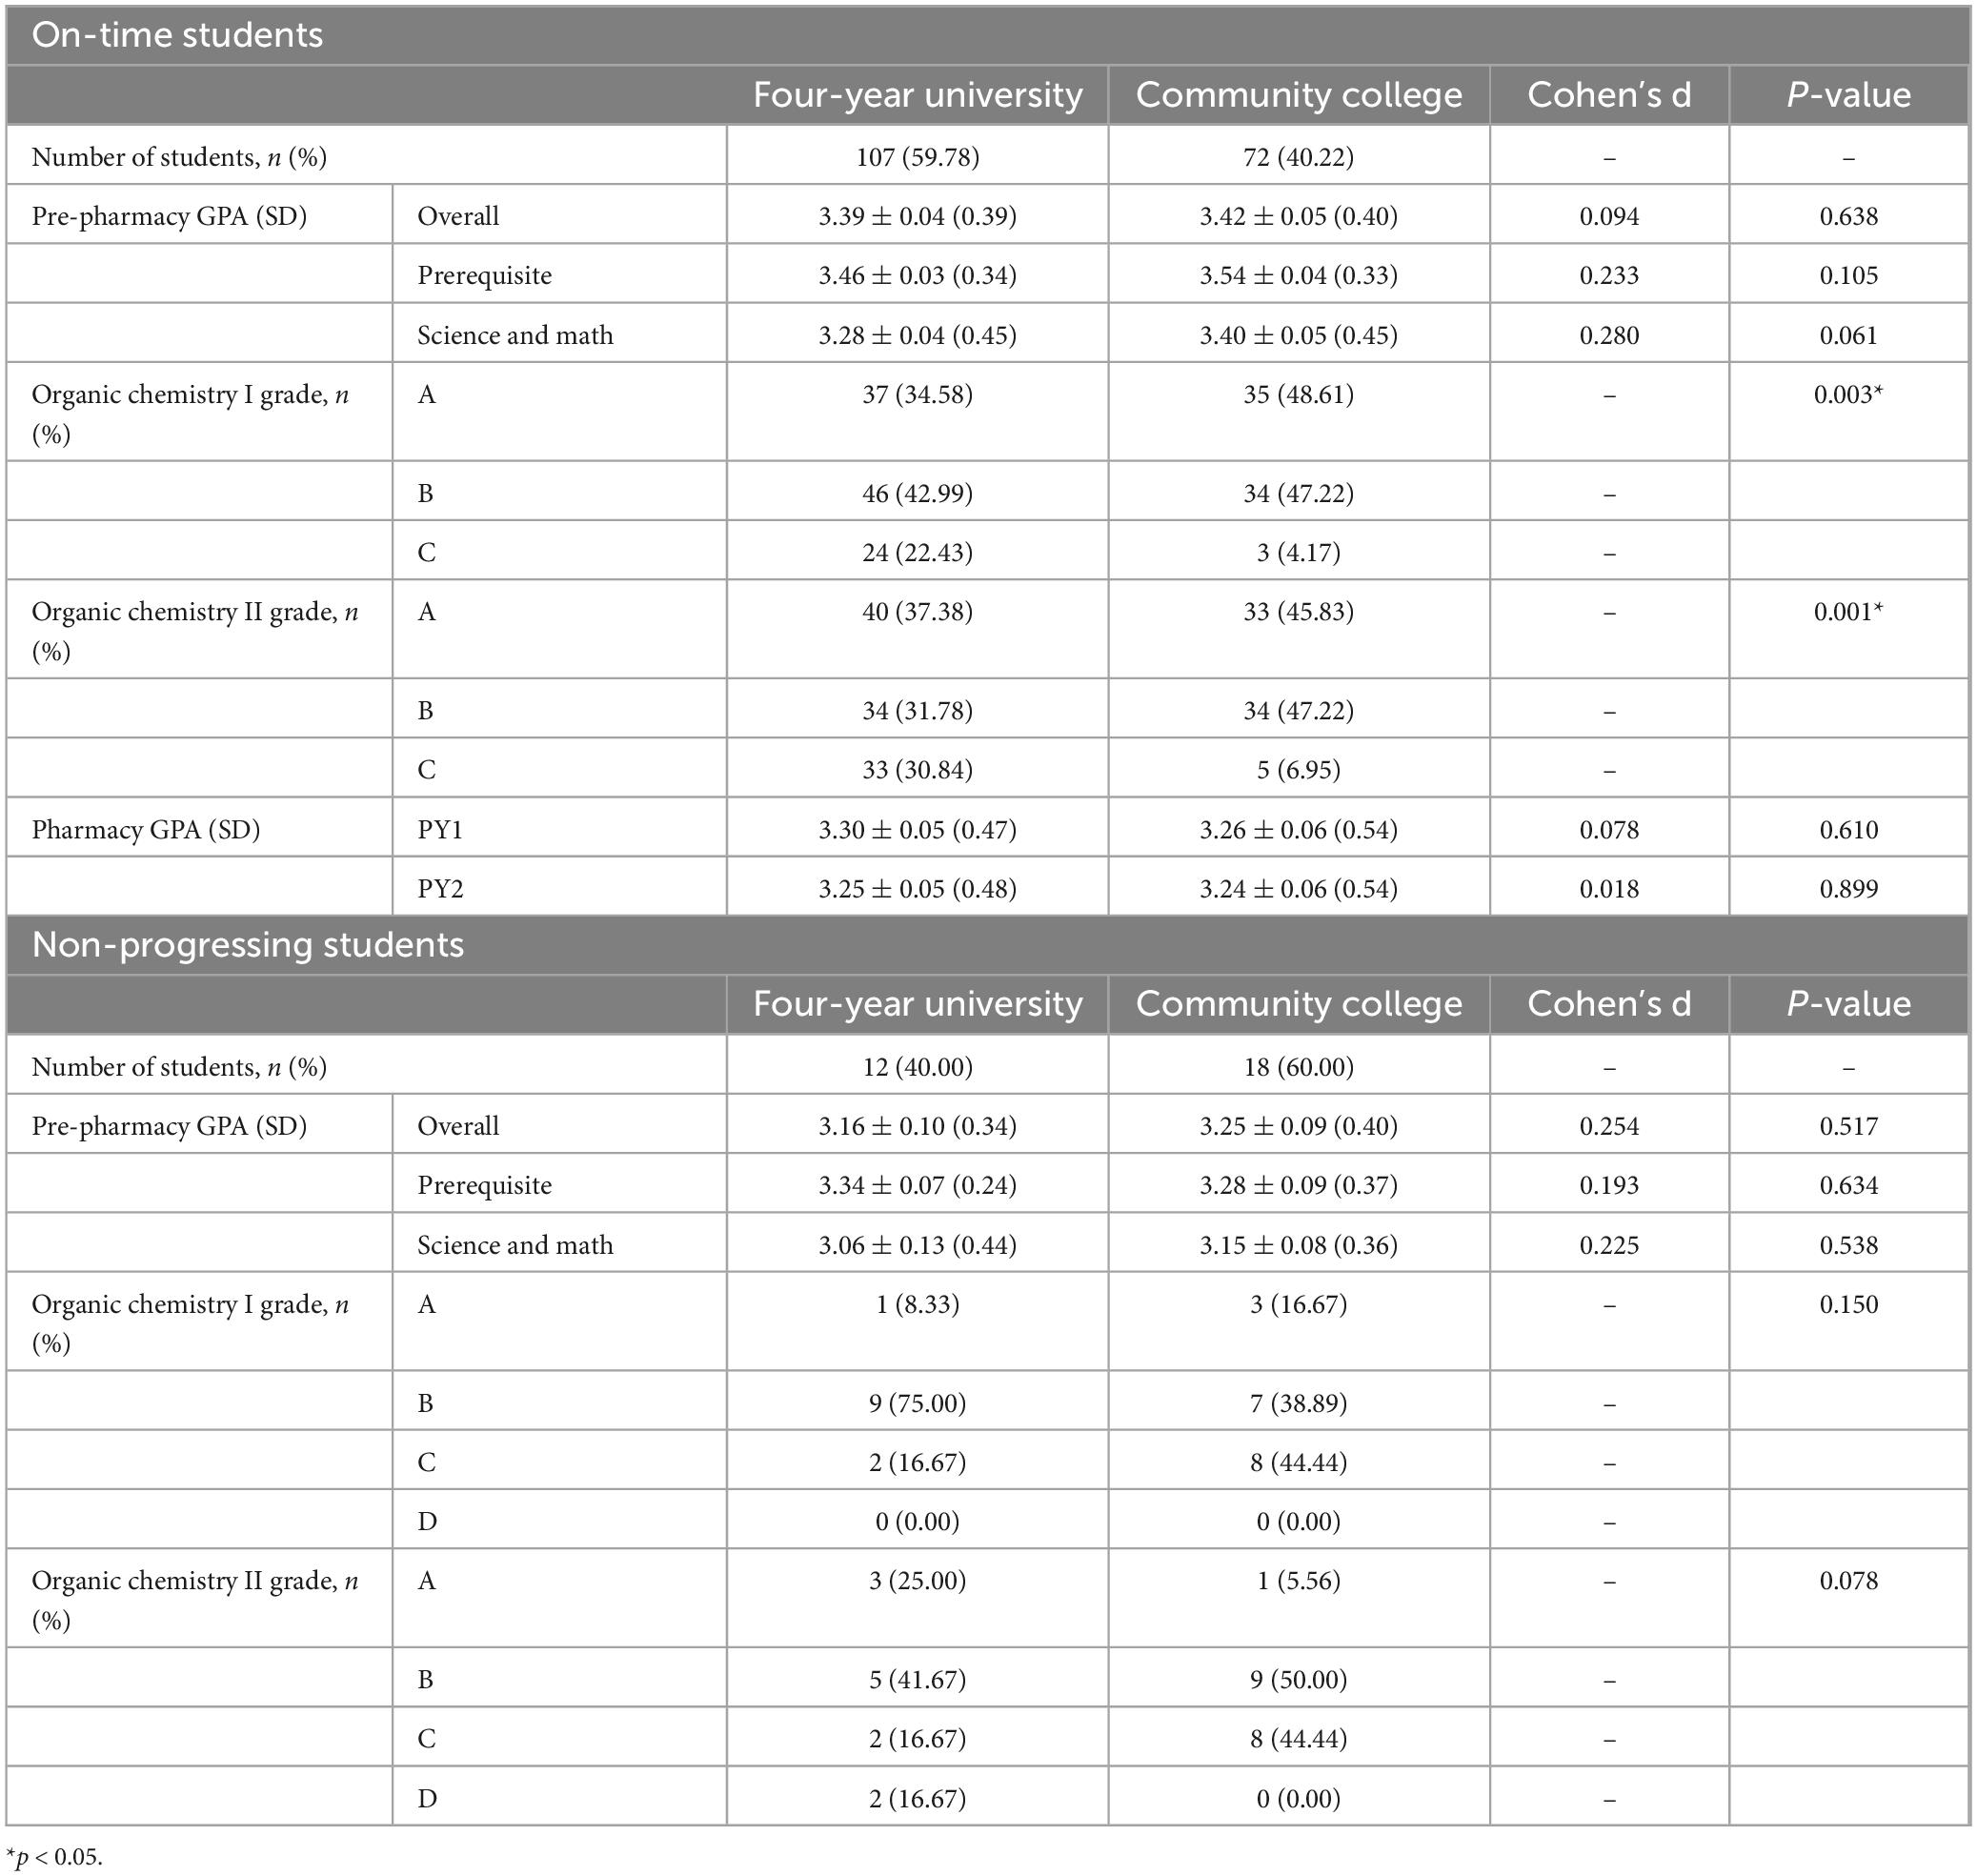
Table 1. Descriptive and endpoint data.
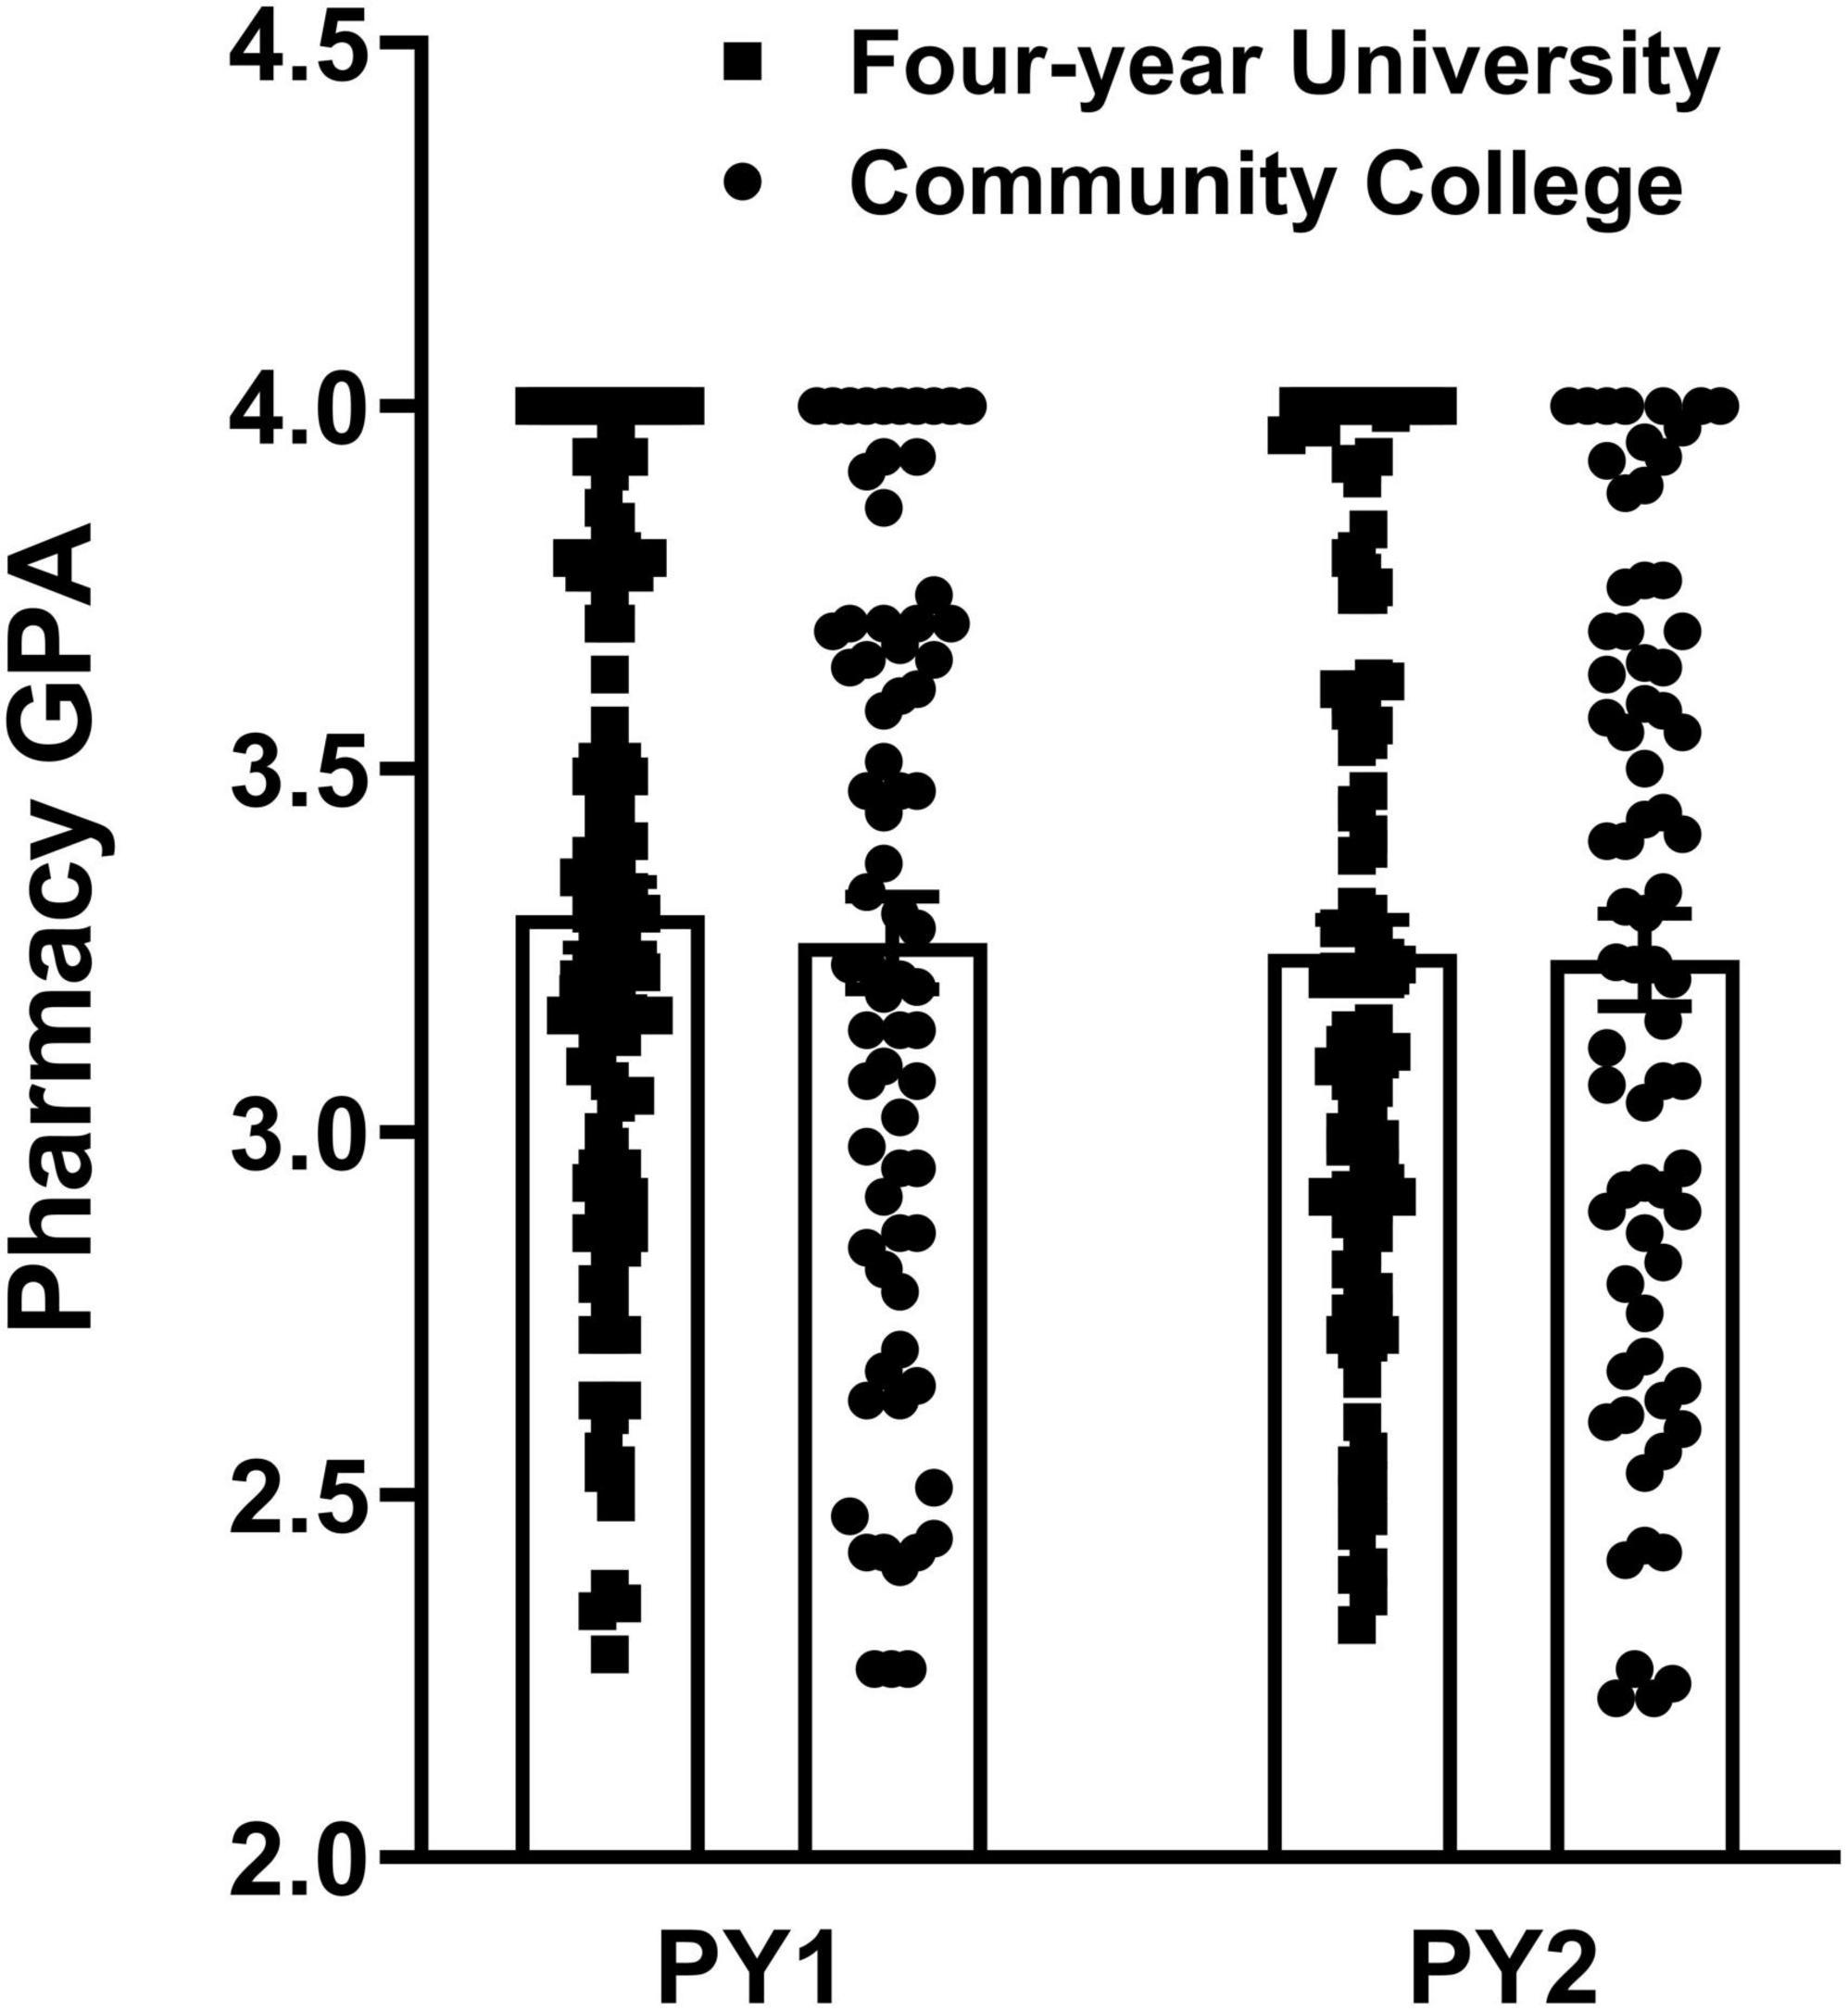
Figure 2. Pharmacy PY1 and PY2 GPA data. Data represent academic performance of students who took organic chemistry at a 4-year university vs. a community college in the PY1 and PY2 didactic (vs. experiential) portion of the curriculum. Averaged data represent mean ± SEM.
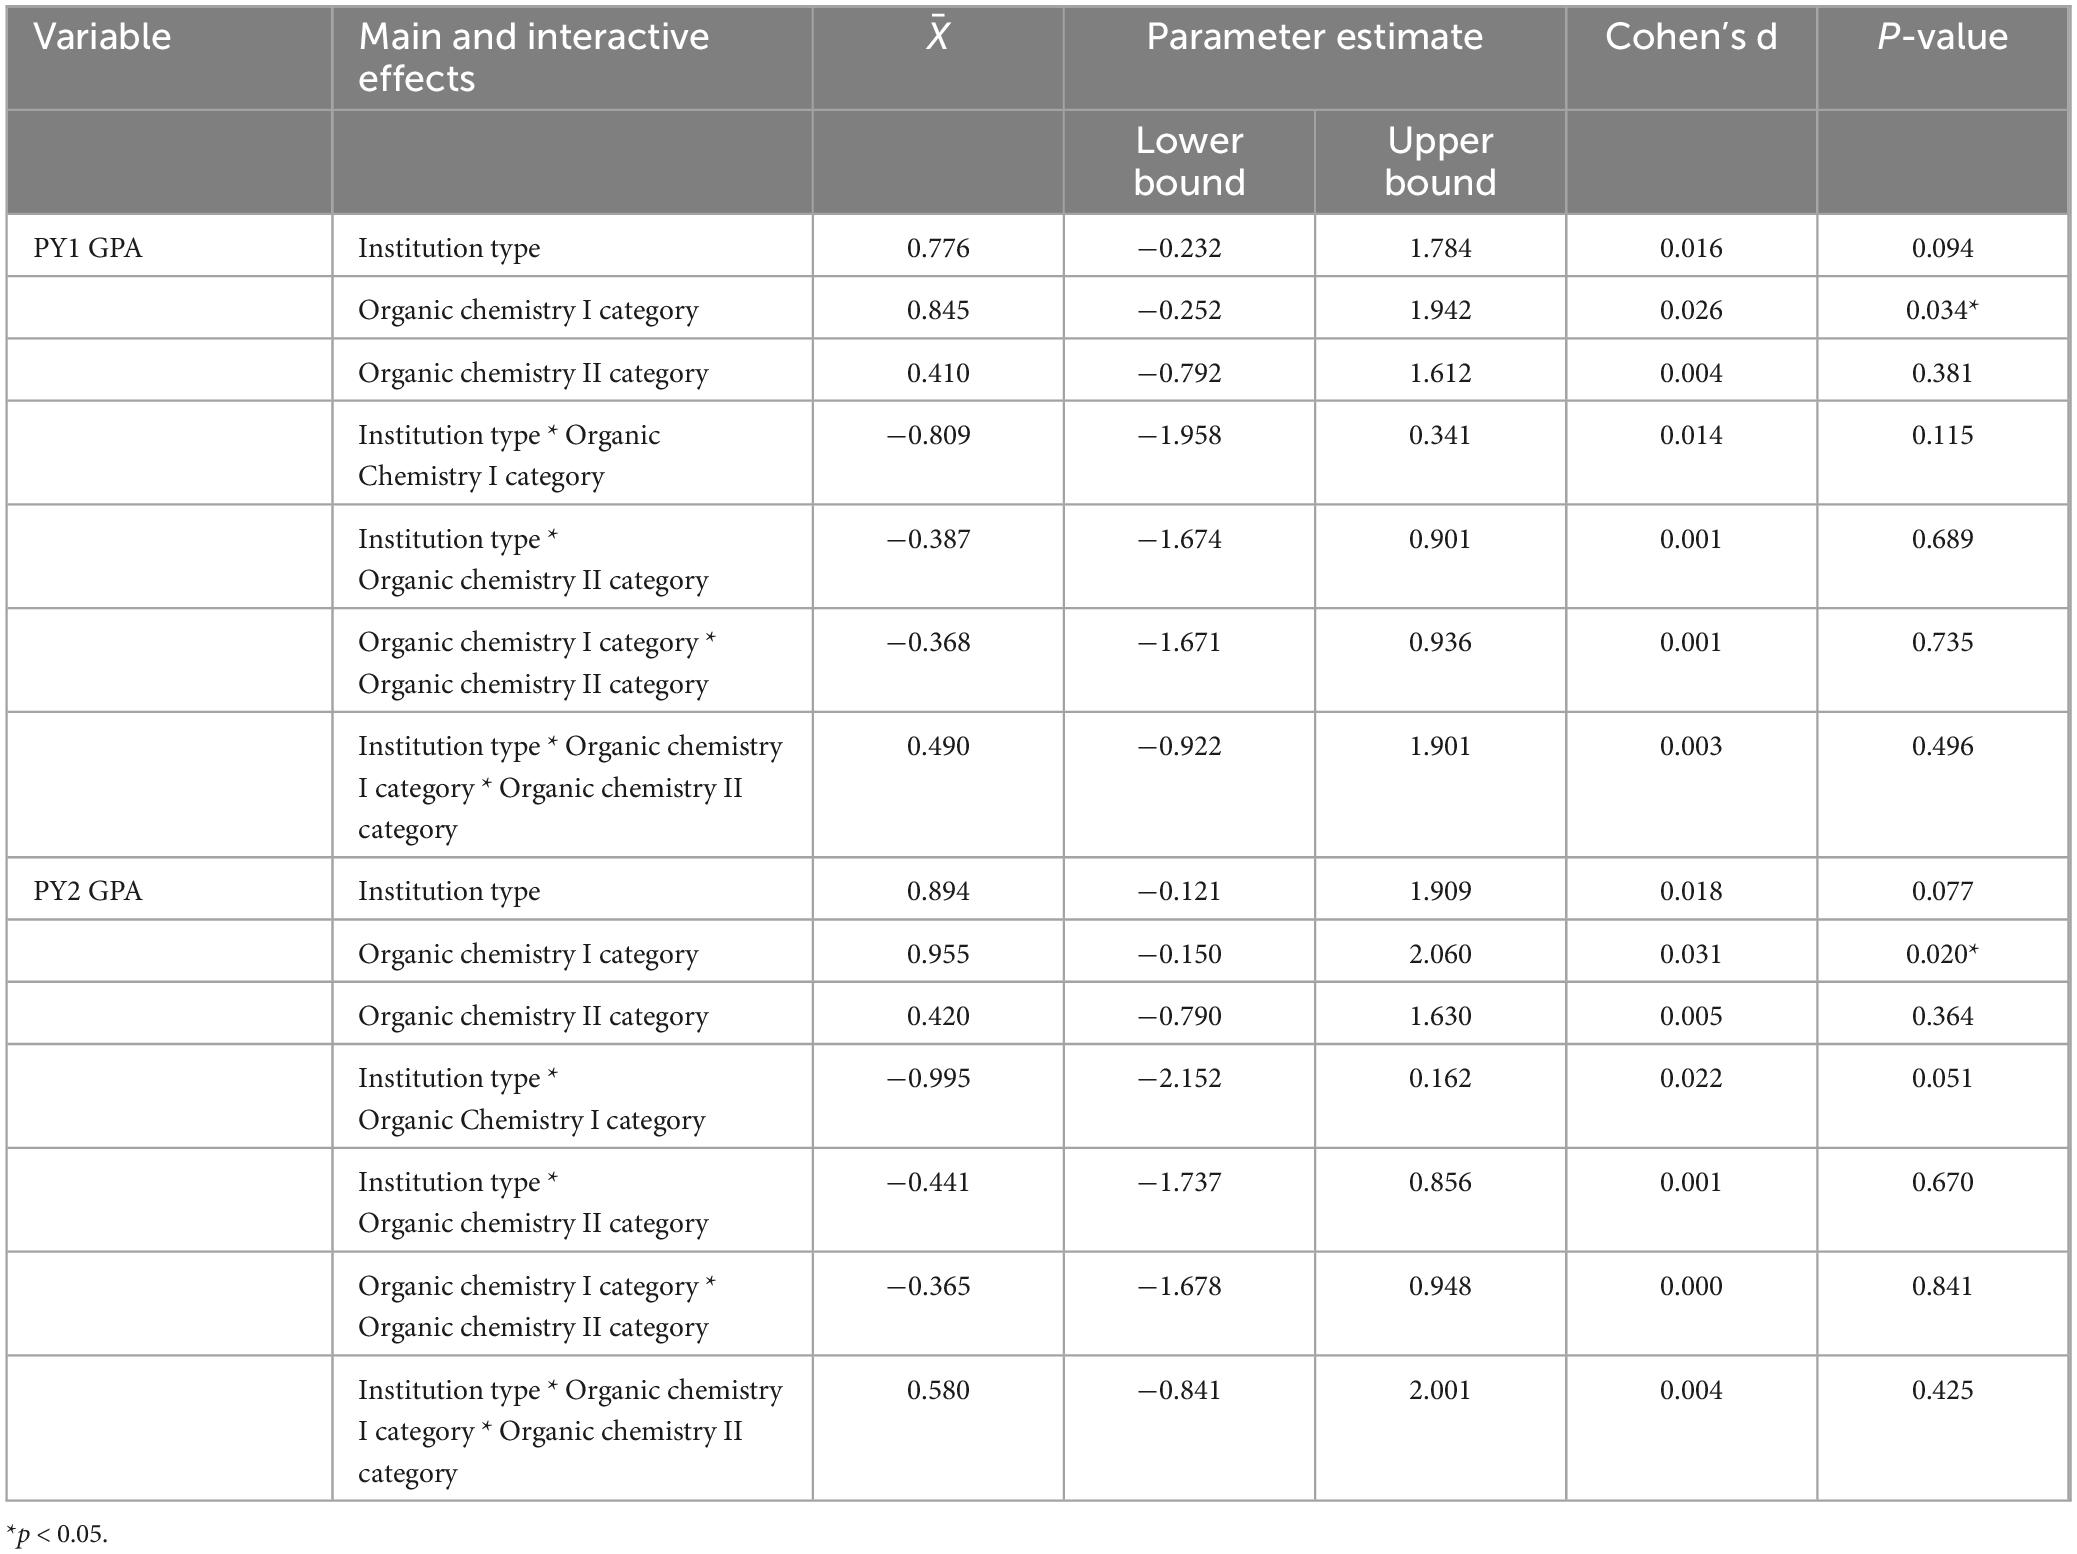
Table 2. Two-way multivariate analysis of variance (2W-MANOVA) linear regression analysis.
Discussion
Institution type impacts academic outcomes in undergraduate organic chemistry I and II. A higher percentage of students taking organic chemistry I and II at a CC received an A or B grade compared to the percentage of those who took it at a U. Alternatively, more students taking organic chemistry I and II at a U received a C grade compared to those who took it at a CC. These grade distributions might suggest that the rigor of organic chemistry I and II is greater at a U and that U students have an academic advantage regarding foundational knowledge and preparedness. On the contrary, the present findings indicate that the differences in the organic chemistry I and II grade distributions at a U vs. CC were not associated with any differences in mean PY1 and PY2 GPA. By this analysis, students who study organic chemistry I and II at a U are at no academic advantage in terms of their course outcomes in the didactic portion of our curriculum. In the same vein, students who study organic chemistry I and II at a CC are at no academic disadvantage. Our observation that pre-pharmacy science and math GPA is nearly higher for CC vs. U students corroborates findings by Lobb and Wilkin (2003), who report that students who attended a CC have a higher prerequisite GPA. Moreover, our findings that mean PY1 and PY2 GPA are the same for U vs. CC students aligns with these authors’ observation that CC students do not achieve higher pharmacy first-year GPAs compared to students who complete at least some coursework at a U (Lobb and Wilkin, 2003).
However, linear regression analysis revealed that performance in organic chemistry is predictive of academic preparedness for pharmacy school, which is fitting since organic chemistry is a core component of pharmacy education. Specifically, C grade performance in organic chemistry I, but not organic chemistry II, at either a U or CC is associated with worse academic performance in an accelerated PharmD program in the context of PY1 and PY2 (i.e., didactic) GPA. We speculate that part of the reason why organic chemistry I is more predictive of pharmacy school success is because many of its curricular principles, including acid-base chemistry, pKa, Henderson-Hasselbalch, and ionization potential, align strongly with the medicinal chemistry content taught in pharmacy school. In contrast, the applications-based content of organic chemistry II, including synthesis reactions, is not typically part of pharmacy school curricula.
There were several limitations to the study. Due to the limited size of the study population, outcomes in organic chemistry were dichotomized into either “A or B grade” or “C grade” categories to increase statistical power. Another consideration is that this study does not differentiate organic chemistry courses that incorporate a lab component into the final grade vs. those that do not. Furthermore, this study did not compare organic chemistry I or II outcomes when the courses were taken as part of a full-load semester (i.e., 12–15 credit hours) or not. Students who re-took organic chemistry as well as students who did not complete the program on-time (defined as graduation within 3 months of the student’s original cohort graduation date) or at all (i.e., non-progressing) were excluded from the primary analysis. However, these students are likely at a higher risk of performing worse academically in pharmacy school. As a means to investigate the direct effect of institution type on didactic outcomes, additional students were excluded from the analysis if they studied organic chemistry I and II at both a U and CC, but this approach potentially eliminates a substantial amount of relevant data, as many students take prerequisite coursework at both institution types. Although the didactic curriculum of the various schools of pharmacy may be similar, they are not identical. Therefore, our conclusions can be drawn only in the context of our program. Since most pharmacy schools require organic chemistry I and II as prerequisites, however, our findings are certainly applicable to any program.
Over the past 10 years, the mean NAPLEX first-time pass rate has drastically dropped from ∼95% to less than 80%, with multiple programs currently not reaching a 70% pass rate (Brown, 2024). Changes to the exam blueprint and scoring only partly explain the decline (Brown, 2024). Curricular revisions in response to the Accreditation Council for Pharmacy Education (ACPE) Standards 2016, the COVID-19 pandemic, insufficient criteria for identifying and monitoring in-trouble programs, private (vs. public) school classification, and waiving of prerequisite course requirements to mitigate declining enrollment are also likely contributors (Brandon and Romanelli, 2024; Deb and Sakharkar, 2024; Dell et al., 2024; Shcherbakova et al., 2024). Newer schools (i.e., those that opened after 2009) and accelerated 3-year programs have been especially impacted by the NAPLEX crisis (Brown, 2024; Williams et al., 2019). Given the present findings, it is interesting to consider whether average performance in undergraduate organic chemistry I is also associated with poor performance on the NAPLEX. However, these and other NAPLEX outcome-related analyses are hindered by the fact that, as of January 2021, the National Association of Boards of Pharmacy (NABP) no longer reports exam scores. Moreover, as of May 2024, it is only optional for exam takers to authorize the NABP to share their pass/fail exam results with their pharmacy schools. Taken together, the present study findings help inform admissions committees about how to prioritize performance in undergraduate organic chemistry, particularly organic chemistry I, during the application review and selection processes, as they provide insight on an applicant’s likelihood to succeed in pharmacy school.
Data availability statement
The original contributions presented in this study are included in this article/supplementary material, further inquiries can be directed to the corresponding authors.
Ethics statement
The studies involving humans were approved by William Carey University Institutional Review Board. The studies were conducted in accordance with the local legislation and institutional requirements. Written informed consent for participation was not required from the participants or the participants’ legal guardians/next of kin in accordance with the national legislation and institutional requirements.
Author contributions
TS: Conceptualization, Data curation, Investigation, Writing – original draft, Writing – review and editing. JR: Formal analysis, Writing – review and editing. CB: Data curation, Writing – review and editing. MB: Data curation, Formal analysis, Methodology, Software, Supervision, Writing – original draft, Writing – review and editing.
Funding
The author(s) declare that no financial support was received for the research, authorship, and/or publication of this article.
Conflict of interest
The authors declare that the research was conducted in the absence of any commercial or financial relationships that could be construed as a potential conflict of interest.
Generative AI statement
The authors declare that no Generative AI was used in the creation of this manuscript.
Publisher’s note
All claims expressed in this article are solely those of the authors and do not necessarily represent those of their affiliated organizations, or those of the publisher, the editors and the reviewers. Any product that may be evaluated in this article, or claim that may be made by its manufacturer, is not guaranteed or endorsed by the publisher.
References
Allen, D., and Bond, C. (2001). Prepharmacy predictors of success in pharmacy school: Grade point averages, pharmacy college admissions test, communication abilities, and critical thinking skills. Pharmacotherapy 21, 842–849. doi: 10.1592/phco.21.9.842.34566
Allen, R., and Diaz, C. (2013). Use of preadmission criteria and performance in the doctor of pharmacy program to predict success on the North American Pharmacists licensure examination. Am. J. Pharm. Educ. 77:193. doi: 10.5688/ajpe779193
Allen, R., Diaz, C., Gant, K., Taylor, A., and Onor, I. (2016). Preadmission predictors of on-time graduation in a doctor of pharmacy program. Am. J. Pharm. Educ. 80, doi: 10.5688/ajpe80343
Brandon, H., and Romanelli, F. (2024). The North American pharmacist licensure examination (NAPLEX) pass rate conundrum. Am. J. Pharm. Educ. 88:100701. doi: 10.1016/j.ajpe.2024.100701
Brown, D. (2024). Falling pass rates on the North American Pharmacist Licensure Examination signal an emerging crisis for a growing number of pharmacy schools. J. Am. Coll. Clin. Pharm. 7, 1033–1041. doi: 10.1002/jac5.2015
Carroll, C., and Garavalia, L. (2002). Gender and racial differences in select determinants of student success. Am. J. Pharm. Educ. 66, 382–387.
Chisholm, M. (2001). Students performance throughout the professional curriculum and the influence of achieving a prior degree. Am. J. Pharm. Educ. 65, 350–354.
Chisholm, M., Cobb, H., and Kotzan, J. (1995). Significant factors for predicting academic success of first-year pharmacy students. Am. J. Pharm. Educ. 59, 364–370. doi: 10.5688/ajpe816111
Chisholm, M., Cobb, H., Dipiro, J., and Lauthenschlager, G. (1999). Development and validation of a model that predicts the academic ranking of first-year pharmacy students. Am. J. Pharm. Educ. 63, 388–394.
Chisholm, M., Cobb, H., Kotzan, J., and Lautenschlager, G. (1997). Prior four year college degree and academic performance of first year pharmacy students: A three year study. Am. J. Pharm. Educ. 61, 278–281.
Cor, M., and Brocks, D. (2018). Examining the relationship between prerequisite grades and types of academic performance in pharmacy school. Curr. Pharm. Teach. Learn. 10, 695–700. doi: 10.1016/j.cptl.2018.03.008
Crow, R., Gaebelein, C., and Patel, M. (2018). Early indicators of success in a pharmacy curriculum: The role of pre-professional science and mathematics courses. Pharm. Educ. 5, 215–218.
Deb, S., and Sakharkar, P. (2024). Comparison of NAPLEX first-time pass rates before and after COVID-19 pandemic. Am. J. Pharm. Educ. 88:100916. doi: 10.1016/j.ajpe.2024.100916
Dell, K., Frankart, L., Ogbonna, K., and DiPiro, J. (2024). Falling NAPLEX pass rates are cause for concern. Curr. Pharm. Teach. Learn. 16, 1–4. doi: 10.1016/j.cptl.2023.11.001
Hardigan, P., Lai, L., Arneson, D., and Robeson, A. (2001). Significance of academic merit, test scores, interviews and the admissions process: A case study. Am. J. Pharm. Educ. 65, 40–44.
Houglum, J., Aparasu, R., and Delfinis, T. (2005). Predictors of academic success and failure in a pharmacy professional program. Am J Pharm Educ. 70:106.
Kelley, K., Secnik, K., and Boye, M. (2001). An evaluation of the pharmacy college admissions test as a tool for pharmacy college admissions committees. Am J Pharm Educ. 65, 225–230.
Kuncel, N., Credé, M., Thomas, L., Klieger, D., Seiler, S., and Woo, S. E. A. (2005). meta-analysis of the validity of the pharmacy college admission test (PCAT) and grade predictors of pharmacy student performance. Am. J. Pharm. Educ. 69:51.
Latif, D. (2005). Including the assessment of nontraditional factors in pharmacy school admissions. Ann. Pharmacother. 39, 721–726. doi: 10.1345/aph.1E498
Lobb, W., and Wilkin, N. (2003). Admission and progression standards at U.S. schools and colleges of pharmacy: An exploration of criteria changes. Am J. Pharm. Educ. 67:93.
Lounsbury, N., Perry, A., and Arric, L. (2023). The effect of socioeconomic disadvantage for on-time graduation in an accelerated doctor of pharmacy program. Curr. Pharm. Teach. Learn. 15, 868–873. doi: 10.1016/j.cptl.2023.07.023
McCall, K., Allen, D., and Fike, D. (2006). Predictors of academic success in a doctor of pharmacy program. Am. J. Pharm. Educ. 70:106. doi: 10.5688/aj7005106
McCall, K., MacLaughlin, E., Fike, D., and Ruiz, B. (2007). Preadmission predictors of PharmD graduates’ performance on the NAPLEX. Am. J. Pharm. Educ. 71:5. doi: 10.5688/aj710105
Meagher, D., Lin, A., and Stellato, C. P. (2006). A predictive validity study of the pharmacy college admission test. Am. J. Pharm. Educ. 70:53. doi: 10.5688/aj700353
Meagher, D., Pan, T., and Perez, C. (2011). Predicting performance in the first-year of pharmacy school. Am. J. Pharm. Educ. 75:81. doi: 10.5688/ajpe75581
Renzi, S., Krzeminski, M., Sauberan, M., Brazeau, D., and Brazeau, G. (2007). Prepharmacy years in college and academic performance in a professional program. Am. J. Pharm. Educ. 71:69. doi: 10.5688/aj710469
Schauner, S., Hardinger, K., Graham, M., and Garavalia, L. (2013). Admission variables predictive of academic struggle in a PharmD program. Am. J. Pharm. Educ. 77, doi: 10.5688/ajpe7718
Shcherbakova, N., Pesaturo, K., and Pezzuto, J. (2024). High total failures of the North American pharmacist licensure examination (NAPLEX) warrant monitoring of professional pharmacy programs. Am. J. Pharm. Educ. 88:100723. doi: 10.1016/j.ajpe.2024.100723
Spivey, C., Chisholm-Burns, M., and Johnson, J. (2020). Factors associated with student pharmacists’ academic progression and performance on the national licensure examination. Am. J. Pharm. Educ. 84:7561. doi: 10.5688/ajpe7561
Steinberg, M., and Morin, A. (2015). The impact of prematriculation admission characteristics on graduation rates in an accelerated Doctor of Pharmacy program. Am J Pharm Educ. 79:118. doi: 10.5688/ajpe798118
Tejada, F., Parmar, J., Purnell, M., and Lang, L. (2016). Admissions criteria as predictors of academic performance in a three-year pharmacy program at a historically black institution. Am. J. Pharm. Educ. 80:6. doi: 10.5688/ajpe8016
Thomas, M., and Draugalis, J. (2002). Utility of the pharmacy college admission test (PCAT): Implications for admissions committees. Am. J. Pharm. Educ. 66, 47–51.
Williams, J., Spivey, C., Hagemann, T., Phelps, S., and Chisholm-Burns, M. (2019). Impact of pharmacy school characteristics on NAPLEX first-time pass rates. Am. J. Pharm. Educ. 83:6875. doi: 10.5688/ajpe6875
Keywords: pharmacy school, grade point average, four-year college, community college, organic chemistry
Citation: Smith TJ, Ross J, Breese CR and Burmeister MA (2025) Performance in organic chemistry at either a four-year university or community college predicts academic performance in an accelerated school of pharmacy. Front. Educ. 10:1525185. doi: 10.3389/feduc.2025.1525185
Received: 08 November 2024; Accepted: 22 January 2025;
Published: 07 February 2025.
Edited by:
Jay Wackerly, Central College, United StatesReviewed by:
Sarah Zingales, United States Coast Guard Academy, United StatesMichael Wentzel, Augsburg University, United States
Sachin Nedungadi, University of Nebraska Omaha, United States
Copyright © 2025 Smith, Ross, Breese and Burmeister. This is an open-access article distributed under the terms of the Creative Commons Attribution License (CC BY). The use, distribution or reproduction in other forums is permitted, provided the original author(s) and the copyright owner(s) are credited and that the original publication in this journal is cited, in accordance with accepted academic practice. No use, distribution or reproduction is permitted which does not comply with these terms.
*Correspondence: Troy J. Smith, dGpzbWl0aEB3bWNhcmV5LmVkdQ==; Melissa A. Burmeister, bWJ1cm1laXN0ZXJAd21jYXJleS5lZHU=