 Armin Jentsch
 Bas Senden
 Nani Teig
 Trude Nilsen
 Johannes König
 Gabriele Kaiser
- 1Department of Teacher Education and School Research, University of Oslo, Oslo, Norway
- 2Faculty of Human Sciences, University of Cologne, Cologne, Germany
- 3Faculty of Education, University of Hamburg, Hamburg, Germany
- 4Faculty of Education and Arts, Nord University, Bodø, Norway
Background: Scores from classroom observations serve as important pieces of information for educational researchers, practitioners, and policymakers. However, scoring procedures typically remain untested. This study aims to investigate the effect of sequential and nonsequential scoring of lesson segments from videotaped Norwegian mathematics and science classrooms.
Methods: Using a cross-over design, we randomly assigned four raters to score 30 videotaped lessons in sequential (SEQ) or nonsequential (NON) 20-min segments. We explored means as well as correlations across conditions and conducted Generalizability Studies (G Studies) to estimate the precision of scores.
Results: We found marginal fluctuations in scores across conditions, and correlation analysis indicated similar rankings of lessons and classrooms. However, G Studies reveal that nonsequential scoring captures a greater proportion of between-classroom variance, while sequential scoring captures more variance between lessons. This also implies that the precision of scores varies across conditions and the unit of analysis.
Conclusion: The findings suggest that scoring procedures could affect decision-making drawing on scores from classroom observation. We argue, however, that results depend to some extent on the observation system used to generate the scores. Therefore, we encourage researchers to replicate our findings with other observation systems.
Introduction
Classroom observation has the potential to provide important information on teaching quality to researchers, educational practitioners, and policymakers. Because of this, numerous observation systems have been developed over the last 20 years (Charalambous and Praetorius, 2018). Some key purposes of observation systems are to provide feedback to teachers or to explore student learning in the classroom (White and Klette, 2024). To meet these purposes, observation systems include a set of scoring rules (e.g., observation mode or length, Casabianca et al., 2013), many of which are not empirically tested. However, scoring rules may affect the reliability of scores and their relations to student achievement (Bell et al., 2012; Mashburn et al., 2014; White and Klette, 2024). For observation systems to be helpful, evidence needs to be brought forward that supports the use of scores toward the intended purpose (e.g., observers scoring accurately and in accordance with some rubric). In this paper, we provide such evidence for an exemplary observation system and an exemplary scoring rule, that is, presentation order.
Presentation order refers to the ways in which segments of lessons are presented to observers. Ho and Kane (2013) argue that by manipulating the presentation order, the likelihood for carryover effects to happen could be decreased (i.e., raters assigning scores based on their impressions from segments prior to the one they are scoring). This is important, because carryover effects could introduce construct irrelevant variability that reduces the validity of scores. Live observation naturally limits raters to score segments sequentially, but with videotaped lessons, the presentation order can be manipulated. However, the time and date at which the rating takes place can be held constant, which suggests that rater drift (i.e., raters’ performance lacking invariance over time) would be reduced to a minimum.
Literature sees little empirical attention to this issue. Mashburn et al. (2014) conducted an experimental study in which they presented lesson segments to raters in a random order and found that this had benefits for reliability and predictive validity compared to scoring segments sequentially. For their study, the authors used the Classroom Assessment Scoring System (CLASS, Pianta et al., 2008), which is generic in the sense that it may be applied to any subject of classroom teaching. In the present study, however, a different observation system is used that draws on the established Three Basic Dimensions (TBD) framework of teaching quality (Praetorius et al., 2018), particularly tailored to mathematics and science classrooms. Given this and the limited empirical evidence on presentation order, it is unclear whether the findings from Mashburn et al. (2014) are generalizable to our context. Therefore, our study focuses on the degree to which presentation order might affect ratings of teaching quality in Norwegian 6th grade mathematics and science classrooms.
Framework for teaching quality
Following the Trends in Mathematics and Science Study (TIMSS) Video Study, a generic framework of teaching quality with three basic dimensions was developed (TBD, Praetorius et al., 2018). They are classroom management, student support, and (potential for) cognitive activation. Classroom management refers to teachers’ procedures and strategies that enable efficient use of time (time on task), as well as behavioral management (Kounin, 1970). Student support draws on self-determination theory (Deci and Ryan, 1985) and aims at both motivational and emotional support, as well as individualization and differentiation in learning. Finally, cognitive activation addresses opportunities for “high-order thinking” from a socio-constructivist perspective on teaching and learning (e.g., problem-solving, Mayer, 2004). The three basic dimensions have been shown to positively relate to students’ achievement across various studies and operationalizations (e.g., Blömeke et al., 2022; Lipowsky et al., 2009; for an overview see Praetorius et al., 2018).
Research questions
Gathering reliable scores is crucial for drawing valid inferences from classroom observation, but at the same time, presentation order may affect the extent to which raters reliably assign scores. To the best of our knowledge, presentation order has not been investigated using observation systems with a subject-specific focus. Our study aims to close this research gap by using an experimental design in which two conditions are compared, that is, sequential and nonsequential scoring procedures. We address the following research questions:
(1) Are lesson segments scored differently across conditions?
(2) Are classrooms or lessons ranked differently across conditions?
(3) How do sources of variance (i.e., classrooms, lessons, raters) compare across conditions?
(4) How do measurement error and reliability compare across conditions?
In this paper, we use Generalizability Studies (G Studies, Cronbach et al., 1972; Shavelson and Webb, 1991) to analyze scoring precision. By performing analysis of variance, G Studies decompose observed variability in scores with respect to the study conditions (i.e., facets in G Theory terms). In doing so, we gain insights into multiple sources of variability at the same time, which allows for the exploration of wanted (e.g., differences in teaching quality between lessons or classrooms) and unwanted variability in scores (e.g., rater bias). This is a major benefit over and above other approaches to estimating reliability in scores (e.g., inter-rater reliability or Coefficient Alpha). For this reason, G Studies have often been used to identify sources of error and to optimize the reliability and dependability of observational measures (e.g., Ho and Kane, 2013; Jentsch et al., 2022; Quansah et al., 2024).
Methods
The study was conducted within the (project name blinded for peer review) project, which aims to investigate the effect of teacher quality and teaching quality on the development of student achievement and motivation in mathematics and science classrooms.
Videotaped lessons
Data was obtained from schools in the Oslo metropolitan area in Norway, with teachers conveniently participating in the study. In total, 15 6th grade mathematics and science classrooms were sampled, and one through six lessons per classroom were videotaped over the course of several weeks. The length of the lessons varied between 24 and 106 min, and lessons were cut into approximately 20-min segments for analysis, which is recommended by Mashburn et al. (2014).1 For this study, two lessons (four segments) from every mathematics and science classroom were analyzed. Segments were scored under both experimental conditions (i.e., sequential and nonsequential).
Experimental conditions
To analyze the effect of presentation order on score reliability, we designed our study as follows. For each lesson, we randomly assigned one rater to the sequential condition. The rater would then score both segments of this lesson. This condition is referred to as the sequential condition (SEQ). At the same time, two different raters were assigned to the nonsequential condition (NON). We had raters randomly score either the first or the second segment of a lesson. Using this design, raters were balanced across conditions, and the number of times they scored the first or second segment of a lesson. However, there was a chance that raters would score the same classroom (see Table 1 for the scoring design).
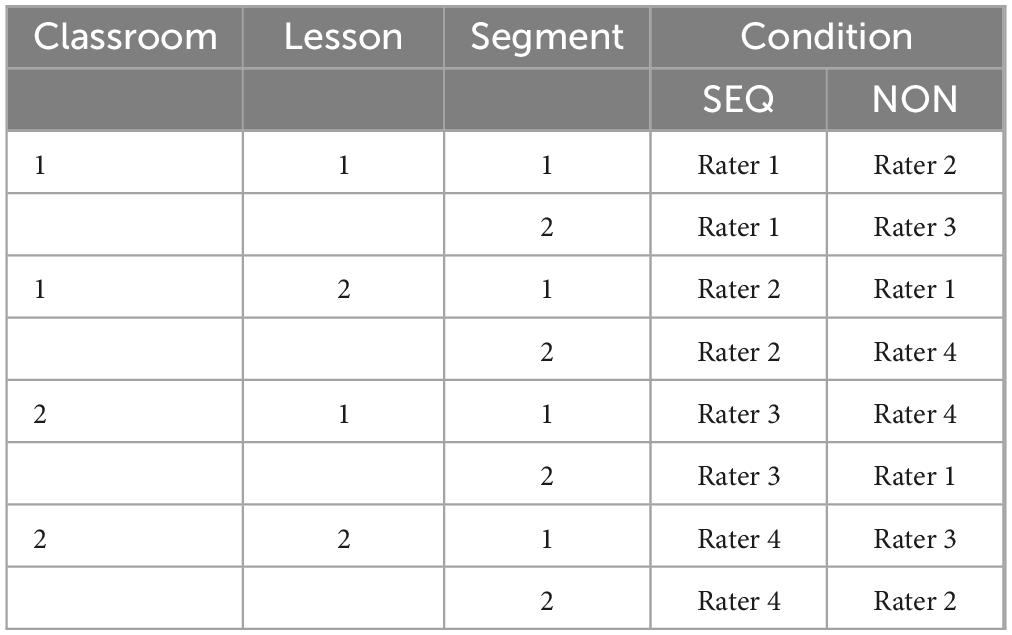
Table 1. Prototypical scoring design across sequential (SEQ) and nonsequential (NON) scoring procedures.
Measures and rating procedure
We applied the observation system from the Teacher Education and Development Study–Instruct (TEDS-Instruct). It captures the TBD with four to six items per dimension using four-point rating scales (see Table 2 for example items and indicators). Note that all items in TEDS-Instruct can in principle be scored throughout the lesson. That is, the observation system does not employ missings by design.
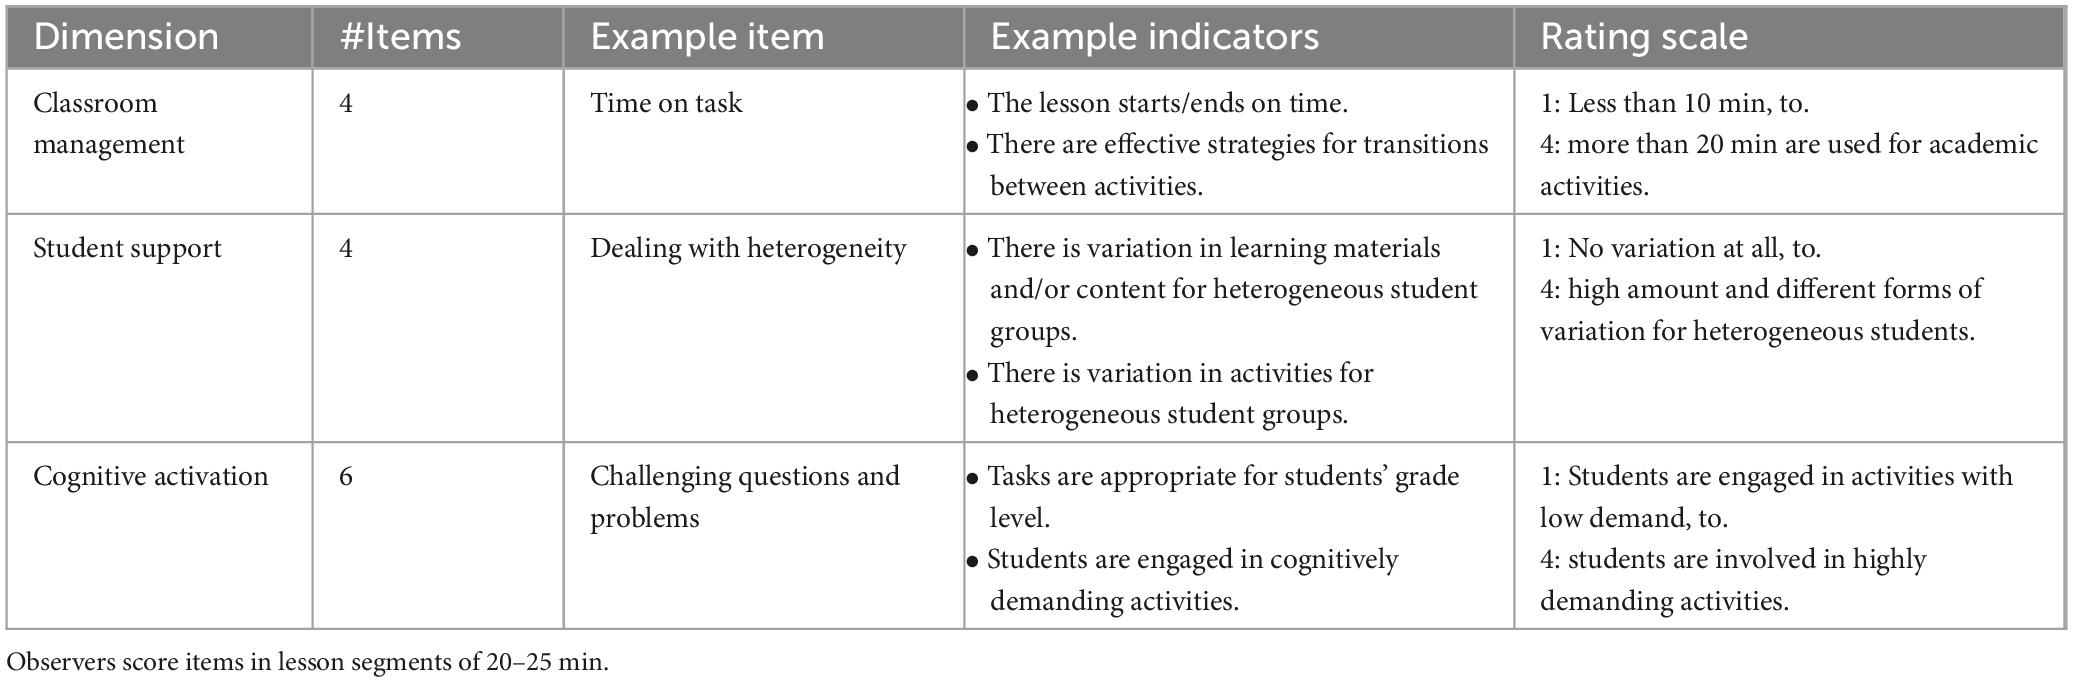
Table 2. Example items and indicators for the three basic dimensions.
Scores were assigned using Interact software (Mangold, 2023). The rating procedure follows a common structure used in many other observation systems (Casabianca et al., 2013): Observers are presented with evidence from lessons and classrooms, and after a certain amount of time, employ a set of indicators to make an informed judgment on the quality of teaching behaviors and teacher-student interactions. These judgements are provided through numerical values, which are then aggregated to dimension scores.
Observers were student teachers in science, technology, engineering, and mathematics (STEM) programs, and they were at least in their 3rd year. They were trained extensively over the course of 1 week by studying the literature as well as the rubric, conducting video observations, and discussing their results with master raters.
Previous applications of the observation system indicated some reliability and validity evidence for the interpretation and use of teaching quality scores. Generalizability Studies yielded systematic differences across classrooms and lessons (Jentsch et al., 2022), which suggests that relevant aspects of teaching quality constructs were captured. Further, little evidence of rater error or bias was found. Blömeke et al. (2022) explored how teaching quality is related to students’ learning outcomes in lower secondary mathematics classrooms. The findings showed that teaching quality moderately affected students’ achievement in mathematics. More information on the observation system is available in Schlesinger et al. (2018).
Statistical analysis
Regarding analytical steps, we follow Casabianca et al. (2013). First, mean differences and bivariate correlations were explored across conditions and teaching quality dimensions. Mean differences were obtained by estimating linear mixed models with random classroom effects, and a fixed effect for the study condition (dummy-coded). Bivariate correlations were estimated on the levels of classrooms and lessons to support the hypothesis that correlations were non-zero.
Second, G Studies (Cronbach et al., 1972; Shavelson and Webb, 1991) were conducted to provide an in-depth analysis of the scoring dependability. In this study, we explore the extent to which teaching quality scores vary with respect to classrooms, lessons, and raters, by using a partially nested G Study design [(l:c) × r], where lessons are nested within classrooms (l:c) and scored by different raters (r). The corresponding variance components for classrooms, lessons within classrooms, raters, and a classroom-by-rater interaction2 were estimated with linear mixed models using the lme4 package (Bates et al., 2015) in R statistical software.
Depending on the purpose of the study, we define classrooms or lessons as the object of measurement, that is, variation between lessons from the same classroom may be regarded as signal or error. For instance, if the purpose of a study is to predict (long-term) student learning, then classrooms are the object of measurement, and variation between lessons in the same classroom contributes to measurement error (i.e., classroom-based decisions, Casabianca et al., 2013). In doing so, we assume that lessons are exchangeable within classrooms, given a reasonable time frame. However, if the purpose is to give feedback to teachers for a fixed lesson, then lessons are the object of measurement, and variation between lessons observed in the same classroom provides relevant information (i.e., lesson-based decisions). This study explores the effects of presentation order for both classroom-based and lesson-based decisions.
G Theory, then, allows for the calculation of absolute and relative error variance and reliability coefficients (G coefficients, Shavelson and Webb, 1991). Absolute error variance affects criterion-referenced decisions (e.g., for evaluation purposes), and relative error variance affects the relative standing of scores (e.g., rankings). We chose to estimate the more conservative absolute measures in the present study. However, the differences are negligible in this case because rater main effects contributed only small shares of variability.
Absolute error variance for classroom-based decisions is given by:
where n is the sample size of the study facet indicated by the subscript. Here, nl is two, because two lessons from each classroom were scored, and nr is also two for the sequential condition and four for the nonsequential condition (see Table 1). The absolute G coefficient, then, is classroom variance over classroom variance plus error variance (e.g., Shavelson and Webb, 1991), and the standard error of measurement is the square root of the error variance. For lesson-based decisions, both classroom and lesson variance are considered the object of measurement, that is, the lessons-within-classrooms component does not contribute to error variance. Therefore, the absolute G coefficient is classroom variance plus lesson variance divided by the same denominator as before. Note, however, that the number of raters scoring a lesson drops to one and two, respectively, because a lesson was scored by a single rater in the sequential design, but by two raters in the nonsequential design.
Results
To address our first research question about whether observers use rating scales differently across conditions, we compared the scores obtained from sequential (SEQ) and nonsequential (NON) scoring procedures, but found no statistically significant differences (M ± SD for SEQ vs. NON, classroom management: 3.20 ± 0.67 vs. 3.30 ± 0.60, p = 0.17, Cohen’s d = 0.16, student support: 1.96 ± 0.56 vs. 2.06 ± 0.53, p = 0.13, d = 0.18, cognitive activation: 2.50 ± 0.63 vs. 2.52 ± 0.59, p = 0.39, d = 0.03). Mean comparisons that considered only the second segment of each lesson yielded almost the same findings. In sum, these results indicate only marginal differences in how raters assign scores across conditions.
Bivariate correlations
Our second research question was concerned with the extent to which classrooms and lessons rank differently between conditions. We found that Pearson correlations were almost equally high at both the classroom (classroom management: r = 0.80, student support: r = 0.81, cognitive activation: r = 0.73) and the lesson level (classroom management: r = 0.72, student support: r = 0.65, cognitive activation: r = 0.70), with small deviations for classroom management and student support. Note that if estimates were corrected for measurement error (“disattenuated,” e.g., Casabianca et al., 2013), correlations would be close to perfect. Overall, this implies that classrooms and lessons rank similarly across conditions.
Generalizability study
Regarding our third research question, we conducted a G Study which decomposed the total variability in scores into classroom, lesson, and rater effects. The results highlight notable differences between the sequential and nonsequential scoring procedures (Table 3). The nonsequential scoring procedure captured larger shares of between-classroom differences, ranging from one-fourth to nearly one-third of the total variability in scores across teaching quality dimensions. In contrast, for the sequential condition, between-classroom differences accounted for as low as 4% (student support) to a maximum of 20% (cognitive activation) of the total variability in scores. Between-lesson differences explained a significantly larger share of variance under the sequential procedure, exceeding 40% of the total variability. However, in the nonsequential condition, this figure dropped to less than 20%, with 10% attributed to both student support and cognitive activation.
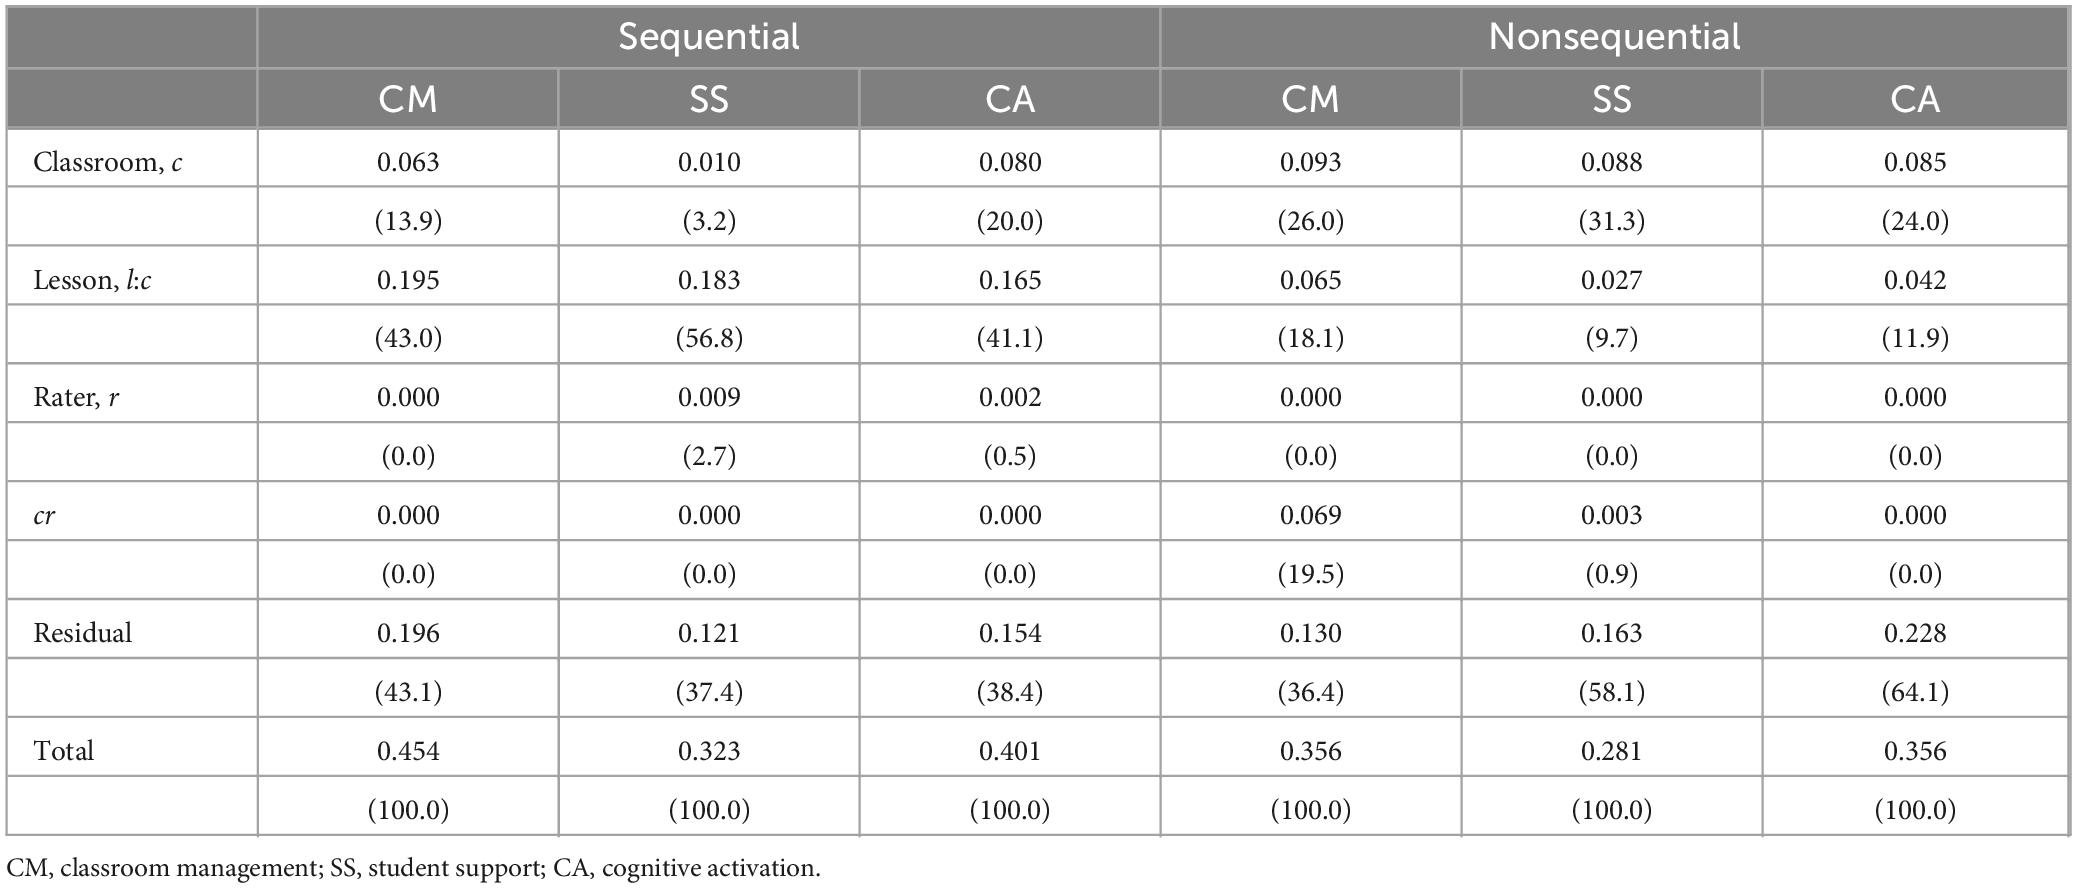
Table 3. Variance decomposition of scores by dimension and condition (percentages of total variability in parentheses).
Rater effects were consistently low, typically below 5% of the total variability, except for classroom management in the nonsequential condition, which indicates that observers score teaching quality similarly across conditions. Finally, unexplained variance accounted for approximately 40% in the sequential condition and up to 63% in the nonsequential condition. These findings suggest that including additional facets of the study design or higher-order interaction terms could help explain larger shares of variance.
Drawing on the variance decomposition, we calculated standard errors of measurement and absolute G coefficients to answer the fourth research question on the precision of scores. Table 4 shows that the precision of scores is similar when scores are used for lesson-based decision-making (both conditions), or when the nonsequential scoring procedure is used for classroom-based decision-making. In these cases, standard errors are approximately one-fourth of a point on the rating scale. Absolute G coefficients are below what is typically considered sufficient precision. The precision of scores, however, is much lower when applying sequential scoring for classroom-based decision-making.
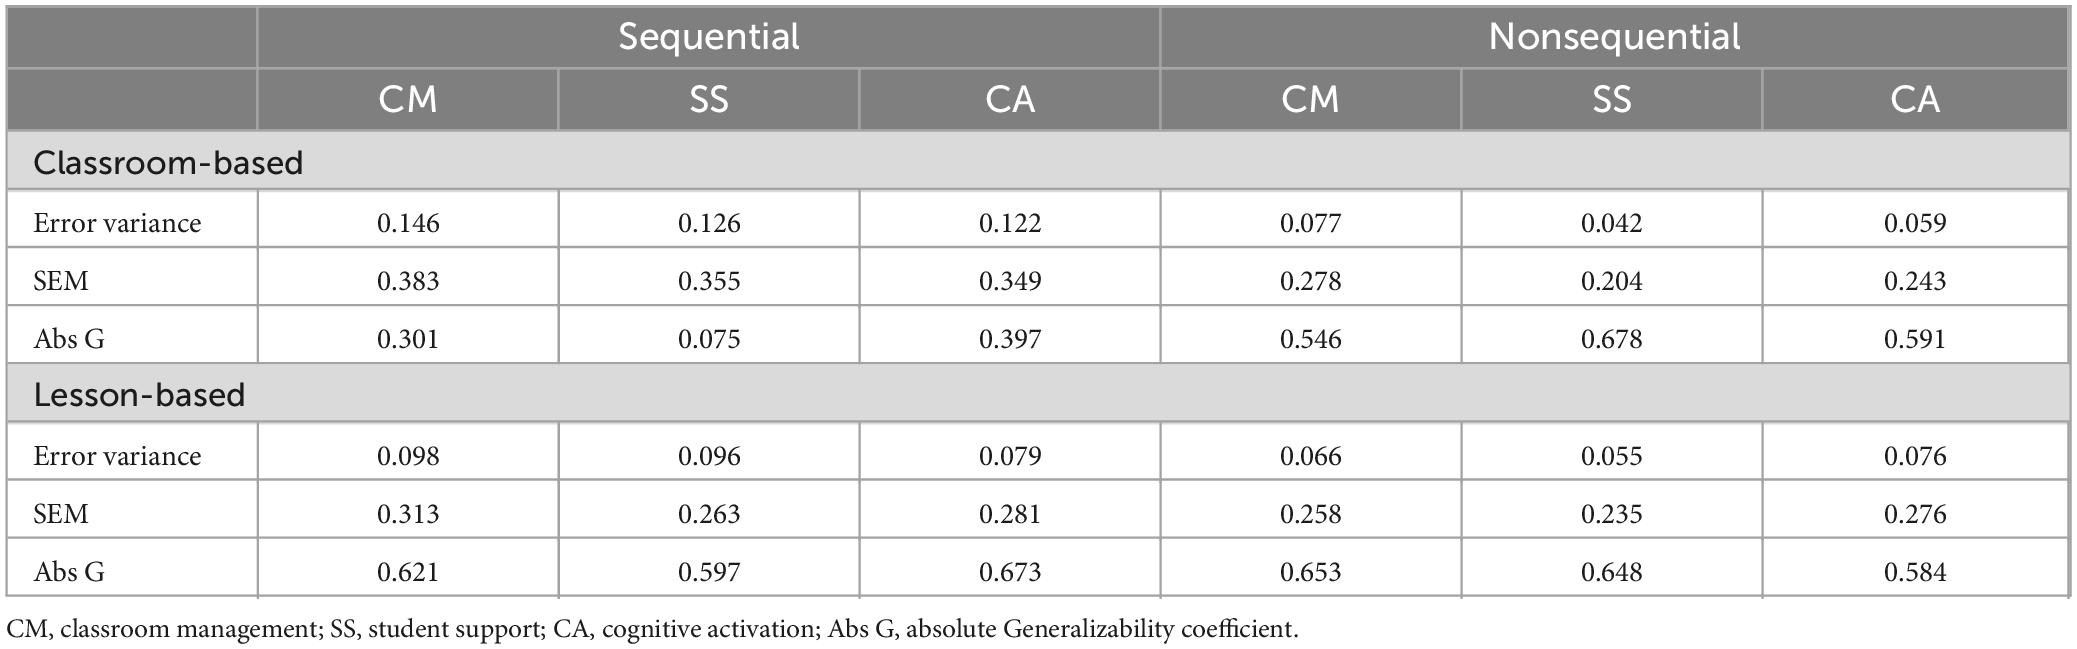
Table 4. Standard error of measurement (SEM) and absolute G coefficients by dimension and condition.
Discussion
In this study we compared sequential and nonsequential scoring procedures to explore their impact on how raters assign scores, as well as dependability and measurement error. Using an experimental design, we found marginal, statistically non-significant, differences in teaching quality dimension scores across conditions. Correlation analysis yielded that lessons and classrooms ranked very similarly across conditions, with measurement error taken into account. However, G Studies revealed that the “unit of analysis” plays an important role in deciding on an optimal scoring procedure. Given slight adaptations to the original study design (e.g., recruiting extra raters or observing a few more lessons), the nonsequential procedure may provide sufficient reliability for most (low-stake) situations in which classroom observation is used, that is, giving feedback to teachers, predicting student outcomes, or evaluating professional development activities. The sequential procedure, on the other hand, did not provide enough precision to inform long-term, classroom-based decisions in our study. These results align with Mashburn et al. (2014), who found that scoring 20-min segments in random order outperformed sequential scoring in terms of reliability and predictive validity.
However surprisingly, we saw a large rater-by-classroom effect for classroom management in the nonsequential procedure, which suggests that raters rank classrooms differently with respect to how well teachers organize lessons. We would have expected that such rater effects were more likely associated with student support or cognitive activation, from which we know that they are usually more difficult to score (e.g., Praetorius et al., 2014).3 Further research is needed to gather more information on why scoring procedures make a difference using other methodological approaches (Ho and Kane, 2013; Mashburn et al., 2014; Quansah et al., 2024). It is possible that lesson variation is higher when using the sequential procedure because every lesson was scored by a single rater, whereas two raters scored each lesson in the nonsequential procedure. This implies that lessons within classrooms are likely to be less similar in the sequential condition (i.e., smaller classroom effects). In other words, an (undesired) rater-by-lesson interaction could add to the estimated lesson random effects. Additionally, this suggests that the segments scored within lessons are more similar in the sequential condition, further increasing lesson variation, while in the nonsequential condition, the rater-by-lesson interaction might get canceled out because different observers produce the scores.
Regarding the limitations of the present study, we see that statistical power was low due to the small sample size. The main conclusions derived from the data, however, do not rely on inferential statistics. We should also acknowledge the large residual components in our G Studies (i.e., unexplained variance). However, the sample size as well as the study design prevented us from including additional facets, which might have explained extra shares of variability in scores. For instance, facets such as lesson segments, objectives, or teaching methods, which are known to be associated with systematic variation in teaching quality, could be considered in future studies.
Conclusion
Findings from this study indicate that observers utilize rating scales similarly across sequential and nonsequential scoring procedures. Moreover, bivariate correlations demonstrated that rankings of classrooms and lessons remain consistent across conditions. However, G Studies reveal that nonsequential scoring captures a greater proportion of between-classroom variance, while sequential scoring captures more variance between lessons. Additionally, the precision of scores is similar for lesson-based decision-making across conditions, but lower for classroom-based decision-making when using the sequential procedure. These results imply that while both conditions largely produce similar ratings, the choice of the scoring procedure might have consequences for the extent to which scores can be used toward a specific purpose. Therefore, scoring designs should ideally be informed by both the study purpose and empirical evidence. Importantly, the latter could depend on the use of a particular observational instrument in a specific context, which limits the extent to which evidence can be used to provide general guidelines informing scoring design.
Data availability statement
The raw data supporting the conclusions of this article will be made available by the authors, without undue reservation.
Ethics statement
The studies involving humans were approved by Sikt, Norwegian Agency for Shared Services in Education and Research. The studies were conducted in accordance with the local legislation and institutional requirements. Written informed consent for participation in this study was provided by the participants’ legal guardians/next of kin.
Author contributions
AJ: Conceptualization, Formal Analysis, Methodology, Software, Writing – original draft, Writing – review & editing. BS: Conceptualization, Project administration, Validation, Writing – review & editing. NT: Supervision, Validation, Writing – review & editing. TN: Funding acquisition, Supervision, Validation, Writing – review & editing. JK: Resources, Supervision, Writing – review & editing. GK: Resources, Supervision, Writing – review & editing.
Funding
The author(s) declare that financial support was received for the research and/or publication of this article. The project was financed by the Norwegian Research Council (the FINNUT program).
Acknowledgments
The article is an extended version of a manuscript presented at the European Conference on Educational Research (ECER) 2024 in Nicosia, Cyprus.
Conflict of interest
The authors declare that the research was conducted in the absence of any commercial or financial relationships that could be construed as a potential conflict of interest.
Generative AI statement
The authors declare that no Generative AI was used in the creation of this manuscript.
Publisher’s note
All claims expressed in this article are solely those of the authors and do not necessarily represent those of their affiliated organizations, or those of the publisher, the editors and the reviewers. Any product that may be evaluated in this article, or claim that may be made by its manufacturer, is not guaranteed or endorsed by the publisher.
Footnotes
1. ^This could vary by a few minutes depending on the length of the lessons or how they were organized. For example, we did not cut the 24-min lesson into segments. In general, we tried to find a short break or a change in teaching methods within a reasonable time frame.
2. ^Estimating a rater-lesson interaction under the sequential condition is not possible because every lesson was scored by a single rater. For this reason and because of the small sample size in our study, we refrained from estimating the rater-lesson interaction altogether.
3. ^A reviewer suggested that this could be the case because of how we measured classroom management. That is, items like time on task (see Table 2) might need more than 20 min to be scored reliably. This idea is in line with Jentsch et al. (2022) who discuss between-lesson and within-lesson variability of classroom management and other dimensions of teaching quality.
References
Bates, D., Mächler, M., Bolker, B., and Walker, S. (2015). Fitting linear mixed-effects models using lme4. J. Stat. Softw. 67, 1–48. doi: 10.18637/jss.v067.i01
Bell, C. A., Gitomer, D. H., McCaffrey, D. F., Hamre, B. K., Pianta, R. C., and Qi, Y. (2012). An argument approach to observation protocol validity. Educ. Assess. 17, 62–87. doi: 10.1080/10627197.2012.715014
Blömeke, S., Jentsch, A., Ross, N., Kaiser, G., and König, J. (2022). Opening up the black box: Teacher competence, instructional quality, and students’ learning progress. Learn. Instruct. 79:101600. doi: 10.1016/j.learninstruc.2022.101600
Casabianca, J. M., McCaffrey, D. F., Gitomer, D. H., Bell, C. A., Hamre, B. K., and Pianta, R. C. (2013). Effect of observation mode on measures of secondary mathematics teaching. Educ. Psychol. Meas. 73, 757–783. doi: 10.1177/0013164413486987
Charalambous, C., and Praetorius, A.-K. (2018). Studying instructional quality in mathematics through different lenses: In search of common ground. ZDM Math. Educ. 50, 535–553. doi: 10.1007/s11858-018-0914-8
Cronbach, L. J., Glaser, G. C., Nanda, H., and Rajaratnam, N. (1972). The dependability of behavioral measurements: Theory of generalizability for scores and profiles. Hoboken, NJ: John Wiley.
Deci, E. L., and Ryan, R. M. (1985). Intrinsic motivation and self-determination in human behavior. Perspectives in social psychology. New York, NY: Plenum.
Ho, A. D., and Kane, T. J. (2013). The reliability of teaching observations by school personnel. Seattle, DC: Bill and Melinda Gates Foundation.
Jentsch, A., Heinrichs, H., Schlesinger, L., Kaiser, G., König, J., and Blömeke, S. (2022). “Multi-group measurement invariance and generalizability analyses for an instructional quality observation instrument,” in Ways of analyzing teaching quality. Potentials and pitfalls, eds M. Blikstad-Balas, K. Klette, and M. Tengberg (Oslo: Scandinavian University Press), 121–139.
Kounin, J. S. (1970). Discipline and group management in classrooms. Austin, TX: Holt, Rinehart & Winston.
Lipowsky, F., Rakoczy, K., Pauli, C., Drollinger-Vetter, B., Klieme, E., and Reusser, K. (2009). Quality of geometry instruction and its short-term impact on students’ understanding of the Pythagorean Theorem. Learn. Instruct. 19, 527–537. doi: 10.1016/j.learninstruc.2008.11.001
Mangold, (2023). Interact (version 18.7.7.17). Available online at: https://www.mangold-international.com/en/products/software/behavior-research-with-mangold-interact.html (accessed September 1, 2024).
Mashburn, A. J., Meyer, J. P., Allen, J. P., and Pianta, R. C. (2014). The effect of observation length and presentation order on the reliability and validity of an observational measure of teaching quality. Educ. Psychol. Meas. 74, 400–422. doi: 10.1177/0013164413515882
Mayer, R. E. (2004). Should there be a three-strikes rule against pure discovery learning? The case for guided methods of instruction. Am. Psychol. 59, 14–19. doi: 10.1037/0003-066x.59.1.14
Pianta, R. C., La Paro, K. M., and Hamre, B. K. (2008). Classroom assessment scoring system™: Manual K-3. Baltimore, MD: Paul H. Brookes Publishing Co.
Praetorius, A.-K., Klieme, E., Herbert, B., and Pinger, P. (2018). Generic dimensions of teaching quality: The German framework of three basic dimensions. ZDM Math. Educ. 50, 407–426. doi: 10.1007/s11858-018-0918-4
Praetorius, A.-K., Pauli, C., Reusser, K., Rakoczy, K., and Klieme, E. (2014). One lesson is all you need? Stability of instructional quality across lessons. Learn. Instr. 31, 2–12. doi: 10.1016/j.learninstruc.2013.12.002
Quansah, F., Cobbinah, A., Asamoah-Gyimah, K., and Hagan, J. E. Jr. (2024). Validity of student evaluation of teaching in higher education: A systematic review. Front. Educ. 9:1329734. doi: 10.3389/feduc.2024.1329734
Schlesinger, L., Jentsch, A., Kaiser, G., König, J., and Blömeke, S. (2018). Subject-specific characteristics of instructional quality in mathematics education. ZDM Math. Educ. 50, 475–491. doi: 10.1007/s11858-018-0917-5
Shavelson, R. J., and Webb, N. M. (1991). Generalizability theory: A primer. Thousand Oaks, CA: SAGE Publications.
Keywords: teaching quality, observation systems, generalizability theory, classroom observation, validity
Citation: Jentsch A, Senden B, Teig N, Nilsen T, König J and Kaiser G (2025) Using Generalizability Theory to examine the effects of presentation order on classroom observation scores. Front. Educ. 10:1547204. doi: 10.3389/feduc.2025.1547204
Received: 17 December 2024; Accepted: 28 April 2025;
Published: 12 May 2025.
Edited by:
Frank Quansah, University of Education, GhanaReviewed by:
Eduardo Hernández-Padilla, Autonomous University of the State of Morelos, MexicoJennifer Igler, Technical University Dortmund, Germany
Copyright © 2025 Jentsch, Senden, Teig, Nilsen, König and Kaiser. This is an open-access article distributed under the terms of the Creative Commons Attribution License (CC BY). The use, distribution or reproduction in other forums is permitted, provided the original author(s) and the copyright owner(s) are credited and that the original publication in this journal is cited, in accordance with accepted academic practice. No use, distribution or reproduction is permitted which does not comply with these terms.
*Correspondence: Armin Jentsch, YXJtaW4uamVudHNjaEBpbHMudWlvLm5v