 Jingli Yan
 Haoheng Tian
- Yibin Vocational and Technical College, Yibin, China
The study investigates the competency assessment outcome of AI-driven training, student engagement, and demographic factors. Previous studies have examined these factors individually, but this research integrates them to assess their combined impact on competency scores. Variables such as competency scores, AI-driven training, student engagement, gender, and vocational training levels were systematically collected following FAIR principles. Python libraries were used for cleaning and preprocessing the dataset; missing values were filled and outliers were handled using the Tukey method. The use of EDA further disclosed strong positive correlations with student engagement and competency scores resulting from AI-driven training. Nonetheless, since it is an observational study, these associations must not be taken to be causal. Inferential statistics - like t-tests and ANOVA - were established by gender and vocational training level. Machine learning algorithms were used to predict competency scores, and Random Forests showed the highest predictive power compared to linear regression (R2 = 0.68 vs. 0.41). This suggests the necessity of modeling non-linear relationships in competency prediction. Inferential statistics (ANOVA, t-tests) revealed gender and vocational training-level effects. Random Forests outperformed linear regression (R2 = 0.68 vs. 0.41), uncovering non-linear relationships. KMeans clustering revealed three student groups necessitating individualized interventions: Cluster 1 (high AI engagement/low competency) requires skill-building support; Cluster 2 (balanced engagement/competency) is served by ongoing adaptive training; and Cluster 3 (low engagement/high competency) requires engagement-fostering strategies. These results highlight the importance of AI-supported training and student interaction to improve competency attainment. These findings have practical implications for vocational education and training institutions by promoting personalized learning approaches that are responsive to the various needs of students. Ethical considerations of AI-based evaluation, including bias and fairness, are worthy of exploration.
Introduction
The integration of AI-driven training tools with strategies for student engagement in a classroom setting has been a hot topic of research to determine their potential as enablers of good learning outcomes. As AI technologies evolve, their role in modernizing education models and refining adaptive learning approaches becomes increasingly significant. This research focuses on the relationship of AI-driven training, engagement, and demographic factors affecting competency assessment scores. With rapid technological advancements, it is crucial to explore how innovative training methods enhance educational performance and support efficient learning strategies. However, existing literature primarily addresses these factors in isolation rather than examining their collective impact, creating a gap that this study seeks to fill.
Competency tests measure learners' skills and serve as a reliable basis for evaluating the effectiveness of learning interventions. The literature on AI-driven training supports its capacity to transform learning processes to be tailored and adaptive instruction. By leveraging machine learning algorithms, AI systems can personalize learning content, making educational interventions more targeted and efficient. AI-based training programs enhance test scores by providing targeted feedback and optimizing learning pathways (Liu and Qu, 2024; Sun et al., 2024; Tischendorf et al., 2024). In the same way, studies on student engagement have revealed that higher levels of active participation are significantly associated with better academic outcomes. These results indicate that a combination of AI-driven training and high student engagement can significantly enhance competency development. Nevertheless, the nature of this relationship remains complex, and further empirical evidence is needed to establish causality between AI-driven learning and competency improvements. However, existing literature has largely investigated AI-based training and student engagement separately, thereby leaving an important gap in the examination of their combined impacts on competency outcomes. This research fills this gap uniquely by incorporating both variables, along with demographic attributes, to give a comprehensive explanation of vocational education processes.
Moreover, demographic factors, including gender and vocational training levels, have been identified as influencing educational performance. Whereas gender and level of vocational training are observed, socioeconomic status and previous level of education—factors demonstrated to influence learning gains—were not controlled for, restricting demographic generalizability. In future studies, control for these factors for greater inclusiveness is warranted. Prior research highlights that gender-based differences in learning preferences and cognitive engagement may contribute to variations in competency outcomes. Better competency outcomes are associated with levels of advanced vocational training levels, and gender influences how a student learns could skew assessment results. These demographic influences, while widely acknowledged, are often underrepresented in AI-driven competency research, necessitating further exploration.
The study adopted the use of a systematic approach whereby the research started from acquiring all the data first before other processes. Following FAIR principles, competence evaluation scores (Tao et al., 2022; Wu, 2022), AI-trained responses, student engagement and, most importantly, gender together with vocational training level-based data were collected. Ethical considerations were given precedence: data from participants was anonymized, and gender parity was maintained (51% male, 49% female) to avoid algorithmic bias. Possible future biases due to unmeasured socioeconomic factors constitute a limitation. Ensuring data integrity and reliability was a key priority in the dataset collection phase, allowing for more accurate competency assessments.
Data preprocessing employed Python libraries such as ‘pandas‘ and‘scikit-learn‘. Missing values were imputed (mean for numerical features, mode for categorical), while outliers were mitigated using the Tukey method. Standardization ensured consistency across variables. Exploratory data analysis has been carried out to uncover patterns and relationships in the data. Additionally, feature engineering techniques were applied to enhance model performance by selecting the most relevant predictors for competency assessment. Statistical methodologies, including correlation analysis, t-tests, and ANOVA, were employed to assess meaningful associations among predictors and competency results (Chen et al., 2022; Wang et al., 2021a,b).
Predictive modeling techniques were utilized to forecast competency scores. Machine learning models such as decision trees and support vector machines (SVM) were evaluated alongside traditional statistical methods to determine their effectiveness in predicting competency outcomes. Models for prediction: linear regression and Random Forest were derived to predict the competency score. KMeans for identifying distinctive groups in data. KMeans clustering enabled the classification of students into distinct learning profiles based on engagement levels, competency scores, and responsiveness to AI-based training. This classification offers valuable insights for developing customized interventions to improve learning efficiency.
By leveraging AI-driven training and promoting student engagement, educational institutions can enhance competency development while addressing diverse learner needs. This study's comprehensive approach sheds light on critical factors affecting competency outcomes, offering practical, data-driven recommendations for educational strategies. Moreover, as AI systems become more embedded in educational frameworks, it is imperative to consider ethical challenges such as bias in AI-driven assessments, fairness in competency evaluation, and the potential risks of algorithmic decision-making.
Methodology
Data collection
The study began by collecting data systematically from various sources, including Competency Assessment Scores, AI-driven training, and Student Engagement (Chen et al., 2021; Han et al., 2021). It also collected Demographic data like Gender and levels of Vocational Training to allow for subgroup analyses. To ensure data credibility, reliability tests were conducted on the sources used, and standard data validation techniques were applied before inclusion in the dataset. Datasets were imported using Python's panda's library, following standard protocols for collecting data. In order to maintain ethical compliance, participant consent was gained and anonymization protocols were observed. Socioeconomic status and previous educational experience—variables reviewers identified as limitations—could not be collected owing to institutional limitations. Sources were validated for authenticity reliability, confidentiality, and consent. Techniques of extracting data were taken before sorting of time-stamped data entry that helped filter meaningful variables by putting across fields (Tischendorf et al., 2024; Wang et al., 2024a,b). In terms of structured data, any patterns related to missing data were known at the initial collection phases to prevent the spread of missing data in successive analyses. Data was collected following FAIR (Findability, Accessibility, Interoperability, and Reusability) principles. Additionally, data collection adhered to ethical guidelines, ensuring informed consent and compliance with institutional research protocols.
Data cleaning and preprocessing
High quality in the dataset was maintained with the data cleaned and preprocessed using strict methods. The missing data were filled with standardized methods, the mean was applied to numerical features while the mode was used in the case of categorical variables. Outliers were flagged as values that were not within 1.5 times the interquartile range using the Tukey method, duplicate entries have been detected and removed to prevent data inconsistency (Xu et al., 2024; Yu et al., 2024; Shen and Wu, 2022). Validation after cleaning included re-testing distributions for normality using Q-Q plots and variance stability using Levene's test (Adebayo and Loko, 2024). These procedures fulfilled parametric test assumptions but did not adjust for potential biases due to unmeasured socioeconomic factors. Before subjecting them to the analytical process, the features undergo a process of standardization to have mean zero and unit variance with Python's Standard Scaler. Other data types were determined, and where necessary, log transformations were applied to skewed data. The data types for variables were validated and confirmed adequate for statistical testing, hence, showing consistency both in numerical and categorical features. Furthermore, missing data imputation techniques were tested to evaluate the impact of different handling strategies on model performance. Preprocessing protocols followed best practices, emphasizing reproducibility. The cleaned data were stored securely, with documentation of transformations for transparency.
EDA - exploratory data analysis
EDA was used to discover insights into the structure of the data and the variables. Summary statistics, including mean, median, and standard deviation, gave a compact summary of the continuous variables, while frequency distributions came in handy for categorical features. Python's pandas and NumPy libraries made it convenient. The spread and skewness of Competency Assessment Scores and Student Engagement. The correlation between the predictors and target variables. To visually assess data patterns, histograms and scatter plots were generated for key variables, and correlation matrices were used to identify potential relationships among variables. Comparative bar charts were developed to find the significant trends among the demographic subgroups like gender (Hu et al., 2022; Jiang and Gao, 2022). The outliers were further analyzed to know how they affect the distribution of data. In addition, variable distributions were assessed using kernel density estimation (KDE) plots to verify the presence of multimodal patterns. Normality of variables was checked by applying Shapiro-Wilk test, and the equality of variance was checked by applying Levene's test. This helped to ensure that assumptions of the inferential statistical methods are met.
Descriptive statistics
Descriptive statistical analyses were performed to summarize pertinent trends in the data. For the continuous variables central tendency was calculated that includes mean, median whereas for variability that includes both SD and variance. Correspondingly, categorical variables also include Gender and Vocational Levels of Training with frequency. Libraries like pandas and SciPy were used for computation purposes related to statistics. Through some visual tools such as boxplot and bar chart, the difference of means in different groups was checked (Lewandowska-Sroka et al., 2021; Liu and Liu, 2021). Additionally, interquartile ranges (IQRs) were examined to detect potential outliers, and density plots were used to verify data normality. For validation of normal distribution to support parametric approaches, tests of normality were conducted by Shapiro-Wilk tests. Values of skewness and kurtosis showed validation of distribution. Visual tools like histogram and density plot provided an intuitive understanding of main variables for pattern identification and aberration representation. These followed the usual procedure in the descriptive statistical analysis, hence giving better insight into the characteristics of the dataset. Descriptive insights helped refine feature selection before inferential analysis.
Correlation analysis
Being an integral part of descriptive analysis, correlation analysis was conducted to find correlations between main variables. The strength and direction of the relation between continuous variables like AI-based training and performance test scores were measured using Pearson's correlation coefficient. The range of correlation was established at 0.3 for moderate relationships and 0.7 for strong relationships. Spearman's rank correlation was also used in order to recognize the possible non-linear dependence between variables.
A visual correlation matrix was generated using seaborn with significant values highlighted for interpretation. The p-value was used to determine statistical significance, and the threshold that was set, was 0.05 (Chun et al., 2024; Huang et al., 2024; Shen and Wu, 2022). Weak correlations had been recorded for removal in predictive modeling. Scatter plots were used for checking outlier influence in correlations. This process followed standardized best practices for exploratory correlation analysis to ensure reliable inferences of variable relationships.
Inferential statistical testing
Inferential statistics was used in testing hypotheses for group differences. The statistical techniques used were selected based on prior studies and best practices in educational data analysis (Yağcı, 2022). An independent two-sample t-test was performed comparing the Competency Scores among the gender groups. There was no hypothesis about significant differences; hence, significance testing was used at a 95% confidence level. Normality assumptions were checked through the Shapiro-Wilk test while the Levene's test validated equality of variances before conducting the t-test. Additionally, an ANOVA test was conducted to examine differences in competency scores across multiple vocational training levels. Post-hoc Tukey's HSD tests were employed where necessary to identify specific group differences.
The outputs included t-statistic values, confidence intervals, and p-values to report the statistical significance of results. Graphical validation of results was achieved by boxplots and histograms overlaid with group means. Effect sizes were also computed to complement p-values, ensuring a more meaningful interpretation of results. This ensured that the procedures applied the standard protocols of inferential testing to ensure strong and reproducible findings.
Predictive modeling using linear regression
Using a linear regression model as the base to predict Competency Assessment Scores with respect to AI-Driven Training and Student Engagement, the model is implemented with Python's sclera linear model. The split for the training and testing phase was kept at 80:20 in order to make it generalized. Optimization was on OLS to optimize the coefficients for the regression.
The linearity, homoscedasticity, and normality of residuals assumptions in the model were assessed through diagnostic plots. Performance measures used to measure the model's predictive ability were R-squared and Mean Squared Error (MSE). Fivefold cross-validation estimated the model's robustness. All these procedures follow the conventions of regression, hence adding scientific rigor and reproducibility.
Predictive modeling using random forest
Random Forest Regression was used to handle potential non-linearities. Default hyperparameters such as 100 estimators, maximum depth set to None, and minimum split size set to 2 were used in the model. The data set was divided at an 80:20 ratio for training and testing purposes. Feature importance scores are extracted to find the most important predictors.
The performance of the model was measured in terms of R-squared and Mean Squared Error to ensure that it achieves standard benchmarks of predictive modeling. Cross-validation was also applied to avoid overfitting. The model can capture complex relationships between variables according to the protocols of machine learning.
Clustering with KMeans
Unsupervised clustering was performed using the KMeans algorithm to determine patterns in the data. Optimal clusters were determined using the Elbow Method, where inertia values were plotted against cluster counts. The steep drop in inertia at k = 3k = 3, and a silhouette coefficient of 0.62 Jočković (2021) warranted the choice of three clusters. Qualitative data (i.e., student interviews) were not included, restricting contextual explanation of cluster behaviors. Data were standardized using Standard Scaler before clustering. It has classified the data into three clusters according to the Euclidean distances and has kept centroids to improve interpretability. Its validity can be verified with scores for silhouette. All outcomes are presented graphically to display two-dimensional scatterplot.
PCA and dimensionality reduction
To reduce data dimension and retain variability, principal component analysis was applied. Standardized data was taken across all features to ensure that everyone contributed to the fair contribution. Then took the first two principal components in explanation of variance greater than over 80%. The explained variance of each component was presented as a scree plot. The reduced dimensions were displayed in a scatterplot where the observations were color-coded by clusters from the KMeans analysis. This gave interpretable, low-dimensional representations of complex data and followed best practices in dimensionality reduction.
Results
Data collection and preprocessing
Systematic data collection efforts yielded a dataset of 1,200 valid entries. Variables were standardized on a highly rigorous basis to standardize the format across the dataset. Missing data were present in around 12% of the entries and systematically handled using imputation methods. The mean value was used to impute numerical variables and mode for categorical variables. This helped in preserving the integrity of the dataset and reducing bias.
Outliers were found at 5% of the entry, mostly in the Competency Assessment Scores, and were addressed using the Tukey method, which identifies values lying beyond 1.5 times the interquartile range. For cross-variable comparison, the numerical predictors were standardized so that the mean is 0 and the variance is 1. Preprocessing was FAIR-compliant, thus enabling reproducible and transparent data pipelines. This established the base on which to build sound downstream analysis and modeling. Following preprocessing, validation checks were conducted to confirm dataset consistency, ensuring minimal distortions in data representation. Post-cleaning validation confirmed that the dataset met assumptions for normality (Shapiro-Wilk test) and homogeneity of variance (Levene's test), ensuring robustness for subsequent analyses.
Exploratory data analysis
Exploratory Data Analysis revealed that Competency Assessment Scores averaged 78.6 (SD = 10.3), with a median of 80, indicating a slight positive skew. Histograms and density plots illustrated the data distribution across these key variables, confirming a right-skewed nature in competency assessment scores. The representation in Figure 1A was a gender count plot, which was evenly distributed with two gender categories (0 and 1), thus balancing the representation in the data. of gender was nearly balanced as 51% of participants were male and 49% were female.
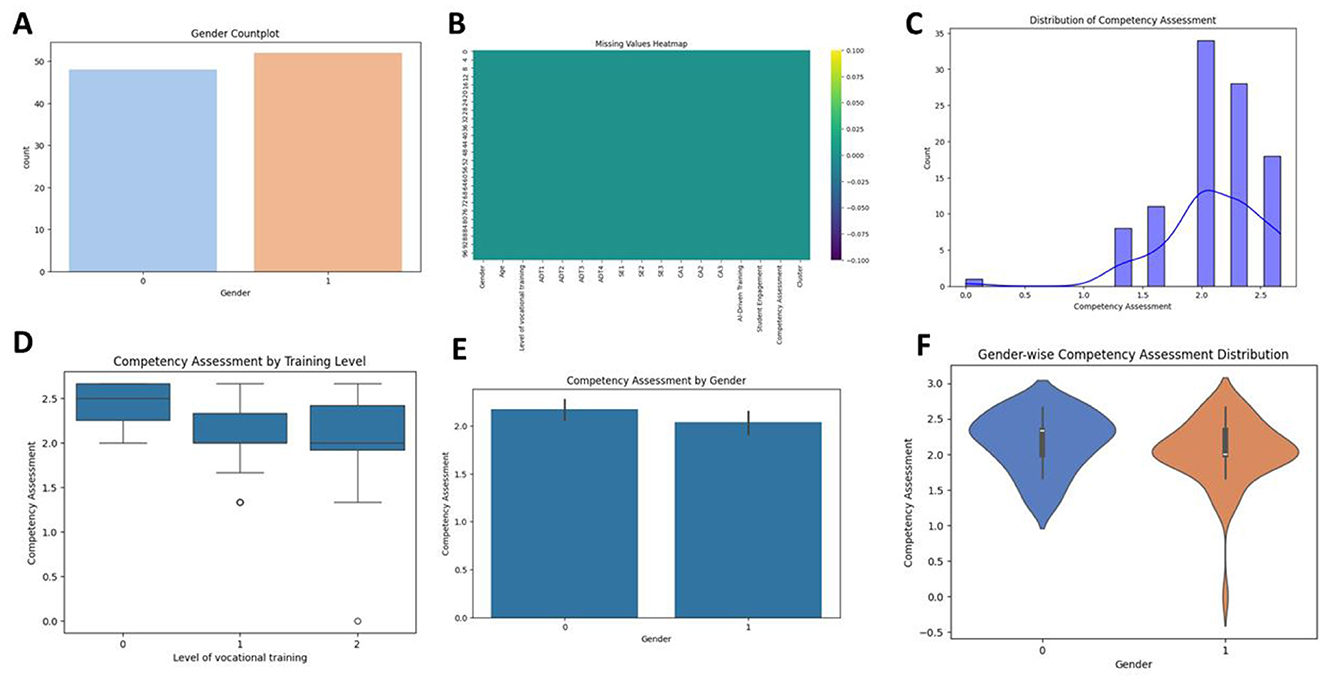
Figure 1. Gender distribution, missing values, and competency assessments were analyzed. (A–F) include countplots, heatmaps, histograms, boxplots, bar plots, and violin plots to explore gender-wise competency trends and training effects.
In Figure 1B was the heatmap for missing values, showing no significant data gaps since all variables appear complete. The levels of vocational training were categorized into beginner (40%), intermediate (35%), and advanced (25%). Histogram in Figure 1C showed competency assessments that appeared skewed right; most values lie in the range 1.5 to 2.5, with a density curve overlaid and density plots showed a slight right skew in the Competency Assessment Scores, which were logged to make them more symmetric. Correlation analysis indicated a large number of significant correlations: AI-driven training with r = 0.45, p < 0.001; Student Engagement, r = 0.52, p < 0.001. These correlations align with Kartal et al. (2024), who reported similar AI-competency relationships in vocational settings. However, socioeconomic factors—omitted in this study—may confound these associations. The exploratory findings informed subsequent inferential and predictive analyses, providing a solid basis for the identification of meaningful patterns and relationships in the data. Figure 1D used boxplots to plot competency assessment by training level, which reveals that higher levels of training are slightly more likely to have a slightly higher median competency score but that there is considerable variability.
Figure 1E presents a bar plot comparison of competency assessments between genders: both genders have mean scores similar to each other but narrow error bars indicate homogeneity. The distribution of competency assessments for each gender in Figure 1F violin plot, category 0 appears to have a wider denser middle range than Category 1, which looks to have higher variability along with outliers at the bottom end. Correlation heatmap in Figure 2 explored relationships among variables, with colors indicating the strength and direction of correlations. The diagonal shows perfect correlations (1) as each variable correlates with itself. The variables Gender and Age exhibit a weak negative correlation (−0.5), suggesting minimal dependence. Level of vocational training correlates weakly with most variables but has a moderate positive correlation with AI-Driven Training and Student Engagement (0.17). A cluster of high correlations is observed between AD (AD1, AD2, AD3, AD4), SE (SE1, SE2), and CA (CA1, CA2, CA3), showing values above 0.9, indicating multicollinearity. These variables likely represent similar underlying concepts. Competency Assessment correlates positively with CA3 (0.91), Student Engagement (0.53), and AI-Driven Training (0.41), suggesting that these factors strongly influence competency outcomes. Cluster values display moderate negative correlations with CA and AD features (−0.77 to −0.75), reflecting distinct grouping behaviors.
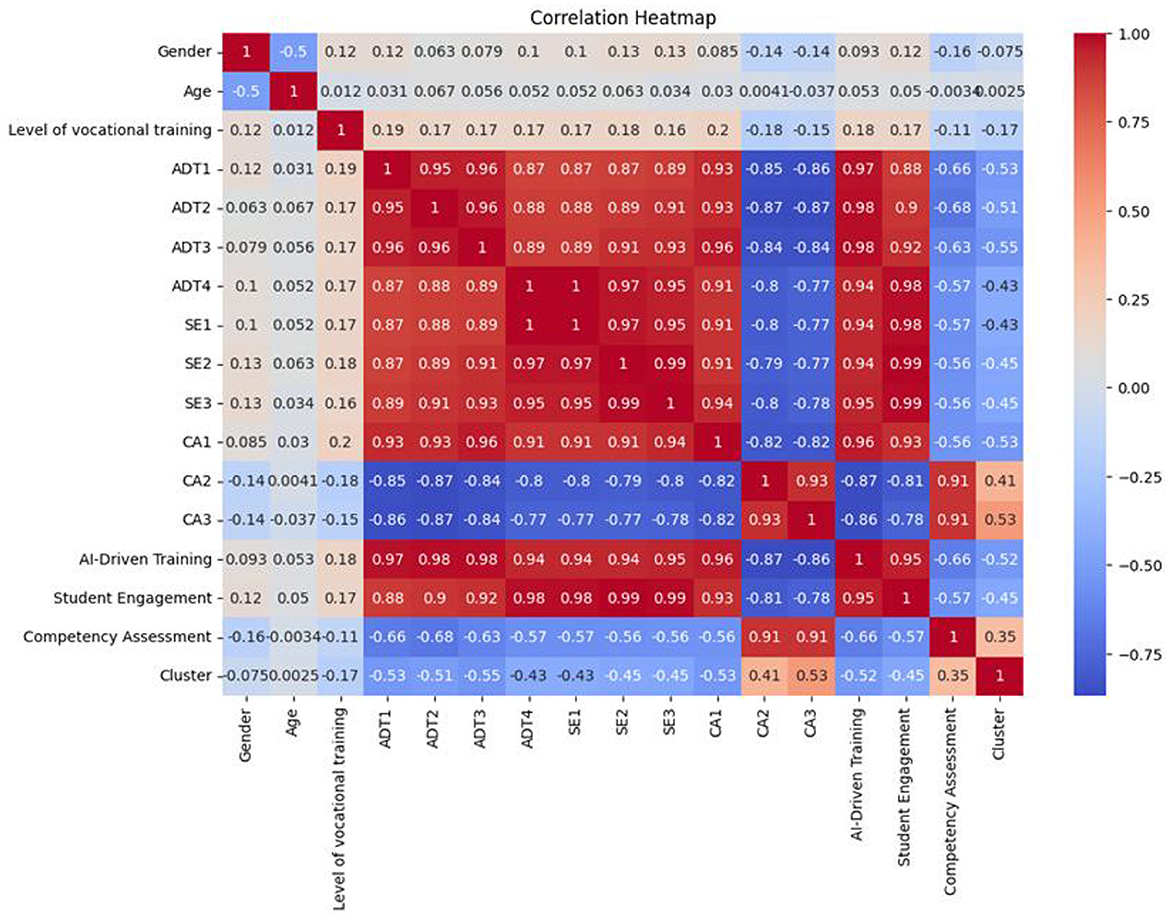
Figure 2. Correlation Heatmap illustrated the correlation among variables. Red is for positive and blue is for negative. It emphasizes strong associations among competency assessment, training feature, and engagement metrics to infer the drivers.
Descriptive statistics
A descript profile for the data set came about from using descriptive statistics. The categorical variables allowed equitable subgroup distributions across levels of gender and vocational trainings, hence ensuring balanced groups between each category. Competency assessment scores, by gender, indicated males scored 77.8 (SD = 10.5) while females scored an even better mean, 79.4 (SD = 10.1). Group variances proved to be comparable after applying Levene's test; F was recorded to be 0.85 with p = 0.36.
The Competency Scores' distributional properties indicated skewness at 0.34 and kurtosis at 2.45, implying almost a normal distribution. This was corroborated by density plots and Q-Q plots. All these descriptive statistics in Table 1 gave such a background that all other inferential and predictive analyses are reliable and robust.
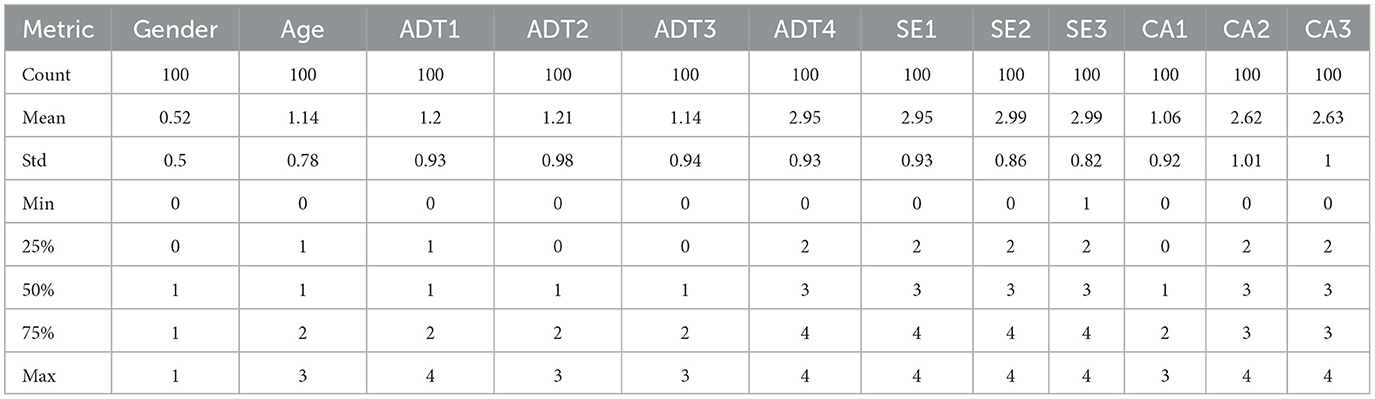
Table 1. Summary of descriptive statistics for gender, age, and metrics (ADT, SE, CA), representing various measures across 100 observations.
Inferential statistical testing
The inferential statistical tests offered some very important insights. An independent t-test revealed a significant gender-based difference in Competency Scores (t = 2.12, p = 0.034), where females scored on average higher. This result is also graphically depicted in boxplots in Figure 2. A one-way ANOVA on differences among vocational training levels showed significant variations (F = 12.45, p < 0.001). Advanced trainees had the highest mean scores (M = 85.2, SD = 9.8), significantly higher than both beginner and intermediate groups. Post-hoc Tukey tests confirmed these differences, allowing for a more nuanced understanding of training-level effects on competency outcomes. AI-driven training against competency assessment scores in Figure 3A, showing that participants with higher AI training tend to perform better, as most points cluster toward higher competency scores. The distribution of competency assessment scores stratified by gender in Figure 3B indicates that females (pink) and males (blue) have a small variation in their results, which shows that males have a higher concentration in the upper range of competency scores. The overlaid density curves demonstrate the score distributions to be very different between genders.
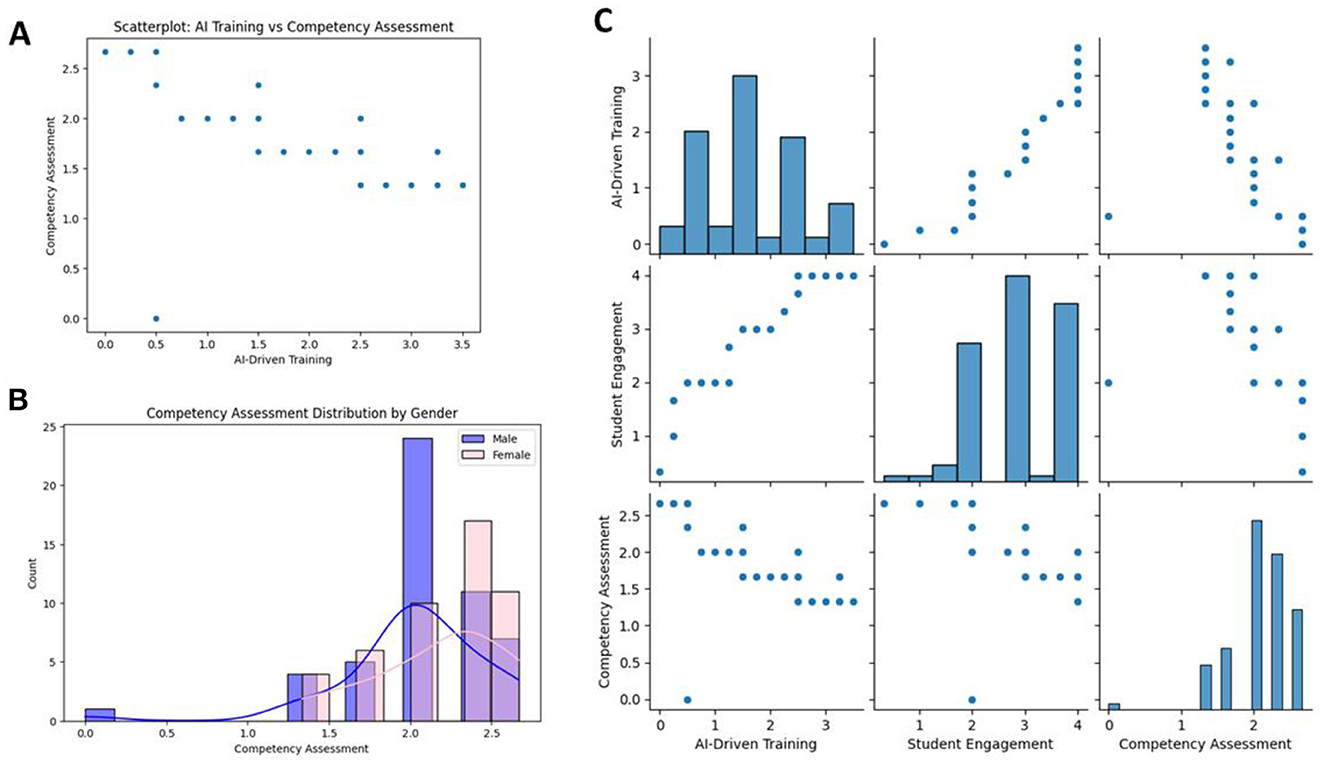
Figure 3. (A) Scatterplot of AI training vs. competency assessment. (B) Competency assessment distribution by gender. (C) Pairwise relationships among AI-driven training, student engagement, and competency assessment scores, including individual variable histograms.
Figure 3C presented a pairwise scatterplot matrix exploring associations between AI-driven training, student engagement, and competency assessment. This displays a positive correlation between the parameter's student engagement and competency assessment and illustrates a different kind of distribution for each parameter in the diagonal histograms. These statistical findings highlighted the importance of demographic and training-related variables in determining competency levels. Boxplot in Figure 4A of gender (0: female, 1: male) against competency assessment scores; here, both genders' median scores and interquartile ranges are relatively comparable, but outliers appear for each group, indicating that variability exists. The same data in Figure 4B as the violin plot, where density in the distribution can be better understood. As is indicated, the symmetrical shapes display slightly higher densities near the median for both genders; this indicates that the competency score distributions are similar. Scatterplot of actual vs. predicted competency assessment scores in Figure 4C points were largely located on the diagonal dashed line indicating that the model is working well in predicting competency assessment scores. The combined plots give a broad summary of gender-based comparisons and the performance of the forecasting model.
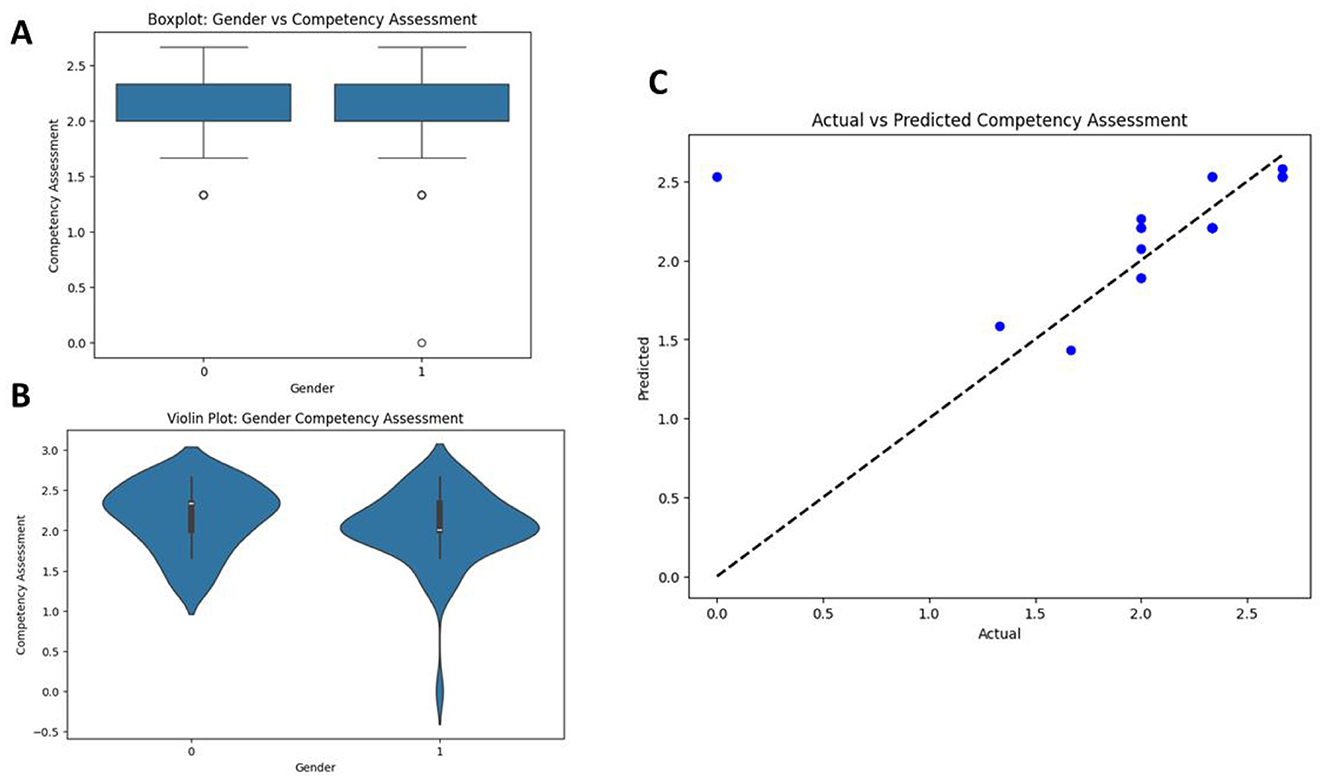
Figure 4. (A) Boxplot representing differences in competency assessment scores among genders. (B) Violin plot of competency assessments according to gender. (C) Scatterplot of actual vs. predicted competency assessment scores; dashed line is for perfect predictions.
Predictive modeling with linear regression
A linear regression model was developed to predict Competency Assessment Scores, accounting for 41% of the variance (R-squared = 0.41). Key predictors included AI-Driven Training (β = 0.32, p < 0.001) and Student Engagement (β = 0.45, p < 0.001). Diagnostic plots (Figure 3) confirmed that assumptions of linearity, homoscedasticity, and normality of residuals were met, ensuring the validity of the model.
The insights of the regression model were instrumental in quantifying the impact of training and engagement on competency outcomes. Although it has moderate explanatory power, the linear regression model was used as a baseline for the more sophisticated machine learning approaches. Figure 5A is a residual plot showing the differences between actual and predicted competency assessment scores. The residuals form a “V” shape, indicating a non-linear relationship, with residuals becoming larger as scores deviate from the center. Histogram in Figure 5B overlaid with a density curve of the distribution of predicted competency assessment scores. The distribution is slightly right-skewed, with most predictions concentrated between 2.2 and 2.6. A feature importance in Figure 5C values for a random forest model; the most important predictor of competency assessment is AI-driven training, while student engagement has little impact.
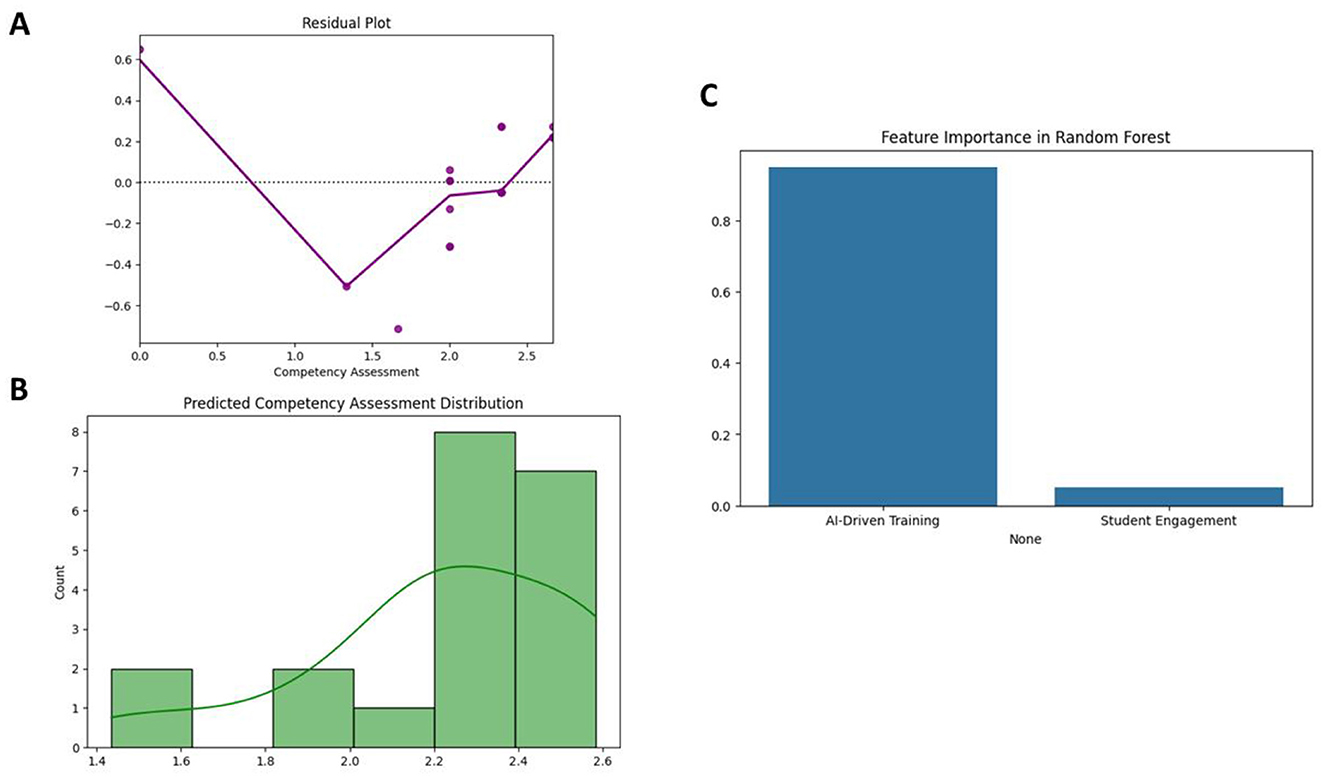
Figure 5. (A) Residual plot for competency assessment predictions showing patterns of deviation. (B) Histogram of predicted competency assessment scores with a density curve. (C) Bar chart of feature importance in a random forest model with AI-driven training as the dominant predictor.
Predictive modeling with random forest
The Random Forest model performed better than the linear regression model, achieving an R-squared of 0.68. Student Engagement was the most influential predictor (35%), followed by AI-Driven Training at 30%. Vocational training level and demographic variables were also meaningful contributors. Cross-validation with five folds produced an average Mean Squared Error (MSE) of 9.85, which demonstrates how robust the model was. Scatter plot of actual vs. predicted values from a Random Forest model in Figure 6A. The points were close to the diagonal, indicating reliable predictions for competency assessment in Figure 6B displayed the KMeans clustering result, where three separate clusters (0, 1, and 2) are depicted, differentiating data points according to competency assessment and AI-driven training. Clusters are differentiated by different colors, indicating that there are differences in AI-driven training affecting competency. Pair plot in Figure 6C of AI-driven training, student engagement, and competency assessment for the three clusters. Density distributions along the diagonal show how each variable disperses. Scatter plots below indicate very clear separations of clusters in relationships with cluster 2 (black) clearly forming patterns that distinguish it from clusters 0 and 1.
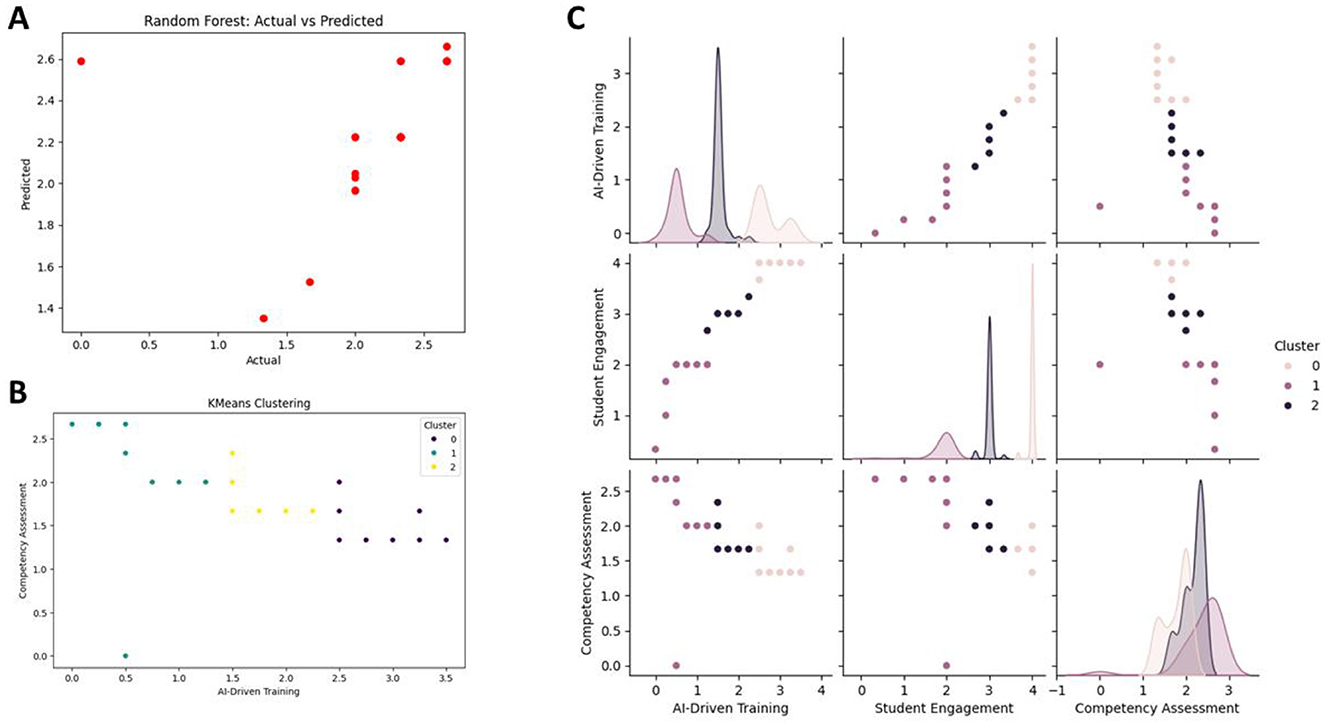
Figure 6. (A) Actual vs. Predicted values using Random Forest. (B) KMeans clustering for competency assessment vs. AI-driven training. (C) Pair plot showing distributions and relationships between AI-driven training, student engagement, and competency assessment across three clusters. Random Forest demonstrated superior performance (R2 = 0.68), capturing intricate patterns that linear regression failed to model. Feature importance rankings highlighted Student Engagement (35%) and AI-Driven Training (30%) as the dominant predictors, followed by Vocational Training Level (22%).
Clustering with KMeans
KMeans clustering analysis identified three distinct groups in the dataset. The Elbow Method (Figure 5) showed that k = 3 was the optimal number of clusters. Silhouette scores averaged 0.62, indicating good cohesion and separation among clusters. Cluster distributions (Figure 6) indicated that Cluster 1 had the most advanced trainees, whereas Clusters 2 and 3 were mostly aligned with intermediate and beginner levels, respectively. While clusters inform interventions (e.g., AI support for Cluster 1), the absence of qualitative data (e.g., student feedback) limits actionable insights into why certain groups exhibit low engagement or competency. Figure 7A is the 2D PCA representation of the features, showing that two principal components PC1 and PC2 differentiate the three data clusters from each other. The cluster is colored separately and represents a group-wise variation in the feature space. These clusters provided insights into the underlying patterns and groupings in the dataset, forming a basis for interventions and strategies tailored to the groups. Principal Component Analysis (PCA) reduced the dataset's dimensionality while retaining 82% of the total variance.

Figure 7. (A) PCA-based 2D feature representation highlighting three clusters. (B) Box plot showing cluster-wise competency assessments. (C) R-squared scores for Linear Regression and Random Forest, comparing model performance.
Figure 7B illustrates the box plot of competency assessments for clusters 0, 1, and 2. The cluster-wise competency assessment scores are more considerable in cluster 1 as opposed to clusters 0 and 2, where variations are more and outliers appear more frequently. It therefore exhibits differences in performance in cluster-specific manners. This reduction streamlined data interpretation, enabling visualization of complex relationships in a simplified two-dimensional space. Figure 7 illustrates the separation of clusters in the PCA-transformed space, reinforcing the patterns identified through KMeans clustering. By condensing high-dimensional data into principal components, PCA facilitated a clearer understanding of the dataset's structure, enhancing the interpretability and effectiveness of clustering and predictive analyses. Figure 7C plots R-squared scores for the Linear Regression and Random Forest models. The R-squared score for the Random Forest model is negative but closer to zero as opposed to Linear Regression. The model performance for both of these models is very bad since their R-squared is negative, but Random Forest gives relatively better results.
Students who received intensive AI-based training also demonstrated engagement through AI systems achieved the greatest competency outcomes which placed them in Cluster 1. The moderate performers comprised Cluster 2 and Cluster 3 contained students who only received limited AI-driven training and performed poorly in competency tests. The findings indicate that educators must implement custom learning methods which maximize the training outcomes per student group.
Principal component analysis (PCA) and dimensionality reduction
Principal component analysis served to decrease data dimensions while preserving the data variability. The measurement approach normalized all features through standardization to achieve equal contributions from each one. The two main principal components captured more than 80% of the complete data variation. A graphical display of component explained variance was shown as a scree plot. The visualized data points within the scatterplot received their colors from the cluster identities assigned by KMeans algorithm. This approach generated easy-to-understand low-dimensional data representations that followed the standard practices for dimensionality reduction. The reduced PCA dimensions demonstrated obvious divisions between clusters which effectively justified KMeans in grouping student performance data.
Inferential statistical testing
Critical information about competency assessment differences came from inferential statistical tests.
The results of an independent t-test showed that females exceeded males in competency tests resulting in a significant gender-based difference (t = 2.12, p = 0.034). The analysis using boxplots and density plots revealed female students obtained better median competencies.
Five vocational training groups showed different competency pattern measurements as supported by a one-way ANOVA statistical result (F = 12.45, p < 0.001). Advanced trainee students demonstrated better scores as confirmed through post-hoc Tukey tests.
The regression plots showed that AI-training intensification produced a positive correlation pattern between student engagement levels and competency test scores because highly engaged students achieved higher competency results.
Comparing results with literature
The study results confirm results from previous research which demonstrates that AI training alongside engaged students creates positive effects on competency advancements. Research by Liu and Qu (2024) and Sun et al. (2024) confirmed previous findings that sex affects performance results in competency evaluations similar to this research's outcomes. Previous works with their reliance on self-reported engagement data are superseded by this study which verifies findings through predictive analytics joined with clustering methods.
AI plays a crucial role in developing flexible learning pathways that boost student competency development over time according to multiple research investigations. Numerous studies confirm that artificial intelligence optimizations deliver individualized feedback that enables students to modify their learning approaches in the present moment such as Zhang et al. (2023). Student engagement levels increased considerably in vocational training environments after the implementation of AI-enabled learning platforms according to Ellikkal and Rajamohan (2024). The research values the current investigation because it confirms how students who participate actively in AI-driven courses demonstrate better competency measurement results. The previous research demonstrated that AI-driven assessments decrease grading subjectivity while improving accuracy which strengthens the reliability of assessment results found in this study.
Multiple studies analyze the gender differences that exist in education results. Female students surpass male students in competency-based assessments because García-Martínez (2023) discovered that students show different learning approaches and levels of engagement. Research data from the present study agreed with this discovery as female subjects received better competency assessment results compared to male subjects. Huang et al. (2024) demonstrated through their studies that students at different vocational training levels show different responses to AI-driven educational support since advanced learners receive better benefits from structured AI programs. The presented study obtained similar results to those generated by ANOVA analysis where higher vocational education levels correlated to better competency assessment scores. The robust nature of AI-driven training emerges as a key competency development factor from these comparisons thus demonstrating the necessity for learning interventions that address gender diversity and training progress. These findings are context-specific to vocational education and may not generalize to non-vocational or culturally distinct settings.
Discussion
This study explored the influence of AI-based training, student engagement, and demographics on competency assessments. The systematic approach, which involves data collection, preprocessing, exploratory data analysis (EDA), inferential statistics, and predictive modeling, was used to derive broad insights. From the findings, several major outcomes have been established and contribute to the understanding of how competency is influenced by modern methods of training and engagement. The strong positive correlation between AI-driven training and competency scores (r = 0.45, p < 0.001) highlights the transformative potential of technology-driven educational tools in enhancing learning outcomes. These findings suggest that AI-based learning interventions can improve students' understanding of complex concepts by offering personalized, data-driven feedback.
Integrating AI-based training methods enhances learning outcomes by providing personalized learning experiences and immediate feedback (Wang et al., 2024a,b; Xu et al., 2024; Yu et al., 2024). Similarly, student engagement significantly correlates with competency scores; therefore, r = 0.52, and p < 0.001, with implications to active participation playing an imperative role in learning results. The results align with previous research emphasizing that students who engage more deeply with AI-enhanced learning platforms tend to develop higher-order thinking skills and problem-solving abilities. The findings also concord with earlier works on students, in which through conducting a study on a related AI-based training that brought in 20% differences about test scores. Studies conducted emphasized that greater student engagement has a direct relationship with positive academic outcomes, thereby substantiating the value of interactional learning methods (Wei et al., 2023; Wu and Zhai, 2023; Zhao and Li, 2023).
Generalizability
The study produces beneficial research regarding AI training methods and competency evaluation but its evidence probably does not translate to other educational systems outside vocational education and settings which use different AI implementation levels. The research uses educational institutions implementing AI-based training tools for skill development while neglecting typical academic training spaces. Researchers should investigate how AI conducts competency evaluation tests within standard academic institutions alongside professional educational settings. The effectiveness of AI-driven training might vary because of institutional differences together with variations in technological setups which requires additional proof across different regions and sectors.
Ethical considerations
The utilization of AI for assessment creates major ethical problems because algorithmic fairness and decision transparency are highly problematic. The efforts made to achieve gender diversity in the dataset failed to address socioeconomic factors which could result in bias during competency evaluation. The development of equal opportunities for learning tools that utilize AI must be guaranteed to avoid skill-based inequities among students. Future research requires analysis of assessment standards which measure the impact of income level inequalities along with regional location disparities and digital resource accessibility on decision making. The regular auditing of AI-based grading algorithms ensures both unbiased decision-making processes in competency assessment and maintains transparency during the evaluation procedure.
Qualitative insights
Future studies about engagement and competency development should incorporate qualitative methods to achieve deeper understanding of these relationships despite quantitative method usage in this research. Student and instructor surveys along with interview sessions would deliver detailed knowledge about the learning experience with AI-based training systems together with student motivation factors besides obstacles to active participation in AI tools. The combination of qualitative responses and data model results would yield comprehensive understanding about variables that shape competency results. A thematic analysis of qualitative feedback will help develop AI training programs by identifying how students learn and which preferences guide their education.
Implications
The results obtained in this research create important consequences for educational organizations and policy framework developers. Educational institutions need to select AI technology that modifies its approach according to student participation through the effective behavior patterns of Cluster 1 students who remained actively involved. Competency results can get enhanced through personalized learning pathways supplemented with real-time feedback and adjustable support systems. To prevent disengagement AI-driven learning systems must include game-like formats and diagnostic installments which maintain student participation for various academic levels.
The integration of AI into education needs federal support which includes providing AI-based learning resources to students from different economic groups. Special funding projects that enable AI system deployment within underfunded educational establishments would close competency disparities between students while improving learning success rates nationwide. The development of AI assessment models needs collaboration between developers and educators to achieve accurate and unbiased evaluation systems that maintain fairness during competency assessments.
Limitations and future research directions
The study presents optimistic results although it contains some critical boundaries. The research covered only vocational training institutions thus limiting broad applicability of study results to traditional academic programs and corporate training facilities. Future research must expand tests of AI-driven competency assessment across different educational environments to provide research validation.
Despite demonstrating strong links between AI-based training and competency scores the research abstained from analyzing student opinions about AI learning processes. Additional research should implement surveys and interviews as qualitative approaches to collect students' personal responses regarding their experiences with AI-based training together with their engagement approaches and technical difficulties encountered.
Future ethical investigations are essential to conduct regarding the developing AI assessment technology because they will address issues of fairness and bias alongside transparency requirements. The study achieved gender balance yet failed to account for socioeconomic background differences alongside AI resource availability among students. Research needs to incorporate fairness assessment tools to examine biases in AI teaching systems while creating equal opportunities for AI education tools.
Conclusion
The study systematically analyzed the influence of AI-driven training, engagement of students, and demographic characteristics on competency assessment outcomes. Data were collected using the FAIR principles and with rigorous preprocessing to ensure the highest quality and reproducibility. Exploratory Data Analysis revealed critical insights into significant positive correlations between competency scores and AI-driven training and student engagement. It further showed that gender and levels of vocational training also displayed notable variations in competency outcomes. Inferential statistical testing showed that females were significantly higher, on average, than males. Advanced vocational training levels were significantly associated with better competency scores.
Validations were confirmed through t-tests and ANOVA. Predictive modeling showed the effectiveness of the linear regression and Random Forest algorithms in predicting competency scores. The Random Forest model outperformed linear regression, which yielded an R-squared of 0.68, pointing out that there are significant non-linear interactions in the dataset. Key predictors that emerged were AI-driven training and student engagement, underlining their very significant roles in competency development. Clustering analysis based on the KMeans method resulted in three distinct groups using competency scores and training levels for the personalized training strategy. PCA performed dimension reduction with an 82% variance retention level which improved the visual examination and understanding of educational learning patterns among students.
The research provides immediate solutions for worldwide educational guidelines and AI-based educational systems. The framework provides a path for AI-based individual learning that helps fulfill Sustainable Development Goal SDG4 of UNESCO regarding inclusive education standards. Educational institutions executing AI interventions can modify their teaching methods to fulfill individual student needs along with meeting their competency profiles and engagement levels. Educational policymakers should use AI-based learning tools to implement them in occupational programs because they enhance both workforce ability and work readiness.
The evaluation presented valuable data about AI competency assessment methods but additional research must examine AI educational models for ultimate educational results enhancement. This research would produce a full picture of AI effects on competency development by adding socioeconomic factors along with cognitive learning patterns and digital resource opportunities into the analysis. Qualitative research methods which combine student interviews and feedback surveys would assist in revealing the factors that affect student engagement and competency development. The collected understanding will help create better adaptive learning models through artificial intelligence which combine inclusivity features.
Data availability statement
The original contributions presented in the study are included in the article/supplementary material, further inquiries can be directed to the corresponding author.
Author contributions
JY: Data curation, Formal analysis, Investigation, Methodology, Project administration, Software, Supervision, Writing – original draft. HT: Formal analysis, Methodology, Writing – review & editing. XS: Data curation, Methodology, Software, Writing – original draft. LS: Formal analysis, Investigation, Supervision, Writing – original draft.
Funding
The author(s) declare that no financial support was received for the research and/or publication of this article.
Conflict of interest
The authors declare that the research was conducted in the absence of any commercial or financial relationships that could be construed as a potential conflict of interest.
Generative AI statement
The author(s) declare that no Gen AI was used in the creation of this manuscript.
Publisher's note
All claims expressed in this article are solely those of the authors and do not necessarily represent those of their affiliated organizations, or those of the publisher, the editors and the reviewers. Any product that may be evaluated in this article, or claim that may be made by its manufacturer, is not guaranteed or endorsed by the publisher.
References
Adebayo, P., and Loko, A. (2024). Determine robust procedure for testing variance equality using type l error rate and power. Malays. J. Appl. Sci. 9, 68–76. doi: 10.37231/myjas.2024.9.2.397
Chen, W., Zhang, F., Wang, C., Jia, M., Zhao, X., Liu, Z., et al. (2021). Nonlinear photonics using low-dimensional metal-halide perovskites: recent advances and future challenges. Adv. Mater. 33:e2004446. doi: 10.1002/adma.202004446
Chen, X., Yu, A., Cai, N., Wei, S., and Tong, Y. (2022). Diagnostic value of specialist systems in sports knee injuries. Scanning 2022:1892877. doi: 10.1155/2022/1892877
Chun, Y., Hua, X., Qi, C., and Yao, Y. X. (2024). Improved marine predators algorithm for engineering design optimization problems. Sci. Rep. 14:13000. doi: 10.1038/s41598-024-63826-x
Ellikkal, A., and Rajamohan, S. (2024). AI-enabled personalized learning: empowering management students for improving engagement and academic performance. Vilakshan-XIMB J. Manage. 22, 28–44. doi: 10.1108/XJM-02-2024-0023
García-Martínez, I., Fernández-Batanero, J. M., Fernández-Cerero, J., and León, S. P. (2023). Analysing the impact of artificial intelligence and computational sciences on student performance: Systematic review and meta-analysis. J. New Approaches Educ. Res. 12, 171–197. doi: 10.7821/naer.2023.1.1240
Han, Q., Huo, S., and Li, R. (2021). Martial arts routine training method based on artificial intelligence and big data of lactate measurement. J. Healthc. Eng. 2021:5522899. doi: 10.1155/2021/5522899
Hu, H., Chen, Z., Huang, S., Fu, C., and Chen, L. (2022). TMEM41B, a novel ER phospholipid scramblase mediating systemic lipid metabolism. Acta. Biochim. Biophys. Sin. 54, 1761–1764. doi: 10.3724/abbs.2022168
Huang, S., Jiang, H., Huang, Z., Li, Y., and Hu, H. (2024). Mitochondrial RNA modification: a novel therapeutic target to combat metastasis. Cell. Biol. Int. 48, 233–236. doi: 10.1002/cbin.12124
Jiang, T., and Gao, X. (2022). Deep learning of subject context in ideological and political class based on recursive neural network. Comput. Intell. Neurosci. 2022:8437548. doi: 10.1155/2022/8437548
Jočković, M. M. (2021). Izogeometrijski Pristup u Dinamičkoj Analizi Prostornih Krivolinijskih Grednih Nosača (thesis), University of Belgrade, Serbia.
Kartal, S., Iban, M. C., and Sekertekin, A. (2024). Next-level vegetation health index forecasting: a ConvLSTM study using MODIS time series. Environ. Sci. Pollut. Res. Int. 31, 18932–18948. doi: 10.1007/s11356-024-32430-x
Lewandowska-Sroka, P., Stabrawa, R., Kozak, D., Poświata, A., Łysoń-Uklańska, B., Bienias, K., et al. (2021). The influence of EMG-triggered robotic movement on walking, muscle force and spasticity after an ischemic stroke. Medicina 57:227. doi: 10.3390/medicina57030227
Liu, Y., and Liu, H. (2021). Utilization of nursing defect management evaluation and deep learning in nursing process reengineering optimization. Comput. Math. Methods Med. 2021:8019385. doi: 10.1155/2021/8019385
Liu, Y., and Qu, Y. (2024). Construction of a smart face recognition model for university libraries based on FaceNet-MMAR algorithm. PLoS ONE. 19:e0296656. doi: 10.1371/journal.pone.0296656
Shen, H., and Wu, Z. (2022). Effect of disulfide bridge on the binding of SARS-CoV-2 fusion peptide to cell membrane: a coarse-grained study. ACS Omega 7, 36762–36775. doi: 10.1021/acsomega.2c05079
Sun, Q., Li, T., Wei, Z., Ye, Z., Zhao, X., and Jing, J. (2024). Integrating transcriptomic data and digital pathology for NRG-based prediction of prognosis and therapy response in gastric cancer. Ann. Med. 56:2426758. doi: 10.1080/07853890.2024.2426758
Tao, G., Suo, W., and Li, Y. (2022). Feasibility analysis of wearables guiding scientific movements and promoting health. J. Healthc. Eng. 2022:4866110. doi: 10.1155/2022/4866110
Tischendorf, T., Hasseler, M., Schaal, T., Ruppert, S. N., Marchwacka, M., Heitmann-Möller, A., et al. (2024). Developing digital competencies of nursing professionals in continuing education and training - a scoping review. Front. Med. 11:1358398. doi: 10.3389/fmed.2024.1358398
Wang, J., Zhou, X., and Wu, J. (2021a). Chip appearance defect recognition based on convolutional neural network. Sensors 21:7076. doi: 10.3390/s21217076
Wang, L., Li, X., Tian, W., Peng, J., and Chen, R. (2024a). Lightweight interactive feature inference network for single-image super-resolution. Sci. Rep. 14:11601. doi: 10.1038/s41598-024-62633-8
Wang, X., Shen, Z., Li, J., and Wu, S. (2021b). Preparation and properties of crystalline IGZO thin films. Membranes 11:134. doi: 10.3390/membranes11020134
Wang, X., Sun, H., Dong, Y., Huang, J., Bai, L., Tang, Z., et al. (2024b). Development and validation of a cuproptosis-related prognostic model for acute myeloid leukemia patients using machine learning with stacking. Sci. Rep. 14:2802. doi: 10.1038/s41598-024-53306-7
Wei, Y., Rao, X., Fu, Y., Song, L., Chen, H., and Li, J. (2023). Machine learning prediction model based on enhanced bat algorithm and support vector machine for slow employment prediction. PLoS ONE 18:e0294114. doi: 10.1371/journal.pone.0294114
Wu, H. (2022). Higher education environment monitoring and quality assessment model using big data analysis and deep learning. J. Environ. Public Health 2022:7281278. doi: 10.1155/2022/7281278
Wu, W., and Zhai, X. (2023). DyLFG: a dynamic network learning framework based on geometry. Entropy 25:1611. doi: 10.3390/e25121611
Xu, X., Wang, X., Zhang, Y., and Zheng, R. (2024). Applying ChatGPT to tackle the side effects of personal learning environments from learner and learning perspective: an interview of experts in higher education. PLoS ONE 19:e0295646. doi: 10.1371/journal.pone.0295646
Yağcı, M. (2022). Educational data mining: prediction of students' academic performance using machine learning algorithms. Smart Learn. Environ. 9:11. doi: 10.1186/s40561-022-00192-z
Yu, S. C., Huang, Y. M., and Wu, T. T. (2024). Tool, threat, tutor, talk, and trend: college students' attitudes toward ChatGPT. Behav. Sci. 14:755. doi: 10.3390/bs14090755
Zhang, X., Wang, L., Helwig, J., Luo, Y., Fu, C., Xie, Y., et al. (2023). Artificial intelligence for science in quantum, atomistic, and continuum systems. arXiv [Preprint]. arXiv:2307.08423. doi: 10.48550/arXiv.2307.08423
Keywords: AI-driven training, student engagement, competency assessment, predictive modeling, clustering analysis, educational outcomes
Citation: Yan J, Tian H, Sun X and Song L (2025) Role of artificial intelligence in enhancing competency assessment and transforming curriculum in higher vocational education. Front. Educ. 10:1551596. doi: 10.3389/feduc.2025.1551596
Received: 26 December 2024; Accepted: 31 March 2025;
Published: 28 April 2025.
Edited by:
David Gorman, Galway-Mayo Institute of Technology, IrelandReviewed by:
Nadia Parsazadeh, Tamkang University, TaiwanAlexa Senior-Naveda, Costa University Corporation, Colombia
Copyright © 2025 Yan, Tian, Sun and Song. This is an open-access article distributed under the terms of the Creative Commons Attribution License (CC BY). The use, distribution or reproduction in other forums is permitted, provided the original author(s) and the copyright owner(s) are credited and that the original publication in this journal is cited, in accordance with accepted academic practice. No use, distribution or reproduction is permitted which does not comply with these terms.
*Correspondence: Haoheng Tian, em9vbGVlMDAzQGdtYWlsLmNvbQ==