 Meena M. Balgopal
 Jennifer L. Neuwald
 Sumali Pandey
- 1Department of Biology, Colorado State University, Fort Collins, CO, United States
- 2Graduate Degree Program in Ecology, Colorado State University, Fort Collins, CO, United States
- 3Biosciences Department, Minnesota State University, Moorhead, MN, United States
Introduction: The benefits of actively engaging students is especially relevant for teaching undergraduate students about evolutionary processes and content. Examining eco-immunological data can help students overcome the naïve conception that humans are not evolving or affected by evolutionary pressures.
Methods: Here, we used graphical reasoning in two evolution courses (small/honors and large/regular) to teach students about eco-immunology in humans and non-human organisms during a unit on the evolution of life-history traits. The module challenged students to (i) distinguish between immunological and evolutionary fitness, (ii) evaluate graphical data from the primary scientific literature on energy allocation and trade-offs, and (iii) integrate these proximate and ultimate processes into a more wholistic understanding of on-going human evolution. Student performance and perceptions were measured through closed and open response items. Open response items were thematically analyzed to identify salient themes.
Results: Student performance in the large class increased significantly on items related to fitness, energy trade-offs, and graphical reasoning, while student performance in the small class increased just for items related to energy trade-offs. Student confidence in graphical reasoning, perceptions of the importance of graphical reasoning, and perceptions of the value of interdisciplinary research was high for both classes. Student narrative examples regarding confidence, perceptions of graphical reasoning, and perceptions of interdisciplinary research are presented.
Discussion: We conclude that students can increase their performance and perceptions of eco-immunology and graphical reasoning through an active learning, graph reading module. Furthermore, students can be introduced to the field of immunology through their evolution courses.
Introduction
The challenges of teaching evolution in undergraduate biology courses in the United States and elsewhere have been well documented (e.g., Deniz et al., 2008; Goldston and Kyzer, 2009; Ha et al., 2012; Dunk et al., 2019). While there are many explanations for undergraduate students’ lack of acceptance, it has most often been attributed to naive conceptions of the nature of scientific inquiry (Pobiner, 2016; Nelson et al., 2019; Rutledge and Warden, 2000), underdeveloped understanding of genetics (e.g., Kalinowski et al., 2010), and the belief that people must relinquish religious identities to accept evolution (Nieswandt and Bellomo, 2009; Winslow et al., 2011; Balgopal, 2014). Researchers report, however, that students’ religiosity need not be threatened during evolution instruction (Siciliano-Martina and Martina, 2020) and that addressing the perceived conflict explicitly may help students’ comfort with learning about evolutionary biology (Barnes and Brownell, 2016; Alkaher et al., 2020). Furthermore, teaching evolution during lessons on the nature of scientific inquiry has been demonstrated to help students accept that evolution discoveries are supported through rigorous scientific processes and compelling evidence (Alters and Alters, 2001; Pennock, 2005; Dunk et al., 2019).
Despite the reasons for undergraduate students holding onto naive conceptions about evolution theory, it has been demonstrated that as students’ understanding of the nature of science and scientific processes increases, it is correlated with an increased acceptance of evolution (Weisberg et al., 2021). Moreover, explanations for poor performance in evolution should not be attributed to only psychological barriers; Mead et al. (2019) discovered that low-accepting students performed poorly on assessments when they had insufficient understanding of genetics. They also found that low-accepting students benefited from opportunities to examine graphical, and not just textual, data. They concluded that sometimes low performance on post assessments can be explained by students not having sufficient and effective opportunities to build their content knowledge and disciplinary competencies needed to be receptive to new concepts (Mead et al., 2019). For this reason, Pobiner et al. (2019) called for approaches that directly address naive conceptions about evolution and called for using examples of how humans are continuing to evolve. They found that this approach helped their study participants demonstrably improve their scores on post-tests around the following concepts: variation, heritability, differential survival, and frequency/distribution (Pobiner et al., 2019).
Human evolution
Despite positive results of instructional interventions to help undergraduate students understand and accept evolution theory, students still struggle to accept that humans are evolving (Andrews et al., 2011a; Pobiner et al., 2018; Bertka et al., 2019). Several evolution education scholars, though, argue that the use of human examples of evolution can engage both biology majors and non-majors in learning topics that are presented as relevant (Paz-y-Mino-C and Espinosa, 2016; Pobiner et al., 2018). Others explain that using human examples of evolution may not be enough to challenge and resolve all misconceptions about evolutionary processes but posit that students still benefit from applying new content to multiple examples (Cunningham and Wescott, 2009; Beggrow and Sbeglia, 2019). Even the recent COVID-19 pandemic provides opportunities for students to examine both how viruses evolve as well as how human immune systems respond to changing parasite and pathogen challenges (Lashley et al., 2020; Chakrabarty, 2023).
Regardless of examples used, undergraduate students benefit from active learning exercises in their biology courses that allow them to explore how evolution is studied by scientists (Frasier and Roderick, 2011). Implementing instructional materials designed to address students’ naive conceptions is an important approach (Tolman et al., 2021), as is spending class time to actively engage learners in exercises designed around common misconceptions, beliefs, or barriers (Andrews et al., 2011a). Yet, just employing active learning approaches (e.g., think-pair-share, interpreting phylogenetic trees) is insufficient and should be designed around the topics with which students struggle and/or still have questions. For this reason, we argue that instructors should integrate examples of humans with non-human organisms to underscore that all organisms are subject to the same evolutionary mechanisms (Pobiner et al., 2019). Students come to our classrooms asking, “are humans still evolving?” and, as such, we should address this curiosity (Andrews et al., 2011a). Furthermore, these activities are opportunities for students to explore concepts that are not intuitive but that they find interesting (Shields, 2004).
Conceptual understanding of fitness and trade-offs
Students in undergraduate biology courses hear the terms “fitness” and “trade-offs” across the curriculum in both physiology and evolution courses. While instructors know the distinction, it is important for students to explore not only how these terms differ across research areas, but also how they align. It is common for an evolutionary biology professor to introduce the term “evolutionary fitness” along with a caveat that it does not mean the same thing as “physical fitness” (strength and endurance), like an exercise physiologist might use the term (Tidon and Lewontin, 2004; Rector et al., 2013). However, it is less common for instructors with different research lenses to find ways to help students explore how the terms overlap. Despite instructors providing explicit definitions of fitness, and calling out lexical ambiguity (Rector et al., 2013), it remains an area of confusion for students (Gregory, 2009), especially when discussing humans (Antolin et al., 2012).
The fact that it is challenging for students to recognize that evolutionary biologists can measure human fitness is explained by the naive conception that human evolution occurs uniquely and distinctly from non-human organisms (Catley and Novick, 2008; Pobiner, 2016). Helping students explore specific examples of human evolution during class activities and discussions, therefore, is important. Pobiner and colleagues developed several modules that are available to instructors through the Smithsonian Institution (2025). The modules focus on (1) human adaptation to high altitudes; (2) evolution of human skin color; (3) human-mosquito-malarial parasite co-evolution; and (4) “what does it mean to be human.” Including lessons about human eco-immunology, as we describe here, can add to the list of examples that evolutionary biology instructors can use in their classes. When examining eco-immunology case studies, students can consider both physiological and evolutionary costs and trade-offs of adaptations, especially through graph interpretation.
Conceptual understanding through graphical literacy
Effective argumentation requires the use of convincing evidence to support claims. Scientists use graphs, maps, phylogenies, sketches, photos, and models to convey complex or diverse information efficiently. As visualizations of data and concepts become more sophisticated to describe ecological complexity (elements of causality across spatial and temporal fields; e.g., Banitz et al., 2022), though, instructors need pedagogical tools to improve their students’ abilities to interpret them (Börner et al., 2019; Ode et al., 2025). When reading primary scientific literature, students often skip methods and results sections of scientific papers (Hubbard and Dunbar, 2017) and need guidance in interpreting figures (Glazer, 2011; Maries and Singh, 2016). Broadly speaking, a visually literate student can “find, interpret, evaluate, use, and create images and visual media” (American Library Association [ALA], 2021), but graphing literacy additionally requires the ability to flip between abstract and concrete thinking (Leinhardt et al., 1990). Even scientists may find this task challenging. Roth (2013) reported that, in his study of 33 scientists, only 27% were able to accurately interpret graphs generated in subdisciplines other than their own area of expertise. Moreover, scientists “saw” what they expected to see based on biases of content knowledge and did not let the data “speak for themselves” (Roth, 2013). Therefore, when introducing new content, it may make sense to introduce graphical data at the same time. Allowing students the opportunity during active learning sessions in class to explore graphical data may help them make sense of the new content, especially when integrating immunological examples in an evolution course in the context of human evolution.
While immunologists and physiologists are aware of student misconceptions about immunology (e.g., Vaz, 2004), we were unable to find studies regarding understanding immunological trade-offs. Here, we describe a partnership that was fostered by the Immuno-Reach collaborative (Pandey et al., 2023). This community of biology instructors came together with financial support from the National Science Foundation Research Collaborative Network (NSF-RCN) in 2020. The Immuno-reach project goals are for partners, who bridge two different perspectives of biology, to create instructional modules that introduce students to immunology (Pandey, 2021). The initial intention of the grant was to find creative ways to present immunology to students who may not enroll in a dedicated semester-long course. Through the partnership of the three authors, however, we discovered that undergraduate students at one of our institutions were keenly interested in learning whether humans are still evolving. Hence, while our initial intention was to introduce students to the discipline of immunology, we realized that our curricular materials were effective in helping students clarify their conceptions of fitness and physiological trade-offs. The activities centered on introducing students to primary scientific literature and interpreting graphical images during lectures. In study described here, we sought to determine if students in both large (> 200 students) and small (∼20 students) evolution courses would demonstrate improved knowledge of fitness and energy trade-offs through graphical reasoning of both human and non-human animal examples.
Materials and methods
This exploratory educational study was designed by developing an instructional intervention that was implemented in two classes at one public university. We used a mixed-methods survey design to assess student knowledge gains regarding evolutionary and physiological fitness (immunocompetence), energy allocation and trade-offs, and graphical reasoning. The survey was administered before and after the instructional module in two courses, described below. This project was approved by the university’s institutional review board (#3085).
Instructional intervention
An instructional module to introduce undergraduate students to the evolution of human immune systems as an example of life history trait evolution was developed. A full description of this activity will be described elsewhere. Students were provided self-paced instructional materials through Canvas, an online educational platform. While not mandatory, students were strongly encouraged to review the material prior to the in-class activity, which introduced background information on important concepts from scientific reasoning (ultimate versus proximate questions), immunology, evolutionary and physiological fitness, and life history trade-offs in energy allocation and evolution. The in-class activity addressed two main learning objectives: (1) comparing how physiological fitness and evolutionary fitness are measured considering energy allocation and trade-offs and (2) interpreting and explaining graphical data. Students explored the distinction between evolutionary and physiological fitness; interpreted models on energy allocation and trade-offs (McDade, 2003); evaluated graphical evidence from immunological studies addressing how different environmental conditions affect human immune responses (Georgiev et al., 2016; Urlacher et al., 2018, 2019) and non-human (Norris and Evans, 2000) systems.
Context
This study was conducted at a large, public research university in the Mountain West region of the United States. The participants were all life science majors (e.g., biology, biomedical sciences, conservation biology, zoology), for which evolution was a required course. We tested this instructional module in two Evolution courses at the same institution. Course 1 was a large enrollment (n = 240) course for second-year life science majors (most for whom the course was required) and a few non-majors, and in which 75% were women, 24% were men, and 1% were gender non-conforming. Course 2 was a small enrollment course (n = 20) for Honors students for whom the course was required, and in which 85% were women and 15% were men. The mean class rank (year in their college program) in the large class was 2.7 (SD = 0.9), and mean class rank in the small class was 2.8 (SD = 0.68); i.e., mostly second- and third-year students in both classes. Both courses focused heavily on the nature of science at the beginning of the semester, along with a lecture addressing potential naive conceptions regarding religiosity and learning evolution. While there was a strong overlap of the curriculum, the number and type of active learning activities in the Honors section (Course 2) were greater than in Course 1. At this institution, Honors courses typically have students who a higher motivation to succeed, demonstrated by their regular attendance and high engagement during class discussions. Despite differences between the large regular and small honors courses, the implementation of this activity was similar. The first author taught the module in both classes as a guest instructor. She stressed the importance of interpreting graphical data to determine how energy was allocated in each of the examples. Students worked in small groups of two to three students as they examined graphical data, and the guest instructor facilitated whole class discussions.
Data collection
Assessments were designed as pre and posttests to determine if there were any significant changes in student conceptions of evolutionary fitness and physiological trade-offs after participating in the module (Table 1). In other words, the paired comparison of test responses meant that each student acted as their own “control.” This design was appropriate for an exploratory study because we were not evaluating the impact of the active learning (graphical reasoning) component of the lesson, which benefits students (e.g., Haak et al., 2011) but is likely dependent on instructor experience (Andrews et al., 2011b). Instead, our intentions were to measure how student perceptions of their knowledge and their graphical reasoning skills changed after a single module that integrated fitness from both evolutionary and physiological perspectives. The pedagogical approach was active learning through graph reading, yet this was not what we were measuring. The instrument comprised 11 items and was evaluated by two evolutionary biologists (who are not coauthors), who reviewed the document for content validity. We also included graphs from primary journal articles for students to evaluate (i.e., immunological response of Tasmanian Devils to immunization protocol in Pye et al., 2018 and French et al., 2007’s study of trade-offs between reproduction – follicle development and maintenance and wound healing in tree lizards). The posttest included two additional questions about their perceptions of their increased knowledge about trade-offs and evolutionary fitness, as well as their confidence in interpreting graphs. These retrospective open-ended questions were administered to help ensure that the closed response items were reliable on this short survey (Moore and Tananis, 2009).
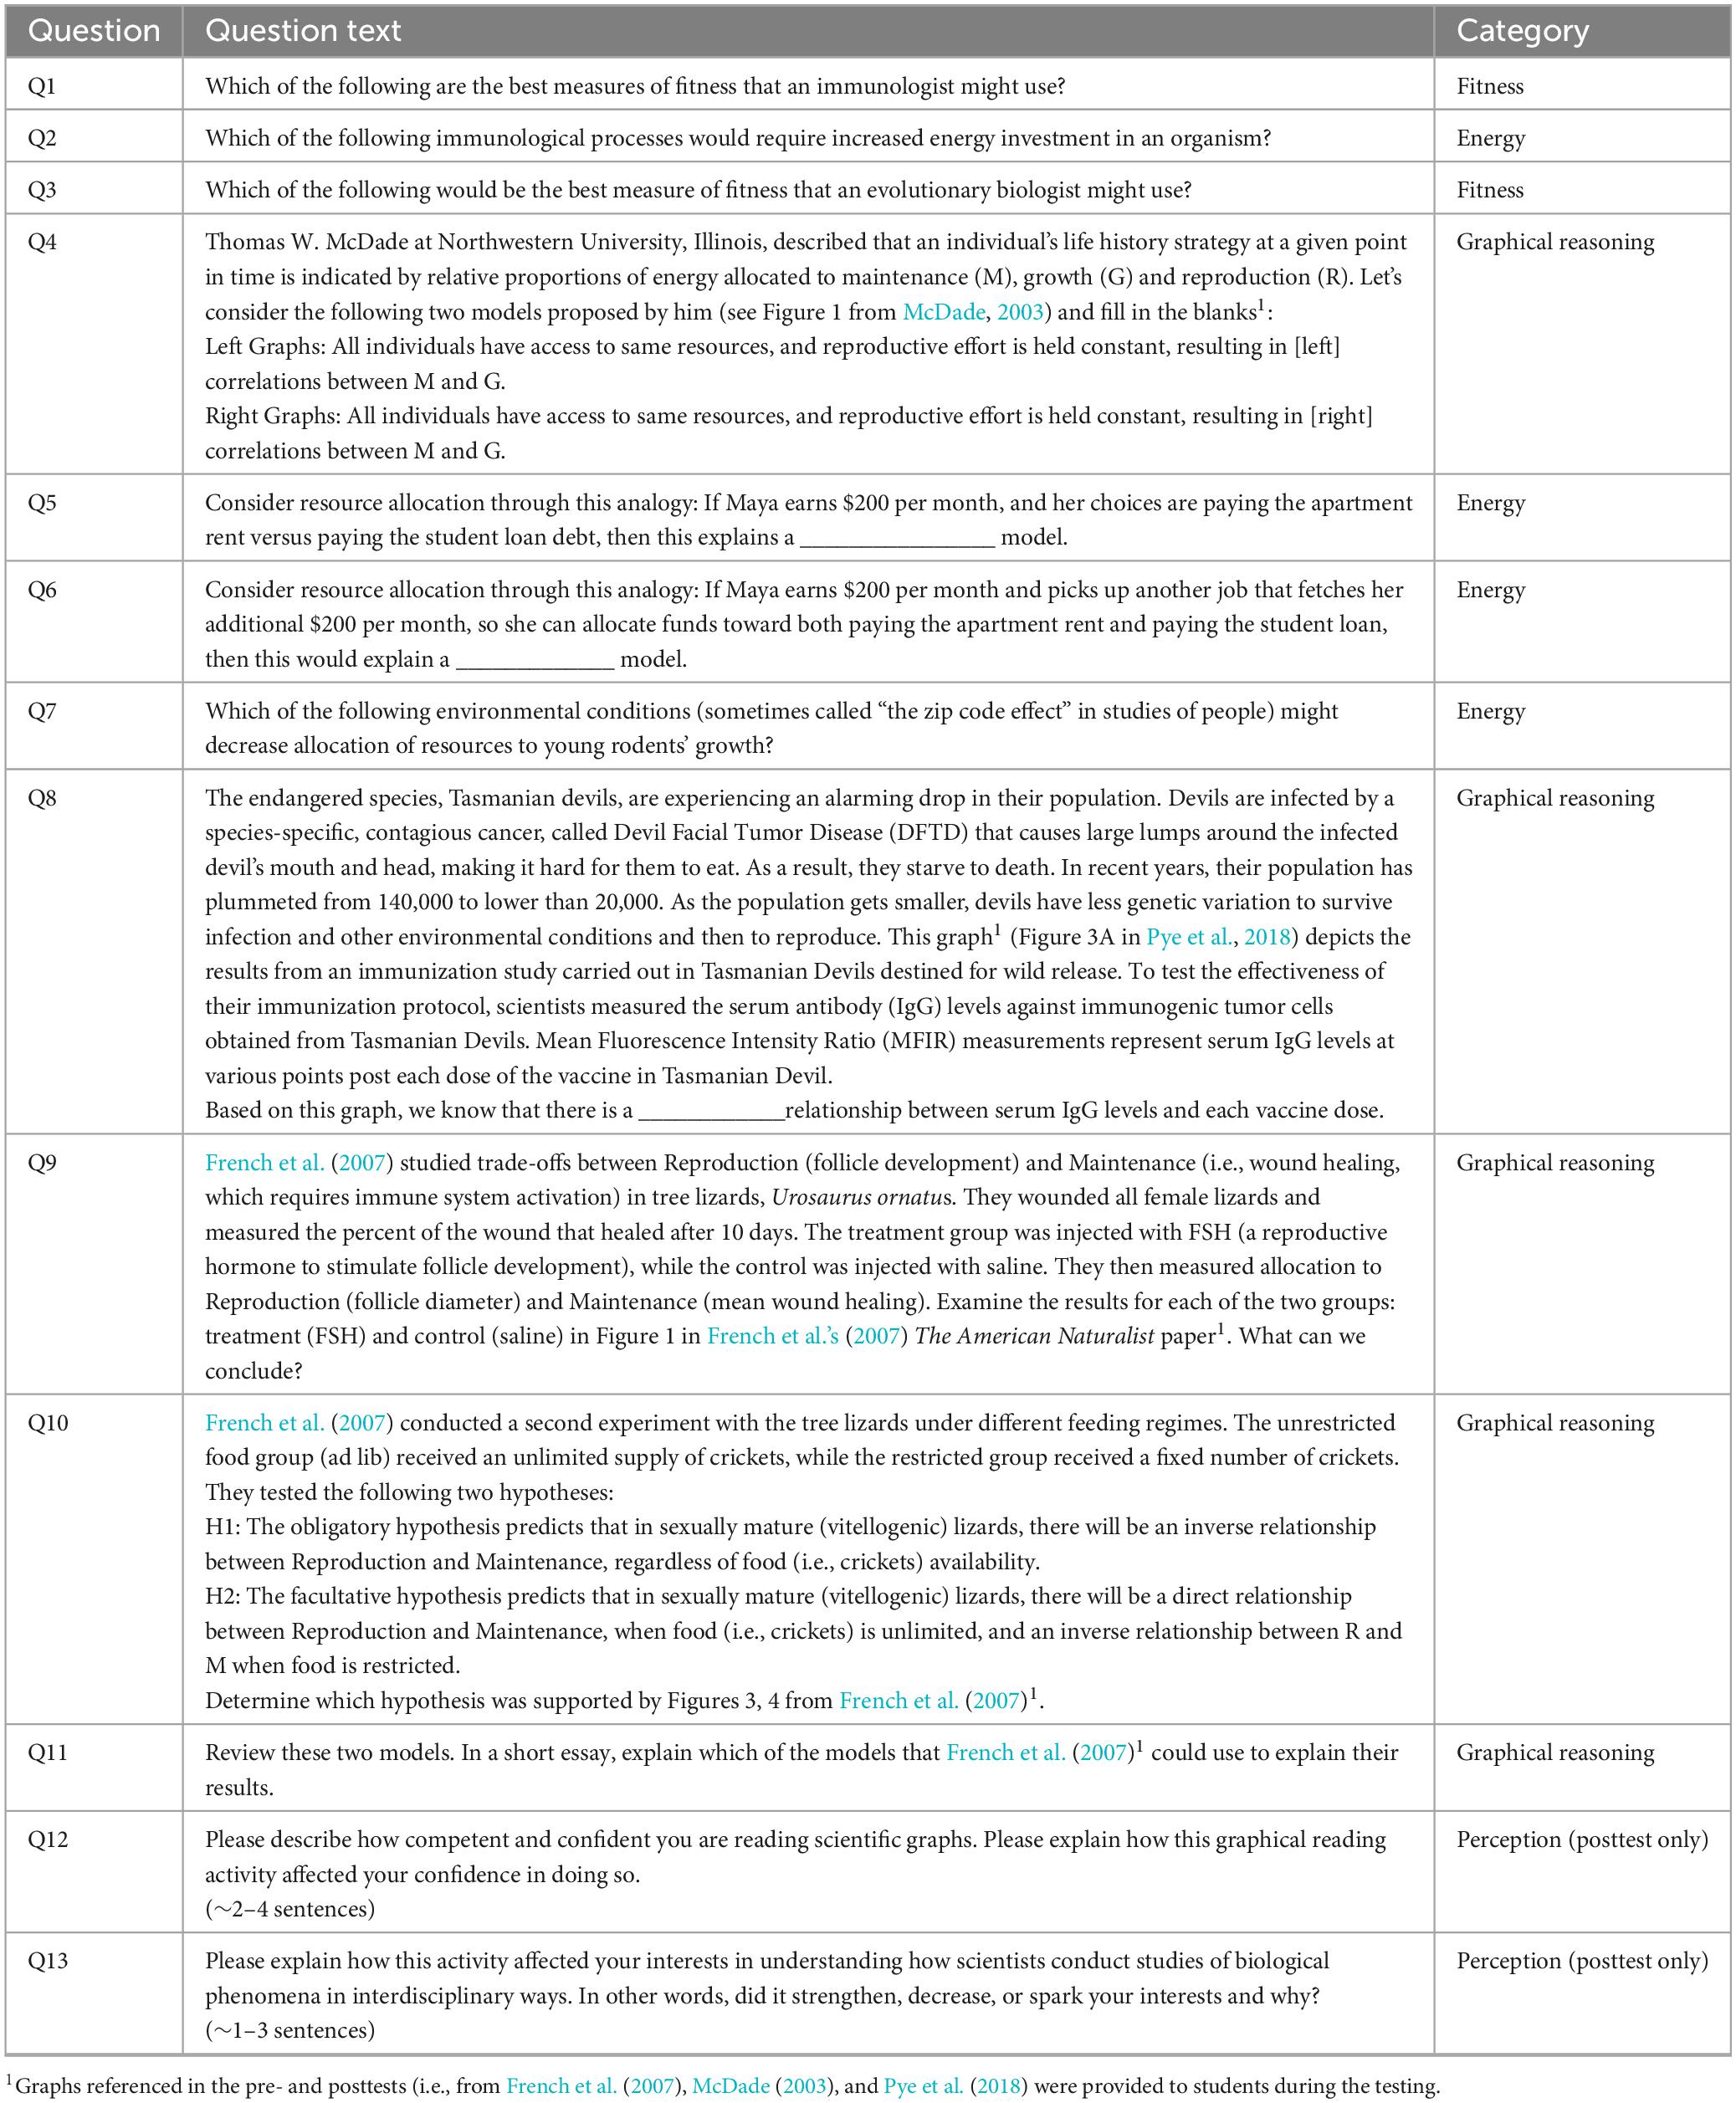
Table 1. Pre and posttest for undergraduate evolution students about eco-immunology.
Data analyses
Only students who completed both the pre- and posttests were included in the analyses. Wilcoxon signed rank tests were run to determine if there were significant differences between student overall performance on pre- and posttests (items 1–11). In addition, tests were run on student pre- and posttest performance for the three sub-constructs (fitness, energy trade-offs, and graphical reasoning). Items 12 and 13 on the posttest were open-response prompts. Student short essay responses for item 12 were initially coded by one of the investigators (SP) based on the levels of perceived confidence (confident, fairly confidence, somewhat confident, and not confident) through semantic thematic analysis (Braun and Clarke, 2019). Student short essay responses for item 13 were coded as positive, mixed feelings, neutral, negative, not reported. One inter-rater (MB) coded 50% of the data. Discrepant codes between the first two coders were identified, the codebook clarified, and then subsequently recorded by the author (JN) until full agreement was reached, and we established full confidence in our codebook. In addition, because student responses on the open-ended questions were notably like their respective close-response items, we determined that they triangulated the survey results, establishing trustworthiness of our findings.
Results
Students in Course 1 (large, regular) demonstrated improvements overall and for all three sub-constructs (Figure 1A). A Wilcoxon signed-rank test indicated that the overall posttest score was significantly higher than the pretest score (p < 0.0001, S = 5696, N = 181). Within Course 1 students scored significantly higher on posttest score for fitness (p < 0.0001, S = 3778.5), for energy trade-offs (p < 0.0001, S = 3882.5), and for graphical reasoning (p < 0.0001, S = 3019.5). Students in Course 2 (small, honors) did not demonstrate significant gains overall (Figure 1B) nor for two subconstructs (fitness and graphical reasoning); however, they did demonstrate a significant improvement for the third subconstruct–energy trade-offs (p < 0.015, S = 40.5, N = 16). Students’ open response data demonstrated that their confidence in graphical reasoning and interests in interdisciplinary research (such as evolutionary biology and immunology) increased. These are discussed below.
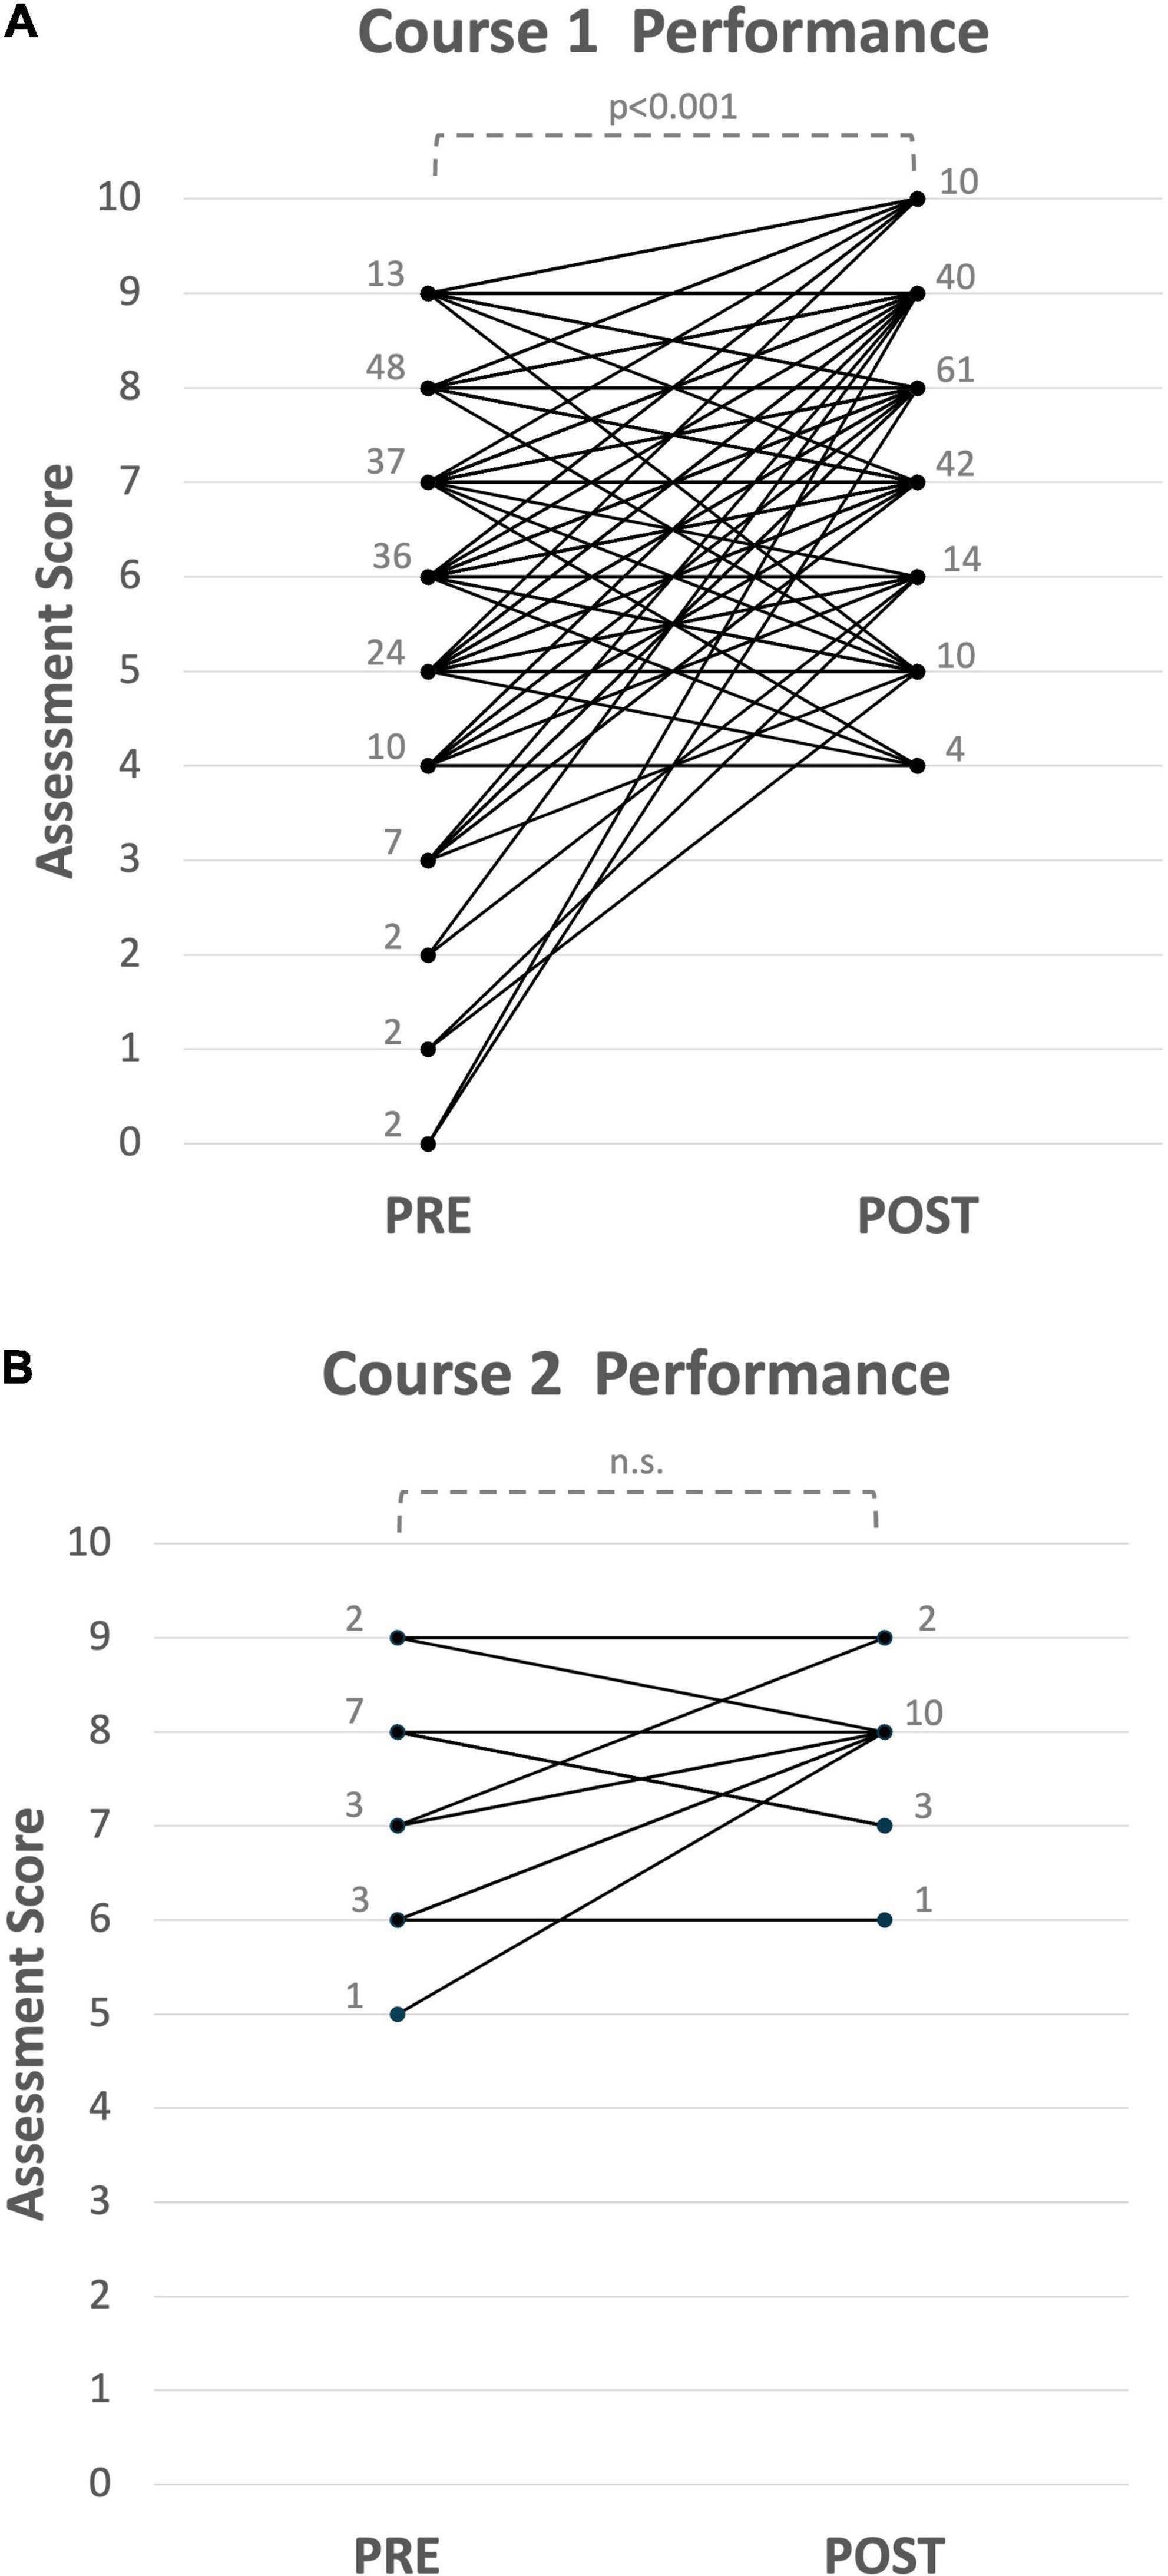
Figure 1. Undergraduate life science students’ overall performance on pre- and post-assessments of an eco-immunology module in Introduction to Evolution (A) Course 1 – regular, large class (Wilcoxon signed-rank test p < 0.0001, S = 5696, N = 181) and (B) Course 2 – honors, small class (Wilcoxon signed-rank test p = 0.1660, S = 19.5, N = 16). Data labels indicate raw numbers.
Confidence in graphical reasoning
Most students (94.2%) in Course 1 and all students (100%) in Course 2 reported some level of confidence in their graphical reasoning skills following the activity (Figure 2A). About half of the students in both courses (45.6% in Course 1 and 50% in Course 2) indicated they were confident in reading graphs after the activity. While most students simply stated their confidence, some identified specific areas of graph reading where they felt less confident (demonstrating metacognitive skills in the process). For example, one student wrote,
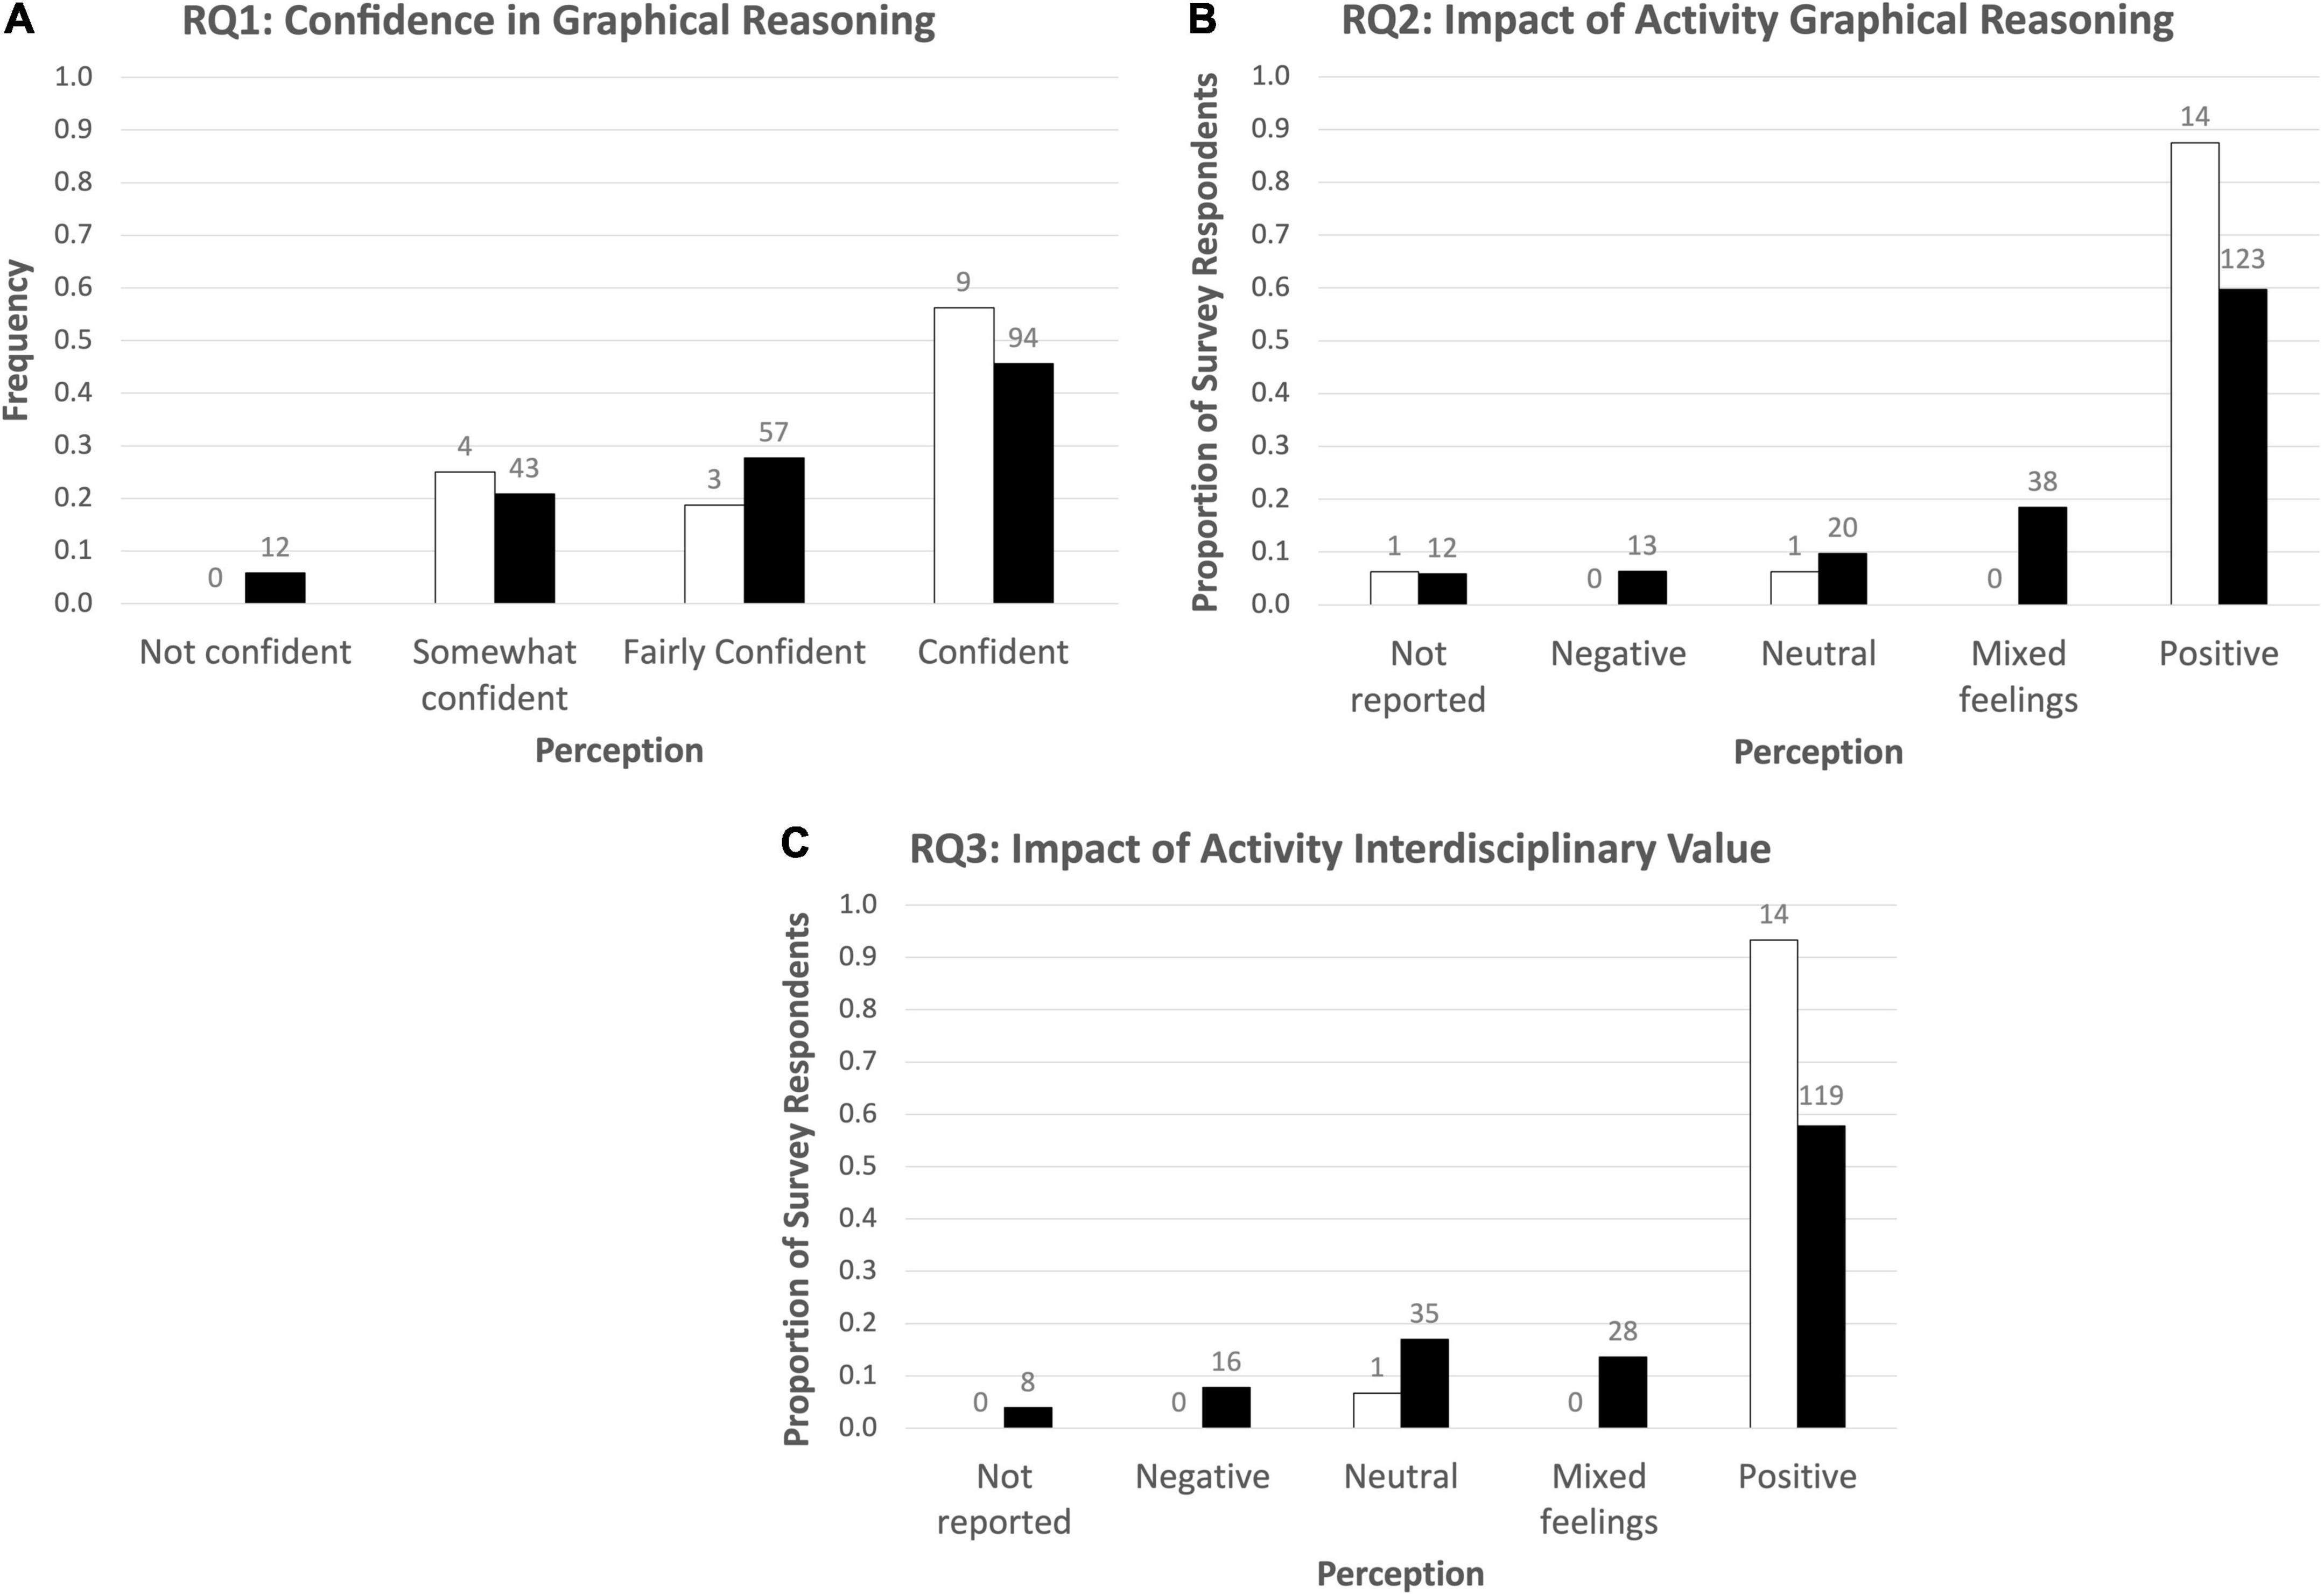
Figure 2. (A) Undergraduate life science students’ confidence in scientific graph-reading after participating in an evolution of life history traits activity (RQ1). (B) Student perception of how the activity impacted their graphical reasoning abilities (RQ2). (C) Student perception of how the activity affected their interest in the interdisciplinary nature of science to explain biological phenomena (RQ3). Course 1– regular, large enrollment class – in filled bars and Course 2 – honors, small enrollment class – in open bars. Labels indicate raw numbers.
“I am fairly confident in reading scientific graphs. I usually have no problem understanding basic concepts and recognizing trends in graphs but sometimes have trouble when faced with questions that ask me to make assumptions or conclusions from the graph using scientific definitions and concepts.”
Other students pointed out that they were not confident interpreting graphs that require making inferences, such as the following quote illustrates: “The ones that I still need more practice with are the graphs where the result of the study is not obviously evident by looking at them but is harder to pinpoint.” Another student described challenges in making inferences about graphs but in the context of having to explain them on assessments: “I feel I am somewhat competent and confident in reading scientific graphs. I believe I can understand the content of scientific graphs and their purpose; I am somewhat unsure when answering questions about them.”
The fact that less than 6% of the students from Course 1 indicated still not being confident in reading graphs following the activities is noteworthy. When students provided reasons for their lack of confidence, they described not having sufficient preparation, needing more practice, or struggling with language. The following student was aware of the need for repeated activities focused on graphical literacy: “I am not confident reading scientific graphs, I feel like I still need to practice more with basic exercises in order to then advance to more advanced material.” Other students recognized that the disciplinary jargon or English language (for non-native speakers) made graph interpretation challenging, as the following student explained: “Frankly, I have some difficulty in understanding and reading scientific graphs because of some words that are difficult for me to understand, so I need to use translation to know the meaning of some terms.”
Perceptions of graphical reasoning
Most students (59.7% students in Course 1 and 87.5% students in Course 2) reported that the activity had a positive impact on their graphical reasoning (Figure 2B). Many students also demonstrated metacognition surrounding specifically how their graphical reasoning skills increased due to the activity. Specifically, students described the benefits of the time in class to learn how to read graphs. For example, one student wrote: “When breaking it down, the graphs can become easier to read after knowing more about what each part of the graph means.” Another shared, “This graphical reading activity really boosted my confidence in doing so; I can tell because I had trouble interpreting the graphs at first in class but understood the final ones perfectly.” Students also benefited from the opportunity to make inferences about how immunity is measured in studies of the evolution of immune systems. They described becoming more efficient:
“This activity helped me [interpret graphs] faster and look at graphs in a more efficient way. I think by having us answer about the trends in the graphs helped me to think more about how I should be looking at them”
While not many, there were a few students who recognized that some types of graphs were more challenging for them than others, as the following quote illustrates, along with the acknowledgment that learning how to patiently make meaning of graphs is important.
“This activity has shown me that I get confused when looking at pie graphs, or when comparing results between experiments. I think that I get confused when the data is cross referencing a treatment as well as two different considerations (maintenance and growth). I think this amount of data confuses me. However, taking my time on other diagrams in the activity allowed for complete fluency with them.”
The in-class activities were designed around active learning principles, including small group work. Several students perceived that their graphical reasoning skills improved when being able to talk through their ideas with peers. “The graphical reading activity boosted my confidence quite a bit by allowing me to discuss what I was seeing with my peers; I was able to hear other perspectives on interpreting the data.” This student recognized that their confidence increased in small group work, as did the student who wrote that “Being able to practice these skills [in a group] has helped me feel more competent in reading graphs, which makes me feel more confident in successfully interpreting them in the future.” Other than the benefits of group work, some students discussed how content from the lesson was integrated with the graphical representation of data.
“I think this activity was helpful in increasing my confidence, as walking through a few intimidating looking graphs helps make them less scary. It also helped me to pick up some terminology I was not fully clear on before, like how direct and indirect relationships are displayed on graphs.”
Other students called out what new skills they gained during the activity that will help them in reading graphs across content, as the following narrative demonstrates:
“I now know to look for definitions of what is on each axis so that I can understand the variables, whereas before it overwhelmed me when I did not immediately recognize what each variable was and what it meant to the study.”
Not all students perceived that the activity improved their confidence and skills in graphical reasoning. Some students in Course 1 (18.4%) described mixed feelings about the impact of the activity on their graphical reasoning. While they liked the activity, they were not sure about their ability to transfer their knowledge outside of the classroom or felt like they still needed more practice. Some students discovered what they do not know (“The activity showed how much I don’t know.”), while others felt somewhat more confident but recognized that they still need practice: “This activity reassured me of my abilities to read graphs but also showed me sometimes I get confused on what I am being asked before I interpret the graph.” Students who expressed a lack of confidence most often indicated that they needed practice and support. “I don’t have enough practice, though. When putting it in the real-life scenarios- it may be difficult.” Students also described needing practice in reading graphs across content areas. “There are still some graphs that could be hard to determine because I’m not sure what values to look at. I think I would probably like more examples to probably help me understand the content better.” Notably, some students made the distinction that we described earlier between reading a graph and interpreting it by making inferences, as the student below shared.
“I think the hardest part for me has always been interpretation rather than just observation. The activity helped with my ability to interpret this specific type of graph, but there could be others where it would still be very challenging for me to understand what is going on.”
Students who described a neutral impact of the activity on their graphical reasoning were more likely to perceive that their graphical reasoning skills were strong. For some students, it was because they had chances to develop skills in their other courses: “Most of my major classes have to do with math and science. I use graphs almost daily, so I am probably more versed with graphs than others.” One participant, a non-traditional student, shared that “This wasn’t very helpful to me [as a non-traditional student] but I’m sure it would be helpful to a lot of people that are just starting to get into this kind of stuff.” Other students did not explain why they felt confident, as the following student shared: “This exercise did not change my confidence in doing so. I have always been fairly confident in my ability to read graphs using the context clues available in the text to interpret graphs.”
While there were no students in Course 2 who perceived that the activity had a negative impact on their graphical reasoning skills, 6.3% of students in Course 1 described their confusion by the activity. One student felt that they had to navigate too many graphs in a short time (“This activity involved too many different graphs in a short span of time which made things more confusing when looking at multiple different graphs.”). For some students, having to respond via personal response system (e.g., clickers), made the graphical reasoning activity challenging. “…it made the material more confusing in the way it was presented. The speed of the presentation was a bit too fast and had too many clickers attached which made it hard to focus on the material.” The result, therefore, for some students was remaining to feel confused or even less confident, as this student shared, “After the graphical reading activity, I feel less confident in my ability to read graphs as the content confused me further.”
Perception of interdisciplinary science
One of the curricular objectives of this module was to introduce students in evolution courses to the discipline of immunology. In that vein, our team of authors models this approach, as we bring different expertise in evolution, immunology, and science education research. Students in this study demonstrated a slight shift in perceptions of the value of interdisciplinary studies. In Course 1, students primarily reported a neutral (17%) or positive (57.8%) response, while students in Course 2 reported a highly positive perception of interdisciplinary collaborations (93.3%; Figure 2C). One student wrote, “Learning that there are many different ways to combine different areas of biology is exciting and something I would love to learn more about.” Of the students who reported positive perceptions of this type of work, they wrote about professional value, as this pre-veterinary student explained below.
“I had never really considered the need for interdisciplinary interactions in science before this activity. Hence, I would say the activity sparked my interest in interdisciplinary work. I hope to be open to interdisciplinary interactions and teamwork in my professional career as a veterinarian.”
Another student was inspired, in general, by interdisciplinary work and described their interest in bioinformatics.
“I was already hoping to maybe take a multipronged approach of biology, possibly with a bioinformatics minor and a smattering of fields. I feel reassured hearing about it, and how it seems to be a very useful thing to have a broad base of knowledge!”
Students interested in pursuing medical studies also described their interest in the concept of life history trait evolution, evidenced by the following narrative.
“I think that it ultimately makes a lot of sense that it is important to weave together understandings of medicine, evolution, and other biological studies together, because it will help widen the perspective of scientific hypothesis and observations. I think that I would like to learn more about how evolution has played a role in life history research after taking part in that activity.”
Finally, some students explicitly mentioned that this interdisciplinary module inspired them to consider studying immunology. For example, one student shared that “Courses like immunology have always intimidated me, but it was nice to see this class shown in a different light. I definitely want to pursue something like immunology or pathology and this activity helped solidify that.” Another student realized that ecological immunology was a unique area of research.
“This activity strengthened my interests because I’m interested in pursuing a career in research, specifically studying animals and applying my findings to the field of medicine, and this activity introduced me to a job within that field of study – an ecological immunologist.”
While most students wrote positively about the interdisciplinary nature of the module, 13.6% of the students in Course 1 reported mixed feelings about its interdisciplinary value. One student wrote, “In some ways it increased a knowledge base because I learned what this study was, but I can’t say that I grasped it enough to know if it sparked an actual interest.” Students not interested in research were not motivated by learning about research, regardless of whether it was interdisciplinary or not: “I am not really interested in doing research. It was interesting to see how different graphs demonstrate different things, and how to read them a little better, but it didn’t really peak [sic] my interest.” In addition, some students were unable to make connections between the different biology sub-disciplines displayed some misconceptions about eco-immunology. For example, the following student demonstrated naïve conceptions about how organisms interact with the environment is relevant to how immune systems evolve.
“I think the field is a very interesting one, however, personally this isn’t something I would focus on. I am more interested in the way animals (such as mammals) interact with us and their environment, not so much their biological processes inside the body.”
Of the students who reported neutral impact (17% students in Course 1; 6.7% in Course 2), many were uninterested in the topic in general or already felt they had an interest in the interdisciplinary nature of science. Quotes like the following were typical of this group of students. “It didn’t really affect my interests much because I have always wanted to understand why things happen in biology, but I’ve never been interested enough to take time to explore it.” For others, the activity maintained, but did not change, their interests in scientific research. “This activity, while not necessarily peaking (sic) my interest, did sustain my current level of enthusiasm for scientific studies.” Finally, some students perceived the activity negatively (7.8% of students in Course 1) because they were not interested in the topic or because they found it challenging as the following two quotes demonstrate. For example, “This activity decreased my interest in understanding how scientists’ study biological phenomena because it was difficult to understand and wasn’t very interesting to me.” And “I have never really been interested in this field, and I am not the biggest fan of creating graphs and looking at them. This is not something I would enjoy doing.”
Discussion
This study demonstrates that the intentional integration of immunological examples through graphical reasoning improves undergraduate students’ recognition of evolution acting in human populations. Students enrolled in a large section of the undergraduate Evolution course demonstrated improved performance on assessments about fitness and energy allocation and trade-offs, as well as improved outcomes on graphical interpretation. Students in the smaller undergraduate Honors Evolution course demonstrated improved outcomes on assessment of energy allocation and trade-offs. Moreover, students in both courses demonstrated increased confidence in interpreting graphical data and increased interest in the value of interdisciplinary research.
Conceptualizing trade-offs
While trade-offs may be discussed across the biology curriculum, we found that studies in science education research tend to focus on sustainability instruction. For example, researchers publish students’ conceptions of economic versus environmental consequences of decision-making (e.g., Balgopal et al., 2012; Yamashita et al., 2017). In a study on how students constructed arguments about managing fertilizer run-off and association with ecological dead zones, students from a 4-years university and a 2-years tribal college described both human-centric and ecosystem-centric tradeoffs (Balgopal et al., 2012; Balgopal et al., 2017). Yamashita et al. (2017) found that undergraduate students’ understanding of trade-offs about agricultural systems differed based on the time scale (i.e., short-, medium-, or long-term trade-offs of different agricultural practices). Examining undergraduate student conceptions of resilience, Kharrazi et al. (2018) reported that naive conceptions of environmental resilience were prevalent when students overlooked potential trade-offs (Kharrazi et al., 2018). What is missing from the literature, though, is how to teach evolution using examples of trade-offs in the context of the immune system and especially how it relates to allocation of energy through the evolution of life-history traits. This is where our research addresses that gap. Both the regular and honors students demonstrated significant improvement in performance on energy trade-off questions. Notably, this was the only subconstruct that the honors students demonstrated significant gains, suggesting this to be an area of focus for targeted instruction for both regular and honors students.
Conceptualizing human evolution
While there are examples of human evolution that instructors can use to teach about evolutionary trade-offs, both evolution and biology education scholars have called for more integration of human examples in undergraduate evolution courses (Antolin et al., 2012; Grunspan et al., 2019). Not only can students relate to human examples, but it is also important for those in health track undergraduate programs (and potentially future physicians) to learn about evolutionary processes (Nesse and Williams, 1994; Robin and Evans, 2009). For example, when examining life history traits (e.g., longevity, reproductive age, fecundity), phenotypic plasticity (i.e., expression of different phenotypes under varying environmental conditions), or susceptibility to diseases (either genetic or communicable), understanding how human bodies allocate resources at both proximate and ultimate levels is important (Antolin et al., 2012). A student should be able to explain that if an organism (whether human or not) devotes resources toward reproduction, there may be fewer resources to spend on immunological responses to pathogens. Our graphical reasoning module provides an opportunity for students and instructors to collaboratively challenge naive conceptions of evolution operating on human populations.
Graphical reasoning
Although undergraduate students report anxiety around reading primary journal articles and the graphical figures included in these, helping students build their graphical reasoning skills can improve their disciplinary literacies (Witkow et al., 2022). In fact, Round and Campbell (2013) developed instructional tools to make graph reading less overwhelming for their biology students and reported positive results. They found that students appreciated having instructional tools to help make graph reading less overwhelming. Likewise, in our study, students found that learning new content (evolution of life history traits, like immunocompetence) was enhanced by being able to interpret graphical figures. In fact, some experts encourage educators to teach graphical reasoning as an embedded competency in content courses, rather than as a separate skill (Gardner et al., 2022). This is because each discipline has its own norms of how data are presented, what metrics are used, and underlying assumptions of the researchers (Gardner et al., 2024). In our study, students discovered that they were not sure what “values” to focus on, and others recognized the importance of being able to summarize or explain what a graph is. Several students in our study described knowing how to read a graph but not feeling completely confident in making inferences. Because students’ confidence in graphical reasoning significantly improved in both courses, it is evidence that even short interventions can have an effect. These results reinforce our call for evolution instructors to use instructional time to explore graphical reasoning within the content (Bowen et al., 1999; The American Association for the Advancement of Science, 2011).
Interest in interdisciplinary research
Besides graphical reasoning, another core competency that biology students need is learning the role that interdisciplinary collaborations and communication play in scientific discovery (The American Association for the Advancement of Science, 2011). This is explained in the ImmunoSkills guide (Pandey et al., 2024). Collaboration and communication skills to solve real-world problems, such as emerging infectious diseases and climate change, that often require multidisciplinary approaches. Eco-immunology is a well-established field in the research sphere, with many publications that provide foundational basis and evidence. However, resources to integrate the findings into pedagogical practice can be challenging for an instructor trained in one discipline but not the other. It is an interdisciplinary field, which requires foundational knowledge of immunology, ecology, and evolution. Therefore, an interdisciplinary collaboration, facilitated through ImmunoReach Community of Practice, between two evolutionary biologists and one immunologist in the development of this teaching resource and gauging its effectiveness in a classroom, became an opportunity for faculty to model the process of communication, collaboration and showcase its application to interdisciplinary situations around us. We acknowledge and illustrate with this module that developing interdisciplinary educational materials requires reflection from both disciplinary perspectives to best understand the meaningful integration of content (Kranke, 2023).
Limitations
Although our results are promising, we acknowledge the limitations of this study. The data reported here were collected from a single semester at one institution. While the instructor implementing the module was the same (MB), the primary instructors of the two courses differed. We did not calculate the reliability of the assessment tool, which we used as an evaluation instrument in this study prior to the study, although we established content validity beforehand through expert review with colleagues at both institutions of the authors. In addition, a small proportion of our participants indicated a negative perception of the activity due to low interest in the topic or conceptual confusion. We recognize that not all activities and modes of learning will resonate with or be effective for all students, especially those whose pre-college educational experience did not include active learning (Haak et al., 2011). Interviewing participants (even a subsample), especially those who did not feel that the module had much of an impact on their learning, may have allowed us to better understand students’ perspectives. The open-response survey data, however, yielded rich responses. Finally, while the two classes shared similar syllabi, the population of students in the smaller class were Honors students, who have overall higher grade-point averages, historically greater retention in their science majors, and are generally motivated students, based on our observations, as others have reported (Deeg et al., 2024). The fact that both sub-populations benefited from a single module on life history traits is evidence that our intervention can positively impact a range of students. Moreover, the nearly identical implementation in both a small, honors class and a large, regular classes demonstrates the successful scalability of this activity in different sized classes.
Conclusion
Evolution is a foundational concept in life sciences including immunology. Another important Vision and Change concept that this activity on life-history trade-offs helps to touch upon is related to Pathways and Transformation of Energy and Matter (The American Association for the Advancement of Science, 2011). The time and effort required to cover immunology exclusive cellular and molecular concepts, and its biomedical applications is enormous, and these two concepts are often neglected in that process (Bruns et al., 2021). In addition, eco-immunology or evolution are not well-elaborated topics in immunology textbooks. Most of the examples in immunology textbooks are based on human or mammalian data, since the focus is primarily biomedical. Therefore, presently instructors often must devise their own resources if they want to cover this topic in their class in a meaningful manner. With that, we hope that this activity will be helpful for instructors to address that immune system activation is an energy-intensive process that can influence other critical life history traits, such as growth and reproduction (Pandey, 2021).
Data availability statement
The raw data supporting the conclusions of this article will be made available by the authors, without undue reservation.
Ethics statement
The studies involving humans were approved by the Colorado State University Institutional Review Board (protocol 3804; FWA0000647). The studies were conducted in accordance with the local legislation and institutional requirements. The ethics committee/institutional review board waived the requirement of written informed consent for participation from the participants or the participants’ legal guardians/next of kin because the data collected were part of normal classroom activities.
Author contributions
MB: Conceptualization, Data curation, Formal Analysis, Investigation, Methodology, Project administration, Writing – original draft, Writing – review and editing. JN: Data curation, Formal Analysis, Investigation, Methodology, Project administration, Visualization, Writing – original draft, Writing – review and editing. SP: Conceptualization, Data curation, Formal Analysis, Funding acquisition, Investigation, Methodology, Project administration, Writing – original draft, Writing – review and editing.
Funding
The author(s) declare that financial support was received for the research and/or publication of this article. This manuscript was supported with funding from the National Science Foundation (RCN-UBE No. #2316260 awarded to SP and IUSE No. 2235378 awarded to MB).
Acknowledgments
We acknowledge the Immunoreach collaborative network, the students who participated in this study, and Dr. Elizabeth Harp (instructor at CSU) for allowing us to teach this module in her evolution course. We also thank Drs. Brian Wisenden and Paul Ode for reviewing the assessment questions before implementation. We are grateful to Dr. Paul Ode for his assistance in statistical analyses.
Conflict of interest
The authors declare that the research was conducted in the absence of any commercial or financial relationships that could be construed as a potential conflict of interest.
Generative AI statement
The authors declare that no Generative AI was used in the creation of this manuscript.
Publisher’s note
All claims expressed in this article are solely those of the authors and do not necessarily represent those of their affiliated organizations, or those of the publisher, the editors and the reviewers. Any product that may be evaluated in this article, or claim that may be made by its manufacturer, is not guaranteed or endorsed by the publisher.
References
Alkaher, I., Shmueli, M., and Dreyfus, A. (2020). “Let’s talk about it”–explicit discussions as a way to reduce the resistance of religious Jewish science teachers to learning and teaching about evolution: A case study. Educ. Sci. 10:298. doi: 10.3390/educsci10110298
Alters, B. J., and Alters, S. M. (2001). Defending evolution in the classroom: A guide to the creation/evolution controversy. Sudbury, MA: Jones and Bartlett Publishers.
American Library Association [ALA] (2021). Visual literacy as a tool for learning. Chicago, IL: American Library Association [ALA].
Andrews, T. M., Kalinowski, S. T., and Leonard, M. J. (2011a). Are humans evolving?” A classroom discussion to change student misconceptions regarding natural selection. Evolution 4, 456–466. doi: 10.1007/s12052-011-0343-4
Andrews, T. M., Leonard, M. J., Colgrove, C. A., and Kalinowski, S. T. (2011b). Active learning not associated with student learning in a random sample of college biology courses. CBE Life Sci. Educ. 10, 394–405. doi: 10.1187/cbe.11-07-0061
Antolin, M. F., Jenkins, K. P., Bergstrom, C. T., Crespi, B. J., De, S., Hancock, A., et al. (2012). Evolution and medicine in undergraduate education: A prescription for all biology students. Evolution 66, 1991–2006. doi: 10.1111/j.1558-5646.2011.01552.x
Balgopal, M. M. (2014). Learning and intending to teach evolution: Concerns of pre-service biology teachers. Res. Sci. Educ. 44, 27–52. doi: 10.1007/s11165-013-9371-0
Balgopal, M. M., Wallace, A. M., and Dahlberg, S. (2012). Writing to learn ecology: A study of three populations of college students. Environ. Educ. Res. 18, 67–90. doi: 10.1080/13504622.2011.576316
Balgopal, M. M., Wallace, A. M., and Dahlberg, S. (2017). Writing from different cultural contexts: How college students frame an environmental SSI through written arguments. J. Res. Sci. Teach. 54, 195–218. doi: 10.1002/tea.21342
Banitz, T., Hertz, T., Johansson, L. G., Lindkvist, E., Martinez Pena, R., Radosavljevic, S., et al. (2022). Visualization of causation in social-ecological systems. Ecol. Soc. 27:31. doi: 10.5751/ES-13030-270131
Barnes, M. E., and Brownell, S. E. (2016). Practices and perspectives of college instructors on addressing religious beliefs when teaching evolution. CBE Life Sci. Educ. 15, 1–19. doi: 10.1187/cbe.15-11-0243
Beggrow, E. P., and Sbeglia, G. C. (2019). Do disciplinary contexts impact the learning of evolution. Assessing knowledge and misconceptions among anthropology and biology students. Evolution 12:1. doi: 10.1186/s12052-018-0094-6
Bertka, C. M., Pobiner, B., Beardsley, P., and Watson, W. A. (2019). Acknowledging students’ concerns about evolution: A proactive teaching strategy. Evolution 12, 1–28. doi: 10.1186/s12052-019-0095-0
Börner, K., Bueckle, A., and Ginda, M. (2019). Data visualization literacy: Definitions, conceptual frameworks, exercises, and assessments. Proc. Natl. Acad. Sci. U.S.A. 116, 1857–1864. doi: 10.1073/pnas.1807180116
Bowen, G. M., Roth, W. M., and McGinn, M. K. (1999). Interpretations of graphs by university biology students and practicing scientists: Toward a social practice view of scientific representation practices. J. Res. Sci. Teach. 36, 1020–1043. doi: 10.1002/(SICI)1098-2736(199911)36:9<1020::AID-TEA4<3.0.CO;2-#
Braun, V., and Clarke, V. (2019). Reflecting on reflexive thematic analysis. Qual. Res. Sport Exerc. Health 11, 589–597. doi: 10.1080/2159676X.2019.1628806
Bruns, H. A., Wisenden, B. D., Vanniasinkam, T., Taylor, R. T., Elliott, S. L., Sparks-Thissen, R. L., et al. (2021). Inside the undergraduate immunology classroom: Current practices that provide a framework for curriculum consensus. J. Microbiol. Biol. Educ. 22, 10–1128. doi: 10.1128/jmbe.v22i1.2269
Catley, K. M., and Novick, L. R. (2008). Seeing the wood for the trees: An analysis of evolutionary diagrams in biology textbooks. BioScience 58, 976–987. doi: 10.1641/B581011
Cunningham, D. L., and Wescott, D. J. (2009). Still more “fancy” and “myth” than “fact” in students’ conceptions of evolution. Evolution 2, 505–517. doi: 10.1007/s12052-009-0123-6
Deeg, M. D., Boone, A. L., Chen, A., and Shirley, T. (2024). Why honors?: A qualitative investigation and taxonomy of student motivations for enrolling in honors programs. Stud. High. Educ. 49, 2797–2811. doi: 10.1080/03075079.2024.2323615
Deniz, H., Donnelly, L. A., and Yilmaz, I. (2008). Exploring the factors related to acceptance of evolutionary theory among Turkish preservice biology teachers: Toward a more informative conceptual ecology for biological evolution. J. Res. Sci. Teach. 45, 420–443. doi: 10.1002/tea.20223
Dunk, R. D., Barnes, M. E., Reiss, M. J., Alters, B., Asghar, A., Carter, B. E., et al. (2019). Evolution education is a complex landscape. Nat. Ecol. Evol. 3, 327–329. doi: 10.1038/s41559-019-0802-9
Frasier, T. R., and Roderick, C. (2011). Improving how evolution is taught: Facilitating a shift from memorization to evolutionary thinking. Evolution 4, 298–307. doi: 10.1007/s12052-011-0327-4
French, S. S., DeNardo, D. F., and Moore, M. C. (2007). Trade-offs between the reproductive and immune systems: Facultative responses to resources or obligate responses to reproduction? Am. Nat. 170, 79–89. doi: 10.1086/518569
Gardner, S. M., Angra, A., and Harsh, J. A. (2022). “A framework for teaching and learning graphing in undergraduate biology,” in Trends in teaching experimentation in the life sciences, eds N. Pelaez, T. Anderson, and S. M. Gardner (Cham: Springer Nature), 143–170.
Gardner, S. M., Angra, A., and Harsh, J. A. (2024). Supporting student competencies in graph reading, interpretation, construction, and evaluation. CBE Life Sci. Educ. 23:fe1. doi: 10.1187/cbe.22-10-0207
Georgiev, A. V., Kuzawa, C. W., and McDade, T. W. (2016). Early developmental exposures shape trade-offs between acquired and innate immunity in humans. Evol. Med. Public Health 2016, 256–269. doi: 10.1093/emph/eow022
Glazer, N. (2011). Challenges with graph interpretation: A review of the literature. Stud. Sci. Educ. 47, 183–210. doi: 10.1128/jmbe.v20i3.1863
Goldston, M. J. D., and Kyzer, P. (2009). Teaching evolution: Narratives with a view from three southern biology teachers in the U.S. J. Res. Sci. Teach. 46, 762–790. doi: 10.1002/tea.20289
Gregory, T. R. (2009). Understanding natural selection: Essential concepts and common misconceptions. Evolution 2, 156–175. doi: 10.1007/s12052-009-0128-1
Grunspan, D. Z., Moeller, K. T., Nesse, R. M., and Brownell, S. E. (2019). The state of evolutionary medicine in undergraduate education. Evol. Med. Public Health 2019, 82–92. doi: 10.1093/emph/eoz012
Ha, M., Haury, D. L., and Nehm, R. H. (2012). Feeling of certainty: Uncovering the missing link between knowledge and acceptance of evolution. J. Res. Sci. Teach. 49, 95–121. doi: 10.1002/tea.20449
Haak, D. C., HilleRisLambers, J., Pitre, E., and Freeman, S. (2011). Increased structure and active learning reduce the achievement gap in introductory biology. Science 332, 1213–1216. doi: 10.1126/science.1204820
Hubbard, K. E., and Dunbar, S. D. (2017). Perceptions of scientific research literature and strategies for reading papers depend on academic career stage. PLoS One 12:e0189753. doi: 10.1371/journal.pone.0189753
Kalinowski, S. T., Leonard, M. J., and Andrews, T. M. (2010). Nothing in evolution makes sense except in the light of DNA. CBE Life Sci. Educ. 9, 87–97. doi: 10.1187/cbe.09-12-0088
Kharrazi, A., Kudo, S., and Allasiw, D. (2018). Addressing misconceptions to the concept of resilience in environmental education. Sustainability 10:4682. doi: 10.3390/su10124682
Kranke, N. (2023). Explanatory integration and integrated explanations in Darwinian medicine and evolutionary medicine. Theoret. Med. Bioeth. 44, 1–20. doi: 10.1007/s11017-022-09594-z
Lashley, M. A., Acevedo, M., Cotner, S., and Lortie, C. J. (2020). How the ecology and evolution of the COVID-19 pandemic changed learning. Ecol. Evol. 10, 12412–12417. doi: 10.1002/ece3.6937
Leinhardt, G., Zaslavsky, O., and Stein, M. K. (1990). Functions, graphs, and graphing: Tasks, learning, and teaching. Rev. Educ. Res. 60, 1–64. doi: 10.3102/0034654306000100
Maries, A., and Singh, C. (2016). Performance of graduate students at identifying introductory physics students’ difficulties related to kinematics graphs. arXiv [Preprint]. arXiv:1601.04354. doi: 10.48550/arXiv.1601.04354
McDade, T. W. (2003). Life history theory and the immune system: Steps toward a human ecological immunology. Am. J. Phys. Anthropol. 122, 100–125. doi: 10.1002/ajpa.10398
Mead, L. S., Kohn, C., Warwick, A., and Schwartz, K. (2019). Applying measurement standards to evolution education assessment instruments. Evolution 12, 1–14. doi: 10.1186/s12052-019-0097-y
Moore, D., and Tananis, C. A. (2009). Measuring change in a short-term educational program using a retrospective pretest design. Am. J. Eval. 30, 189–202. doi: 10.1177/1098214009334506
Nelson, C. E., Scharmann, L. C., Beard, J., and Flammer, L. I. (2019). The nature of science as a foundation for fostering a better understanding of evolution. Evolution 12:6. doi: 10.1186/s12052-019-0100-7
Nesse, R. M., and Williams, G. C. (1994). Why we get sick: The new science of Darwinian medicine. New York, NY: Times Books.
Nieswandt, M., and Bellomo, K. (2009). Written extended-response questions as classroom assessment tool for meaningful understanding of evolutionary theory. J. Res. Sci. Teach. 46, 333–356. doi: 10.1002/tea.20271
Norris, K., and Evans, M. R. (2000). Ecological immunology: Life history trade-offs and immune defense in birds. Behav. Ecol. 11, 19–26. doi: 10.1093/beheco/11.1.19
Ode, A. B., Rieders, N. F., Ode, P. J., and Balgopal, M. M. (2025). Improving visual literacy skills: Reading between the lines, bars, dots, and images. Sci. Teach. 92, 42–48. doi: 10.1080/00368555.2025.2502585
Pandey, S. (2021). Immunology topics to teach in undergraduate education. Available online at: https://asm.org/Articles/2021/February/Immunology-Topics-To-Teach-in-Undergraduate-Educat (accessed January 14, 2024).
Pandey, S., Bruns, H. A., Condry, D. L. J., Justement, L. B., Kleinschmit, A. J., Liepkalns, J., et al. (2023). CourseSource immunology learning framework coursesource. Available online at: https://qubeshub.org/community/groups/coursesource/courses/immunology/ (accessed January 14, 2024).
Pandey, S., Elliott, S.S. L., Liepkalns, J., Taylor, R. T., Vanniasinkam, T., Kleinschmit, A. J., et al. (2024). The ImmunoSkills guide: Competencies for undergraduate immunology curricula. PLoS One 19:e0313339. doi: 10.1371/journal.pone.0313339
Paz-y-Mino-C, G., and Espinosa, A. (2016). Measuring the evolution controversy: A numerical analysis of acceptance of evolution at America’s colleges and universities. Newcastle: Cambridge Scholars Publishers.
Pennock, R. T. (2005). “On teaching evolution and the nature of science,” in Evolutionary science and society: Education a new generation, eds J. Cracraft and R. W. Bybee (Colorado Springs: BSCS), 7–12.
Pobiner, B. (2016). Accepting, understanding, teaching, and learning (human) evolution: Obstacles and opportunities. Am. J. Phys. Anthropol. 159, 232–274. doi: 10.1002/ajpa.22910
Pobiner, B., Beardsley, P. M., Bertka, C. M., and Watson, W. A. (2018). Using human case studies to teach evolution in high school AP biology classrooms. Evolution 11:3. doi: 10.1186/s12052-018-0077-7
Pobiner, B., Watson, W. A., Beardsley, P. M., and Bertka, C. M. (2019). “Using human examples to teach evolution to high school students: Increasing understanding and decreasing cognitive biases and misconceptions,” in Evolution education re-considered: Understanding what works, eds U. Harms and M. Reiss (Cham: Springer), 185–205.
Pye, R., Patchett, A., McLennan, E., Thomson, R., Carver, S., Fox, S., et al. (2018). Immunization strategies producing a humoral IgG immune response against devil facial tumor disease in the majority of Tasmanian devils destined for wild release. Front. Immunol. 9:259. doi: 10.3389/fimmu.2018.00259
Rector, M. A., Nehm, R. H., and Pearl, D. (2013). Learning the language of evolution: Lexical ambiguity and word meaning in student explanations. Res. Sci. Educ. 43, 1107–1133. doi: 10.1007/s11165-012-9296-z
Robin, N. H., and Evans, J. P. (2009). Why physicians must understand evolution. Curr. Opin. Pediatr. 21, 699–702. doi: 10.1097/MOP.0b013e3283323aa8
Roth, W.-M. (2013). Undoing decontextualization or how scientists come to understand their own data/graphs. Sci. Educ. 97, 80–112. doi: 10.1002/sce.21044
Round, J. E., and Campbell, A. M. (2013). Figure facts: Encouraging undergraduates to take a data-centered approach to reading primary literature. CBE Life Sci. Educ. 12, 39–46. doi: 10.1187/cbe.11-07-0057
Rutledge, M. L., and Warden, M. A. (2000). Evolutionary theory, the nature of science, and high school biology teachers: Critical relationships. Am. Biol. Teach. 62, 23–31. doi: 10.2307/4450822
Shields, M. (2004). Are humans still evolving? A natural selection discussion lesson. Am. Biol. Teach. 66, 21–25. doi: 10.2307/4451612
Siciliano-Martina, L., and Martina, J. P. (2020). Shifting barriers to the acceptance of evolution in an underrepresented student group. Int. J. Sci. Educ. 42, 2205–2223. doi: 10.1080/09500693.2020.1815247
Smithsonian Institution (2025). What does it mean to be human? Teaching evolution through human examples. Washington, DC: Smithsonian Institution.
The American Association for the Advancement of Science (2011). Vision and change in undergraduate biology education: A call to action. New York, NY: The American Association for the Advancement of Science.
Tidon, R., and Lewontin, R. C. (2004). Teaching evolutionary biology. Genet. Mol. Biol. 27, 124–131. doi: 10.1590/S1415-47572004000100021
Tolman, E. R., Ferguson, D. G., Hubble, G., Kaloi, M., Niu, M., and Jensen, J. L. (2021). Barriers to teaching evolution in higher education. Evolution 14, 1–16. doi: 10.1186/s12052-021-00151-1
Urlacher, S. S., Ellison, P. T., Sugiyama, L. S., Pontzer, H., Eick, G., Liebert, M. A., et al. (2018). Tradeoffs between immune function and childhood growth among Amazonian forager-horticulturalists. Proc. Natl. Acad. Sci. U.S.A. 115, E3914–E3921. doi: 10.1073/pnas.1717522115
Urlacher, S. S., Snodgrass, J. J., Dugas, L. R., Sugiyama, L. S., Liebert, M. A., Joyce, C. J., et al. (2019). Constraint and trade-offs regulate energy expenditure during childhood. Sci. Adv. 5:eaax1065. doi: 10.1126/sciadv.aax1065
Vaz, N. M. (2004). “Immunology: Elementary concepts and misconceptions,” in Proceedings of the 3rd Brazilian symposium of mathematical and computational biology, (Rio de Janeiro), 412–431.
Weisberg, D. S., Landrum, A. R., Hamilton, J., and Weisberg, M. (2021). Knowledge about the nature of science increases public acceptance of science regardless of identity factors. Public Understand. Sci. 30, 120–138. doi: 10.1177/0963662520977700
Winslow, M. W., Staver, J. R., and Scharmann, L. C. (2011). Evolution and personal religious belief: Christian university biology-related majors’ search for reconciliation. J. Res. Sci. Teach. 48, 1026–1049. doi: 10.1002/tea.20417
Witkow, M. R., Spiekerman, A., Ford-Roshon, C., Hershman, T., and Stevens, C. (2022). An experimental study of the effects of scaffolding and context in training graphical literacy among 2-and 4-year college students. Scholarsh. Teach. Learn. Psychol. 11, 214–230. doi: 10.1037/stl0000344
Keywords: evolution, immunology, fitness, trade-offs, graphical reasoning, interdisciplinary collaboration
Citation: Balgopal MM, Neuwald JL and Pandey S (2025) Introducing undergraduate students to human evolution through eco-immunology. Front. Educ. 10:1606625. doi: 10.3389/feduc.2025.1606625
Received: 06 April 2025; Accepted: 30 June 2025;
Published: 11 August 2025.
Edited by:
Lee E. Hughes, University of North Texas, United StatesReviewed by:
Rebecca Rivard, Villanova University, United StatesSachi Pawar, Philadelphia College of Osteopathic Medicine (PCOM), United States
Copyright © 2025 Balgopal, Neuwald and Pandey. This is an open-access article distributed under the terms of the Creative Commons Attribution License (CC BY). The use, distribution or reproduction in other forums is permitted, provided the original author(s) and the copyright owner(s) are credited and that the original publication in this journal is cited, in accordance with accepted academic practice. No use, distribution or reproduction is permitted which does not comply with these terms.
*Correspondence: Meena M. Balgopal, TWVlbmEuQmFsZ29wYWxAY29sb3N0YXRlLmVkdQ==