 Laura Palmerio
 Elisa Caponera
- Istituto Nazionale per la Valutazione del Sistema educativo di Istruzione e di Formazione (INVALSI), Rome, Italy
Achieving high response rates in international large-scale assessments (ILSAs) is crucial for ensuring data validity and cross-national comparability. The first part of this article reviewed the literature on response rates in low-stakes assessments and showed that efforts to increase student motivation are central. In the second part, we described the strategies and practices developed by the Italian national center to enhance participation among schools, students, teachers, and parents in IEA surveys. A multi-dimensional approach was adopted, focusing on communication, training, logistical coordination, and data management. Early and clear engagement with school leaders and coordinators fostered commitment, while online seminars prepared staff and emphasized the importance of participation in international studies. A centralized platform streamlined communication and reduced the burden on schools, facilitating accurate sample tracking and data exchange. Teachers are encouraged to explain the significance of these studies to colleagues and students and to schedule assessment days thoughtfully to minimize absenteeism. When necessary, follow-up actions such as make-up sessions and personalized support for schools are provided. Special attention is dedicated to including students with special educational needs (SEN), emphasizing that certifications should not automatically lead to exclusion and that accommodations should be made whenever feasible. Customized communication strategies, logistical support, and privacy safeguards—particularly in handling parent questionnaires—are essential for securing engagement and trust. Overall, the Italian experience highlighted the importance of combining strong institutional support with thoughtful, flexible implementation strategies to maintain high levels of participation across all respondent groups.
1 Introduction
Large-scale assessments (ILSA) involving students (and their families) and schools (teachers and school leaders) face persistent challenges in achieving high response rates, which are crucial for data validity and representativeness. Enhancing participation and response rates in these surveys requires a multifaceted approach that leverages established strategies and frameworks from educational contexts. Central to improving participation is the development, at various levels, of effective communication strategies that emphasize the benefits of engagement to students, their families, and the whole school.
ILSAs require three distinct levels of participation, each with specific involvement requirements.
The first level concerns national coordination centers, which must recruit the sampled schools and persuade them to participate in the research if not required by law. Once participation has been secured, it is essential to keep schools motivated and focused on the objective, preventing any dropouts along the way.
The second level concerns students, the primary recipients of data collection. It is essential to ensure their presence during test administration and active participation in answering the questions. This category also includes parents when involved in the assessment process.
The third level includes teachers and school principals. They are involved both in the decision-making phase of participation (principals) and in the internal coordination of the survey (teachers), as well as being directly involved as respondents to the context questionnaires intended for them.
Part of the literature on how to increase response rates concerns student evaluations of teachers for specific courses. In such cases, it is recommended to use online surveys, which are more efficient, faster, and less expensive. The literature comparing paper-based and online formats often assume that online administration does not occur in a classroom setting (e.g., Berk, 2012; Hill and LoPalo, 2024; Mau and Opengart, 2012) and therefore suggests using prompts to encourage students to respond (e.g., sending reminder emails or making access to other information or resources conditional on completion of the survey). Although the results of these studies may be relevant for ILSAs, their direct applicability to the large-scale assessments examined in this article is limited, as students complete these tests online but within school hours and under classroom supervision. Furthermore, the body of literature specifically addressing participation in large-scale assessments—such as those administered by the IEA and the OECD—remains limited (Atasever et al., 2024; Clarke and Luna-Bazaldua, 2021; Cresswell et al., 2015; Greaney and Kellaghan, 2008).
Therefore, the main source of information on the most effective strategies is experience gained from actual practice. In this study, we will illustrate strategies and practices to encourage the participation of schools and students that we have found to be most effective, applied by the Italian national center and updated over time.
1.1 School level participation
According to the literature, the first things to take special care of are communication with schools and stakeholder engagement. Early involvement of school staff in the survey process fosters buy-in and relevance, increasing the likelihood of participation. Before the assessment period, launching awareness campaigns using posters, emails, and social media can remind and motivate stakeholders. Sending personalized reminder emails, especially targeting undecided schools, is effective, but excessive reminders can lead to diminishing returns (Chaudhury and Jenkins, 2021; DeFlitch, n.d.).
Schools should be informed of their assessment participation, receiving clear guidelines on objectives, procedures, timing, student selection, logistics, and confidentiality. Test administrators must follow up weeks and days before testing to confirm readiness and ensure all materials are in place (Clarke and Luna-Bazaldua, 2021).
The use of incentives and feedback loops is another option to consider. In some contexts, material incentives or public recognition are mentioned as tools to boost response rates, although their impact is generally less significant than that of perceived usefulness and strong school leadership (Ahmad, 2018). Closing the feedback loop by reporting back to students and schools about how their input led to changes or improvements increases trust and future participation (Berk, 2012). The literature suggests that providing feedback to schools—accompanied by practical guidance on how to use the data for improvement—can serve as an intrinsic incentive for participation (Ahmad, 2018; Volante and Cherubini, 2010).
Also, avoiding over-surveying by limiting the frequency of assessments helps maintain engagement (Van Mol, 2017), and ensuring political and financial support, clear communication about the purpose of the assessment, and technical reliability are foundational for large-scale success (Clarke and Luna-Bazaldua, 2021).
Last, the use of data and perceived relevance is also important. The literature emphasizes that teachers’ and principals’ perceived usefulness of assessment results is a key factor: when assessment data are actually integrated into school improvement processes and instructional planning, motivation to participate increases. Disaggregating data for specific student groups (e.g., students with special educational needs or different linguistic backgrounds) and integrating assessment results with other information sources further strengthen the sense of relevance and foster collaboration among colleagues (Volante and Cherubini, 2010).
1.2 Student (and parent) participation
Interviews with teachers and school leaders highlight the importance of actively involving school staff in organizing and implementing large-scale assessments. Specifically, motivating students through targeted activities, as well as scheduling dedicated time for test administration, are effective strategies to increase participation (Volante and Cherubini, 2010). Allocating dedicated time during class for students to complete assessments significantly increases response rates. In-person prompts or nudges from teachers during class are particularly effective in boosting participation (Chaudhury and Jenkins, 2021).
Also, keeping the assessment window open for at least 2 weeks and scheduling survey-taking during homeroom or other convenient periods ensures higher coverage (DeFlitch, n.d.).
It is also important to consider the administration mode, whether paper-based or online. While online assessments are convenient, paper-based surveys or in-class paper prompts can yield higher response rates in some contexts. However, in-class prompts paired with online surveys offer a cost-effective and scalable alternative (Chaudhury and Jenkins, 2021); this is precisely how the international comparative surveys operate nowadays.
1.3 Teacher and school principal participation
The importance of organizational and logistical support should not be overlooked. The presence of school leadership that actively promotes participation and allocates resources (e.g., freeing up teachers for preparation activities or coordinating test logistics) is associated with higher response rates. Clear communication and well-defined roles and responsibilities also facilitate the participation of schools and students. In the case of ILSAs, the work of national coordinating centers is paramount; they assist schools in each step of the process, intervening to solve possible problems, reminding them of the necessary actions to perform, and guiding them in following the procedures correctly (OECD, 2018; UNESCO, 2018, 2024).
This last point is also important for the involvement of teachers and school leaders as respondents to context questionnaires. In addition, at this level, integrating assessments with familiar platforms (such as an institution’s Learning Management System) and ensuring ease of access can remove barriers to participation (Explorance, 2025).
1.4 Response rate in IEA’s surveys
The methodological approach of the IEA’s surveys is designed to ensure that the result is valid cross-national data, meaning the data must be truly comparable across different countries. This requirement establishes the high-quality standards that must be upheld at every stage and in every operation of the research process.1 A key component of sample surveys, such as those conducted by the IEA, is defining the minimum standards for the sample of respondents to represent the target population accurately. The sampling design in the IEA surveys involves a two-stage stratified sample that uses probabilistic selection based on school size. A minimum of 150 schools are selected to participate in the survey. Within each school, one or more classes from the target grade are randomly sampled. Furthermore, for the IEA ICCS and ICILS surveys, between 15 and 19 teachers per school are randomly selected. In contrast, for the IEA PIRLS and TIMSS surveys, each sampled class’s teacher of the subject being studied is invited to respond.
2 Achieving adequate response rates: a national perspective
Italy has participated in IEA surveys since their inception, first through university departments. In the 1980s, the national coordination of the surveys passed to the National Institute for the Evaluation of the Education System (INVALSI), initially named CEDE (Centro Europeo dell’educazione). The experience our national center has accumulated over the years has led to the development and refinement of various strategies aimed at ensuring an adequate response rate.
Over time, INVALSI has utilized a series of policy and operational measures to enhance school participation in national large-scale assessments. These include the following:
• Making participation in assessments mandatory for schools and linking assessment data to school-level reporting and improvement plans. The compulsory nature of the national surveys initially created much resistance on the part of some schools, which in some cases resulted in a generalized refusal to conduct the tests (e.g., in the 2014–2015 school year, there were extensive gaps in the database). However, with time, schools have come to appreciate the usefulness of this data for their own improvement, also thanks to the link with self-evaluation efforts.
• Issuing reminders and guidelines through regional school offices and inspectors.
• Using digital platforms to monitor participation in near real-time, which enables prompt follow-up with low-response schools.
While direct causal evidence on administrative pressure on school and individual test-taking effort in Italy is lacking, studies such as Wöbmann et al. (2007) found that students in countries with strong accountability mechanisms tend to show higher self-reported effort, though the relationship is nuanced and varies by context.
2.1 Student response rate
The standards for participation rates in the international IEA surveys in which Italy participates are defined a priori. The minimum acceptable participation rates are 85% of schools, 95% of classes, and 85% of students, or a combined rate (the product of school, class, and student participation) of 75%.
Table 1 shows the student response rate recorded in Italy in the most recent wave of each survey with the comparison of the countries that participated in all IEA surveys in which Italy also took part.2
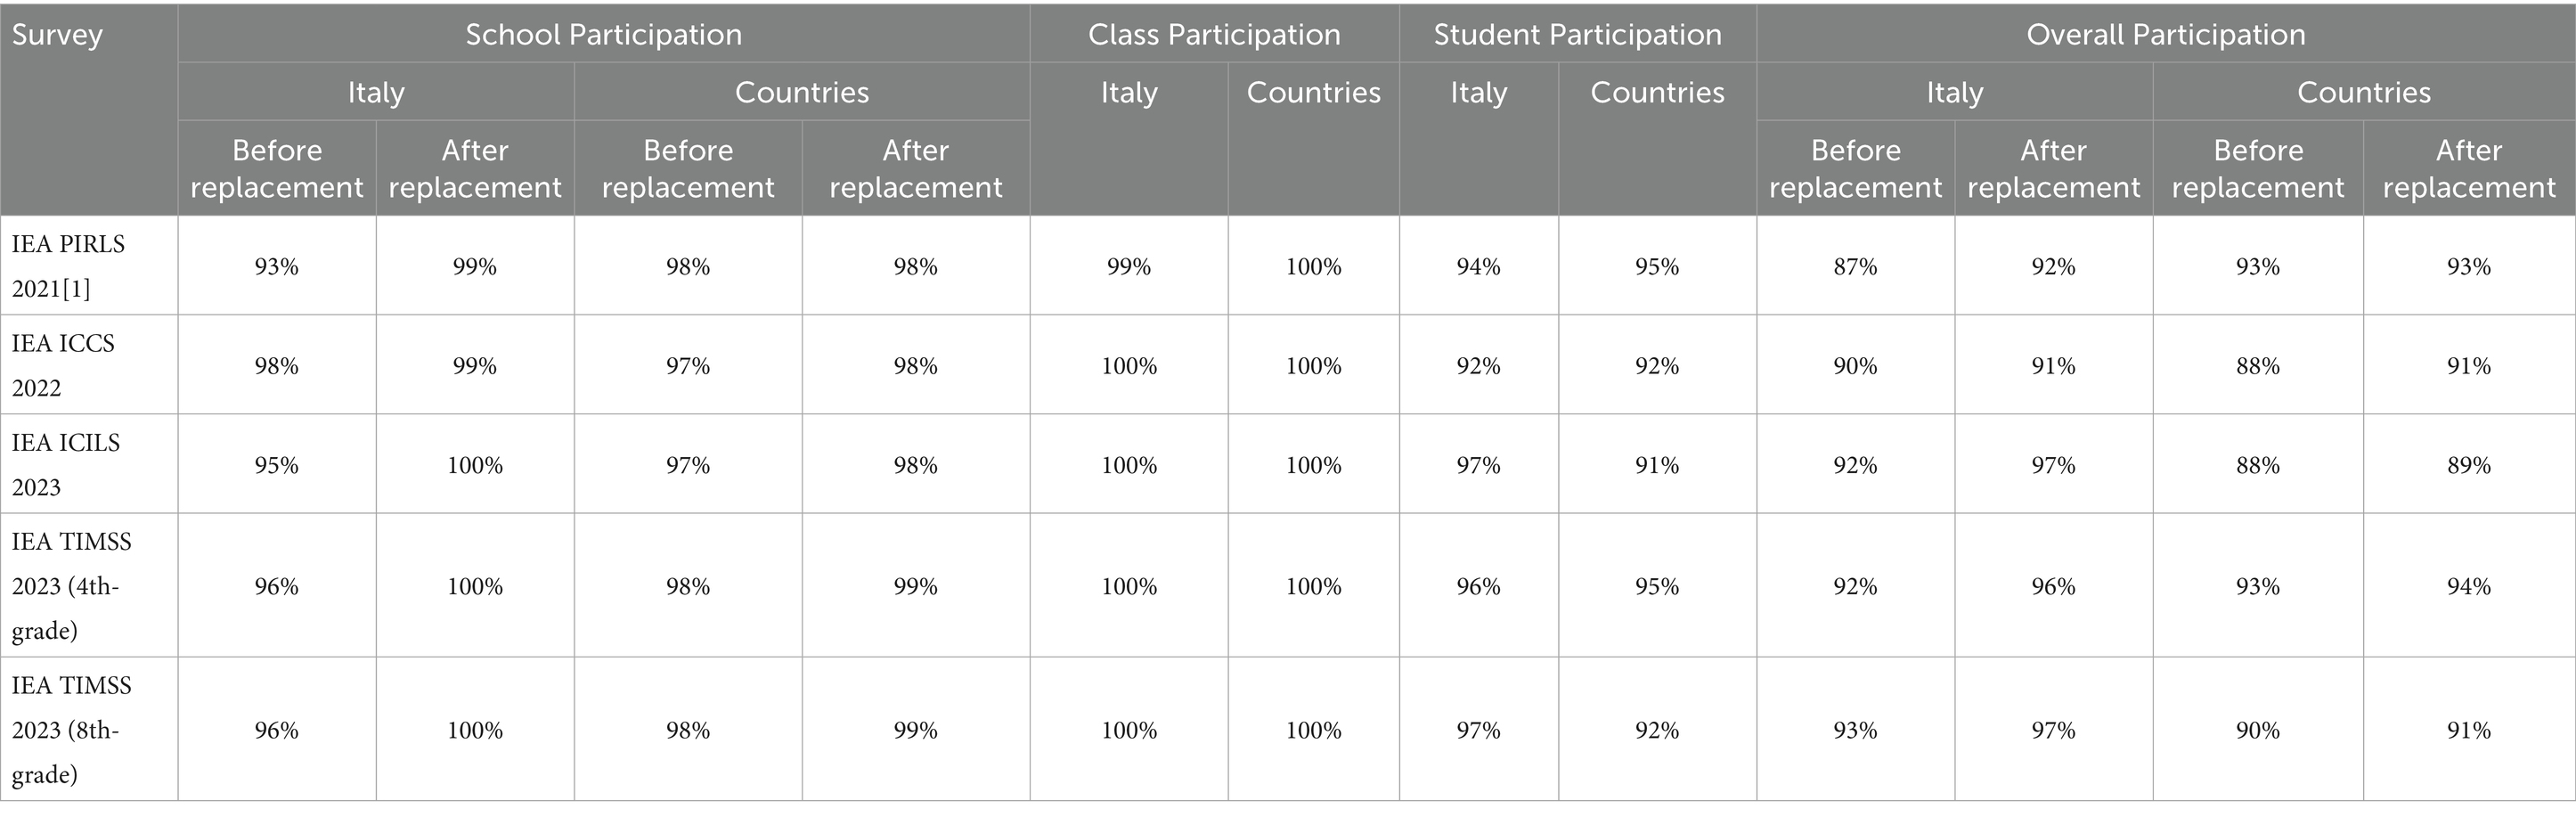
Table 1. Student response rate in Italy across different IEA surveys (latest assessment)—weighted
The response rate for Italy across the surveys is satisfactory and aligns with the average response rate of countries participating in all four IEA surveys. Furthermore, no significant differences in participation rates are observed with respect to geographic areas or socioeconomic context.
To obtain a high response rate, since we cannot engage directly with students, our approach focuses on supporting teachers and school leaders in understanding the value of these studies. This way, they can effectively motivate students to participate in the survey and fully commit themselves to taking the test.
Low motivation, in fact, is a significant issue in low-stakes testing situations, where the tests may not hold much importance for the individuals taking them, but can have substantial implications for educators, school districts, or educational and governmental bodies, contributing significantly to identifying the strengths and weaknesses of the education system as a whole (Barry and Finney, 2009; Finn, 2015; Kornhauser et al., 2014).
In Italy, a range of strategies is employed to encourage the participation of schools and teachers in the IEA surveys (Table 2). Schools in the main study sample are typically contacted starting in January of the data collection year, which takes place between March and May. Using information from the Ministry of Education, we have accurate data on teacher allocation, class composition, and school organization, including any recent school mergers. An invitation letter and brochure are first sent to school principals, followed by a phone call to confirm interest in participating. When multiple ILSAs overlap, trained external staff often make initial contact, though our national center handles complex cases directly to provide reassurance and clarify the flexible testing window. Principals are also asked to appoint a coordinating teacher, who will act as the main contact for implementing the study. To encourage schools to participate, until 2023, a financial incentive of 200 euros was provided to schools for coordination activities and 150 euros for administering the test in each sampled class. The school was then free to use this amount as it saw fit. Still, our suggestion was to allocate a small amount to the coordinating and administering teachers.
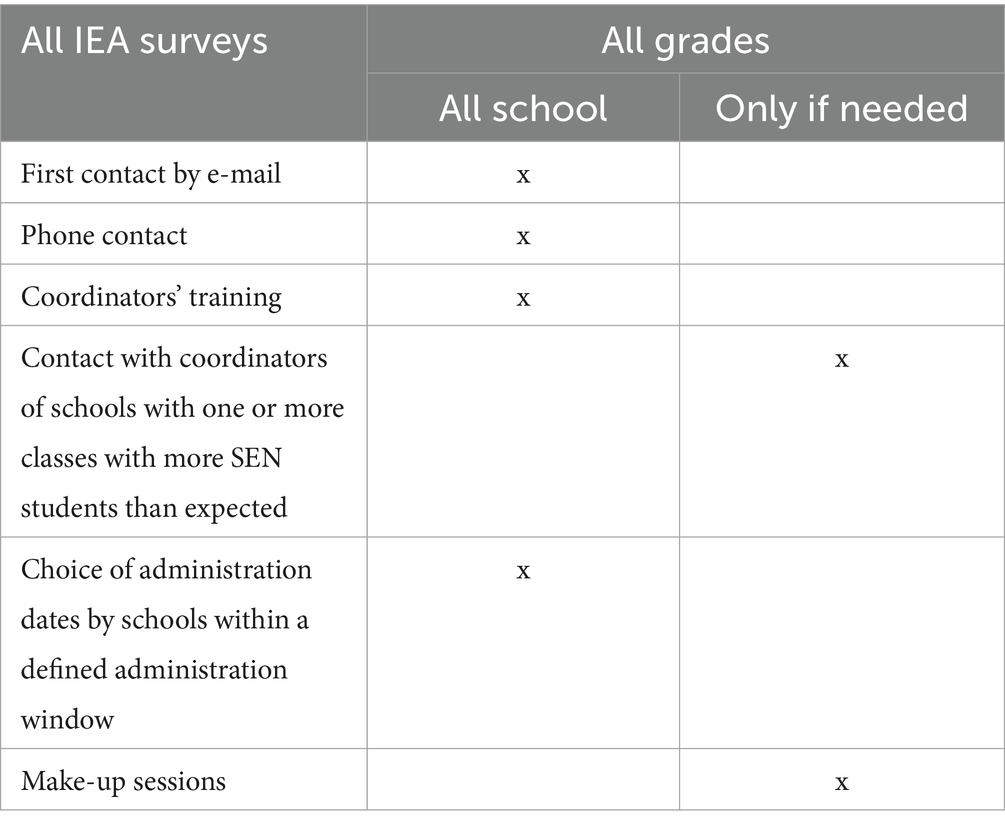
Table 2. Steps implemented to ensure an adequate student response rate.
In 2017, a legislative decree was issued, which states, “Educational institutions participate in international and national assessments of learning levels for the evaluation of the national education system and the quality of their own service.”3
Following the enactment of this decree, after a transition period during which the financial incentive continued to be granted, it was decided to eliminate it starting in 2023.4 The mandatory nature indicated by the decree facilitates school participation. Still, at the same time, as a national center, we pay particular attention to ensuring that schools fully understand the importance of the study and choose to participate willingly. Based on our experience, forcing a school to participate makes it challenging to find a teacher willing to take on the coordinator role and, more generally, risks leading to poor-quality data collection.
In order to lessen the workload for teachers, which could potentially deter their participation in the Project or diminish their motivation to comply, and to enhance the effectiveness of information management and communication between our national center and schools, we have developed, over the years, a platform that automates numerous steps involved in conducting the surveys. It also facilitates the secure exchange of documents. The coordinator uses the platform in the different steps of the data collection, and school administrative offices utilize this platform to verify initial data against the lists provided by the Ministry. These verified lists are then employed for selecting students and, when necessary, for selecting teachers.
Based on our experience, effectively motivating students to participate in the survey requires conveying the importance of the study from an international comparative perspective, even if it does not have a direct impact on their individual academic paths. Since it is not possible to directly inform or train students, for over 20 years the INVALSI national center responsible for international studies has considered it essential to focus on motivating teachers, so that they in turn can communicate the value of the study to their students. The national center conducts online training seminars for teachers coordinating and administering the assessments. These sessions, held in February, are essential for ensuring proper test implementation and for motivating staff by emphasizing the value of international comparative studies. Based on our experience, these training seminars are crucial in motivating all involved parties. Our goal is to inspire the coordinators by highlighting the significance of participating in an international comparative study, even when the results may not immediately impact their individual schools. Teachers receive a brief overview of previous survey results to highlight the significance of participation. This helps coordinators encourage student engagement, even in the absence of grades, and fosters interest among parents. The seminars also offer a space to address key topics such as student exclusions and the possible inclusion of students with special educational needs (SEN).
Students may be excluded from IEA assessments only under specific conditions: (1) those with physical disabilities that prevent test participation and cannot be reasonably accommodated; (2) those with severe intellectual disabilities, as assessed by qualified school staff; and (3) non-native speakers who lack sufficient language proficiency to engage with the test content.
In Italian schools, class composition aims to limit the number of SEN students per class. Principals must distribute SEN students fairly, and if more than two are in a class, the total number of students must not exceed 20. While having multiple students with disabilities in one class is permitted only in mild cases, Italy still shows higher-than-expected test exclusion rates. In 2022/2023, 4.2% of students had disabilities and 5.7% had specific learning disorders, but only 1.2% had severe disabilities. Yet, exclusion rates were 6.1% (TIMSS Grade 4), 4.4% (Grade 8), and 3.8% (ICILS).
One reason for this discrepancy is that all SEN students fall under the same law (Law 104/1992), regardless of severity. This may lead coordinators to exclude students who could participate with accommodations. However, exclusions should not be based on low academic performance or common behavioral issues. Students with learning disorders like dyslexia should be accommodated rather than excluded.
Privacy rules prevent the national center from knowing which SEN category an excluded student belongs to. SEN students in Italy are classified into three subgroups:
• Certified disabilities (Law 104/92): visual, hearing, psychophysical impairments.
• Specific developmental disorders (Law 170/2010): SLDs, ADHD, behavioral/emotional disorders.
• Disadvantage (ministerial decrees): socio-economic, cultural-linguistic, relational issues.
To minimize exclusions, training emphasizes that certification does not bar participation, especially with more engaging computer-based tests. We monitor exclusion rates and follow up with schools reporting three or more exclusions per class to confirm necessity, often resulting in re-inclusion. Primary schools pose more challenges, as many students receive certification after enrollment, leading to a concentration of SEN students not evident at the time of class formation.
2.2 Administration window
Test administration planning must carefully consider the timing of the administration window. For Grade 4 (PIRLS and TIMSS), assessments are typically scheduled in April to avoid Easter holidays and end-of-year school trips in May. In contrast, Grade 5 (TIMSS longitudinal) and Grade 8 assessments must be administered in March to prevent overlap with the nationally mandated INVALSI tests held in April.
To ensure adequate response rates, international protocols require a make-up session if classroom attendance falls below 90% on test day. To minimize this need, school coordinators are advised to select dates that avoid weekends and local events. An automated tool is provided to help teachers assess whether a make-up session is necessary based on absentee numbers.
2.3 Teachers’ response rate
Over the years, our national center has gained valuable experience, leading to the adoption of various strategies to ensure an adequate response rate, not only from students but also from teachers and parents, where applicable.
For TIMSS and PIRLS, only the teachers of the sampled classes who teach the relevant subjects (mathematics and science for TIMSS, Italian for PIRLS) are involved in the surveys.
For ICILS and ICCS, however, the sampling process includes teachers from the entire school, not just those from the sampled classes.
The teachers’ response rate in Italy was above 90% in both ICILS and ICCS (97% in ICILS; 92% in ICCS) and is higher than the average of the countries participating in all surveys (see footnote 2). (81% in ICCS and 86% in ICILS).
2.4 Parents’ response rate (TIMSS and PIRLS 4th-grade)
In Italy, 95% of participating students’ parents responded to the TIMSS and PIRLS questionnaire. One of the main concerns among parents is whether the questionnaire will remain anonymous. To ensure a high level of parental participation, it is crucial to provide parents with an explicit guarantee of anonymity while ensuring that their responses can be linked to their child’s questionnaire, as required by the IEA.
To achieve this, each student receives an envelope containing the Family Questionnaire. Parents can complete the questionnaire, place it inside the envelope, and securely seal it before returning it to the school. The envelope and the student questionnaire are labeled with barcodes, allowing them to be matched to the corresponding student while maintaining confidentiality.
As IEA surveys are based on samples, they tend to have less public visibility in Italy compared to national assessments. While this may pose challenges in motivating stakeholders—students, teachers, parents, and school leaders—to participate, it also helps prevent the surveys from being associated with political agendas or government-led initiatives. Furthermore, the fact that IEA is an independent research organization with decades of experience in the field contributes to the perception of impartiality in its studies.
In addition, teachers and parents receive a privacy notice that clearly states there are no consequences for choosing not to complete the questionnaire. The document also explains the comparative nature of the study and assures that all data will be anonymized and analyzed in aggregate form. These aspects likely encourage the participation of both parents and teachers in the surveys.
3 Conclusion
Achieving high response rates in ILSAs is fundamental to ensuring the validity, reliability, and cross-national comparability of the resulting data. This article has underscored the necessity of a comprehensive, multi-level strategy encompassing institutional coordination, targeted communication, logistical infrastructure, and inclusive practices to foster active participation among schools, students, teachers, and parents. We must keep in mind that higher response rates do not necessarily imply high-quality data unless accompanied by sustained test-taking effort. In fact, as Wise and Kong (2005) and others have noted, low-stakes contexts can yield low motivation, and administrative mandates alone may not ensure genuine engagement. More specifically, the complex relationship between participation rates and data validity implies:
• The risk that administrative coercion might lead to “surface compliance,” where students are present but not genuinely engaged.
• The need to monitor effort indicators (e.g., rapid guessing, response time, omitted items) in addition to response rates (Wise et al., 2021). In this regard, the increasing availability of process data related to ILSAs can certainly be useful.
The Italian national center’s approach—through strategic scheduling, exclusion monitoring, and privacy-conscious procedures—reflect a dynamic and context-sensitive model of participation management. The Italian experience underscores the critical role of institutional learning, adaptive implementation, and sustained resource allocation in the successful execution of ILSAs. Such efforts are indispensable for securing the high levels of participation necessary to generate reliable evidence for educational evaluation and policy development.
Although a high response rate does not necessarily guarantee respondent effort or eliminate response biases (e.g., Hendra and Hill, 2019), it remains a key prerequisite for ensuring the validity of responses in large-scale surveys.
The Italian experience demonstrates that combining top-down policy support with bottom-up engagement strategies yields effective results, particularly in low-stakes contexts where motivation may be limited. Central to these efforts is the early and sustained involvement of school leadership, supported by structured training initiatives and the use of a dedicated digital platform that streamlines administrative processes and enhances communication. Empowering teachers and conveying the broader relevance of ILSAs within the educational landscape have been shown to promote stronger engagement from both students and families, even in the absence of direct academic consequences.
In the Italian context, an international conference held in Rome in 20125 provided suggestive evidence that schools under stronger administrative pressure (e.g., schools with low prior performance or those subject to external evaluation) show marginally higher completion rates and longer response times, which are often used as proxies for effort. While this is not definitive, it points to a potential link between institutional push and student engagement.
Author contributions
LP: Project administration, Methodology, Writing – review & editing, Supervision, Writing – original draft, Conceptualization. EC: Writing – review & editing, Writing – original draft, Data curation.
Funding
The author(s) declare that no financial support was received for the research and/or publication of this article.
Conflict of interest
The authors declare that the research was conducted in the absence of any commercial or financial relationships that could be construed as a potential conflict of interest.
Generative AI statement
The authors declare that no Gen AI was used in the creation of this manuscript.
Publisher’s note
All claims expressed in this article are solely those of the authors and do not necessarily represent those of their affiliated organizations, or those of the publisher, the editors and the reviewers. Any product that may be evaluated in this article, or claim that may be made by its manufacturer, is not guaranteed or endorsed by the publisher.
Footnotes
1. ^Sampling procedures, response rates, and, more generally, technical information were drawn from the technical reports of various IEA surveys (Fraillon et al., 2025; Schulz et al., 2023; von Davier et al., 2023; von Davier et al., 2024).
2. ^Namely Chinese Taipei, Cyprus, France, Norway, Sweden.
3. ^Legislative Decree No. 62 of April 13, 2017—Regulations on the evaluation and certification of competencies in the first cycle of education and State exams, pursuant to Article 1, paragraphs 180 and 181, letter (i), of Law No. 107 of July 13, 2015. Available online at: https://www.gazzettaufficiale.it/eli/id/2017/05/16/17G00070/sq.
4. ^From the ongoing PIRLS survey (FT, 25 schools), it appears that the number of schools participating in the study has not decreased despite the absence of financial incentives.
5. ^Contributions presented at the conference Improving Education through Accountability and Evaluation. Lessons from Around the World. Available at: https://www.invalsi.it/invalsi/ri/improving_education/?page=index_it_09.
References
Ahmad, T. (2018). Teaching evaluation and student response rate. PSU Res. Rev. 2, 206–211. doi: 10.1108/PRR-03-2018-0008
Atasever, U., Jerrim, J., and Tieck, S. (2024). Exclusion rates from international large-scale assessments: an analysis of 20 years of IEA data. Educ. Assess. Eval. Acc. 36, 405–428. doi: 10.1007/s11092-023-09416-3
Barry, C. L., and Finney, S. J. (2009). Does it matter how data are collected? A comparison of testing conditions and the implications for validity. Res. Pract. Assess. 4, 17–26.
Berk, R. A. (2012). Top 20 strategies to increase the online response rates of student rating scales. Int. J. Technol. Teach. Learn. 8.
Chaudhury, P., and Jenkins, C. (2021). How to raise response rates for teaching evaluations – An experiment. Centre for Teaching & Learning Economics. University College London. Available online at: https://www.ucl.ac.uk/teaching-learning/sites/teaching_learning/files/evaluation_paper_jeesubmission_2018.pdf
Clarke, M., and Luna-Bazaldua, D. (2021). Primer on large-scale assessments of educational achievement. Washington, DC: World Bank Publications.
Cresswell, J., Schwantner, U., and Waters, C. (2015). A review of international large-scale assessments in education: Assessing component skills and collecting contextual data, PISA, the World Bank, Washington DC. Paris: OECD Publishing.
Davier, M.von, Fishbein, B., and Kennedy, A. (2024). TIMSS 2023 technical report (methods and procedures). Boston College: Chestnut Hill, MA.
Davier, M.von, Mullis, I. V. S., Fishbein, B., and Foy, P. (2023). Methods and procedures: PIRLS 2021 technical report. Chestnut Hill, MA:Boston College. Available online at: https://pirls2021.org/methods
DeFlitch, S. (n.d.). 9 ways to raise survey response rates. Panorama Educ. Available online at: https://www.panoramaed.com/blog/9-ways-raise-survey-response-rates
Explorance. (2025). 8 steps to boosting course evaluation response rates: strategies from higher education leaders. Available online at: https://www.explorance.com/blog/8-steps-to-boosting-course-evaluation-response-rates-strategies-from-higher-education-leaders/
Finn, B. (2015). Measuring motivation in low-stakes assessments. ETS Res. Rep. Ser. 2015, 1–17. doi: 10.1002/ets2.12067
Fraillon, J., Rožman, M., Meyer, S., Musu, L., Liaw, Y. L., Christiansen, A., et al. (2025). ICILS 2023 technical report IEA international computer and information literacy study 2023. Amsterdam: IEA International Association for the Evaluation of educational achievement.
Greaney, V., and Kellaghan, T. (Eds.) (2008). Assessing national achievement levels in education, vol. 1. Washington, DC: World Bank Publications.
Hendra, R., and Hill, A. (2019). Rethinking response rates: new evidence of little relationship between survey response rates and nonresponse bias. Eval. Rev. 43, 307–330. doi: 10.1177/0193841X18807719
Hill, A. J., and LoPalo, M. (2024). The effects of online vs in-class testing in moderate-stakes college environments. Econ. Educ. Rev. 98:102505. doi: 10.1016/j.econedurev.2023.102505
Kornhauser, Z. G., Minahan, J., Siedlecki, K. L., and Steedle, J. T. (2014). A strategy for increasing student motivation on low-stakes assessments. New York, NY: Council for Aid to Education.
Mau, R. R., and Opengart, R. (2012). Comparing ratings: in-class (paper) vs. out of class (online) student evaluations. High. Educ. Stud. 2:55. doi: 10.5539/hes.v2n3p55
OECD (2018). Responsive school systems: Connecting facilities, Sectors and Programmes for Student Success. OECD Reviews of School Resources. Paris: OECD Publishing.
Schulz, W., Friedman, T., and Fraillon, J. (2023). ICCS 2022 technical report. IEA international civic and citizenship education study 2022. IEA International Association for the Evaluation of educational achievement. Available online at: https://www.iea.nl/sites/default/files/2024-07/ICCS%202022%20Technical%20Report.pdf
UNESCO (2018). Activating policy levers for education 2030: The untapped potential of governance, school leadership, and monitoring and evaluation policies. Paris: UNESCO.
UNESCO (2024). Global education monitoring report 2024/5: Leadership in education – Lead for learning. Paris: UNESCO.
Van Mol, C. (2017). Improving web survey efficiency: the impact of an extra reminder and reminder content on web survey response. Int. J. Soc. Res. Methodol. 20, 317–327. doi: 10.1080/13645579.2016.1185255
Volante, L., and Cherubini, L. (2010). Understanding the connections between large-scale assessment and school improvement planning. Can. J. Educ. Adm. Policy 115, 1–26.
Wise, S. L., Im, S., and Lee, J. (2021). The impact of disengaged test taking on a state’s accountability test results. Educ. Assess. 26, 163–174. doi: 10.1080/10627197.2021.1956897
Wise, S. L., and Kong, X. (2005). Response time effort: a new measure of examinee motivation in computer-based tests. Appl. Meas. Educ. 18, 163–183. doi: 10.1207/s15324818ame1802_2
Keywords: low-stakes tests, response rate, large-scale assessment, IEA surveys, participation strategies
Citation: Palmerio L and Caponera E (2025) Response rates in low-stakes testing: insights from the Italian experience in large-scale assessments. Front. Educ. 10:1623997. doi: 10.3389/feduc.2025.1623997
Edited by:
Surette Staden, University of Innsbruck, AustriaReviewed by:
Alejandro Vásquez-Echeverría, Universidad de la República, UruguayCopyright © 2025 Palmerio and Caponera. This is an open-access article distributed under the terms of the Creative Commons Attribution License (CC BY). The use, distribution or reproduction in other forums is permitted, provided the original author(s) and the copyright owner(s) are credited and that the original publication in this journal is cited, in accordance with accepted academic practice. No use, distribution or reproduction is permitted which does not comply with these terms.
*Correspondence: Laura Palmerio, bGF1cmEucGFsbWVyaW9AaW52YWxzaS5pdA==