 Sinem Bas-Ader
 Mahmut Kertil
 Marilyn P. Carlson3
- 1Department of Mathematics and Science Education, Faculty of Education, Istanbul Aydın University, Istanbul, Türkiye
- 2Department of Mathematics and Science Education, Ataturk Faculty of Education, Marmara University, Istanbul, Türkiye
- 3School of Mathematical and Statistical Sciences, Arizona State University, Tempe, AZ, United States
Graduate teaching assistants (GTAs) play a critical role in undergraduate mathematics education, yet their advanced mathematical knowledge does not always translate into effective, student-centered instruction. This case study, situated within the Pathways Precalculus Curriculum and Professional Development (PPCPD) project, explores shifts in a GTA’s instructional practices across two consecutive semesters of teaching with Pathways materials at a large U.S. University. The study focuses on changes in the GTA’s use of quantitative and covariational reasoning, his efforts to engage students in these reasoning skills, and his evolving approach to teaching constant rate of change (CROC). Data sources included video-recorded lessons and two semi-structured interviews. Findings show the GTA became increasingly effective, spontaneous, and fluent in supporting students in constructing meaningful function formulas and graphs. We discuss how specific features of the PPCPD intervention may have contributed to these shifts. Implications for avenues for future research are offered.
1 Introduction
Mathematics graduate teaching assistants (GTAs) as future faculty play a critical role in undergraduate mathematics education (Ellis et al., 2016; Speer et al., 2005). However, studies have revealed that GTAs’ advanced degree in mathematics or having completed many mathematics courses do not ensure their enactment of a high-quality instruction (e.g., Bas-Ader and Carlson, 2022; Carlson et al., 2022b; Musgrave and Carlson, 2017). They lack knowledge of teaching and hold novice beliefs about effective teaching practices (Ellis et al., 2016). Moreover, despite efforts to support GTAs in focusing their instruction on student thinking, they are slow to adopt student-centered instructional strategies (Bas-Ader and Carlson, 2022).
A national survey of mathematics departments’ instruction reported that a well-structured professional development (PD) program for GTAs is a distinguishing feature of departments that demonstrate success in calculus instruction with regard to student retention and progression (Ellis, 2015; Ellis et al., 2016). This collection of findings indicates a need for GTA professional development that supports graduate student instructors’ adoption of practices that engage their students’ mathematical thinking.
One research project that is investigating approaches for supporting GTAs in focusing their instruction on advancing students’ mathematical thinking is the Pathways Precalculus Curriculum and Professional Development (PPCPD) project (Carlson et al., 2024b). The overarching goal of this longitudinal project is to foster university precalculus students’ deep engagement with foundational mathematical ideas that are critical for success in calculus. In the context of this innovation, a research-based conceptually oriented curriculum, Pathways Precalculus, was developed, revised and refined over the course of 15 years (Carlson et al., 2022a). With the aim of supporting precalculus instructors’ effective utilization of the pathways materials—that is, supporting their using the materials in a way that aligns with PPCPD’s research-based learning goals, the project leader (the third author) and her team provide yearly two- or three-day professional development workshops for new Pathways instructors. A local Pathways faculty1 member leads ongoing weekly seminars for new and continuing Pathways instructors throughout the academic year (Carlson et al., 2024b). The seminars engage the GTAs in discussing the learning goals and conceptual scaffolding for the in-class investigations they will use with their students during the upcoming week.
This case study was conducted in the context of the aforementioned PPCPD innovation. Our purpose was to investigate shifts in a GTA’s instructional practices from his first time teaching with the materials in the fall semester to his second time teaching with the materials in the spring semester at a university where the PPCPD innovation was implemented. This study was guided by the following research questions:
1. What are the shifts in a graduate teaching assistant’s use of quantitative and covariational reasoning and efforts to support their students’ engagement in quantitative and covariational reasoning?
2. What are the shifts in a graduate teaching assistant’s way of thinking about teaching the idea of constant rate of change (CROC) in the context of using research-based and conceptually oriented instructional materials and participating in ongoing weekly PD seminars?
This study extends and deepens existing research on undergraduate mathematics education, GTAs’ instructional practices in particular, through several novel contributions. We first emphasize our contributions to undergraduate mathematics teaching, especially considering the limited research in this area (Speer et al., 2010). Secondly, we investigate shifts in a GTA’s instructional practices in the context of a specifically designed research-based curriculum and PD program in the PPCPD innovation. Hence, this study will contribute to the growing body of research on the professional development of GTAs designed to enhance their instructional practices. In this study, we narrowed our focus to the teaching of the idea of CROC, one of the most important mathematical ideas in Precalculus. We also present a conceptual analysis of CROC to provide the reader with detailed insights into the meaning of the idea from our perspective. Narrowing our focus enabled us to investigate a GTA’s instructional practices related to a specific idea more deeply, which is another novel aspect of this study.
2 Professional development of graduate teaching assistants
GTAs play a central role in undergraduate education (Ellis et al., 2016; Musgrave and Carlson, 2017; Speer et al., 2005). However, many GTAs begin their teaching careers with minimal formal preparation (Ellis et al., 2016; Speer et al., 2005). Recent research emphasizes the critical importance of structured PD programs to enhance GTA teaching effectiveness (e.g., Carlson et al., 2024b; Ellis, 2015; Ellis et al., 2016). Hence, there is a growing body of research on professional preparation and development of GTAs (e.g., Carlson et al., 2024b; Ellis et al., 2016; Harris et al., 2009; Speer et al., 2005).
Harris et al. (2009) examined a range of professional development initiatives for graduate teaching assistants (GTAs) across U.S. universities, noting shared emphases on departmental culture, peer mentoring, and minimal disruption to disciplinary study. Building on these models, they introduced a mathematics-specific course that engaged GTAs in videotaped microteaching, case-based discussions, and collaborative reflection. They reported that the program helped GTAs develop greater instructional confidence, pedagogical awareness, and the capacity to promote more meaningful classroom communication. Ellis et al. (2016) offered a broader institutional perspective by analyzing national trends in PDs designed and implemented for GTAs across mathematics departments in the United States. The study emphasized the need for institutional change strategies that align with departmental culture and long-term instructional goals. These initiatives adopt a dual approach: understanding department-level change and fostering shared vision and reflective teaching practices among GTAs.
Over the past 15 years Carlson and her colleagues developed a research-based curriculum and professional development innovation designed to support mathematics instructors, including GTAs, lecturers, and secondary teachers in rethinking what is entailed in understanding, learning and teaching precalculus ideas (e.g., rate of change, function, exponential growth, trigonometric functions). The research and design project is known as the Pathways Precalculus Curriculum and Professional Development (PPCPD) project (Carlson et al., 2024b). The Pathways materials and aligned professional development represent a comprehensive educational innovation that integrates a theoretically grounded and empirically informed curriculum, Pathways Precalculus Curriculum (Carlson et al., 2022a) with a research-based professional development model targeting advances in the instructors’ understanding of the course’s ideas and how they are learned.
The curriculum design was informed by qualitative studies in which the authors investigated student learning of precalculus ideas (e.g., Carlson, 1998; Carlson et al., 2002). This was followed by their conducting teaching experiments (Steffe and Thompson, 2000b) in which students were video recorded as they completed cognitively scaffolded lessons designed to support students’ development of coherent meanings that reach beyond the learning goals of most curriculum (e.g., Bowling, 2014; O’Bryan, 2018; Strom, 2008). It consisted of a set of materials for student use, including an online textbook with embedded, conceptually focused videos and interactive applets. The materials include cognitively scaffolded in-class investigations that engage students in quantitative and covariational reasoning as cross-cutting ways of thinking, for understanding and representing specific function types using formulas and graphs.
PPCPD also includes teacher resources and professional development for Pathways instructors preparing to use the materials with their students. Teacher versions of each investigation describe the understandings that are targeted in the investigation, including productive reasoning that supports students’ solutions. They also include (i) written learning goals for each investigation, (ii) conceptually focused solutions that explain the thinking associated with solution steps, and (iii) conceptually focused questions scaffolded to support students in constructing strong meanings for the ideas central to a lesson. Powerpoint slides with the investigation questions include model explanations designed to support instructors’ development of fluency in providing conceptually focused explanations and solutions.
The companion Pathways professional development supported instructors in preparing to teach with the Pathways curriculum (Carlson et al., 2024b; Musgrave and Carlson, 2017). An intensive workshop prior to their teaching and 90 min weekly professional development seminars focused on advancing Pathways instructors’ understanding of Pathways learning goals. The Pathways professional development leader engaged the instructors in discussing and explaining their solutions with other Pathways Precalculus instructors, with discussions also addressing anticipated ways of thinking relative to specific problems. As an example, the curriculum has an over-arching focus on developing and advancing students’ quantitative and covariational reasoning as a foundation for developing algebraic and graphic function models that are meaningful to the student, regardless of the function type being studied. The seminar leader also consistently supported Pathways instructors in enacting the Pathways conventions for quantitative reasoning (e.g., Carlson et al., 2022b) when developing and interpreting algebraic and graphic function models. In particular, they too were expected to: (i) identify the quantities in a problem context; (ii) construct a quantitative drawing to represent how the quantities in the problem context are related and vary together; (iii) be explicit in defining their variables by describing the measurement being represented, the starting point and direction of the measurement, and units used for measuring; (iv) always reference the quantities being represented when constructing and referencing terms and expressions; (v) explain the quantitative relationships depicted in a function graph as the graph is being constructed.2 Other activities included sharing instructional strategies, analyzing student reasoning, and in some cases, recording and reflecting on their own teaching (Carlson et al., 2024b; Musgrave and Carlson, 2017).
Studies of teachers using the Pathways materials (e.g., O’Bryan, 2018; Rocha, 2023; Tallman, 2015) suggest that effective PD training for GTAs must go beyond basic orientation and include ongoing training that is interactive, reflective, and discipline specific. Programs that integrate pedagogical theory with practical application, promote peer learning, and align with departmental goals are most successful in fostering meaningful instructional development. The PPCPD project provides a model for supporting instructors in transitioning to use research-based curriculum. As a last point of emphasis, Carlson et al. (2024b) report that new instructors’ participation in the workshop and weekly professional development was essential for their development of confidence and competence in using the Pathways materials with their students. It was in the context of their using the Pathways cognitively scaffolded tasks, instructional resources, and weekly seminars that GTAs in this program improved their ability to support students’ concept development and quantitative reasoning.
2.1 A framework for the development of a teacher’s way of thinking about teaching an idea
Carlson et al. (2024a) conceptualized an idea of a way of thinking about teaching an idea. This scheme for teaching necessarily includes ways of thinking about students’ ways of learning an idea. In particular, they characterize a way of thinking about teaching an idea as an image of teaching that consists of: (i) the teacher’s first-order model, i.e., the teacher’s meanings and ways of thinking about the idea, (ii) the teacher’s second-order model of students’ thinking about and learning that idea—if the teacher has engaged in decentering relative to students’ thinking about that idea, and (iii) images of students’ generalized ways of thinking about learning that idea (i.e., epistemic students).
They introduced a theoretical model that describes the mechanism for the development of a way of thinking about teaching an idea (see Figure 1). In particular, the model portrays the symbiotic relationship between the teacher’s first-order models, second-order models, images of epistemic students, and decentering (decentering both in the moment and in retrospect). In what follows, we first briefly define these constructs and then we describe the symbiotic relationship between them according to the model.
First-order models refer to “the hypothetical models the observed subject constructs to order, comprehend, and control his or her experience (i.e., the subject’s knowledge)” (Steffe et al., 1983, p. xvi). In the context of mathematics, these models reflect how a person conceptualizes and reasons about mathematical ideas or problems (Carlson et al., 2024a). When a teacher designs a lesson based on her own understanding of a mathematical concept, for example, she is relying on her first-order model to inform the structure and content of the lesson (Bas-Ader and Carlson, 2022).
However, effective teaching also requires teachers to engage with students’ thinking beyond their own perspective. When a teacher actively seeks to understand a student’s reasoning and uses that understanding to guide her instructional decisions—a process referred to as decentering—she is engaging in reflective practice. The result of this reflection is a second-order model, which represents the teacher’s conceptualization of the student’s thinking. Second-order models are defined as “the hypothetical models observers may construct of the subject’s knowledge in order to explain their observations (i.e., their experience) of the subject’s states and activities” (Steffe et al., 1983, p. xvi). These models can then be used to inform future instructional actions, allowing the teacher to respond more effectively to students’ learning needs (Bas-Ader and Carlson, 2022; Carlson et al., 2024a).
Thompson (2002, 2008) introduced the notion of an epistemic person as a way of thinking about a particular idea. Epistemic students can be understood as generalized models of students’ mathematical thinking. For example, a teacher’s images of students’ generalized ways of thinking (i.e., epistemic students) relative to an idea emerge from their one-on-one interactions with individual students (Carlson et al., 2024a).
The notion of adopting another’s perspective was first introduced by Piaget (1955), who referred to this cognitive process as decentering. Steffe and Thompson (2000a) and Thompson (2000, 2013) extended this notion to characterize communication in terms of the degree to which individuals express “thoughts that are directed at another” (Thompson, 2013, p. 63). However, Carlson et al. (2024a) proposed a nuanced distinction concerning the construct of decentering. They asserted that a teacher is decentering as they “separate one’s own understanding from the hypothetical understanding of the learner,” thereby emphasizing a form of decentering that can occur outside of direct teacher–student interaction (p. 298). This perspective differs from decentering as characterized by Thompson (2000, 2013), which involves the teacher constructing a second-order model of a student’s thinking during direct interaction. In Carlson and her colleagues’ broader view, decentering can occur throughout all phases of instruction, including planning, enacting, and reflecting on teaching. During lesson planning, for example, teachers may decenter by anticipating students’ thinking. In reflecting on the outcomes of instruction, teachers can decenter by considering how students might have experienced and made sense of the lesson (retrospective decentering).
According to the framework presented in Figure 1, a teacher’s first-order model of a mathematical idea (i.e., the teacher’s mathematical meaning for an idea) impacts the nature of the teacher’s decentering actions and their teaching practices, in general. Firstly, their first-order model influences what they notice and how they respond to what they notice when interacting directly with students in the moment of teaching (i.e., decentering in the moment). In addition, the teacher’s first-order model influences their decentering actions that occur when the teacher reflects on the results of specific classroom interactions (i.e., decentering in retrospect). Decentering actions both in the moment of teaching and when reflecting on their interactions with students, support the construction of second-order models of students’ thinking about and learning that idea. These second-order models can also impact the teacher’s first order model of the mathematical idea.

Figure 1. A framework for the development of ways of thinking about teaching an idea (Carlson et al., 2024a, p. 316).
As the teacher engages in decentering and model-building processes and reflects on the acts of decentering, their second-order models become more stable. These second-order models can also lead to the development and refinement of images of students’ generalized ways of thinking relative to the idea (i.e., epistemic students). The images of epistemic students become incorporated into the teacher’s first-order model such that the first-order model then contains multiple ways of thinking about the idea.
The teacher’s images of the various ways that students think about an idea, and their conceptions of how to support students in learning an idea, advance while teaching with the research-based materials and attending the aligned professional development. These shifts impact the teacher’s instructional choices, including the curriculum tasks and sequencing, and how the teacher responds to students’ questions.
The teacher’s way of thinking about teaching an idea is continually updated as the teacher repeatedly teaches an idea and reflects on the impact of their instructional actions on a student’s thinking. Lastly, it is worth noting that the constructs and processes in the framework are interdependent and cyclical. Thus, there is no single entry-point to thinking about the symbiotic interaction between them.
3 Conceptual analysis of the idea of constant rate of change (CROC)
Two quantities are related by a constant rate of change if the ratio of corresponding changes in the values of the two quantities remains constant as the values of the two quantities vary together (Byerley and Thompson, 2017; Tallman et al., 2024). We can express this algebraically by considering variables x and y that represent the corresponding values of Quantity A and Quantity B. The multiplicative comparison of the corresponding changes in their values is expressed as , representing the relative size of in terms of (Lock, 2023). We say that Quantity A is varying at a constant rate of change with Quantity B if the ratio of the corresponding changes in y and x, , remains constant as the values of x and y vary together. We can express this relationship as, . It then follows that , which means that for any amount of change away from an x-value in the relationship, the change away from the corresponding value of y in the relationship will be m times as large as the change away from x. Stated another way, we can say that Quantity A and Quantity B are varying together at a constant rate of change if the corresponding changes in their values is proportional (Tallman et al., 2024; Thompson and Carlson, 2017). As an example, if a runner is moving at a constant rate of change of 11 meters per 2 s, then the runner will travel 33 meters in 6 s since 33 is 3 times as large as 11, the amount of time to run 33 meters must be 3 times as large 2 s or 6 s. As another illustration of this proportional relationship, the runner will travel 11/4 meters in ½ of second since ½ of a second is ¼ times as large as 2 s, they will travel ¼ times as far as 11 meters or 11/4 meters.
As another example, consider a rectangular shaped container being filled with water. Here, the volume of the water and the height of the water level change together at a CROC. Suppose (For a mature conception of the CROC as an intensive quantity, the unit has a special importance). This quantitative relationship between the change in the volume of water and the change in the water’s height in the container ( ) indicates that for any change in the water’s height, the volume of water in the container changes by 5 times as much. If the height rises by 0.1 cm, for instance, the volume increases by 0.5 liters ( ). As this example illustrates, conceptualizing CROC requires quantitatively coordinating the changes in two quantities, expressed as (i.e., the changes in the two quantities are related by a constant multiple).
A productive meaning for CROC also entails conceptualizing continuous and smooth covariation between the two quantities (Tallman et al., 2024; Thompson and Carlson, 2017). From this perspective, students recognize that any change in height results in a change in volume that is 5 times as large, without needing to fix the height change at a constant or unit increment. This reasoning allows students to extend the concept to infinitesimally small changes, understanding that even the tiniest change in height produces a proportional change in volume.
Conceiving of constant rate of change graphically involves seeing that, if they know one pair of values in the relationship (on the line in a rectangular coordinate system), they can determine any new pair in the relationship, if the croc m is known and an amount of change away from x1, call it , then the corresponding value of the change in y, .
3.1 Unproductive ways of thinking about CROC
An individual’s meaning for the idea of CROC might consist of the calculation for the slope of a line, , with no regard for the fact that the calculation represents how much the value of y changes, as the value of x increases from to . The individual may not view the statement as a means of representing a restriction on how two quantities’ values change together—that is, the values of two quantities are changing together in such a way that the ratio of the change in one quantity and corresponding change in the other quantity remains constant, when considering the changes between the corresponding values of any two quantities in the relationship.
Another unproductive way of reasoning involves chunking the changes in two quantities without recognizing smooth covariation or proportionality (Thompson, 2013). In this approach, an individual may think in terms of discrete increments, such as associating a 1 cm increase in height with a 5-liter increase in volume or a 3 cm increase with a 15-liter increase. While this reasoning does coordinate changes in both quantities, it does not require a conception of the continuous and proportional nature of the relationship. Individuals with this perspective often default to keeping the independent variable’s changes at fixed or unit increments and observing the corresponding change in the dependent variable.
4 Method
4.1 The research setting
This study was conducted as part of the third author’s Pathways Precalculus Curriculum and Professional Development (PPCPD) project. The Pathways instructors (i.e., GTAs) all used the project’s conceptually focused Precalculus: Pathways to Calculus student curriculum (Carlson et al., 2022a). Prior to using the Pathways materials GTAs attend a 2–3 day workshop led by Pathways authors or professional development leaders. GTAs also attend a weekly 90-min professional development (PD) seminar during each semester they teach with the materials. This weekly seminar was led by a departmental faculty member who values Pathways learning goals and has taught with the Pathways materials at least two times. The leader engaged the team of 9 Pathways GTAs in discussing the reasoning they used to respond to select tasks from the investigations they would be using during class in the upcoming week.3 The seminar leader also posed questions they conjectured would support the GTAs in advancing their understanding of precalculus ideas and how they are learned. If time permitted the seminar leader discussed and invited more experienced Pathways GTAs to share strategies for supporting students’ learning of ideas central to the upcoming lessons.
4.2 Participant of the study
The participant of this study was a 24-year old mathematics graduate teaching assistant (GTA) in his second year of a PhD program in mathematics. Daniel is a white male who volunteered to teach precalculus using the Pathways Precalculus Curriculum at a large public university in the United States. He taught the course for three semesters during our data collection process. He had no teaching experience prior to becoming a graduate student. His mathematics coursework (during the time when the data were collected) was not related to the ideas that are the focus of the Pathways Precalculus curriculum. He attended a 2–3 day workshop and weekly 90-min PD seminars during each semester he taught.
Daniel was purposefully selected as the participant of this study. We wanted our subject to be a PhD student in Mathematics since our prior research revealed that GTAs’ pursuing a PhD in mathematics did not always express strong meanings for fundamental ideas (Musgrave and Carlson, 2017); nor were they experienced in engaging their students’ thinking (Bas-Ader and Carlson, 2022). Lastly, data from Daniel’s classroom teaching in a prior study (Bas-Ader and Carlson, 2022) had revealed shifts in his teaching over multiple semesters of teaching with the Pathways materials. This piqued our interest in investigating these shifts more broadly.
4.3 Data collection
The main data sources for this study are Daniel’s lessons when teaching the idea of CROC, and two 90-min semi structured interviews. The video-lessons were recorded in the second and third weeks of successive semesters in the 2016–2017 academic year. Two lessons were video-recorded during the fall semester and three lessons were video-recorded during the spring semester; all when Daniel was teaching the idea of CROC (e.g., representing CROC algebraically and graphically and solving related tasks). These particular lessons were chosen because they most directly addressed the research questions, enabling an investigation of shifts in Daniel’s teaching of CROC and related concepts (quantity and variable) over time. The dataset is comprehensive in that all lessons devoted to CROC were video-recorded, with no relevant sessions excluded. Although the study could have been strengthened by drawing on additional data sources, including students’ work, we deliberately narrowed our focus to data on Daniel’s teaching to gain a deeper understanding of shifts in his instructional conceptions and practices.
The interviews were conducted at the end of the 2017–2018 fall semester. During the first interview Daniel was prompted to provide verbal and written responses to several questions designed to reveal his mathematical meaning (i.e., first-order model) for the idea of CROC. The purpose of the second interview was to gain insights into the thinking that influenced Daniel’s instructional choices, with some questions targeting explanations for actions (e.g., what do you think about your way of using arrows for explaining covariation?) that we had identified as noteworthy during our video analysis. During the interview, Daniel was asked to watch specific video excerpts and review transcripts from his conversations with students that we conjectured would provide insights about both his learning goals and/or instructional choices related to teaching CROC and his perspective on what is entailed in understanding CROC. When watching a video, he was also encouraged to pause the video himself and share his thoughts about the teaching actions he had just viewed. The interviews were both audiotaped and video-recorded.
4.4 Data analysis
Prior to conducting data analysis, we developed a coding scheme for analyzing Daniel’s teaching video and interview data; this data included his comments about his current and prior ways of thinking about teaching the idea of CROC. The coding scheme consisted of two general dimensions and a total of 5 sub-themes related to Pathways learning goals for students.4 These research-based learning goals are the criteria we used to measure shifts in Daniel’s teaching. The project leader (the third author) and her research team (Carlson et al., 2022b) introduced instructional conventions that they had identified in prior research (e.g., Carlson et al., 2010, 2015; Clark et al., 2008; Moore and Carlson, 2012; O’Bryan, 2018; Strom, 2008) to be highly effective in supporting students in constructing coherent images of quantitative relationships and strong meanings for precalculus ideas. In this study, we adopted two of the Pathways conventions as constructs for coding our data. These are conventions for: (i) communicating effectively, referred to as—speaking with meaning and (ii) constructing function graphs from a student’s conceptualization of how two quantities vary together—this approach referred to as emergent shape thinking assures that the graph is meaningful to the one constructing it. Speaking with meaning refers to communication that is grounded in underlying concepts, where individuals describe quantities and their relationships using logical, coherent arguments that reflect a conceptual orientation (Clark et al., 2008). Emergent shape thinking, on the other hand, describes a specific way of reasoning about and constructing graphs that are deeply rooted in conceptualizing how two quantities’ values vary together (Carlson et al., 2022b; O’Bryan, 2018). It represents a shift from a superficial, static view of graphs to a dynamic, relational understanding. We also integrated our theoretical conception of productive meanings for CROC (presented in a previous section) into our coding scheme.5 We continually reviewed and refined this coding scheme through team discussions to ensure consistency and clarity. Our eventual coding scheme is presented in supplementary material.
The first step of our data analysis was to transcribe both the videos of Daniel’s teaching and the videos of the clinical interviews. We then independently coded one of the teaching videos and the first part of one of the interview videos. The two coders (the first and second authors) agreed on their assigned codes 85% of the time, with coding disagreements discussed and resolved until a consensus was reached. Following refinements to the coding scheme, data analysis proceeded through an iterative process involving both collaborative and individual open coding. After coding the data individually, the two coders met to discuss, refine, and consolidate the results of our coding (Strauss and Corbin, 1990). Following the coding process, we identified emerging themes aligned with our coding schemes.
5 Results
The thematic categorization of codes revealed shifts in Daniel’s teaching of CROC in three broad categories. We identified shifts in Daniel’s: (i) mathematical meaning for teaching ideas of quantity, variable, and constant rate of change; (ii) ability to support students’ engagement in quantitative and covariational reasoning in a CROC context; (iii) effectiveness in teaching the idea of constant rate of change. The results section was structured according to these themes, with the second and third sections including data that revealed shifts in Daniel’s ways of thinking about teaching ideas of quantity, variable and constant rate of change. We elaborated on these findings using illustrative excerpts drawn from both his classroom video recordings and interview data.
5.1 Shifts in Daniel’s mathematical meaning for teaching and teaching the ideas of quantity and variable
During his teaching in the Fall semester, Daniel made vague references to quantities and was not precise in defining variables. When defining variables, he failed to specify what is being measured, where/when the measurement begins, and the units used in the measurement even though the seminar leader and instructor resources had emphasized the importance of specifying these details. Over two semesters Daniel shifted from defining a variable with a one-word description (e.g., d = distance) to being precise in describing the quantity being measured, where the measurement begins, and the direction and units of the measurement (e.g., d = the distance (in feet) Bob has run north of the starting line since the beginning of the race).
He also began to remind his students to include these details when defining variables. The following excerpt from his teaching during the second (spring) semester illustrates his expectation that students refine their imprecise references to a quantity to include the starting point and units used for the measurement:
Excerpt 1:
Daniel: Ok so, what are the two important varying quantities that we are keeping track of in this situation?
Student: Distance and time?
Daniel: Yeah, those are… Technically what you just gave me are poorly defined variables. But I know what you mean. I want you to keep them in mind. We are keeping track of Jane’s distance in feet from her house and the time in seconds is going by since she starts to walk.
Daniel’s noticing the imprecision of the student’s variable definitions, and his subsequent reminder for the student to state the starting points and units for both variables, suggests that he saw value in requiring that his students be precise when defining variables.
Our data further revealed a shift in Daniel’s meaning for the ideas of quantity and variable. In particular, during the fall semester Daniel initially referred to a variable as the name for a quantity and only when consulting the teacher notes did he accurately state that the variable, x, referred to the quantity’s value. In one instance during class Daniel wrote the textbook’s definition of constant rate of change on the board, “There exists a constant rate of change between two varying quantities A and B if: (the change in the value of B) = (a constant) times (the change in the value of A).” His explanation (excerpt 2) of the definition suggests that he was conflating the name of a quantity with the quantity’s value:
Excerpt 2:
Daniel: This does not look like mathy, right? What if I gave a variable name to A and B, so like let us say, let x be the value of A and y be the value of B then a constant rate of change exists when…So in terms of x and y, what does this mean? How do you say this? [he is showing “the change in the value of B” on the board] So now, I’m changing B to y and A to x. Remember, how do we write down the change in variable, what symbol do we use?
Daniel’s statement, “What if I gave a variable name to A and B” suggests that he initially conceptualized the variable x as the name of the quantity A. After consulting the teacher notes, he then stated that x can be the value of quantity A and y can be the value of quantity B. However, immediately after reading the statement, he followed by saying, “so now I’m changing B to y and A to x,” suggesting again that his meaning for variable was that of a label or name of a quantity; and that a variable and a quantity’s name are interchangeable.
During his instruction in the spring semester Daniel more frequently described a variable as a representation of all possible values that a varying quantity can assume, and he rarely regressed back to using vague language when referencing or defining a variable. The following excerpt from the recording of his spring semester class further illustrates that he viewed a variable as a means of representing the value of a varying quantity. He began class by writing the following statement on the whiteboard: “two varying quantities are covarying if their values are changing together and there is some relationship between them.” He followed by providing a verbal elaboration of his written statement (excerpt 3):
Excerpt 3:
Daniel: Okay, so functionally what this means is that if we decide to represent the values of these quantities using variables like x and y, the fact that there is a relationship between them means that we can write a formula for one variable in terms of the other.
In this explanation, Daniel referred to variables x and y as representations of the values that two covarying quantities assume. He further noted that variables are useful for writing formulas that describe how two variables are related. He was also consistent in referencing a variable as a representation of the value that some quantity assumes, as illustrated in him saying, “let us say that the variable d represents the distance in miles from your house, right? Let us say the variable t represents the time in hours since you have been driving.” His consistency in being precise when referencing a quantity suggests a shift in his first-order model of the ideas of quantity and variable, and his valuing that his students were able to identify quantities precisely; and that they conceptualized variables as representing the values that a quantity assumes. His attention to these ideas when teaching suggests that his way of thinking about teaching ideas of quantity and variable included the goal that his students first conceptualize the two varying quantities to be related in a problem context, that variables need to be defined precisely, and that defining variables is useful for defining formulas.
When the interviewer probed Daniel’s meaning for CROC in the context of the fish tank problem (see Figure 2), he responded by providing a precise description of the two covarying quantities to be related. He responded by saying, “our relevant quantities in this situation are the number of gallons in the fish tank and the number of weeks since it was filled.”
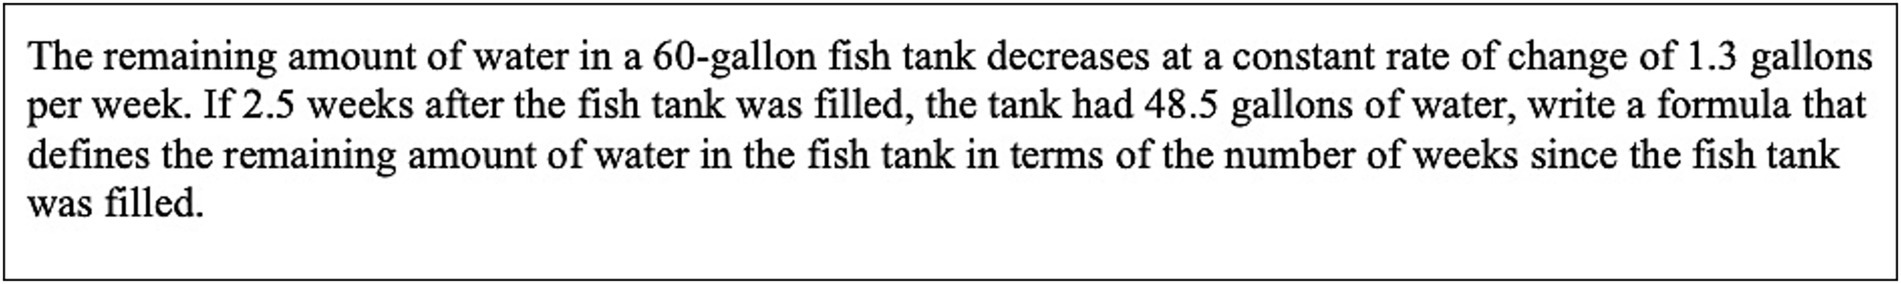
Figure 2. The fish tank problem.
He continued by elaborating his meaning for variable when he stated that, “a variable is a symbol that represents any possible value of a varying quantity. For example, if I said let ‘g,’ represent the number of gallons in the fish tank, that symbol ‘g,’ represents any number between 0 and 60, including 0 and 60.” This spontaneous elaboration of these ideas suggests that his way of thinking about teaching the ideas of quantity and variable had undergone a permanent shift.
5.2 Shifts in Daniel’s effectiveness in engaging students in covariational reasoning in a CROC situation
A shift in Daniel’s focus on covariational reasoning in his teaching of CROC is evident when comparing his instruction across the fall and spring semesters. In the fall semester, he frequently referred to the “(two) varying quantities” separately, without explicitly highlighting the interdependence of the changes in their values (i.e., how the two quantities varied together) while explaining the meaning of CROC.
For example, in the following excerpt from Daniel’s teaching in the Fall semester, the class was engaged with the candle burning task (see Figure 3).
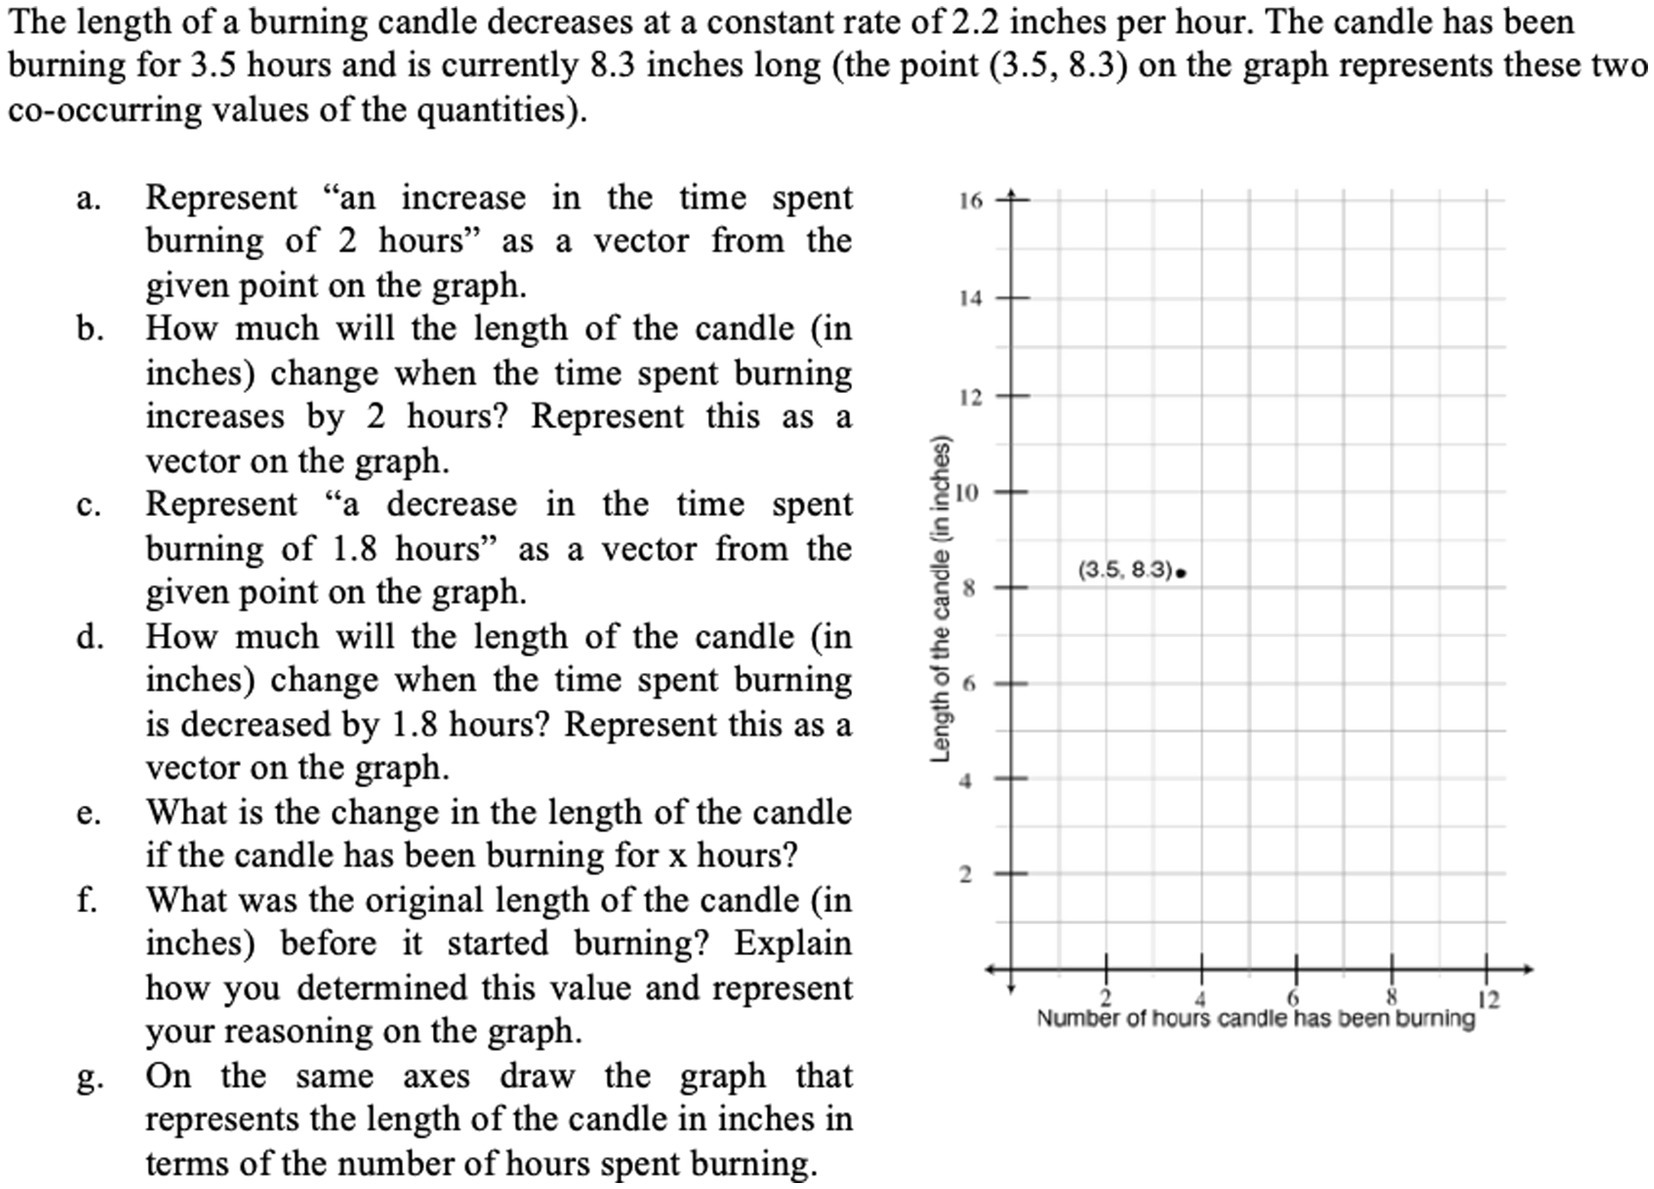
Figure 3. The candle burning question, which involves analyzing the change in the length of a candle over time, under the condition that the rate of change of the candle’s height with respect to time is constant (Carlson et al., 2022a).
The task prompts students to consider how the candle’s remaining height and the amount of time since the candle was lit vary together. The following excerpt illustrates Daniel’s explanation when responding to a request to, “represent ‘an increase in the time spent burning of 2 h’ as a vector from the given point on the graph.”
Excerpt 4:
Daniel: So in the first one they want us to represent an increase in the time spent burning two hours as a vector from the given point on the graph. So what that is really saying is that I know what this point [he is showing the point (3.5, 8.3) given on the graph]. We moved the time forward two hours, ignoring the height of the candle. So let us say the candle stopped burning and the time increased by two hours. What would happen to this point? Someone comes up with a drawing for me.
In this excerpt, Daniel deviated from the questions in the investigation by posing a hypothetical scenario and asking students to imagine that “the candle stopped burning.” He then inquired about a 2-h increase in time, with the candle not burning. Since t was defined to be the number of hours since the candle started burning, it did not make sense to ask students to imagine the candle not burning unless his intent was to point out that t would not increase when the candle wasn’t burning.
In contrast, during the spring semester, Daniel’s attempts to emphasize covariation of the quantities when teaching CROC were noteworthy. He explicitly referenced the variation in two quantities as they varied together in applied contexts and made reference to “covarying quantities” and “two quantities changing together” when considering the variation in the dependent quantity over intervals of the independent quantity’s domain. It is also noteworthy that he repeatedly attempted to engage his students in conceptualizing continuous and smooth covariation. An example of this instructional progress is presented in the section, “Shifts in Daniel’s conception and teaching of constant rate of change,” in excerpt 10 particularly.
5.2.1 Development of a way of thinking about teaching covariational reasoning in a CROC context
Analysis of data from follow-up interviews revealed shifts in Daniel’s way of thinking about teaching (or supporting) his students’ engagement in covariational reasoning. As one example, he proposed focusing on the idea of “corresponding change” as an approach to support his students in thinking about the two quantities’ values varying together continuously (excerpt 5). He further proposed to introduce function notation before teaching constant rate of change since function notation makes “the corresponding change” apparent:
Excerpt 5:
Daniel: “Corresponding change” is a detail that kind of confuses them a little bit and my thought actually next semester what I am gonna to do kind of deal with that is do function notation before doing CROC, because then, the corresponding change, it’s built into the notation pretty much. I am hoping that it will reduce that confusion.
His comment that he plans to teach function notation before introducing the idea of constant rate of change during the upcoming semester provides evidence that Daniel reflected on the results of his prior instruction (retrospective decentering). His plan to adapt his teaching of constant rate of change reveals a shift in his way of thinking about teaching constant rate of change. We also observe a shift in his awareness of the usefulness of covariational reasoning when representing constant rate of change relationships of two quantities varying together.
Excerpt 6:
Daniel: I do not like this notation with “deltas.” This notation is not good enough (he is pointing at ). Like, because we do constant rate of change before we do function notation and my issue with that is that we have no symbol for the corresponding change in the output. We write down, like…to me there should be no reason why these “x’s” and “y’s” should be related here (he is pointing at ) without first relating them by a formula, right? You know what I mean? In this context we interpret delta x as: the change in the input that corresponds to this (he is pointing at delta y) specific change in the output, right?
As the interview continued, he elaborated the shortcomings of using variables to define constant rate of change (excerpt 6). He then proceeded to represent a constant rate of change relationship using function notation (Figure 4), while explaining how much clearer it is to represent corresponding changes in the value of a function’s input quantity and its output quantity using function notation (excerpt 7):
Excerpt 7:
Daniel: For me, a better notation for, let us say we had a constant rate of change of , and let us say instead of a constant rate of change relationship, we have a function relationship that has a CROC of , by definition what that would mean is that [he is writing down ], so this is how we would write down an arbitrary change in input, and then your function notation gives you, “okay, what is the corresponding change in the output.” Okay, well, function notation gives you notation for that for free. It’s built like that; it’s this (he is writing down ). And at least to me, that is so much clearer that this is the change that specifically corresponds with the change in the input. Because you plug it in, right? This is imprecise (he is pointing at ) and this is better (he is pointing at ).
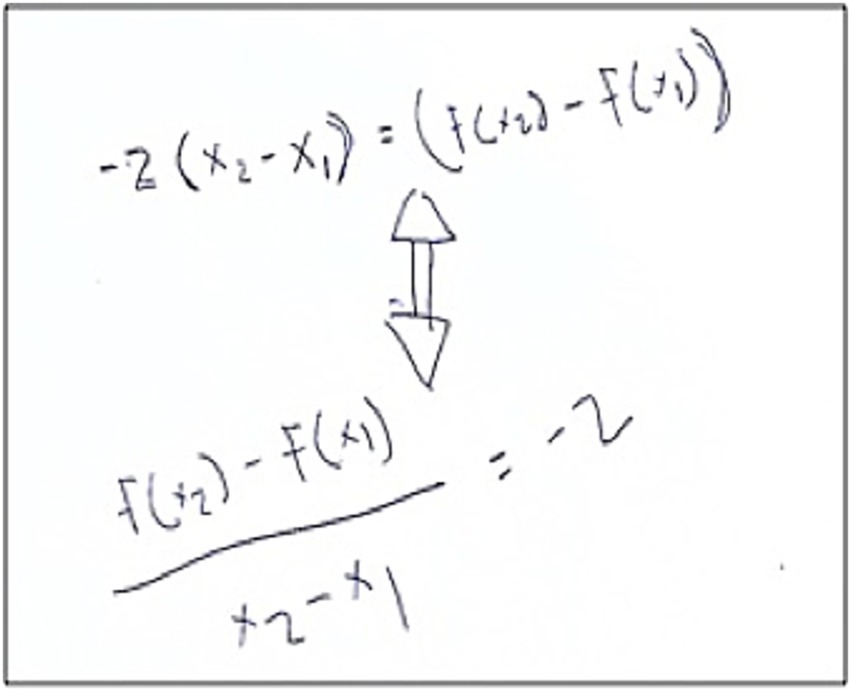
Figure 4. Daniel’s use of function notation to clearly represent the idea of CROC.
His proposed changes for his teaching and the Pathways curriculum support that Daniel had reflected on the confusion students exhibit when using variables to define constant rate of change (retrospective decentering). This reflection appears to have resulted in revisions to his way of thinking about teaching the idea of constant rate of change so that students are better supported in reasoning about the interdependence in the values of the input and output quantities as they vary together in a CROC context. He also appears to have made substantial advancements in his use of both quantitative and covariational reasoning as ways of reasoning that support students in constructing and representing constant functional relationships that are meaningful to the one constructing them.
5.3 Shifts in Daniel’s conception and teaching of constant rate of change
Our examination of Daniel’s teaching of constant rate of change during the fall and spring semesters revealed dramatic shifts in his explanations and questions, toward more conceptually focused and coherent explanations and questions focused on advancing his students’ thinking. His instruction in the fall included vague (and sometimes confusing) explanations and a focus on teaching procedures, such as calculating a rate of change using a formula. In contrast, his instruction in the spring semester focused on students’ understanding of the constant rate of change as representing a proportional relationship between the changes in two quantities’ values as their values vary together.
On the final day of Daniel’s fall semester instruction on the idea of constant rate of change, he wrote the definition on the board. He followed by saying that when this relationship exists you know you have a constant rate of change (excerpt 8). He also wrote the equivalent statement, , and asked students if they see why c is a constant rate of change. Without elaborating, he prompted students to explain the phrase “in terms of.” After asking this question, he told his students that the question was suggested by the curriculum notes, and he moved on when no student was able to answer. Since an answer and explanation were provided in the teacher notes, this suggests that he had not reviewed these before teaching. He followed by asking his class to explain what “the rate of change of y over the rate of change of x is 5” means? We notice that this statement is not meaningful and contains a common student error of referring to the rate of change of just one quantity. A specific student then responded with an incorrect answer by saying, “the statement means that the change in x is 5.” Even though this answer had no conceptual basis, he told the student that her answer was “close,” suggesting that he had no interest in understanding the student’s thinking. He followed by saying that 5 represented the change in y over the change in x, a correction from his prior incorrect statement that the CROC represents the “rate of change of y over the rate of change of x.” He further elaborated that the 5 meant that “every time I move x by 1, y moves by 5.” This explanation is not aligned with the Pathways learning goals; rather, his reference to “move” x and y suggests he was imagining how he might locate a new point on a linear graph when the constant rate of change of y with respect to x is 5. Furthermore, he only explored a change of 1 in x, suggesting he did not have a goal that students use the proportional relationship between the change in x and change in y to locate other values in the relationship; nor did he discuss the continuity in this relationship. It appears that Daniel did not consult the instructor materials or consider what is entailed in understanding constant rate of change prior to leading this lesson. This resulted in him conveying weak meanings to his students.
Excerpt 8:
Daniel: So, when this relationship (he is pointing at “ ” that was written on the board) exists between two variables, that is when you know you have a constant rate of change. What is another way that I could write this?
Student 1: Isn’t it, uh, delta y over delta x?
Daniel: Exactly. So, this is equivalent to saying (he is writing “ ” on the board). Does everyone see why the number c gives you your rate of change of y in terms of x. Now what do I mean, what do those words “in terms of” mean? What do I mean when I say that? Anyone? How about you, what does “in terms of” mean?
Student 2: Me?
Daniel: Yeah, you.
Student 2: Ok, umm.
Daniel: So if I say the rate of change in y in terms of x is 5, what does that mean? Going by what we just wrote up on the board. You know, c’mon, we just like broke it down piece by piece. I’m saying that the rate of change of y over the rate of change of x is 5. What does that mean?
Student 2: Umm, the change in x is 5?
Daniel: Close. So, since I’m putting this in a fraction, right, the change, if I’m saying the change in y divided by the change in x is 5 what that essentially means is that every time I move x by 1, y will move by 5, right? Because you can reduce, remember reducing fractions into least terms, right like you can always think of a fraction as like some number divided by 1 more or less and umm so every time I move x by 1, y will move by c. Does that make sense to you guys?
Excerpt 9:
Daniel: Okay, so let us talk about, kind of graphically, what we just did. So, in this situation we have a point (3, 5) okay? [He is drawing a coordinate plane on the board and plotting the point (3, 5) on it] And we are told that this point and another point (x, y) satisfy this relationship [he is pointing at “ ” that was written on the board]. So that means that, any other point that would satisfy this relationship along with (3, 5), that means if I go up…if I go over, sorry, by 1 in x [he is just moving his board marker right by one unit to track the change in x instead of drawing an horizontal vector], then y is going up by 2.4 [he is moving his marker up by three units to track the change in y and plotting the point (4, 7.4) on the coordinate plane]. Then if we calculate delta y over delta x here [he is pointing at the points (3, 5) and (4, 7.4)], you will see that it is 2.4. And then since we know that it has to be proportional, we know that all those points will satisfy that relationship [he is pointing at the graph on the board, in Figure 5].
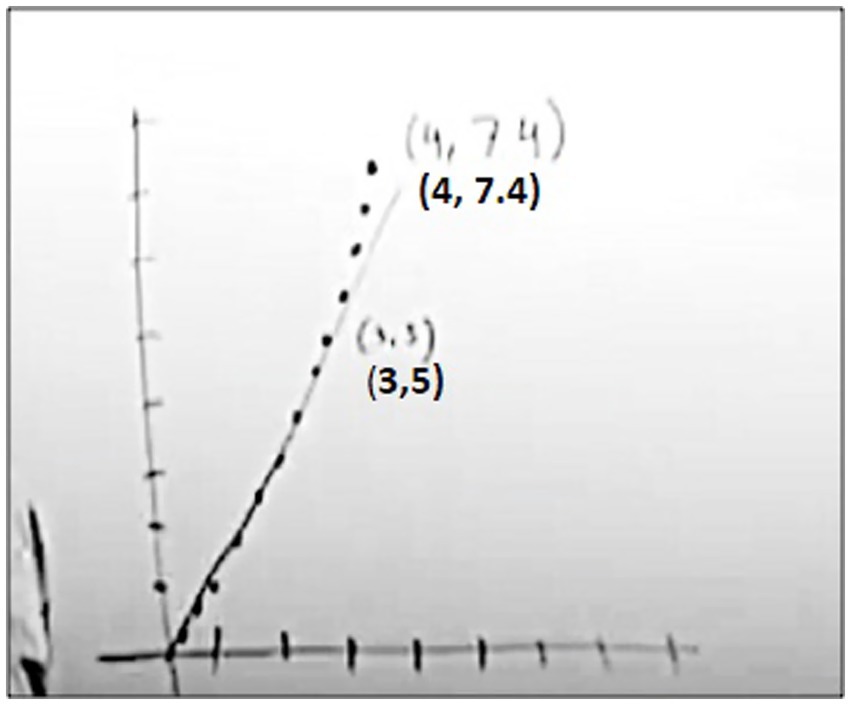
Figure 5. Daniel’s graphical representation of CROC during his instruction in the fall semester.
Daniel continued by attempting to explain how to represent a CROC relationship between two quantities in a graphical context (excerpt 9). He began by plotting the point (3, 5) on a coordinate plane and stated “this point and another point (x, y) satisfy this relationship.” This explanation did not convey the meaning of a point on a graph as representing the simultaneous values of two quantities. When illustrating how to use the CROC (i.e., 2.4) to determine another point on the graph [i.e., (4, 7.4)] he said, “if I go up…if I go over, sorry, by 1 in x, then y is going up by 2.4.” However, he did not emphasize the meaning of the formula “ ” and how he used this relationship (i.e., the chance in y is always 2.4 times as large as the change is x) to determine any other y value that corresponded to an arbitrary change in x from a known point on the graph.
In Figure 5, Daniel did not use horizontal and vertical vectors to represent the changes in the input and output variables on the coordinate plane (as a Pathways convention for meaningful graphing activity). Rather, he moved his board marker right by one unit to track the change in x and then moved it up by three units to track the change in y to plot another point that satisfies the relationship. He then provided a procedural explanation for using the two points to calculate and confirm the value of the CROC. He ended the discussion by mentioning that a proportional relationship exists, but his explanation did not say what two quantities were related proportionally; nor did he illustrate how to use this proportional relationship to determine other values in the relationship. In addition to not discussing the proportional relationship in the two quantities’ values he also failed to discuss what a point on the graph represents, thus limiting his ability to support students in understanding why a CROC relationship is represented by a graph of linear function, even though it was the main goal of the lesson.
In the Spring semester, Daniel demonstrated a more conceptual and coherent explanation of CROC (excerpt 10). When responding to the question involving distance with respect to time ( ), he referenced the two quantities related by a CROC and explained what a point on the graph represents in terms of illustrating the simultaneous values of two quantities. He also illustrated how to use the proportional relationship between the changes in the two quantities’ values to explain how to find new points in the relationship and illustrated why the graphical representation of CROC is a line.
Excerpt 10:
Daniel: We know that this [vertical] axis is supposed to be d, the distance in miles from your house, this [horizontal] axis is supposed to be t, the time in hours since you have been driving. And we know that at time zero, I am telling you that we know that we have started keeping track of the distance when we are at the house. So, we know that, at t equals zero d equals zero. In other words, if we graph d with respect to t on axes, (0, 0) should be on the graph. Okay, well, how might we figure out other points that should be on the graph? The only information we know is that the CROC is 50 miles per hour, which means that the change in d is always 50 times as large as the change in t. Okay, so if I change t by 1 h, my d should change by 50, right, because the change in t is 1 and I know that the change in d should be always 50 times as large as the change in t. This is equivalent to saying, okay, how far away am I from my house after one hour of driving. Okay, so I know that there is another point on the graph right here [he is plotting (1, 50) on the graph]. How about if I change t by 2 h, then I know that my change in d is equal to 50 times as large as my change in t, so if I change t by 2, then my change in d should be 100. So then I know that my change in d should be up here. But there is another way that I could have got this point, instead of looking at the change from 0; I could have looked at the change from 1. So, if I change t by 1 h, after an hour has passed, then d changes by 50. And that is equivalent to saying okay, 1 h after I started driving, I am 50 miles away, an hour later I am gone 50 more miles away. How many total miles away from my house, 100. So, I can just keep asking questions like this, if I change t by how much, how much is d changed by? By asking those kinds of questions I can get every point on this line [he is drawing the line on the graph, in Figure 6].
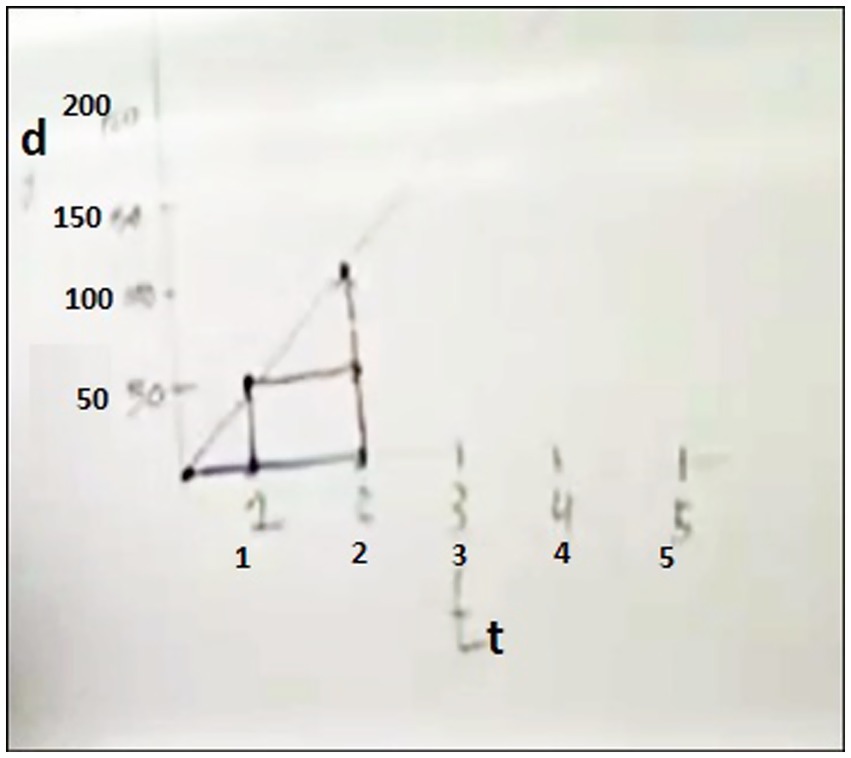
Figure 6. Daniel’s graphical representation of CROC during his instruction in the spring semester.
Daniel was careful to explain what a quantity’s measures were represented on each axis. He was also precise in defining variables by stating the measurement’s direction and where the measurement begins. He conveyed a productive meaning for CROC by saying “the change in d is always 50 times as large as the change in t” and supported students in engaging in proportional reasoning when determining the change in the dependent variable for specific integer changes in the independent variable away from a point in the relationship. It is also noteworthy that he illustrated the covariation of the two quantities’ values graphically by constructing corresponding changes using vectors.
After posing several questions to determine new points using the proportional relationship between the changes in the two quantities’ values (for any change in x, the change in y is 50 times as large), he stated, “So, I can just keep asking questions like this, if I change t by how much, how much is d changed by? By asking those kinds of questions I can get every point on this line.” This question reveals his conception of the continuous nature of the linear relationship and its proportional structure. Specifically, he prompted students’ understanding of how any variation in time corresponds to a predictable and proportionate variation in distance, instead of a focus solely on isolated intervals.
These examples reveal that Daniel’s conception of constant rate of change shifted dramatically from when he taught CROC in the fall semester to when he taught CROC using the same materials in the spring semester. His discussions and questions further reveal a shift in his teaching the idea of CROC. We explore the development of Daniel’s way of thinking about teaching the idea of CROC in the context of Daniel discussing the “candle burning” task during the clinical interview.
5.3.1 Development of a way of thinking about teaching the idea of CROC
In the previous section, we described some shifts in Daniel’s teaching of the idea of CROC from fall to spring semester. We focused on shifts in his quantitative reasoning and use of covariational reasoning to examine the concurrent variation in two quantities’ values in a CROC context. In this section, we present some evidence related to the development of his way of thinking about teaching the idea of CROC on the basis of his reflections on his previous teaching from the fall semester (i.e., his first attempt to teach the idea) while watching his teaching video in the follow-up interview.
In the following excerpt from Daniel’s teaching (excerpt 11), the students were engaged with the “candle burning” task. The candle burning task and a segment of his teaching episode were presented and discussed in a prior section (5.2), “Shifts in Daniel’s effectiveness in engaging students in covariational reasoning in a CROC situation.” In this section, we present several additional excerpts from him watching and reflecting on the video of him discussing the candle burning task with his students. Daniel’s discussion of his current thinking about teaching the idea of CROC provided evidence of advances in his way of thinking about teaching this idea.
Excerpt 11:
Daniel: Alright, we have this candle that’s burning, and we are told that it is burning at 2.2 inches per hour. We’re also given that the candle has been burning for 3.5 h and is currently 8.3 inches long. And they represent this by a point on the graph. So, what is special about this point? How many pieces of information does a point give us?”
The beginning of the video depicted him explaining the candle burning task (excerpt 11). He then prompted students to think about the given point (3.5, 8.3) by asking questions such as, “what is special about this point?” and “how many pieces of information does a point give us?” After a student responded to this question by saying “two,” Daniel asked students to express what the first and second number in the point represent. Even though these questions encourage students to think more deeply about points on a graph, they are insufficient in terms of emphasizing the covariation of the two quantities’ values and thus do not help students to conceptualize a point as representing the simultaneous values of two quantities (a multiplicative object) that are varying together. In the follow-up interview, Daniel explained that his motive for asking these questions was based on his awareness of students’ procedural approach to graphing:
Excerpt 12:
Daniel: I wanted to talk about graphs. This is something that still surprises me is how mechanical they [students] are with graphing things. They’ve played the “graph these points” game a lot, and not “what do those points mean” game, they have not played that one really at all. I did not do this here but now I think that it is important to talk about a lot more explicitly that if you draw a point you are relating a value of an input to a value of an output.
Daniel’s discussion about graphs (excerpt 12) suggests a shift in his way of thinking about teaching the meaning of a point on a graph. Daniel’s questions during his fall teaching suggest that he was aware of the importance of supporting students’ understanding of the meaning of a point on a graph. This awareness might have led to him being alert to students’ ways of thinking about this idea during instruction. His reflections on the results of his interactions with students (retrospective decentering) appear to have resulted in him constructing a generalized image of a student’s common way of thinking about graphing a point. These reflections in concert with gradual improvements in his own way of thinking about this idea (i.e., his first-order model) likely led to him adopting a new way of thinking about how to support students in conceptualizing points on a graph.
After discussing the meaning of the given point, Daniel asked a student to represent an increase in the time spent burning of 2 h as a vector from the given point on the graph, indicating a shift in his attention to developing students’ covariational reasoning. He then posed a hypothetical scenario, asking students to imagine that the candle stopped burning for 2 h, as presented earlier in Excerpt 4. After watching this part of the video, in the interview, Daniel’s first reaction was to criticize himself for this explanation by saying “I do not like my explanation here. I do not know why I am telling them to imagine the candle stopped burning.” This reaction illustrated that Daniel was perturbed about his teaching move and had trouble with making sense of it at first glance.
Then he continued with watching the video, in which a student came to the board and drew a horizontal arrow from the given point to represent an increase in the time spent burning of 2 h (Figure 7). After watching this, Daniel suddenly reacted “Ohh! I see, okay…I get the point I was trying to make here” and started to explain his way of thinking at that moment that led to his teaching move (excerpt 13):
Excerpt 13:
Daniel: So the reason I said, “imagine that the candle stopped burning and we increased the time by 2 h,” this was a dumb way to get students to draw this arrow [he is drawing the horizontal arrow in the graph in Figure 8] moving forward 2. Because if the candle stopped burning and we increased the time by 2 h, this point would just slide along like this [he is pointing at the horizontal arrow]. And then what I think I was going for was, “okay, now imagine if the candle did not stop burning and we still increased the time by 2 h,” we would still get this [horizontal] arrow but we would also… the point would also move down [he is drawing the vertical arrow in the graph in Figure 8.] So, I want them to be thinking, “okay, so it’s moving over and down at the same time.” So first just imagine the time changing and now imagine the time changing and the length changing at the same time. That would cause it [the point] to move diagonally down, right? Then you get a line like this [he is drawing the diagonal arrow in the graph in Figure 8.]
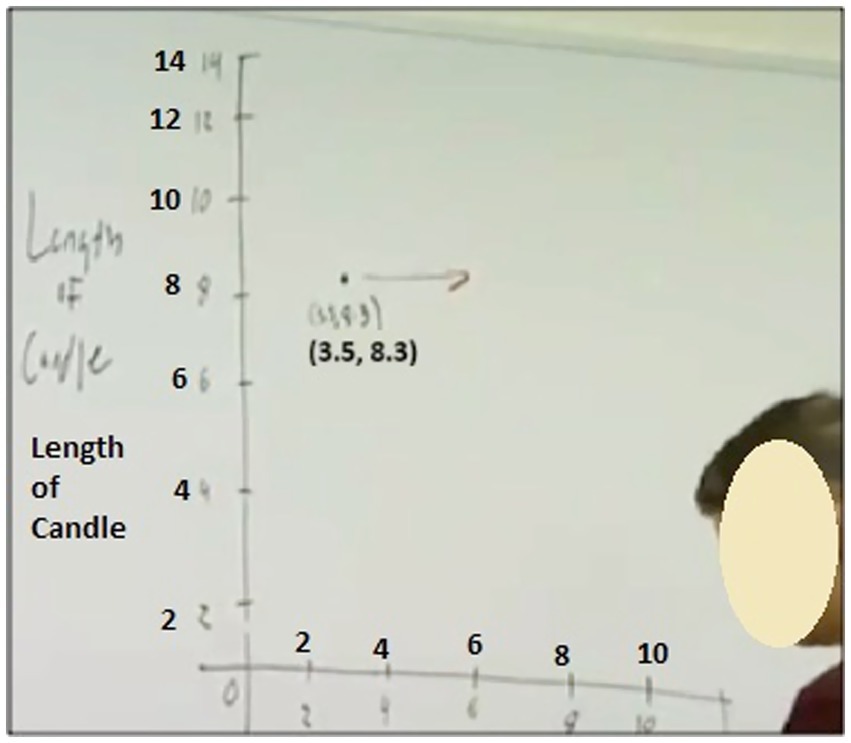
Figure 7. A student’s use of a horizontal arrow to represent a 2-h increase in time.
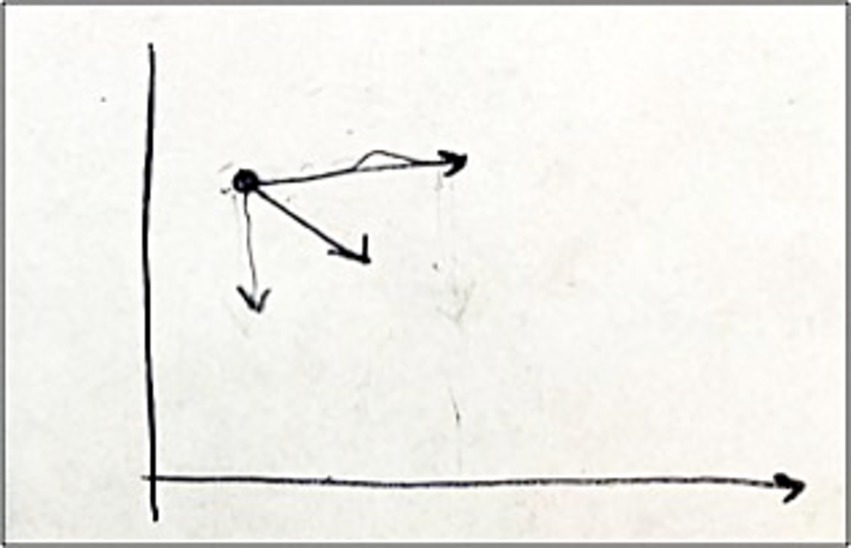
Figure 8. Daniel’s diagonal arrow showing simultaneous changes in time and length.
Daniel’s teaching in the spring semester and his reflections on the rationale for his instructional moves while watching the video revealed that his way of thinking about teaching students to engage in covariational reasoning had shifted dramatically since the fall semester. His explanations revealed novel thinking about instructional strategies for supporting students in conceptualizing and representing the simultaneous and continuous change in two quantities’ values. In particular, his explanation that his rationale for asking a student to draw the vectors was to support students in visualizing the candle’s burning time and remaining length changing continuously and simultaneously, was remarkable. It demonstrates him reflecting about instructional moves for advancing his students’ thinking and him effectively implementing an instructional strategy for supporting students in viewing graphing as constructing an emergent trace of two quantities’ values varying together.
His explanations show that Daniel was able to engage in emergent shape thinking when representing the smooth and continuous covariation in a CROC situation on a graph. However, his first attempt to support his students’ engagement in emergent shape thinking when teaching did not go smoothly. It is likely that viewing the video of his teaching and reflecting on the rationale for his instructional moves led to him refining his thinking about teaching emergent shape thinking in the context of teaching the idea of CROC.
In the teaching video, Daniel continued by explaining the second question in the task, “how much will the length of the candle (in inches) change when the time spent burning increases by 2 h?” First, he attempted to use a similar scenario to explain the question: “Okay, now let us imagine that time is paused and the candle is suddenly…[a short pause] actually yeah…let us represent the decrease…sorry…how much will the length of the candle change in that 2.2…sorry…2-h period?” This excerpt illustrates him abandoning his scenario and reverting back to the question statement in the book. It appears that he decided at that moment that imagining “time is paused” while the candle has been burning would not be a productive way of thinking in the given situation. Moreover, his momentary hesitation related to his way of thinking impacted his explanation. After watching this part of the video, Daniel reacted by saying, “so this is me tripping over my own language there.”
In response to the second question in the task, “How much will the length of the candle (in inches) change when the time spent burning increases by 2 h? Represent this as a vector on the graph,” another student came to the board and drew a vertical arrow beginning from the end of the horizontal arrow to represent the decrease in the length of the candle when the time spent burning increases by 2 h (Figure 9). Daniel then directed the student to draw the arrow beginning from the given point instead of beginning from the end of the horizontal arrow. Thus, the student changed his drawing in a way that is seen in Figure 10. After watching this part of the video, in the interview (excerpt 14), he said:
Excerpt 14:
Daniel: I’m just frustrated with myself. He drew exactly the right thing and I’m going to tell him to change it. I do not like that I had him make that change. He has good imagery, and I’m screwing it up for him, which is why I’m frustrated. I have reasoning for it, but I do not agree with my own reasoning anymore.
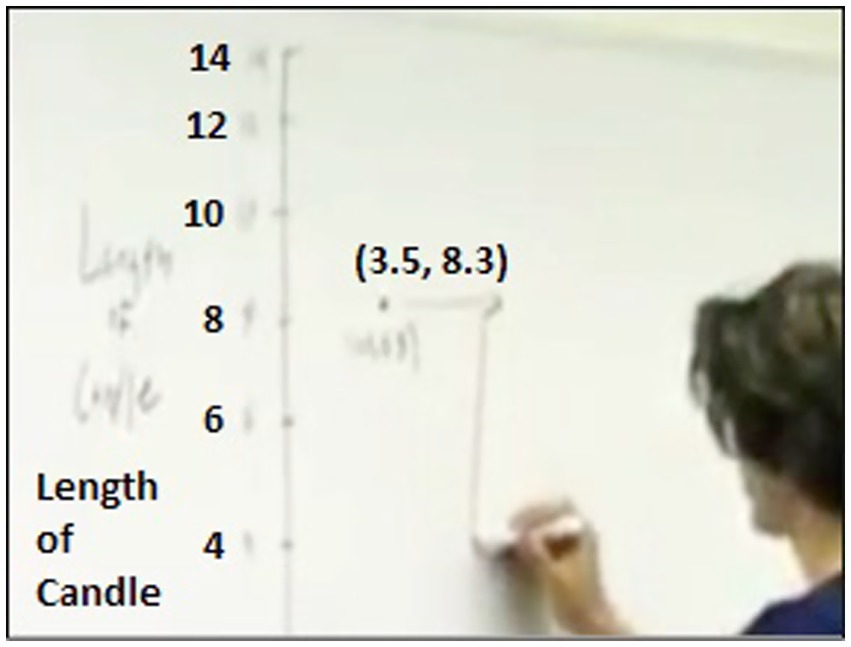
Figure 9. A student’s vertical arrow showing the decrease in length.
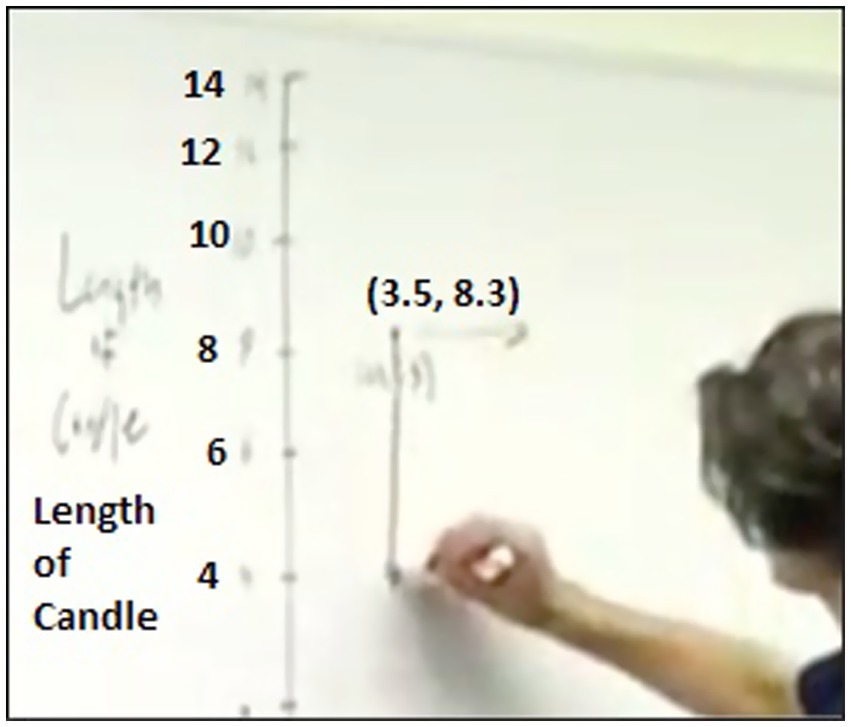
Figure 10. The student’s revised arrow placement following Daniel’s instruction.
Daniel was critical of his instructional move to direct the student to draw the (vertical) arrow beginning from the given point to represent the change in the length of the candle. His way of thinking about the graphical representation of covariation (i.e., first-order model) at that moment likely influenced his instructional decision. Moreover, he did not try to understand the student’s way of thinking and he guided the student toward his way of thinking. In contrast, when analyzing the video of his teaching episode, he considered the student’s perspective and thought about his imagery (retrospective decentering). He also expressed dissatisfaction with his instructional move.
In the interview, the interviewer prompted Daniel to elaborate on his previous way of thinking (i.e., previous first-order model). His explanations in excerpt 15 show that Daniel was able to conceptualize the two quantities’ values varying simultaneously and continuously. In other words, he had a conception of a graph as a record of how the two quantities’ values vary in tandem. However, he also implied that his way of thinking affected his teaching negatively by saying “this is my physics thinking poisoning my teaching.” Although he thought that his imagery about the graphical representation of covariation was productive, he expressed that it is a hard way of thinking for students to represent the graph of CROC relationship.
Excerpt 15:
Daniel: The way I read this diagram [the graph in Figure 8] is that this point [the point on the graph in Figure 8] is being pushed right and down at the same time. I was a physics major in my undergrad. So, this is my physics thinking poisoning my teaching. When I see an arrow I think like a push, like a force, like a vector. I read this graph as a point is being pushed horizontally and vertically at the same time, which produces a diagonal push. I like to think about it this way, like to me, this is a really nice way to think about lines. But it’s a hard way to think about it.
Excerpt 16:
Daniel: Now, I would not do it this way anymore. If I’m lecturing now, I will always go with this [he started to draw the graph in Figure 11]. If we move over the time by 2 h how much does the length increase or decrease? Well, it would decrease by this much and then I would draw a point there. And you can say, “okay let us fill it in, what if we only moved by an hour?” then you get this point, right? You repeat this process a bunch of times with a bunch of different values of delta t. This is probably the more clear way of getting at this idea, as long as when you draw this diagram you say that “as time changes this much, the length changes by this much.” The “as” is very important.

Figure 11. Daniel’s revised diagram for illustrating changes in time and length.
Then he explained his current way of thinking about a meaningful graphing activity for representing CROC (excerpt 16). As can be seen in Figure 11, he expressed that he used a horizontal vector to represent the change in time and a vertical vector to represent the change in the length of the candle on the coordinate plane. He added that this process should be repeated for different values of the change in time, which shows his conceptualization of continuous and smooth covariation between two quantities in a CROC situation. It is also noteworthy that, although Daniel believes that the sliding imagery (in Figure 8) precisely represents the continuous and smooth covariation, he argues that the power of the convention for graphing CROC in Figure 11 can be increased by verbalizing the covariation by using “as” while drawing the graph. This highlights his intent for students to conceptualize the two quantities’ values varying together.
To sum up, Daniel’s analysis of his previous teaching from fall semester and his explanations related to his current way of thinking about teaching CROC revealed some shifts in his way of thinking about teaching the idea, especially his way of thinking about teaching graphing of CROC functions. His previous way of thinking about teaching was primarily based on his own imagery (his first-order model) expressed in excerpt 13 and in Figure 8. Over time, however, his attempts to consider students’ perspective (in-the-moment decentering) and his retrospective reflections about the results of interactions with students (retrospective decentering) supported by PD seminars might have fostered shifts in his way of thinking about teaching the idea. His interactions with curriculum materials, and the instructional resources, that included detailed, conceptually focused solutions and explanations, might have been another source of the shifts in his approach.
6 Discussion and conclusion
This study explored a GTA’s ways of thinking about teaching CROC and compared shifts in his conception and teaching of CROC over two semesters, while using Pathways research-based materials and attending the aligned Pathways professional development. It seeks to advance both the existing research on mathematics teaching and the emerging body of research on professional preparation and development of GTAs in undergraduate education (e.g., Carlson et al., 2024b; Ellis et al., 2016; Harris et al., 2009; Speer et al., 2005). The results revealed that, over time, Daniel was more focused on supporting students’ use of quantitative and covariational reasoning to construct a coherent image of how quantities in an applied setting are related and vary together. Our data also revealed how Daniel became more spontaneous and fluent in making instructional moves aimed at supporting a student in constructing meaningful function formulas and graphs.
In the fall semester, Daniel’s instruction was dominated by vague and occasionally confusing explanations, accompanied by an emphasis on procedures rather than understanding key precalculus concepts. These findings corroborated prior studies’ findings that possessing an advanced degree in mathematics do not guarantee the enactment of high-quality instruction (e.g., Bas-Ader and Carlson, 2022; Carlson et al., 2022b; Musgrave and Carlson, 2017). Moreover, Daniel’s teaching videos from the fall semester revealed that he rarely attempted to adopt a student’s perspectives when interacting with students. This finding is consistent with Bas-Ader and Carlson’s (2022) findings that it was uncommon for GTAs to engage in decentering actions when teaching. It also aligns with Carlson et al.’s (2022b) observations, based on their work with instructors over the past 15 years, that university precalculus instructors are primarily concerned with covering topics in a standard curriculum rather than understanding and advancing students’ thinking.
In contrast, in the spring semester, Daniel’s instructional practices were more aligned with pedagogical conventions that were introduced by the PPCPD project leaders (Carlson et al., 2022b). Specifically, he began to define quantities more precisely and emphasized variables as representations of the values that varying quantities can assume. He also began to frame covariation as involving a continuous change in two quantities’ values, rather than only considering how two quantities’ values changed over discrete intervals of one variable. These shifts align closely with PPCPD’s emphasis on the conventions of engaging in quantitative reasoning (Carlson et al., 2022b) and “speaking with meaning” (Clark et al., 2008), practices that had been documented to support instructors in being consistent in using pedagogical practices that foster shifts in their students’ conceptualization of quantities in a problem context, and using formulas and graphs to represent how these quantities are related and vary together. Moreover, Daniel’s conceptualization of graphs as tools to represent dynamic quantitative relationships embodies the PD’s focus on covariational reasoning and representational fluency. His strategic use of a vector to represent a change in a quantity’s value and his emphasis on the role of the coordinate axes in depicting a quantity’s value suggest a conceptual re-orientation toward helping students perceive a CROC value as emerging from exploring the multiplicative relationship between the changes in two quantities’ values. In this way, the PPCPD appears to have supported Daniel in moving beyond formulaic instruction, enabling him to create learning environments in which students can reason about relationships, not just perform computations—precisely the kind of learning gains the Pathways PD model is designed to foster (Carlson et al., 2024b).
Our findings illustrated that Daniel’s instructional practices (e.g., in the context of candle burning problem) were influenced by his mathematical meanings for the idea of CROC (i.e., his first-order models) as previously reported (e.g., Carlson et al., 2024a; Rocha, 2023; Thompson, 2013). The shifts in his instructional practices appeared to be driven by changes in his mathematical meanings and ways of thinking about teaching the idea of CROC over time. Our findings also revealed that, during the second semester of teaching with the Pathways materials, Daniel constructed some generalized ways of thinking (i.e., epistemic students) that we conjecture emerged from his reflections on the results of his interactions with students (retrospective decentering), teaching with the Pathways materials, and participating in the Pathways professional development (Rocha, 2023). These images of epistemic students along with the advancement of his first-order model over the two semesters likely fostered advances in his ways of thinking about teaching the idea of CROC, as highlighted in the framework (see Figure 1) introduced by Carlson et al. (2024a).
6.1 Conditions associated with shifts in the GTA’s teaching: features of the intervention
There exists a limited number of approaches that focus specifically on preparing GTAs as future instructors (Carlson et al., 2024b; Ellis et al., 2016; Harris et al., 2009; Speer et al., 2005). In essence, these distinct projects and studies underscore the need for PD for GTAs and mathematics instructors to be research-informed, sustained, centered on deep conceptual understanding and student centered pedagogy, while being responsive to the challenges of shifting established teaching practices. They collectively affirm that systemic, data-driven support for instructor growth is key to improving undergraduate mathematics education. Among these, the PPCPD project is distinguished from more general GTA professional development initiatives through its provision of a fully integrated, continuously refined, research-based curriculum, coupled with ongoing professional development. This design actively engages instructors, including GTAs, in reconceptualizing core mathematical ideas and how they are learned, and in transforming their instructional practices to engage their students’ thinking and advance their understandings. Furthermore, its commitment to long-term institutional change, driven by data-informed refinement and ongoing collaborative professional learning, further distinguishes the Pathways Precalculus innovation.
The shifts in Daniel’s instructional practices appear to be influenced by various features of the PPCPD project. Although our research design prevented us from drawing definitive conclusions about the factors driving specific shifts, discussing the possible role of specific features of the PPCPD innovation is still valuable.
Pathways curriculum materials support instructors in fostering productive reasoning patterns in their students that research has revealed to be essential for students’ construction of meaningful function formulas (e.g., Moore and Carlson, 2012; Thompson, 1988, 1993) and graphs (e.g., Carlson et al., 2002; Moore and Thompson, 2015). Similarly, these materials might have supported the progress in Daniel’s instructional practices over time. The structured cognitively scaffolded nature of the Pathways tasks might have played a pivotal role by functioning not only as tools for student learning but also as supports for Daniel’s own conceptual and pedagogical development. These tasks are intentionally designed to support students’ reasoning and understanding of core conceptual ideas central to the PPCPD—such as conceptualizing quantities and how they are related, defining variables precisely and using them meaningfully to represent quantitative relationships with formula and graphs, and differentiating between the relationship among quantities and the relationship among their changes. As Daniel prepared to use these tasks when teaching, he was guided in supporting his students’ engagement in quantitative reasoning. This led to him gradually reshaping his instructional discourse and decision-making to have this focus. Rather than relying on procedural shortcuts or superficial explanations, Daniel began to foreground the structure and meaning of quantitative relationships, helping students trust and use their reasoning to make sense of function behavior in context. This was particularly evident in his use of graphs, where his instruction shifted from emphasizing point-plotting to interpreting graphs as representations of covarying quantities across intervals—a hallmark of the covariational reasoning emphasized in PPCPD (Carlson et al., 2024b). Through this repeated engagement with conceptually scaffolded tasks, Daniel appeared to develop a more coherent instructional approach, aligning more closely with the pedagogical conventions outlined by Carlson et al. (2022b). The tasks acted as a lever for disrupting procedural habits and cultivating new instructional habits grounded in reasoning and meaning making. Our study suggests that when instructors consistently engage with such well-structured, educative materials, they are not merely transmitting content; rather their image of what is entailed in understanding and learning ideas advances, leading to their explanations and questions fostering their students’ reasoning about relationships between quantities, a shift that is essential for high-quality precalculus instruction. The PPCPD project distinguishes itself by embedding research-based, cognitively scaffolded investigations and tasks for students; and research-informed teacher resources and professional development, whereas Ellis et al. (2016) describe more general instructional practices that were found to enhance precalculus instruction.
The instructor solutions and notes included in the PPCPD scaffolded investigations and homework might have influenced shifts in Daniel’s instructional practices, by functioning as tools for professional learning. These notes likely helped Daniel move beyond viewing tasks as isolated exercises in procedural fluency to viewing them as a means of supporting him in providing conceptually focused explanations and solutions. This shift in perspective might have also led to him adopting more student-centered approaches in his teaching (e.g., encouraging students to construct a drawing to represent how quantities in a problem statement are related, precisely defining and referencing the quantities’ values represented by variables, terms and expressions). The exemplar student solutions and descriptions of common student conceptions might have contributed to his interest in understanding his students’ thinking. Furthermore, as Daniel engaged with these notes over time—particularly in the context of collaborative PD—he appeared to become more reflective about his instructional decisions. He also became more intentional in aligning his teaching with the broader goals of developing students’ mathematical thinking and conceptual understandings. Thus, instructional notes might contribute to Daniel’s pedagogical and conceptual growth.
Daniel attended 90-minute weekly professional development seminars concurrent with his teaching. An over-arching goal of the weekly seminars was to engage the instructors in completing the tasks they would use in their teaching during the upcoming week, while raising their awareness of the role and importance of the quantitative reasoning conventions (e.g., constructing a drawing of the quantities, defining variables precisely) in supporting their students’ conceptualization of quantitative relationships and how two quantities vary together. As elaborated elsewhere (e.g., Carlson et al., 2002; Moore and Carlson, 2012), it was through sustained research on student learning of precalculus and calculus ideas that the Pathways leaders became aware of quantitative reasoning as a cross-cutting way of thinking for understanding growth patterns in two quantities’ values as a foundation for constructing meaningful algebraic and graphic function models. As a result, the PD seminar leader was deliberate in posing questions to raise the GTAs’ awareness of mechanisms for engaging their students in using quantitative reasoning.
During the Pathways seminar the week before Daniel began his first CROC lesson, he and the other GTAs completed and collaboratively examined the CROC-related tasks under the guidance of the professional development leader. These seminars might have been instrumental in helping Daniel develop a deeper understanding of and ability to implement pedagogical principles aimed at fostering students’ quantitative reasoning. However, the findings suggest that a single seminar is not sufficient; meaningful shifts in Daniel’s teaching practices emerged only after his weekly participation across two consecutive semesters in which he appeared motivated to align his teaching with the Pathways research-based learning goals. Thus, supporting GTAs in valuing Pathways learning goals and developing a shared vision of what effective mathematics instruction entails necessitates engaging instructors in tasks that support reflecting on understanding and learning precalculus ideas, while including opportunities for instructors to share their thinking and pedagogical strategies with their peers (Carlson et al., 2024b). We believe that the authors’ and seminar leader’s sustained focus on operationalizing these research insights into the Pathways professional development and curriculum were impactful in improving Daniel’s teaching practices.
Speer et al. (2010) point out that most collegiate mathematics professional development (PD) is not grounded in empirical research but instead relies on the “collective wisdom” of experienced instructors. While they call for a research-informed foundation to guide the design of PD, the PPCPD project puts this vision into practice by integrating empirical findings into both its curriculum materials and the structure of its PD activities.
7 Implications and limitations
This study revealed that shifting a GTA’s instruction to be more effective in implementing research-based learning goals is possible in a context where the instructor is using cognitively scaffolded materials and supported with ongoing professional development that is effective in helping him implement research-based goals in his instructional practices. Our findings further revealed that during the first semester of using the materials Daniel’s instruction was sometimes incoherent and inconsistent with the Pathways research-based learning goals. Further research is needed to understand the teachers’ experiences during the initial workshop and their first semester of teaching with the materials.
We documented shifts in Daniel’s understanding of constant rate of change, his way of thinking about teaching constant rate of change, and his interactions with students when teaching the idea of constant rate of change. We hypothesize that the scaffolded lessons, aspects of the instructor resources, and his participation in the weekly seminar contributed to the shifts.
By studying only one instructor we were able to perform a fine-grained analysis of his use of quantitative reasoning and conception of the idea of constant rate of change and related instructional practices over two semesters of teaching with the Pathways materials. As a result, we cannot assume that other instructors would make the same progress as Daniel when using the Pathways materials and attending the Pathways professional development over two semesters. We recommend that researchers continue to examine how using research-based precalculus materials impacts other precalculus instructors.
It would also be useful to investigate student thinking and learning over the first few years (3–4 semesters) of using the Pathways materials. We can report that Daniel’s students had significant learning gains relative to their understanding and using precalculus ideas, and that more generally, Pathways precalculus students’ learning gains are significantly better than when the same instructor was using a different curriculum (McNicholl et al., 2021). When designing future research, we recommend studying teachers with diverse mathematical backgrounds and/or when teaching other precalculus ideas. We have provided a general description of the instructional resources6 Daniel used but did not investigate how Daniel used them or how they impacted his conceptions and teaching. A fine-grained study that focuses on Daniel’s planning and resource use is needed to investigate these questions.
This study was conducted in the context of a sustained research project in which the research-based student materials, instructor resources, and professional development strategies had been repeatedly studied and refined in small-scale qualitative studies. We believe Daniel’s shifts and his successful implementation of the research-based materials could be partially attributed to the cognitive scaffolding and research insights embedded in the Pathways materials. In addition, it is noteworthy that all materials had been repeatedly studied and revised to assure their accessibility to Pathways students and usability for Pathways teachers. These features of the Pathways materials made it possible for teachers to be successful in using the materials during their first semester of using the materials. As a result, we caution others to refine and pilot their instructional resources to assure their usability, coherence, and logical scaffolding prior to studying their impact on a teacher’s conceptions and instruction and their students’ learning.
Data availability statement
The raw data supporting the conclusions of this article will be made available by the authors, without undue reservation.
Ethics statement
The studies involving humans were approved by The Social Behavioral IRB office at Arizona State University. The studies were conducted in accordance with the local legislation and institutional requirements. The participants provided their written informed consent to participate in this study.
Author contributions
SB-A: Conceptualization, Formal analysis, Investigation, Methodology, Validation, Writing – original draft, Writing – review & editing. MK: Conceptualization, Formal analysis, Investigation, Validation, Writing – original draft, Writing – review & editing. MC: Conceptualization, Formal analysis, Funding acquisition, Methodology, Project administration, Resources, Supervision, Writing – review & editing.
Funding
The author(s) declare that financial support was received for the research and/or publication of this article. The research reported here was supported by the National Science Foundation under Grant No. DUE-1323753.
Acknowledgments
We would like to thank Daniel, whose volunteering to participate in our study made this research possible.
Conflict of interest
The authors declare that the research was conducted in the absence of any commercial or financial relationships that could be construed as a potential conflict of interest.
Generative AI statement
The authors declare that no Gen AI was used in the creation of this manuscript.
Any alternative text (alt text) provided alongside figures in this article has been generated by Frontiers with the support of artificial intelligence and reasonable efforts have been made to ensure accuracy, including review by the authors wherever possible. If you identify any issues, please contact us.
Publisher’s note
All claims expressed in this article are solely those of the authors and do not necessarily represent those of their affiliated organizations, or those of the publisher, the editors and the reviewers. Any product that may be evaluated in this article, or claim that may be made by its manufacturer, is not guaranteed or endorsed by the publisher.
Supplementary material
The Supplementary material for this article can be found online at: https://www.frontiersin.org/articles/10.3389/feduc.2025.1659982/full#supplementary-material
Footnotes
1 ^The local Pathways leader values Pathways learning goals and has taught using the Pathways materials at least two times.
2 ^For more information about the research that led to the development and impact of the Pathways conventions for quantitative reasoning, refer to Carlson et al.’s (2022b)book chapter.
3 ^Pathways learning goals targeted deep conceptual understandings and reasoning abilities that were generated by fine-grained investigations of knowing and learning precalculus ideas. As a result, these learning goals are novel to most instructors and graduate students in mathematics, and developing coherent meanings for these ideas required Pathways instructors to first engage in completing the tasks and reflecting on the thinking they used when completing the Pathways tasks they planned to use with their students.
4 ^Recall that the Pathways materials targeted research-based learning goals that had been revealed in qualitative studies to be essential for learning, understanding and using precalculus ideas.
5 ^Our coding scheme reflects our conceptualization of shifts in Daniel’s instruction and way of thinking about teaching over time.
6 ^A more detailed description can be found in Carlson et al. (2024b).
References
Bas-Ader, S., and Carlson, M. P. (2022). Decentering framework: a characterization of graduate student instructors’ actions to understand and act on student thinking. Math. Think. Learn. 24, 99–122. doi: 10.1080/10986065.2020.1844608
Bowling, S. (2014). Conceptions of function composition in college precalculus students. Tempe, AZ: Arizona State University.
Byerley, C., and Thompson, P. W. (2017). Secondary mathematics teachers’ meanings for measure, slope, and rate of change. J. Math. Behav. 48, 168–193. doi: 10.1016/j.jmathb.2017.09.003
Carlson, M. (1998). “A cross-sectional investigation of the development of the function concept” in Research in collegiate mathematics education. III. eds. E. Dubinsky, A. H. Schoenfeld, and J. Kaput, vol. 7 (Providence, RI: American Mathematical Society), 114–162.
Carlson, M. P., Bas-Ader, S., O’Bryan, A. E., and Rocha, A. (2024a). “The construct of decentering in research on mathematics learning and teaching” in Piaget’s genetic epistemology for mathematics education research. eds. P. J. Dawkins, A. J. Hackenberg, and A. Norton (Cham: Springer), 289–338.
Carlson, M., Jacobs, S., Coe, E., Larsen, S., and Hsu, E. (2002). Applying covariational reasoning while modeling dynamic events: a framework and a study. J. Res. Math. Educ. 33, 352–378. doi: 10.2307/4149958
Carlson, M. P., Madison, B., and West, R. D. (2015). A study of students’ readiness to learn calculus. Int. J. Res. Undergrad. Math. Educ. 1, 209–233. doi: 10.1007/s40753-015-0013-y
Carlson, M. P., O’Bryan, A. E., Oehrtman, M., and Moore, K. (2022a). Precalculus: Pathways to calculus, a problem-solving approach. 9th Edn. Cham: Great River Learning.
Carlson, M. P., O’Bryan, A. E., and Rocha, A. (2022b). “Instructional conventions for conceptualizing, graphing and symbolizing quantitative relationships” in Quantitative reasoning in mathematics and science education. eds. G. Karagöz Akar, İ. Ö. Zembat, S. Arslan, and P. W. Thompson, vol. 21 (Cham: Springer), 221–259.
Carlson, M. P., O’Bryan, A. E., Strayer, J. F., McNicholl, T. H., and Hagman, J. E. (2024b). Considering, piloting, scaling and sustaining a research-based precalculus curriculum and professional development innovation. J. Math. Behav. 73:101126. doi: 10.1016/j.jmathb.2024.101126,
Carlson, M., Oehrtman, M., and Engelke, N. (2010). The precalculus concept assessment: a tool for assessing students’ reasoning abilities and understandings. Cogn. Instr. 28, 113–145. doi: 10.1080/07370001003676587
Clark, P. G., Moore, K. C., and Carlson, M. P. (2008). Documenting the emergence of “speaking with meaning” as a sociomathematical norm in professional learning community discourse. J. Math. Behav. 27, 297–310. doi: 10.1016/j.jmathb.2009.01.001
Ellis, J. (2015). “Three models of graduate student teaching preparation and development” in Insights and recommendations from the MAA national study of college calculus. eds. D. Bressoud, V. Mesa, and C. Rasmussen (Washington, DC: Mathematical Association of America), 117–122.
Ellis, J., Deshler, J. M., and Speer, N. (2016). Supporting institutional change: a two-pronged approach related to graduate teaching assistant professional development. In T. Fukawa-Connelly, N. E. Infante, M. Wawro, and S. Brown (Eds.), Proceedings of the 19th annual conference on research in undergraduate mathematics education (pp. 729–735). SIGMAA on RUME.
Harris, G., Froman, J., and Surles, J. (2009). The professional development of graduate mathematics teaching assistants. Int. J. Math. Educ. Sci. Technol. 40, 157–172. doi: 10.1080/00207390802514493
Lock, K. (2023) Investigating the role of relative size reasoning in students’ understanding of precalculus ideas. Tempe, AZ: Arizona State University
McNicholl, T. H., Frank, K., Hogenson, K., Roat, J., and Carlson, M. P. (2021). Improving student success and supporting student meaning-making in large-lecture precalculus classes. PRIMUS (West Point, NY) 31, 792–810. doi: 10.1080/10511970.2020.1737850
Moore, K. C., and Carlson, M. P. (2012). Students’ images of problem contexts when solving applied problems. J. Math. Behav. 31, 48–59. doi: 10.1016/j.jmathb.2011.09.001
Moore, K. C., and Thompson, P. W. (2015). Shape thinking and students’ graphing activity. In T. Fukawa-Connelly, N. E. Infante, K. Keene, and M. Zandieh (Eds.), Proceedings of the 18th annual conference on research in undergraduate mathematics education (pp. 782–789). SIGMAA on RUME.
Musgrave, S., and Carlson, M. P. (2017). Understanding and advancing graduate teaching assistants'mathematical knowledge for teaching. J. Math. Behav. 45, 137–149. doi: 10.1016/j.jmathb.2016.12.011
O’Bryan, A. E. (2018). Exponential growth and online learning environments: Designing for and studying the development of student meanings in online courses. Tempe, AZ: Arizona State University.
Rocha, A. (2023). An investigation into the relationships among teachers’ mathematical meanings for teaching, commitment to quantitative reasoning, and actions. Tempe, AZ: Arizona State University.
Speer, N., Gutmann, T., and Murphy, T. J. (2005). Mathematics teaching assistant preparation and development. Coll. Teach. 53:80. doi: 10.3200/CTCH.53.2.75-80
Speer, N. M., Smith, I. I. I. J. P., and Horvath, A. (2010). Collegiate mathematics teaching: an unexamined practice. J. Math. Behav. 29, 99–114. doi: 10.1016/j.jmathb.2010.02.001
Steffe, L. P., and Thompson, P. W. (2000a). Interaction or intersubjectivity? A reply to Lerman. J. Res. Math. Educ. 31, 191–209. doi: 10.2307/749751
Steffe, L. P., and Thompson, P. W. (2000b). “Teaching experiment methodology: underlying principles and essential elements” in Handbook of research design in mathematics and science education. eds. A. E. Kelly and R. A. Lesh (Mahwah, NJ: Lawrence Erlbaum Associates), 267–306.
Steffe, L. P., von Glasersfeld, E., Richards, J., and Cobb, P. (1983). Children’s counting types: Philosophy, theory, and application. New York, NY: Praeger Scientific.
Strauss, A., and Corbin, J. M. (1990). Basics of qualitative research: Grounded theory procedures and techniques. Newbury Park, CA: SAGE Publications.
Strom, A. (2008). A case study of a secondary mathematics teacher’s understanding of exponential function: an emerging theoretical framework. Tempe, AZ: Arizona State University.
Tallman, M. A. (2015). An examination of the effect of a secondary teacher’s image of instructional constraints on his enacted subject matter knowledge. Tempe, AZ: Arizona State University.
Tallman, M. A., Weaver, J., and Johnson, T. (2024). Developing (pedagogical) content knowledge of constant rate of change: the case of Samantha. J. Math. Behav. 76:101179. doi: 10.1016/j.jmathb.2024.101179,
Thompson, P. W. (1988). Quantitative concepts as a foundation for algebraic reasoning: sufficiency, necessity, and cognitive obstacles. In M. J. Behr, C. B. Lacampagne, and M. M. Wheeler (Eds.), Proceedings of the annual meeting of the north American chapter of the International Group for the Psychology of mathematics education (pp. 163–170). DeKalb, IL: PME-NA.
Thompson, P. W. (1993). Quantitative reasoning, complexity, and additive structures. Educ. Stud. Math. 25, 165–208. doi: 10.1007/BF01273861
Thompson, P. W. (2000). “Radical constructivism: reflections and directions” in Radical constructivism in action: Building on the pioneering work of Ernst von Glasersfeld. eds. L. P. Steffe and P. W. Thompson (London: The Falmer Press), 412–448.
Thompson, P. W. (2002). “Didactic objects and didactic models in radical constructivism” in Symbolizing, modeling and tool use in mathematics education. eds. K. Gravemeijer, R. Lehrer, B. van Oers, and L. Verschaffel, vol. 30 (Dordrecht: Springer), 197–220.
Thompson, P. W. (2008) Conceptual analysis of mathematical ideas: some spadework at the foundation of mathematics education. In O. Figueras, J. L. Cortina, S. Alatorre, T. Rojano, and A. Sepulveda (Eds.), Proceedings of the joint meeting of PME 32 and PME-NA. Mexico City. (Vol. 1, pp. 31–49)
Thompson, P. W. (2013). “In the absence of meaning” in Vital directions for mathematics education research. ed. K. R. Leatham (New York, NY: Springer), 57–93.
Keywords: graduate teaching assistants, professional development, constant rate of change, precalculus instruction, research-based curriculum, undergraduate mathematics education
Citation: Bas-Ader S, Kertil M and Carlson MP (2025) Exploring an instructor’s teaching in the context of a research-based curriculum and ongoing professional development program. Front. Educ. 10:1659982. doi: 10.3389/feduc.2025.1659982
Edited by:
Michael Tallman, Oklahoma State University, United StatesReviewed by:
Melissa Troudt, University of Wisconsin–Eau Claire, United StatesMai Dahshan, University of Virginia, United States
Copyright © 2025 Bas-Ader, Kertil and Carlson. This is an open-access article distributed under the terms of the Creative Commons Attribution License (CC BY). The use, distribution or reproduction in other forums is permitted, provided the original author(s) and the copyright owner(s) are credited and that the original publication in this journal is cited, in accordance with accepted academic practice. No use, distribution or reproduction is permitted which does not comply with these terms.
*Correspondence: Sinem Bas-Ader, c2luZW1iYXNAYXlkaW4uZWR1LnRy