 José Ventura-León1*
 Cristopher Lino-Cruz2
 Shirley Tocto-Muñoz1
 Goldie Gamboa-Melgar2
 Jonathan Ruiz-Castro3
- 1Universidad Privada del Norte, Facultad de Ciencias de la Salud, Lima, Peru
- 2Universidad Peruana de Ciencias Aplicadas, Lima, Peru
- 3Universidad Continental, Facultad de Psicología, Cusco, Peru
Introduction: Academic goal progress is a key motivational construct linked to students' planning, self-regulation, and academic success, yet there is a dearth of culturally adapted, validated instruments for assessing this construct in Peruvian higher-education contexts. Grounded in Social Cognitive Career Theory, this study addresses this gap by adapting and validating the Academic Progress Goals Scale (AGPS) for Peruvian university students.
Methods: A total of 1,157 undergraduate students (Mean Age = 21.55, SD = 4.13; 64.4% female) completed the adapted seven-item AGPS. Exploratory Factor Analysis (EFA) with WLSMV estimation and AI-based iterative optimization reduced the scale to five items. Confirmatory Factor Analysis (CFA) tested the resulting unidimensional structure. Internal consistency was estimated via McDonald's omega (ω), bootstrap resampling (1,000 draws) evaluated stability, and structural equation modeling examined convergent validity with an academic satisfaction measure.
Results: EFA supported a single factor comprising five items, with excellent fit (χ2[5] = 9.93, CFI = 0.999; RMSEA = 0.041) and reliability (ω = 0.85). The CFA confirmed this structure with near-perfect fit (χ2[5] = 3.82, CFI = 1.000; RMSEA = 0.000) and composite reliability ω = 0.85. Bootstrap analyses indicated consistently high reliability (mean ω = 0.85, SD = 0.01) and fit (CFI/TLI ≈ 1.00; RMSEA mean = 0.04). SEM revealed a moderate correlation (ϕ = 0.66) between AGPS scores and academic satisfaction, supporting convergent validity.
Conclusion: The five-item AGPS is a brief, reliable, and valid tool for measuring academic goal progress among Peruvian university students. Its strong psychometric properties and cultural adaptation make it suitable for research, educational policy design, and interventions aimed at enhancing academic engagement and reducing dropout rates.
1 Introduction
In recent decades, academic goals have been consolidated as fundamental orientators of students' efforts to improve their performance (Mendo-Lázaro et al., 2022). This motivational construct is articulated with the metacognitive skills essential for planning, monitoring and evaluating one's own learning process (Rahman et al., 2024). However, there is still a lack of sufficiently reliable instruments to measure these competencies in current educational environments (Nájera et al., 2020). This lack hinders alignment with SDG 4, which promotes inclusive, equitable and quality education, as curricular rigidity, institutional resistance and lack of funding and teacher training limit its effective implementation (Ferguson and Roofe, 2020; Zickafoose et al., 2024).
Although the Ministry of Education has incorporated participatory methodologies to define and monitor academic goals in higher education, there is still an urgent need to design and validate a specific instrument for university students in Lima (Jara et al., 2022). Closing this gap is essential to strengthen academic engagement, coping with academic stressors, improving academic skills, and achieving academic achievement and success in various academic contexts (Aladini et al., 2024). Likewise, having a validated instrument will facilitate the improvement of the university experience and the incorporation of values such as competitiveness and performance, favoring an excellent education in marginalized contexts (Oliveira et al., 2025; Sloan-Lynch and Morse, 2024).
Bandura (1986) conceptualized academic goals as concrete intentions that channel behavior toward formative achievements, integrating them into his Social Cognitive Theory as key tools of self-regulation. Subsequently, Lent et al. (1994) adapted this framework to the university setting through the Social Cognitive Career Theory (SCCT), highlighting three interrelated components: academic goals, self-efficacy beliefs and outcome expectations, whose interaction determines student planning, perseverance and performance.
Based on the SCCT of Lent et al. (1994), it is postulated that college motivational dynamics are influenced by self-efficacy beliefs, outcome expectations and personal goals. From this foundation, Lent et al. (2007) developed several scales, among them, the Academic Progress Goals Scale, a seven-item unidimensional scale that assesses students' perceived progress in achieving their academic goals, i.e., the degree to which they feel they are making progress toward goals such as “learning and understanding the material in each of their courses” (p. 432). This instrument reported good internal consistency (Cronbach's α = 0.86).
To ensure an accurate assessment of the construct, it is essential to operationally define each type of goal, since the motivational process depends on the recognition of aspirations, obstacles and self-perception of one's own performance (Sheu et al., 2010). Therefore, it is proposed to adapt the original scale to correct conceptual ambiguities and improve its applicability in different contexts. This adaptation is based on the theoretical model of Lent et al. (2007), whose robustness allows for a valid assessment of academic goals and the development of interventions aimed at academic and vocational strengthening.
Within the conceptual framework, academic goals symbolize the future objectives that students seek to achieve, conditioning their involvement in specific activities (Bandura, 1986; Zalazar-Jaime and Cupani, 2018b). Two main types are distinguished: (a) Choice goals: linked to the domain or area that the student aspires to master; (b) Performance goals: related to the level of performance that the student wishes to achieve.
Both goals play differentiated roles: one motivates the exploration of educational options; the other drives the achievement of performance standards in specific tasks (Zalazar-Jaime and Cupani, 2018a). Taken together, they support behavioral self-regulation and are associated not only with satisfaction in the academic context, but also with general subjective wellbeing (Lent et al., 2007). Numerous studies have demonstrated their relevance in interaction with variables such as self-efficacy and outcome expectancies (Işik et al., 2018; Sheu et al., 2022; Sheu and Bordon, 2016).
The Lent et al. (2007) scale has been widely used in several countries such as: Spain (Lent et al., 2017), Portugal (Lent et al., 2009), Angola and Mozambique (Lent et al., 2014), Italy (Lent et al., 2011), Argentina (Medrano et al., 2017), Turkey (Işik et al., 2018) and USA (Duffy and Lent, 2009; Hui et al., 2013; Lent et al., 2007) with acceptable internal consistency (α and ω >0.80). However, so far there is only one research that explored its internal structure (Zalazar-Jaime and Cupani, 2018a), finding satisfactory results (CFI.993, TLI.990, RMSEA = 0.072). Therefore, the need emerges to examine in depth the psychometric properties of the Academic Progress Goals Scale, providing solid empirical evidence for its application in various contexts.
The availability of an accurate instrument to measure academic goals in higher education responds to the interest of promoting learning and optimizing the development of student capabilities (Valle et al., 2006). Having an adapted tool contributes to: (a) strengthening research actions and curriculum improvement (Compagnucci and Spigarelli, 2020; Fernández-Bringas et al., 2024; Pérez et al., 2017); (b) identifying areas for improvement in competencies such as critical thinking, creativity, cognitive flexibility and comprehension(Gaviria and Corredor, 2024; Gökçe and Güner, 2024; Rebecchi et al., 2024; Rodríguez Pulido et al., 2021; Weng et al., 2025).
In addition, some studies have linked goal achievement with the behavioral regulation and organization necessary for academic success (Valle et al., 2009), as well as with the explanation of academic satisfaction through outcome expectations (Lent, 2004; Lent et al., 2007). Moreover, motivation, influenced by goals, impacts cognitive, affective and behavioral domains (Closas et al., 2011; Gaeta et al., 2015). In work contexts, the pursuit of career goals does not always lead to satisfaction, which highlights the differences between academic and professional environments (Abraham et al., 2024; Brown and Lent, 2020).
This study is justified by the urgent need to validate an instrument to measure academic goals in university students. The relevance of this measurement is evidenced by the high dropout rates: in Latin America, almost half of the population aged 25–29 did not complete their studies (Seminara, 2021), and in Peru the dropout rate was 12.6% in 2023 (Ministerio de Educación del Perú, 2021). Although the socioeconomic factor stands out as the main cause (Superintendencia Nacional de Educación Superior Universitaria, 2021), there are also elements related to performance, individual characteristics, family environment, academic adaptation and vocational orientation (Bardales et al., 2025; Quincho et al., 2024; Seminara, 2021).
In this framework, academic goals, understood here as a set of intrinsic and extrinsic factors linked to the educational environment, could facilitate the understanding of the causes of dropout, whose consequences include social and economic problems and underemployment (Aisa et al., 2019; Jia and Ericson, 2017; Silva-Laya et al., 2020), increasing inequality gaps. Having a validated and reliable instrument would contribute to mitigating these rates, foster subjective wellbeing, raise academic satisfaction and reinforce learning objectives.
Consequently, the main objective of this work is to validate an instrument to measure academic goals in higher education students, providing empirical evidence on its factorial structure and reliability, and offering a useful resource for researchers, teachers and educational policy makers.
2 Method
2.1 Participants
An a priori power analysis using semPower (Moshagen and Bader, 2023) with df = 14, RMSEA = 0.05, power = 0.95 and α = 0.05 indicated a minimum of 778 observations. Our sample of 1,157 undergraduates exceeds this requirement. Table 1 summarizes their sociodemographic characteristics for the Total, EFA and CFA subsamples, see the table for full details.
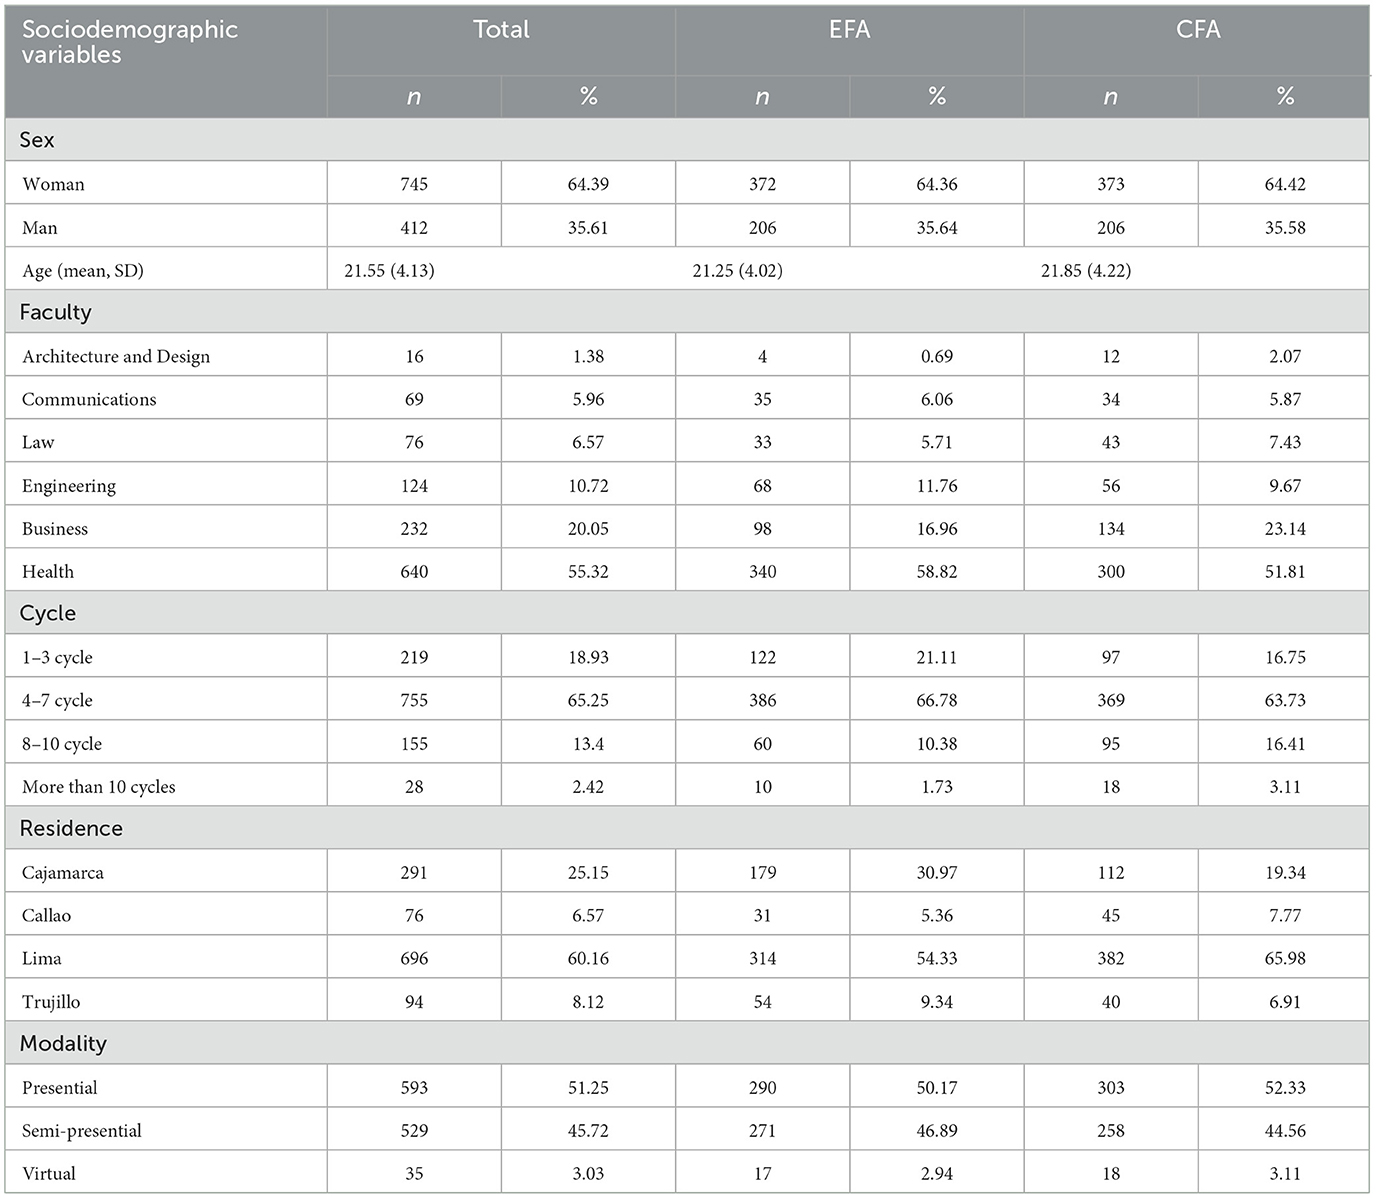
Table 1. Descriptive information on study participants.
2.2 Instrument
Participant Demographic Information. Participants completed a comprehensive demographic questionnaire that captured their sex, age, faculty affiliation, academic cycle, place of residence, and study modality, as detailed in Table 1.
Academic Goal Progress Scale (AGPS; Lent et al., 2007). This seven-item measure evaluates students' self-perceived progress toward their academic goals (see Appendix A). Items such as “learning and understanding the material in each of your courses” are rated on a 5-point Likert scale (1 = no progress at all; 5 = excellent progress), with higher scores reflecting greater goal attainment. The AGPS demonstrated good internal consistency, with Cronbach's α = 0.84 in the pilot sample and α = 0.86 in the main sample.
Academic Satisfaction Scale (ASS; Lent et al., 2007). This seven-item measure was developed to assess how satisfied students feel with their academic experience (e.g., “I enjoy the level of intellectual stimulation in my courses”). Respondents rate each statement on a 5-point Likert scale (1 = strongly disagree to 5 = strongly agree), with higher scores indicating greater academic satisfaction. The ASS showed excellent reliability, with Cronbach's α = 0.86 in the pilot sample and α = 0.87 in the main sample.
2.3 Procedure
Data was collected through a mass application to a group of students, who then forwarded the online form to other students, inviting them to participate. The protocol received approval from the Ethics Committee of the Universidad Privada del Norte, and all participants signed an informed consent form before beginning. This remote, emergent approach was selected to reach the target population efficiently, without face-to-face contact, ensuring a broad and inclusive sample. The survey covered academic self-efficacy, age, and gender, and could be completed at the participant's convenience in approximately ten minutes (see Appendix A). Data collection took place between April and May 2025, and the anonymized dataset is publicly available in the OSF repository: https://osf.io/p9f37/?view_only=3b1f6989129d4ed893aacaa0a7e58fde.
2.4. Data analysis
Analyses were conducted in RStudio (RStudio Team, 2022) using the psych (Revelle, 2021), lavaan (Rosseel, 2012), semPlot (Epskamp, 2015), and PsyMetricTools (Ventura-León, 2025) packages to manage data and estimate models. Because our variables were ordinal, we confirmed that each Likert category occurred at least 10 percent of the time to avoid estimation biases (Linacre, 2002).
An EFA was first run to identify the number of factors. We began with an initial factor count and added factors until fit indices fell within acceptable ranges: RMSEA and SRMR below 0.08 and CFI and TLI above 0.95 (Hu and Bentler, 1999). Factor loadings of 0.30 or higher and inter-factor correlations above 0.32 were considered meaningful (Tabachnick and Fidell, 2019). We applied oblimin rotation and the WLSMV estimator in lavaan because of its suitability for ordinal data (Li, 2016). We also tested a one-factor model in a separate validation sample to mirror the original proposal (Silvera et al., 2001). Items exhibiting cross-loadings of 0.30 or greater on multiple factors were removed, which improved overall fit (Lloret-Segura et al., 2014).
Additionally, we use the optimal_efa_with_ai function from the OptimalFactor package (Ventura-León, 2024). This routine first fits an EFA with WLSMV and oblimin rotation. If the model shows RMSEA > 0.08 or items with |λ| < 0.30 or cross-loadings, it removes the single item whose deletion most reduces RMSEA, then refits the model. The loop continues until RMSEA ≤ 0.08 and each factor retains at least two items with |λ| ≥ 0.30, with a maximum of n – 1 iteration. Every decision is logged. Once convergence is achieved, the function calls the OpenAI API (model = gpt-4.1, temperature = 0.5, max_tokens = 250, up to three retries) solely to generate a one-sentence conceptual rationale for each removed or retained item; the algorithm—not ChatGPT—makes all deletion decisions. Two independent psychometric experts review these rationales and may reinstate items if theoretical coherence is threatened (no reversals were required). This hybrid procedure guarantees a transparent and theoretically grounded refinement of the factor structure.
This allows for an iterative procedure to improve an EFA model with AI. The function selects an initial set of items, fits an EFA with the WLSMV estimator and oblimin rotation. In this way, it evaluates both the global fit (RMSEA ≤ 0.08) and the local structure (loadings ≥ 0.30, minimum number of items per factor). In each iteration, it eliminates the item whose exclusion most improves the fit or resolves the cross-loadings, recording each decision. Once the items are eliminated, chatGPT is invoked through an API to generate concise justifications for excluding or retaining the items. This approach guarantees a rigorously refined factor solution, maintaining theoretical consistency and empirical robustness.
We then evaluated previously published factor structures using WLSMV. When these models failed to meet fit criteria (CFI ≤ 0.95 or RMSEA ≥0.08), we revised them based on modification indices greater than 10, expected parameter changes above 0.20, and large standardized residual covariances above 0.20, always guided by theory and ensuring at least three items per factor. The same 0.30 loading and 0.32 inter-factor correlation thresholds were applied (Tabachnick and Fidell, 2019).
Scale reliability was assessed with omega (ω), which is recommended for congeneric models with unequal factor loadings (McDonald, 2013; Savalei and Reise, 2019; Ventura-León and Caycho-Rodríguez, 2017).
Finally, we used structural equation modeling to examine relationships among latent constructs (Raykov and Marcoulides, 2006). A CFA incorporating Academic Self-Efficacy as a convergence criterion allowed us to account for item weights, measurement error, and indirect effects for a more accurate representation of the latent variables.
3 Results
3.1 Preliminary analysis
Figure 1A displays the frequency distribution of responses for items MPA1 to MPA7. A pronounced preference for the “Good progress” category is seen in items such as MPA1 (62 %) and MPA7 (59 %). In contrast, the “Fair progress” category peaks at 29 % for MPA3 and 22 % for MPA6. The “Excellent progress” category reaches its highest frequency in MPA4 (32 %) and its lowest in MPA1 (14 %). This pattern shows that, although most students report positive academic advancement, each item captures a nuanced self-assessment gradient; notably, MPA3 and MPA4 differentiate modest from exceptional achievements. Overall, responses cluster around “Good progress” highlighting a generally positive perception of academic goal attainment across all items.
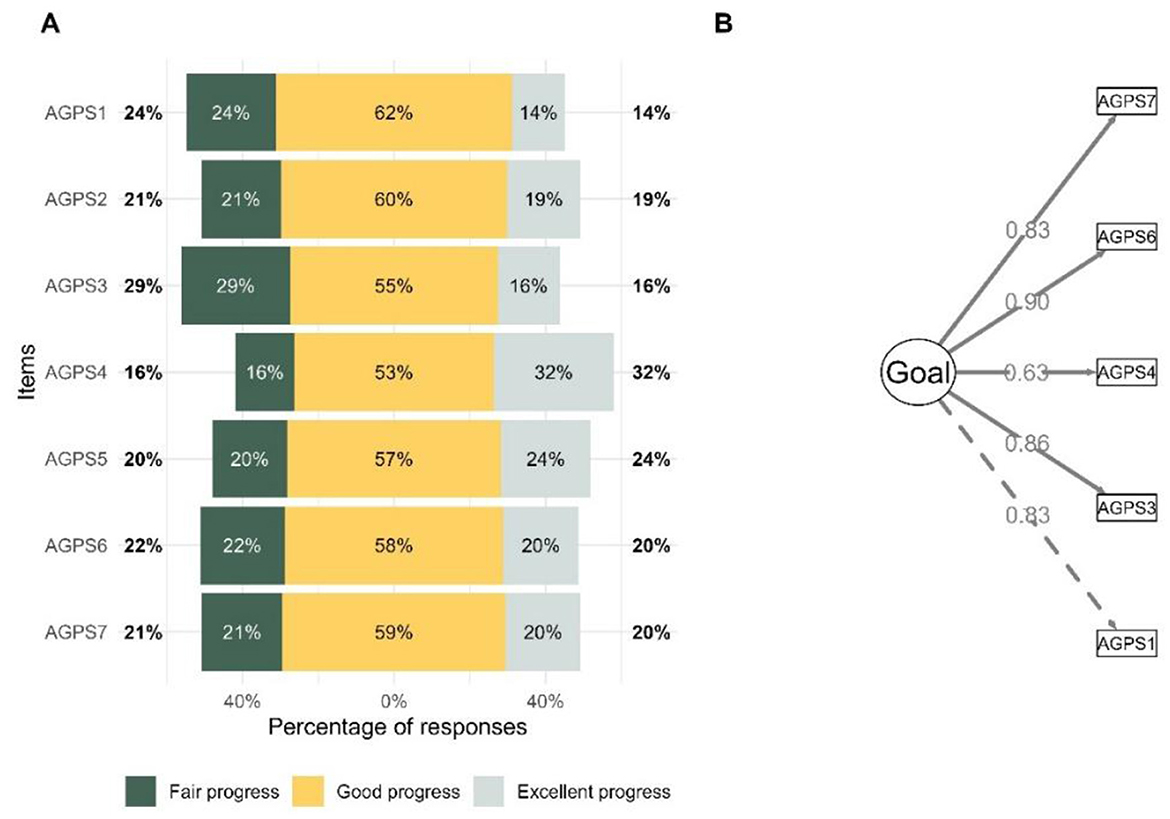
Figure 1. Descriptive analysis of the items and structure factorial of AGPS. (A) Item response rates. (B) Test factor structure.
3.2 Exploratory factor analysis
Factor analysis was conducted using an optimization procedure that evaluated both global fit (RMSEA) and local structure (loadings ≥ 0.30, with a minimum number of items per factor). The procedure iteratively removed the item whose exclusion resulted in the greatest improvement in RMSEA. After two iterations—first excluding AGPS5, which reduced the RMSEA to 0.094, and then AGPS2, bringing the final RMSEA to 0.041—the model retained five items (λAGPS1 = 0.796; λAGPS3 = 0.823; λAGPS4 = 0.645; λAGPS6 = 0.880; λAGPS7 = 0.904). The sharp RMSEA drop, coupled with consistently high loadings, indicates that the remaining items capture the construct's core without redundancy or cross-factor contamination. The model demonstrated excellent fit (χ2 [5] = 9.932, SRMR = 0.013, WRMR = 0.442, CFI = 0.999, TLI = 0.998), confirming a coherent and robust unidimensional structure. The reliability for this model was also good (ω = 0.85).
3.3 Confirmatory factor analysis
Figure 1B shows the final one-factor CFA for the Academic Goal Progress Scale (AGPS). All five retained items load strongly on the single latent factor, with standardized loadings ranging from 0.626 (AGPS4) to.897 (AGPS6). The model demonstrates exemplary fit under WLSMV estimation: χ2(5) = 3.82, SRMR = 0.011, WRMR = 0.279, CFI = 1.000, TLI = 1.001, and RMSEA = 0.000. Composite reliability was also satisfactory (ω = 0.85), confirming that the shortened version preserves the intended one-dimensionality and the internal consistency observed in the EFA.
3.4 Stability of the factorial structure
Figure 2 illustrates the stability of reliability and fit indices across bootstrap resamples. In panel A, the omega coefficient remains tightly clustered around 0.85 (mean = 0.85, SD = 0.01, range 0.81–0.88), indicating consistently high internal reliability. Panel B shows CFI and TLI both hovering at or near 1.00 (CFI mean = 1.00, SD = 0.00; TLI mean = 1.00, SD = 0.00; minimum 0.98, maximum 1.00), reflecting near-perfect factorial fit in every replicate. Panel C presents CRMR, RMSEA, and SRMR: CRMR stays around.02 (mean = 0.02, SD = 0.00), SRMR around.02 (mean = 0.02, SD = 0.01), while RMSEA exhibits greater variability (mean = 0.04, SD = 0.03, range 0–0.13). Moreover, when applying the pre-specified thresholds (CFI < 0.95, TLI < 0.95, SRMR >0.08, RMSEA >0.08) to each bootstrap replicate, none of the samples fell below acceptable limits for CFI or TLI, nor exceeded acceptable limits for SRMR; only RMSEA marginally violated its cutoff in 6 % of the resamples. This further underscores the robustness of the CFA solution under sampling variability. Taking together, these findings confirm that the factor solution is resilient to sampling variability and that extreme misfit indices are rare events.
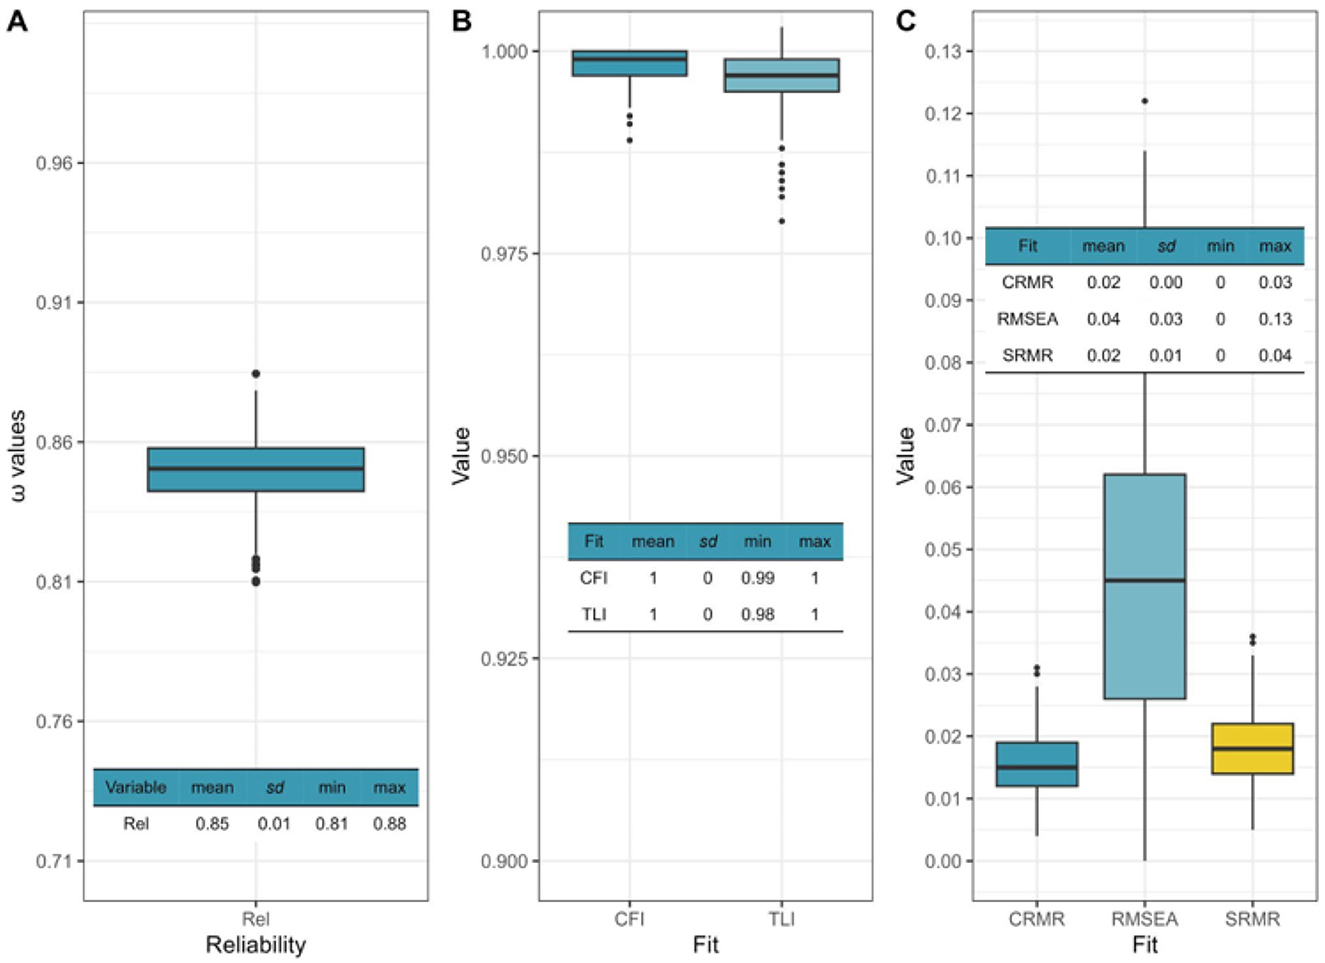
Figure 2. Stability of the factorial model. (A) Replication of the reliability. (B) Replication of comparative goodness-of-fit indices. (C) Replication of absolute goodness-of-fit indices.
3.5 Evidence of validity in relation to another variable
Figure 3 presents the relational model between the Academic Goals Progress Scale and academic satisfaction, revealing a moderate interrelation between the factors (ϕ = 0.66). The model achieved acceptable fit under WLSMV estimation: χ2(63) = 267.50, SRMR = 0.038, WRMR = 1.174, CFI = 0.984, TLI = 0.981, and RMSEA = 0.075. Both CFI and TLI exceed the 0.95 threshold, while the RMSEA of 0.075 falls below the 0.08 cutoff, indicating a good overall fit. The latent correlation of 0.66 supports the hypothesis that perceived academic progress is substantially (yet not completely) linked to academic satisfaction, implying that each construct adds unique insight into the student experience.
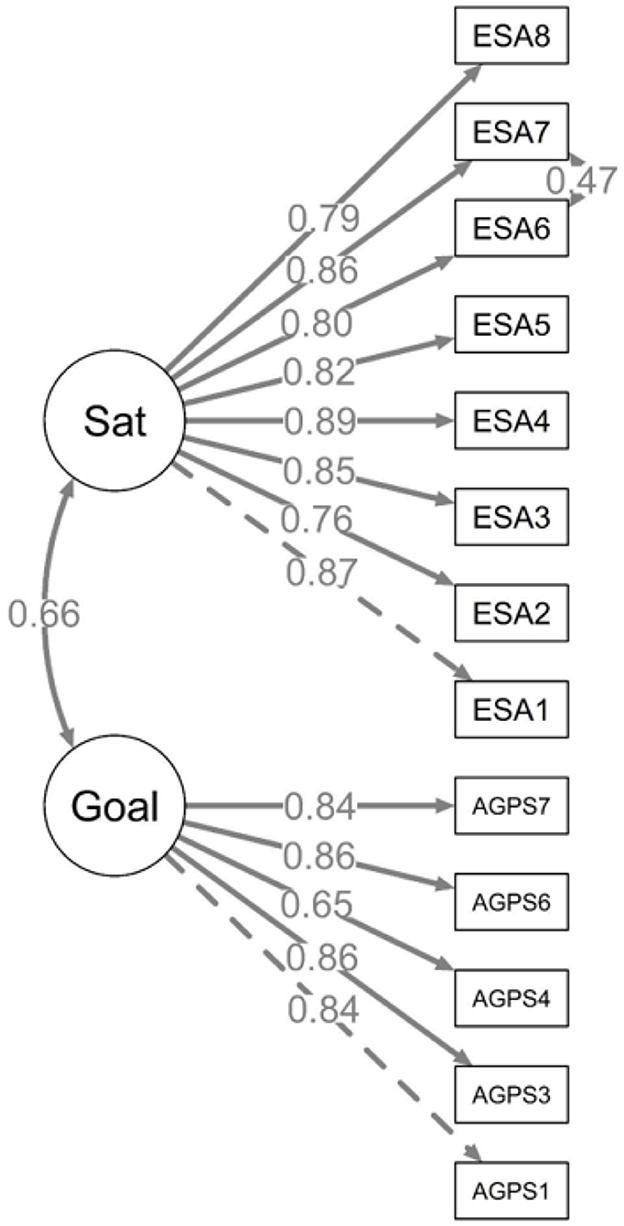
Figure 3. Structural model between the relationship between academic progress goals and academic satisfaction.
4 Discussion
Consistent with the findings presented, the main objective of this paper is to validate an instrument to measure academic goals in higher education students, providing empirical evidence on its factorial structure and reliability, and offering a useful resource for researchers, teachers and educational policy makers. Based on the theoretical foundation previously exposed, in recent decades academic goals have been consolidated as fundamental orientators of students' efforts to improve their performance (Mendo-Lázaro et al., 2022). Thus, this motivational construct is articulated with the essential metacognitive skills to plan, monitor and evaluate one's own learning process (Rahman et al., 2024). However, there is still a lack of sufficiently reliable instruments to measure these competencies in current educational settings, which hinders alignment with SDG 4 and limits the implementation of inclusive, equitable and quality education (Ferguson and Roofe, 2020; Nájera et al., 2020; Zickafoose et al., 2024). Similarly, this lack prevents the systematic comparison of pedagogical interventions at the international level, making it difficult to identify effective practices that could be replicated in the Peruvian context.
Consequently, in Latin America and, in particular, in the Peruvian context, the need for solid and contextualized psychometric tools persists (Aliaga, 2021; Nájera et al., 2020). In fact, the absence of a validated instrument makes it difficult to detect and mitigate inequalities in the achievement of academic goals, which has repercussions on high university dropout rates (12.6% in 2023) and regional inequity (Aladini et al., 2024; Ministerio de Educación del Perú, 2021; Oliveira et al., 2025; Sloan-Lynch and Morse, 2024). Therefore, the Ministry of Education has promoted participatory methodologies (Jara et al., 2022), but a specific instrument for university students in Lima that responds to local cultural and linguistic characteristics is still required. In addition, this instrument will allow evaluating the effectiveness of tutoring and mentoring programs, as well as student retention policies, providing baseline data for the continuous improvement of such strategies.
From a practical standpoint, the five-item AGPS can be administered in less than one minute and therefore lends itself to multiple points of contact within the university support ecosystem. It can be embedded in initial advising forms or orientation interviews to flag students who perceive limited progress, incorporated into learning-management systems and mid-semester surveys as part of early-alert dashboards, or used during one-to-one counseling to inform personalized action plans and referrals to tutoring or wellbeing services. Because of its brevity, the scale can also be re-administered later in the term, allowing advisors to track change over time and adjust interventions in real time.
Based on the Social Cognitive Career Theory (SCCT) of Lent et al. (1994), which integrates academic goals, self-efficacy beliefs and outcome expectations, it is postulated that college motivational dynamics depend on the interaction of these components. In this sense, Bandura (1986) conceptualized academic goals as concrete intentions that channel behavior toward formative achievement, and Lent et al. (2007) developed the Academic Progress Goals Scale, a seven-item unidimensional instrument with good internal consistency (α = 0.86). However, its applicability in Peruvian contexts had not been explored, which justifies the present adaptation. To ensure semantic, conceptual and experiential equivalence, each item was reviewed by two bilingual experts and tested with students from the coastal and Andean regions. This process acknowledged the regional variants of Spanish and the collectivist framing of academic success, often experienced as a familial responsibility among first-generation students, thus ensuring that the scale truly resonates with local motivational meanings.
To address this shortcoming, our study implemented an empirical and theoretically grounded adaptation of the original scale, correcting conceptual ambiguities and improving its applicability in diverse academic contexts. Likewise, the introduction of Exploratory and Confirmatory Factor Analysis procedures optimized by means of artificial intelligence represented a relevant methodological innovation (Goretzko and Bühner, 2022; Rodriguez-Rodriguez et al., 2025). In this way, we sought not only to confirm the unidimensional structure, but also to ensure the cultural and linguistic relevance of the instrument. This hybrid approach of traditional psychometrics and artificial intelligence opens new possibilities for the validation of scales in environments with limited technical and human resources.
In descriptive terms, students showed a predominant tendency toward “Good progress” in items MPA1 (62%) and MPA7 (59%), while item MPA4 stood out in “Excellent progress” (32%). In contrast, intermediate categories such as “Fair progress” were concentrated in MPA3 (29%) and MPA6 (22%), which could reflect individual differences in metacognitive skills or specific academic demands. These findings underscore the need for differentiated interventions that enhance learning regulation skills, particularly in those students who perceive moderate progress.
Regarding the internal structure, the AFE indicated that a one-factor configuration with five items (AGPS1, AGPS3, AGPS4, AGPS6 and AGPS7) offers an optimal fit. Specifically, iterative AI eliminated items with insufficient loadings and evaluated comparative and absolute indices, optimizing the model. Next, the CFA confirmed this structure with excellent fit indices, which is consistent with previous evidence in other contexts (Zalazar-Jaime and Cupani, 2018). Thus, it is demonstrated that the scale can be simplified from seven to five items without losing validity, facilitating its administration in environments of high academic demand.
In relation to reliability, the omega coefficient was used, which is more appropriate for congeneric models (Savalei and Reise, 2019; Ventura-León and Caycho-Rodríguez, 2017). The results yielded an average value of ω = 0.85, exceeding the threshold of 0.70 and aligning with international studies reporting α and ω > 0.80 (Lent et al., 2007; Medrano et al., 2017). Therefore, the scale consistently measures different aspects of academic progress goals. This level of reliability allows its use in both longitudinal research and one-off assessments, providing methodological flexibility to users.
Additionally, using a bootstrap procedure of 1,000 replicates in R, the stability of the factor structure was evaluated. This analysis revealed that the CFI and TLI indices maintained mean values of 1.00 (SD = 0.00), while the SRMR and CRMR remained below 0.03. Although the RMSEA showed greater variability (mean = 0.04; SD = 0.03), only 6 % of the replicates exceeded the cutoff point of 0.08. Thus, conclusive evidence was provided on the replicability and structural validity of the model (Awang et al., 2015). These results support the robustness of the instrument, showing that it is resistant to sampling fluctuations and suitable for different cohorts of students.
On the other hand, concurrent validity, evaluated by means of structural equation modeling, confirmed a strong association between academic progress goals and academic satisfaction. This finding supports the proposal of (Lent et al., 2007) and agrees with previous studies in students and teachers (Hui et al., 2013; Lent et al., 2011), evidencing that goal attainment promotes the satisfaction of psychological needs and general subjective wellbeing (Diener, 1984; Klug and Maier, 2015).
However, this study has some limitations. First, non-probability sampling restricts the generalizability of the results and may introduce sampling bias, given the over-representation of female students (64%) and health-science majors (55%). Future work should replicate the study using stratified probability designs or apply post-stratification weights to verify the stability of the findings. Furthermore, although the validated scale retains five items for the factor, future work could explore the incorporation of additional items to enrich the measurement (Brown, 2015). Second, the AI component was limited to producing brief conceptual rationales after a purely statistical, iterative algorithm had determined item retention or deletion; therefore, ChatGPT played no role in the pruning decisions themselves. While two psychometric reviewers screened every rationale, the possibility of incomplete or hallucinated explanations remains, and these narratives should not be regarded as definitive theoretical evidence. Third, because the optimal-deletion algorithm was calibrated on a convenience sample of Peruvian university students, it may capitalize on sample-specific variance; replications with probability samples and in other cultural-linguistic contexts are needed before generalizing the factorial solution. Finally, it would be valuable to extend the sampling to different regions and the social strata of the country to strengthen external validity. It is also suggested to investigate the sensitivity of the scale to specific teacher training interventions and tutoring programs, in order to evaluate changes at the level of academic goals over time.
5 Conclusion
In summary, the validation of the Academic Progress Goals Scale provides a valid, reliable and culturally adapted tool to the Peruvian university context. The results confirm a solid unidimensional structure, high internal consistency (ω = 0.85) and significant relationships with academic satisfaction, supporting its usefulness for identifying motivational profiles and designing pedagogical interventions. Despite sampling and virtual collection limitations, this study lays the groundwork for future research with more representative designs and strengthens the application of SCCT theory in improving student performance and wellbeing. Ultimately, having this adapted instrument contributes to the fulfillment of SDG 4 and the advancement of quality, equity and inclusion in Peruvian higher education, thus fulfilling a central purpose for this work.
Data availability statement
The datasets presented in this study can be found in online repositories. The names of the repository/repositories and accession number(s) can be found below: https://osf.io/p9f37/.
Ethics statement
The studies involving humans were approved by Universidad Privada del Norte Ethics Committee. The studies were conducted in accordance with the local legislation and institutional requirements. Written informed consent for participation in this study was provided by the participants' legal guardians/next of kin.
Author contributions
JV-L: Investigation, Conceptualization, Writing – review & editing, Writing – original draft. CL-C: Methodology, Writing – review & editing, Writing – original draft. ST-M: Writing – review & editing, Writing – original draft, Data curation. GG-M: Writing – review & editing, Writing – original draft, Methodology. JR-C: Investigation, Writing – review & editing, Writing – original draft.
Funding
The author(s) declare that financial support was received for the research and/or publication of this article. The Universidad Privada del Norte will cover the Article Processing Charge (APC) for the publication of this manuscript.
Conflict of interest
The authors declare that the research was conducted in the absence of any commercial or financial relationships that could be construed as a potential conflict of interest.
Generative AI statement:
The author(s) declare that no Gen AI was used in the creation of this manuscript.
Any alternative text (alt text) provided alongside figures in this article has been generated by Frontiers with the support of artificial intelligence and reasonable efforts have been made to ensure accuracy, including review by the authors wherever possible. If you identify any issues, please contact us.
Publisher's note
All claims expressed in this article are solely those of the authors and do not necessarily represent those of their affiliated organizations, or those of the publisher, the editors and the reviewers. Any product that may be evaluated in this article, or claim that may be made by its manufacturer, is not guaranteed or endorsed by the publisher.
References
Abraham, E., Verbruggen, M., and Hirschi, A. (2024). How career and non-work goal progress affect dual earners' satisfaction: a whole-life perspective. J. Career Dev. 51, 164–182. doi: 10.1177/08948453241230907
Aisa, R., Larramona, G., and Pueyo, F. (2019). Poverty in Europe by gender: the role of education and labour status. Econ. Anal. Policy 63, 24–34. doi: 10.1016/j.eap.2019.04.009
Aladini, A., Bayat, S., and Abdellatif, M. S. (2024). Performance-based assessment in virtual versus non-virtual classes: impacts on academic resilience, motivation, teacher support, and personal best goals. Asian-Pacific J. Second Foreign Lang. Educ. 9:5. doi: 10.1186/s40862-023-00230-4
Aliaga, J. (2021). Psicometría. Disciplina de la medición en psicología y educación. Fondo Editorial UIGV.
Awang, Z., Wan Afthanorhan, W. M. A., and Asri, M. A. M. (2015). Parametric and non parametric approach in structural equation modeling (SEM): the application of bootstrapping. Modern Appl. Sci. 9:2015. doi: 10.5539/mas.v9n9p58
Bandura, A. (1986). Social foundations of thought and action: A social cognitive theory. In Social foundations of thought and action: A social cognitive theory. Upper Saddle River, NJ: Prentice-Hall, Inc.
Bardales, E. S., Carrasco Rituay, A. M., Marín, Y. R., Caro, O. C., Fernández, M. T., and Santos, R. C. (2025). Determinants of academic desertion: a case study in a Peruvian university. Power Educ. 1–13. doi: 10.1177/17577438241312617
Brown, S., and Lent, R. (2020). Career Development and Counseling. Hoboken, NJ: Wiley. doi: 10.1002/9781394258994
Brown, T. A. (2015). Confirmatory factor analysis for applied research (2nd ed.). New York: The Guilford Press.
Closas, A. H., Sanz de Acedo, M. L., and Ugarte, M. D. (2011). An explanatory model of the relations between cognitive and motivational variables and academic goals. Revista de Psicodidáctica 16, 19–38. Available online at: https://www.redalyc.org/pdf/175/17517217002.pdf
Compagnucci, L., and Spigarelli, F. (2020). The third mission of the university: a systematic literature review on potentials and constraints. Tech. Forecast. Soc. Change 161:120284. doi: 10.1016/j.techfore.2020.120284
Diener, E. (1984). Subjective well-being. Psychol. Bull. 95, 542–575. doi: 10.1037/0033-2909.95.3.542
Duffy, R. D., and Lent, R. W. (2009). Test of a social cognitive model of work satisfaction in teachers. J. Vocation. Behav. 75, 212–223. doi: 10.1016/j.jvb.2009.06.001
Epskamp, S. (2015). semPlot: Unified visualizations of structural equation models. Struct. Eq. Model. A Multidisc. J. 22, 474–483. doi: 10.1080/10705511.2014.937847
Ferguson, T., and Roofe, C. (2020). SDG 4 in higher education: challenges and opportunities. Int. J. Sustain. High.. Educ. 959–975. doi: 10.1108/IJSHE-12-2019-0353
Fernández-Bringas, T. C., Perez-Martinot, M. R., and Bardales-Mendoza, O. T. (2024). Hacia una mejor comprensión de la validez y confiabilidad en la investigación: apuntes desde el entorno universitario. Spirat. Revista Académica de Docencia y Gestión Universitaria 2, 35–46. doi: 10.20453/spirat.v2i1.5247
Gaeta, M. L., Cavazos, J., Sánchez, A. P., Rosário, P., and Högemann, J. (2015). Propiedades psicométricas de la versión mexicana del Cuestionario para la Evaluación de Metas Académicas (CEMA). Revista Latinoamericana de Psicología 47, 16–24. doi: 10.1016/S0120-0534(15)30002-9
Gaviria, C., and Corredor, J. (2024). Understanding, fast and shallow: Individual differences in memory performance associated with cognitive load predict the illusion of explanatory depth. Memory Cogn. 53, 881-895. doi: 10.3758/s13421-024-01616-6
Gökçe, S., and Güner, P. (2024). Pathways from cognitive flexibility to academic achievement: mediating roles of critical thinking disposition and mathematics anxiety. Curr. Psychol. 43, 18192–18206. doi: 10.1007/s12144-024-05642-0
Goretzko, D., and Bühner, M. (2022). Factor retention using machine learning with ordinal data. Appl. Psychol. Measure. 46, 406–421. doi: 10.1177/01466216221089345
Hu, L., and Bentler, P. M. (1999). Cutoff criteria for fit indexes in covariance structure analysis: Conventional criteria versus new alternatives. Struct. Eq. Model. A Multidiscip. J. 6, 1–55. doi: 10.1080/10705519909540118
Hui, K., Lent, R. W., and Miller, M. J. (2013). Social cognitive and cultural orientation predictors of well-being in Asian American College Students. J. Career Assess. 21, 587–598. doi: 10.1177/1069072712475289
Işik, E., Ulubey, E., and Kozan, S. (2018). An examination of the social cognitive model of well-being in Turkish college students. J. Vocation. Behav. 106, 11–21. doi: 10.1016/j.jvb.2017.11.010
Jara, L., Hilarion, M., and Manzanares, E. (2022). Evidencias de validez y confiabilidad de la Escala de Metas de Estudio (EME) en universitarios peruanos. Revista Argentina de Ciencias Del Comportamiento 14, 23–35. doi: 10.32348/1852.4206.v14.n1.29771
Jia, Q., and Ericson, D. P. (2017). Equity and access to higher education in China: Lessons from Hunan province for university admissions policy. Int. J. Educ. Dev. 52, 97–110. doi: 10.1016/j.ijedudev.2016.10.011
Klug, H. J. P., and Maier, G. W. (2015). Linking goal progress and subjective well-being: a meta-analysis. J. Happiness Stud. 16, 37–65. doi: 10.1007/s10902-013-9493-0
Lent, R. W. (2004). Toward a unifying theoretical and practical perspective on well-being and psychosocial adjustment. J. Counsel. Psychol. 51, 482–509. doi: 10.1037/0022-0167.51.4.482
Lent, R. W., Brown, S. D., and Hackett, G. (1994). Toward a unifying social cognitive theory of career and academic interest, choice, and performance. J. Vocat. Behav. 45, 79–122. doi: 10.1006/jvbe.1994.1027
Lent, R. W., Nota, L., Soresi, S., Ginevra, M. C., Duffy, R. D., and Brown, S. D. (2011). Predicting the job and life satisfaction of Italian teachers: Test of a social cognitive model. J. Vocat. Behav. 79, 91–97. doi: 10.1016/j.jvb.2010.12.006
Lent, R. W., Singley, D., Sheu, H.-B., Schmidt, J. A., and Schmidt, L. C. (2007). Relation of social-cognitive factors to academic satisfaction in engineering students. J. Career Assess. 15, 8797. doi: 10.1177/1069072706294518
Lent, R. W., Taveira, M. do C., Figuera, P., Dorio, I., Faria, S., and Gonçalves, A. M. (2017). Test of the social cognitive model of well-being in spanish college students. J. Career Assess. 25, 135–143. doi: 10.1177/1069072716657821
Lent, R. W., Taveira, M. do C., Pinto, J. C., Silva, A. D., Blanco, Á., Faria, S., et al. (2014). Social cognitive predictors of well-being in African college students. J. Vocat. Behav. 84, 266–272. doi: 10.1016/j.jvb.2014.01.007
Lent, R. W., Taveira, M. do C., Sheu, H-.B, and Singley, D. (2009). Social cognitive predictors of academic adjustment and life satisfaction in Portuguese college students: a longitudinal analysis. J. Vocat. Behav. 74, 190–198. doi: 10.1016/j.jvb.2008.12.006
Li, C. H. (2016). Confirmatory factor analysis with ordinal data: comparing robust maximum likelihood and diagonally weighted least squares. Behav. Res. Met. 48, 936–949. doi: 10.3758/s13428-015-0619-7
Lloret-Segura, S., Ferreres-Traver, A., Hernández-Baeza, A., and Tomás-Marco, I. (2014). El análisis factorial exploratorio de los ítems: Una guía práctica, revisada y actualizada. Anales de Psicología 30, 1151–1169. doi: 10.6018/analesps.30.3.199361
McDonald, R. P. (2013). Test theory: A unified treatment. East Sussex: Psychology Press. doi: 10.4324/9781410601087
Medrano, L. A., Fernández Liporace, M., and Pérez, E. (2017). Sistema de Evaluación Informatizado de la Satisfacción Académica para Estudiantes Universitarios de Primer Año. Electr. J. Res. Educ. Psychol. 12, 541–562. doi: 10.25115/ejrep.33.13131
Mendo-Lázaro, S., León-del-Barco, B., Polo-del-Río, M.-I., and López-Ramos, V. M. (2022). The impact of cooperative learning on university students' academic goals. Front. Psychol. 12:787210. doi: 10.3389/fpsyg.2021.787210
Ministerio de Educación del Perú (2021). Tasa de deserción en educación universitaria se redujo a 11.5%. Plataforma del Estado Peruano. Available online at: https://www.gob.pe/institucion/minedu/noticias/552273-tasa-de-desercion-en-educacion-universitaria-se-redujo-a-11-5
Moshagen, M., and Bader, M. (2023). semPower: general power analysis for structural equation models. Behav. Res. Met. 56, 2901–2922. doi: 10.3758/s13428-023-02254-7
Nájera Saucedo, J., Salazar Garza, M. L., Vacío Muro, M. de los Á., and Morales Chainé, S. (2020). Evaluación de la autoeficacia, expectativas y metas académicas asociadas al rendimiento escolar. Revista de Investigación Educativa 38, 435–452. doi: 10.6018/rie.350421
Oliveira, T., Nada, C., and Magalhães, A. (2025). Navigating an academic career in marketized universities: mapping the international literature. Rev. Educ. Res. 95, 255–292. doi: 10.3102/00346543231226336
Pérez Hernández, A. F., Méndez Sánchez, C. J., Pérez Arellano, P., and García Sastré, J. A. (2017). Los programas de estudio en la educación superior: Orientaciones para su elaboración. Perspectivas Docentes, 62, 21–31. doi: 10.19136/pd.a0n62.1864
Quincho Apumayta, R., Carrillo Cayllahua, J., Ccencho Pari, A., Inga Choque, V., Cárdenas Valverde, J. C., and Huamán Ataypoma, D. (2024). University Dropout: a systematic review of the main determinant factors (2020-2024). F1000Research 13:942. doi: 10.12688/f1000research.154263.2
Rahman, A. A., Setyarini, S., and Purnawarman, P. (2024). Metacognitive awareness and learning and performance goals as key predictors of writing performance. Multidiscipl. Rev. 7:2024302. doi: 10.31893/multirev.2024302
Raykov, T., and Marcoulides, G. A. (2006). A First Course in Structural Equation Modeling (2nd ed.). Mahwah, NJ: Lawrence Erlbaum Associates.
Rebecchi, K., Todd, L., and Hagège, H. (2024). Teaching responsible creativity: a path to ethical innovation. Disc. Educ. 3:103. doi: 10.1007/s44217-024-00164-0
Revelle, W. (2021). psych: Procedures for Psychological, Psychometric, and Personality Research. Computer software. Comprehensive R Archive Network (CRAN). Available online at: https://CRAN.R-project.org/package=psych
Rodríguez Pulido, J., Artiles Rodríguez, J., and Aguiar Perera, M. V. (2021). Validación de un cuestionario para la evaluación del aprendizaje en el alumno universitario. Contextos Educativos. Revista de Educación. 28, 105–127. doi: 10.18172/con.4504
Rodriguez-Rodriguez, A. M., De la Fuente-Costa, M., Escalera de la Riva, M., Perez-Dominguez, B., Hernandez-Sanchez, S., Paseiro-Ares, G., et al. (2025). Spanish language version of the “Medical Quality Video Evaluation Tool” (MQ-VET): Cross-cultural AI-supported adaptation and validation study. Sci. Prog. 108:00368504251327507. doi: 10.1177/00368504251327507
Rosseel, Y. (2012). lavaan: An {R} package for structural equation modeling and more. J. Statis. Soft. 48, 1–36. doi: 10.18637/jss.v048.i02
Savalei, V., and Reise, S. P. (2019). Don't forget the model in your model-based reliability coefficients: a reply to McNeish (2018). Collabra: Psychol. 5:36. doi: 10.1525/collabra.247
Seminara, M. P. (2021). De los efectos de la pandemia COVID−19 sobre la deserción universitaria: desgaste docente y bienestar psicológico estudiantil. Revista Educación Superior y Sociedad (ESS) 33, 402–421. doi: 10.54674/ess.v33i2.360
Sheu, H.-B., and Bordon, J. J. (2016). SCCT research in the international context: empirical evidence, future directions, and practical implications. J. Career Assess. 25, 58–74. doi: 10.1177/1069072716657826
Sheu, H.-B., Dawes, M. E., and Chong, S. S. (2022). Social self-efficacy, outcome expectations, and goal progress among American college students: testing temporal relations by gender and race/ethnicity. Counsel. Psychol. Quart. 36, 549–570. doi: 10.1080/09515070.2022.2142199
Sheu, H.-B., Lent, R. W., Brown, S. D., Miller, M. J., Hennessy, K. D., and Duffy, R. D. (2010). Testing the choice model of social cognitive career theory across Holland themes: a meta-analytic path analysis. J. Vocat. Behav. 76, 252–264. doi: 10.1016/j.jvb.2009.10.015
Silva-Laya, M., D'Angelo, N., García, E., Zúñiga, L., and Fernández, T. (2020). Urban poverty and education. A systematic literature review. Educ. Res. Rev. 29:100280. doi: 10.1016/j.edurev.2019.05.002
Silvera, D. H., Martinussen, M., and Dahl, T. I. (2001). The Tromsø Social Intelligence Scale, a self-report measure of social intelligence. Scand. J. Psychol. 42, 313–319. doi: 10.1111/1467-9450.00242
Sloan-Lynch, J., and Morse, R. (2024). Equity-forward learning analytics: designing a dashboard to support marginalized student success. Proceed. Learn. Anal. Knowled. Conf. 1–11. doi: 10.1145/3636555.3636844
Superintendencia Nacional de Educación Superior Universitaria (2021). III informe bienal sobre la realidad universitaria en el Perú. Available online at: https://cdn.www.gob.pe/uploads/document/file/3018068/IIIInforme~Bienal.pdf (Accessed June 7, 2025).
Tabachnick, B. G., and Fidell, L. S. (2019). Using Multivariate Statistics (7th ed.). London: Pearson.
Valle, A., Cabanach, R. G., Rodríguez, S., Núñez, J. C., and González-Pienda, J. A. (2006). Metas académicas, estrategias cognitivas y estrategias de autorregulación del estudio. Psicothema 18, 165–170. Available online at: https://www.psicothema.com/pdf/3193.pdf
Valle, A., Rodríguez, S., Cabanach, R. G., Núñez, J. C., González-Pienda, J. A., and Rosario, P. (2009). Metas académicas: perspectiva histórica y conceptual e implicaciones educativas. Electr. J. Res. Educ. Psychol. 7, 1073–1106.
Ventura-León, J. (2024). IRTools (Versión 1.0) [Software]. GitHub. Available online at: https://github.com/jventural/IRTools
Ventura-León, J. (2025). Optimal Factor [Software]. GitHub. Available online at: https://github.com/jventural/OptimalFactor
Ventura-León, J., and Caycho-Rodríguez, T. (2017). El coeficiente Omega: Un método alternativo para la estimación de la confiabilidad. Revista Latinoamericana de Ciencias Sociales, Niñez y Juventud 15, 625–627. Available online at: https://www.redalyc.org/pdf/773/77349627039.pdf
Weng, X., Xia, Q., Chiu, T. K. F., and Wan, Z. (2025). Satisfying higher education students' psychological needs through case-based instruction for fostering creativity and entrepreneurship. Human. Soc. Sci. Commun. 12:292. doi: 10.1057/s41599-025-04597-2
Zalazar-Jaime, M. F., and Cupani, M. (2018a). Adaptación de las escalas de expectativas de resultado, metas de progreso y satisfacción académica en estudiantes universitarios. Revista Electrónica de Investigación Educativa 20, 105–114. doi: 10.24320/redie.2018.20.3.1675
Zalazar-Jaime, M. F., and Cupani, M. (2018b). Adaptation of outcome expectations, progress goals and academic satisfaction scales in college students. Revista Electronica de Investigacion Educativa 20, 105–114.
Zickafoose, A., Ilesanmi, O., Diaz-Manrique, M., Adeyemi, A. E., Walumbe, B., Strong, R., et al. (2024). Barriers and challenges affecting quality education (Sustainable Development Goal #4) in Sub-Saharan Africa by 2030. Sustainability 16, 1–16. doi: 10.3390/su16072657
Appendix A
Academic Progress Goals Scale (AGPS)
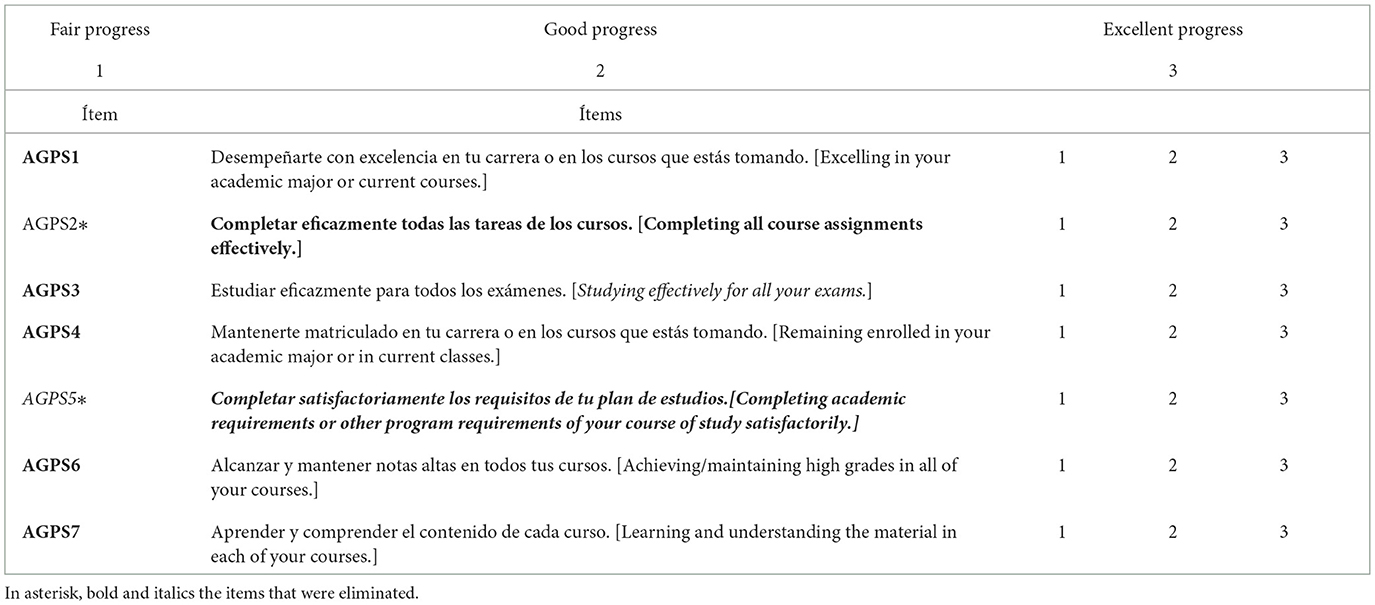
Instructions: Read each statement and select the option that best describes your academic progress in recent months. There are no right or wrong answers; mark the option that best reflects your personal perception.
Keywords: academic goals, psychometric validation, university students, goal setting theory, structural equation modeling
Citation: Ventura-León J, Lino-Cruz C, Tocto-Muñoz S, Gamboa-Melgar G and Ruiz-Castro J (2025) Cultural adaptation and psychometric validation of the academic progress goals scale for Peruvian university students. Front. Educ. 10:1661179. doi: 10.3389/feduc.2025.1661179
Received: 07 July 2025; Accepted: 15 September 2025;
Published: 22 October 2025.
Edited by:
Rolando Salazar Hernandez, Universidad Autónoma de Tamaulipas, MexicoReviewed by:
Erkan Isik, Istanbul Aydin University, TürkiyeZainul Anwar, Universitas Muhammadiyah Malang, Indonesia
Copyright © 2025 Ventura-León, Lino-Cruz, Tocto-Muñoz, Gamboa-Melgar and Ruiz-Castro. This is an open-access article distributed under the terms of the Creative Commons Attribution License (CC BY). The use, distribution or reproduction in other forums is permitted, provided the original author(s) and the copyright owner(s) are credited and that the original publication in this journal is cited, in accordance with accepted academic practice. No use, distribution or reproduction is permitted which does not comply with these terms.
*Correspondence: José Ventura-León, am9zZS52ZW50dXJhQHVwbi5wZQ==