 Rahul Choudhary
 Maria Parappilly
 Richard Woodman
- 1College of Science and Engineering, Flinders University, Adelaide, SA, Australia
- 2College of Medicine and Public Health, Flinders University, Adelaide, SA, Australia
The underrepresentation of women in university science programs highlights the need to understand factors influencing schoolgirls’ Science, Technology, Engineering, and Mathematics (STEM) career choices. We applied the socio-cognitive career theory (SCCT) model and a structured STEM enrichment framework to design a three-day intervention for Grade 9 female students. The intervention included presentations by female role models, hands-on STEM workshops, and industry immersion tours. This study explored the students’ aspirations and perceptions toward STEM as an educational subject and/or career, both before and after their exposure to the intervention. Data were obtained via structured and unstructured career interest surveys. Analyses included association analysis and factor analysis of quantitative data, and thematic analysis of qualitative data for N = 337 subjects. Factor analysis revealed “Barriers and Enablers” and “STEM Career Interest” as two key constructs driving the observed changes. Confidence in STEM abilities (factor loadings >0.70) and financial concerns (0.78) emerged as strong influences in the first group, while high loadings for enjoyment of STEM careers (0.84) and interest in further STEM studies (0.72) were observed in the second. Engineering and sustainability workshops were particularly effective in increasing interest in STEM careers. The thematic analysis provided complementary findings suggesting that a multifaceted approach is required to fully understand the reasons for improving confidence and aspirations toward STEM as a career. These findings suggest that barriers to participation are diverse but can be addressed through well-designed STEM enrichment activities, which effectively increase interest in STEM careers among 13–14-year-old girls.
1 Introduction
Participation in STEM majors in higher education in Australia has declined over the years (Australian Government Department of Education, 2023), leading to a significant underrepresentation of women in STEM careers. Data for 2024 from the Australian Government Department of Science and Industry Equity Monitor show that only 37% of STEM enrolments in Australian universities are among women, and only 15% of STEM-qualified jobs in Australia are held by women. These gaps are acute in physics, engineering, and Information Technology (IT), with only 23–25, 22–26, and 16–22% of enrolments for physics, engineering, and technology, and IT, respectively, being women from 2013 to 2023.
Research suggests that girls’ attitudes and interests toward STEM careers are shaped by a range of “social” and “environmental” factors (Hill et al., 2010; Wang et al., 2022; Damodar et al., 2024). Charlesworth and Banaji (2019) explain how biological and sociocultural influences on perceived STEM abilities create disparities in STEM. Further, explicit and implicit workplace biases diminish women’s perceptions and confidence in their work.
One key factor is the persistence of gendered stereotypes in STEM education, which affects students’ self-perceptions, interests in STEM, and aspirations for STEM careers (Wegemer and Eccles, 2019; Eaton et al., 2019; Makarova et al., 2019; Starr and Simpkins, 2021; Sebastián-Tirado et al., 2023). In particular, the perception of science as a “masculine domain” can discourage girls from pursuing STEM (Cheryan et al., 2017; Sebastián-Tirado et al., 2023).
Another challenge relates to bias and representation. The absence of female role models (Middlecamp and Subramaniam, 1999), the prevalence of male-dominated school pedagogy (Blickenstaff, 2005), societal pressures conforming to gendered roles (Reinking and Martin, 2018), and entrenched unconscious bias in STEM (Piloto, 2023) contribute to limiting girls’ participation. Empirical studies reinforce this: in their study involving Irish university students (N = 70; 33 women, 37 men), Farrell and McHugh (2020) found gender bias among participants favoring men in STEM fields. Similarly, among 40 women and 39 men, Nosek and Banaji (2002) observed differences in attitudes toward math and science, with female participants displaying more negative attitudes toward mathematics and science than arts and language. Together, these studies underline the persistence of gendered biases within STEM, even among women.
Therefore, it is important to improve girls’ confidence and self-efficacy in STEM, particularly among middle-school female students. This phase represents an inflection point in their educational trajectory, when they “begin to think” about their future career paths (Tai et al., 2006; Maltese and Tai, 2009). During this stage, students develop their sense of identity and aspirations toward STEM (McDonald, 2016; Australian Government Department of Education, 2025). Moreover, it is during the middle-school years until the age of 14 (~Grade 9) that girls’ attitudes toward STEM start to decline sharply (Murphy and Beggs, 2005; Tai et al., 2006; Lindahl, 2007; Christidou, 2011; McDonald, 2016).
Despite policy efforts, women remain underrepresented in STEM in Australia, highlighting the persistence of the leaky pipeline. Intervening at middle-school is critical, as students in Grades 9–10 make subject selections that shape future STEM pathways. By focusing on this stage, our study addresses a gap in existing interventions that often target senior secondary or tertiary levels. The novelty of this study lies in its design: a multi-component enrichment model combining role model engagement, hands-on workshops, and industry immersion, specifically aimed at early adolescence. The primary aims of the study were, therefore, to:
A. Determine current career interest in STEM among Grade 9 girls.
B. Determine the socio-cognitive factors that shape Australian Grade 9 school girls’ perceptions and interest in STEM studies and careers.
C. Determine the potential of 3-day STEM-intensive enrichment activities to improve Grade 9 girls’ self-efficacy, confidence, and interest in STEM.
2 Theoretical framework
We employed the SCCT model to interpret the factors that shape girls’ career aspirations and confidence. It is a widely applied framework for studying student aspirations and career trajectories across the world (e.g., Tang et al., 2008; Inda et al., 2013; Zhang et al., 2019; Gibbons et al., 2020; Mwaura, 2020; Wang et al., 2023). Derived from Albert Bandura’s Social Cognitive Theory (1986), it states how factors such as self-efficacy, outcome expectations, and personal goals (Wang et al., 2022) interact with environmental factors to shape a person’s career interests (Figure 1).
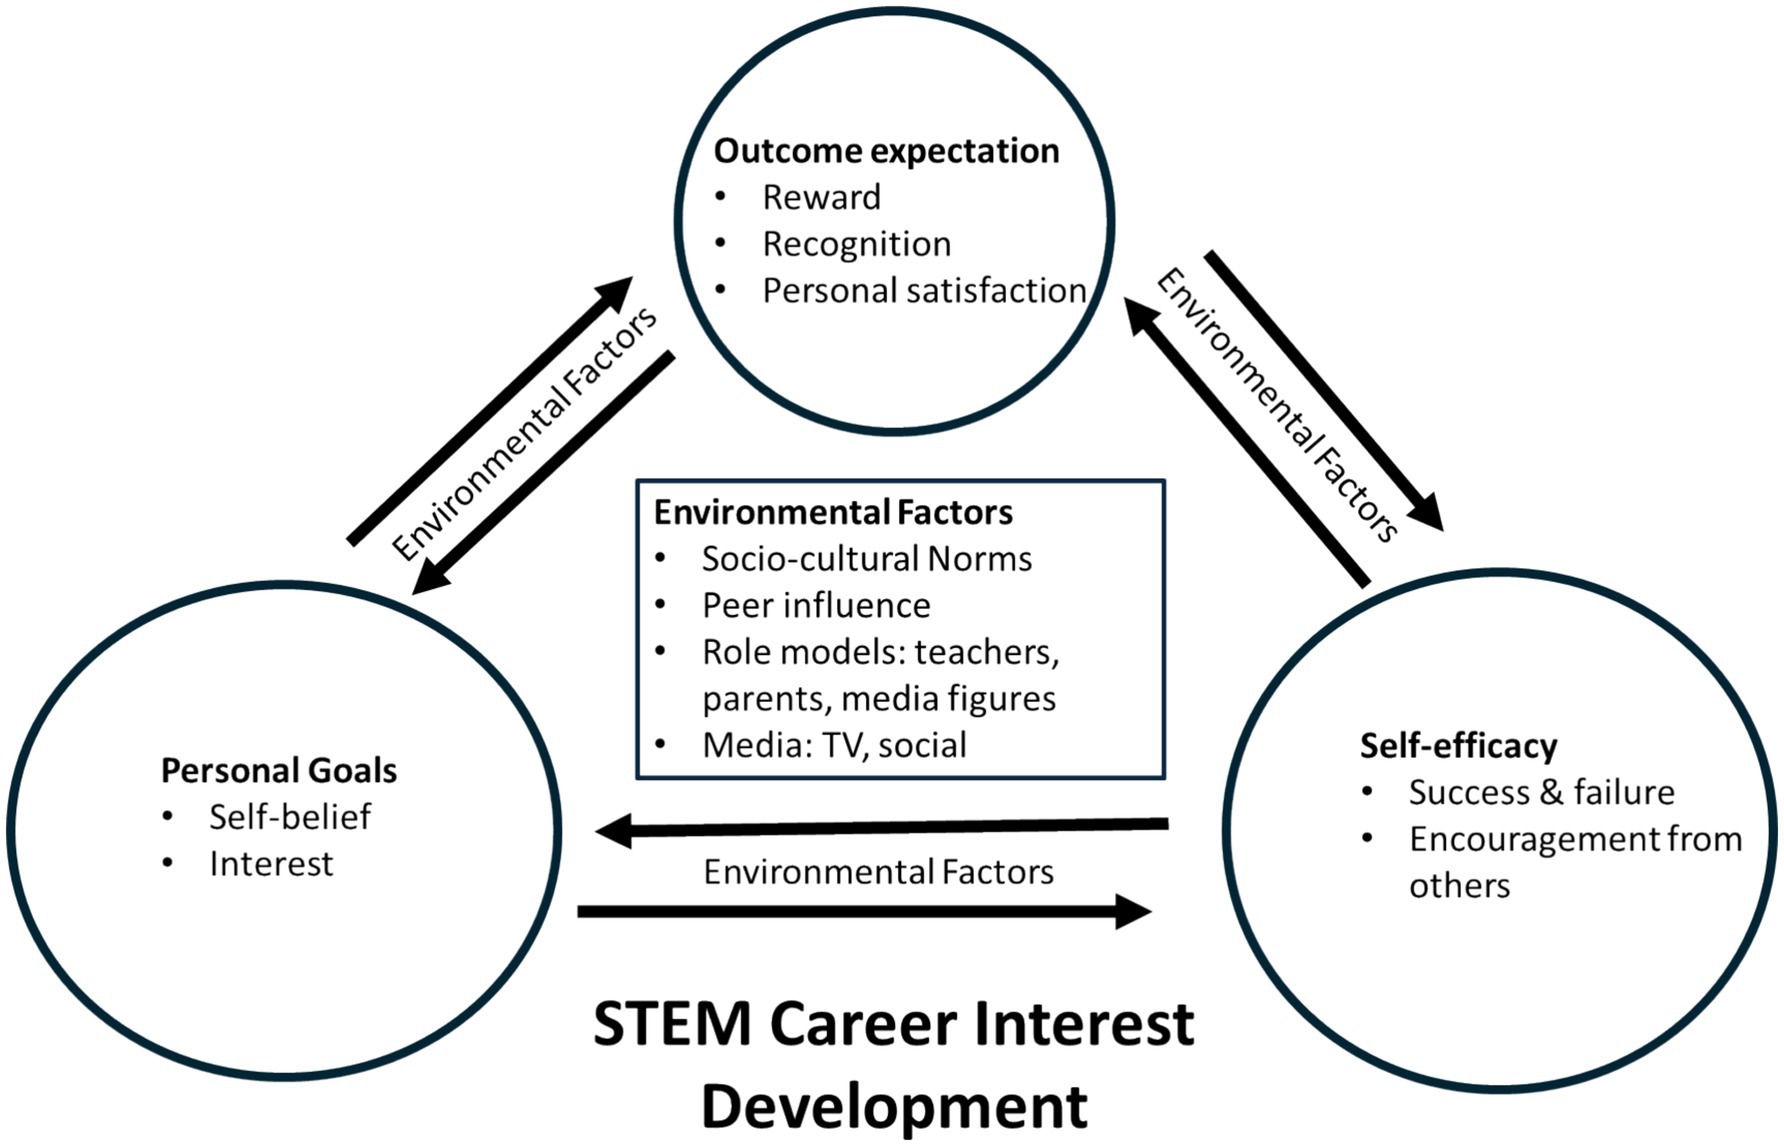
Figure 1. Factors that influence STEM career interest (adapted from Bandura, 1986, 2001; Lent et al., 1994).
In SCCT, self-efficacy pertains to an individual’s conviction in their capacity to succeed. For example, positive experiences such as achieving success through constructive feedback and support from educators and parents can enhance the self-efficacy and confidence of a student. This can lead to greater engagement and achievement in science and the overall improvement in attitude toward the subject. Research studies have obtained empirical evidence that favors this notion. Boaler et al. (2021) demonstrated that a novel “mathematical mindset approach” to teaching and learning enhanced middle-school students’ self-efficacy in math. Similarly, Tang et al. (2008) found that practical learning activities can play a key role in improving girls’ self-efficacy.
Outcome expectations define the anticipated benefits or rewards that motivate individuals to work toward a goal. For instance, seeing peers or role models receive praise or recognition can inspire others to adopt similar behaviors. Gladstone and Cimpian (2021) found that exposure to role models can have a broad and positive effect on students’ attitudes, especially among those from traditionally underrepresented groups.
Personal goals refer to an individual’s determination to achieve a certain task or performance level, such as earning a university degree or achieving a desired grade in an academic subject. These goals are intimately linked to self-efficacy and outcome expectations. Research supports this connection. For example, Myint and Robnett (2023) found a significant correlation between academic motivation and career choices in their study on students (N = 629) from an Eastern American demographic. Similarly, Arhin (2018) posits that a person’s belief in their ability to accomplish a task and the anticipated results directly influence their personal goals, thereby determining an individual’s career aspirations.
Lastly, the environmental factors signify the process whereby a student’s behavior or attitude toward a subject is influenced by observational learning, such as observing their parents, teachers, and peers, and the media. For example, Devi et al. (2016) interviewed Australian parents and educators to develop strategies for effective STEM enrichment programs for school students. One of their findings revealed that students from mining communities were more inclined to pursue a career in mining because of the observational learning from their environment.
Our program development adopted the logical framework approach by Devi et al. (2016) to implement STEM enrichment programs across Australian Grade 7–10 schools. This framework emphasizes four key principles for designing an effective enrichment program as outlined in Table 1. First, it advocates for building students’ confidence and self-esteem through interactive, inquiry-based, and problem-solving activities. Second, it recommends that programs need to align with the school curriculum. Third, it suggests incorporating informal learning experiences and industry engagement into the program. Lastly, it underlines the importance of having a strong connection between the objectives and outcomes of the enrichment programs to ensure their effectiveness.
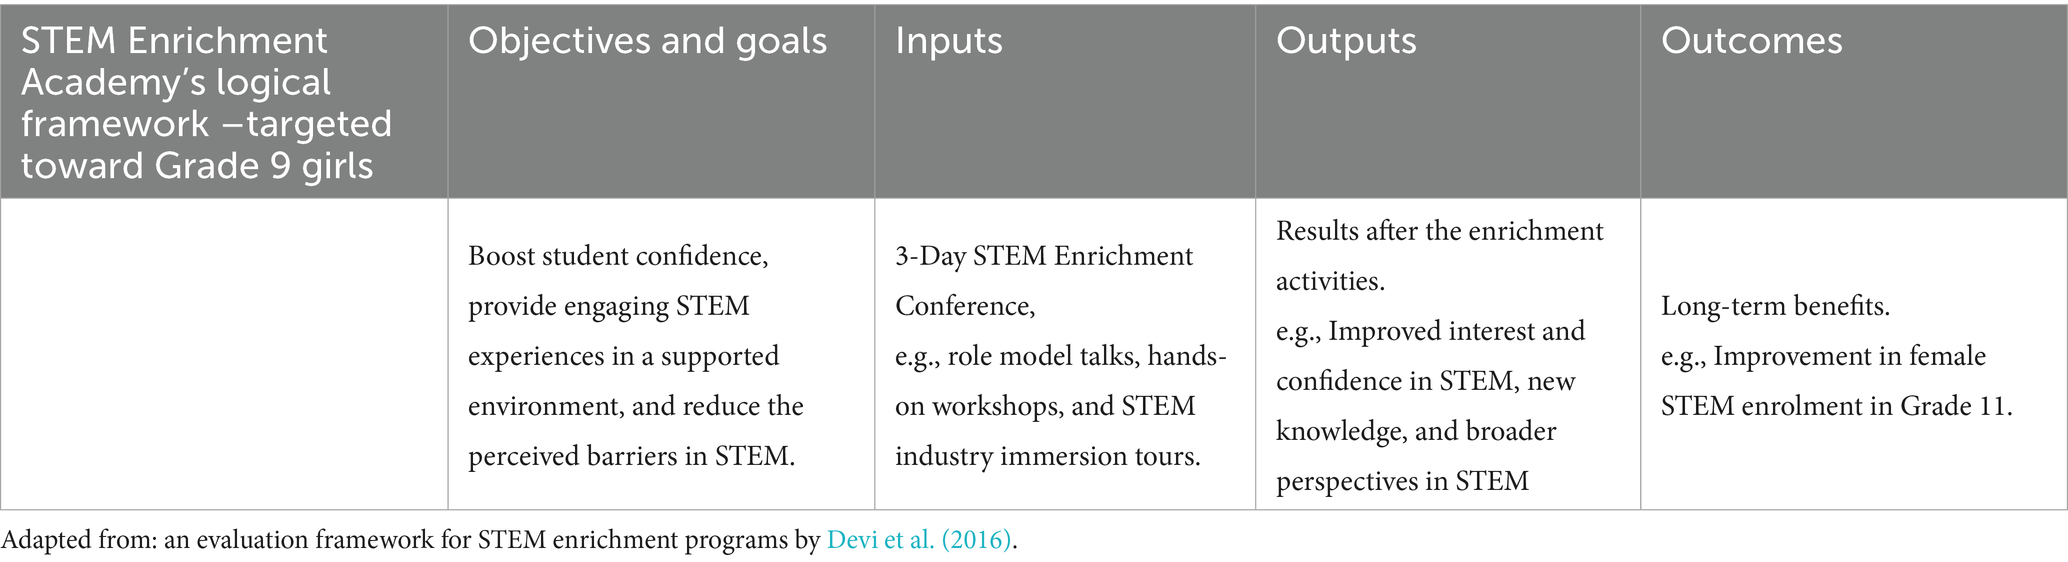
Table 1. Logical frameworks for designing STEM enrichment programs.
Because our aims mirror these principles, the framework provides an evidence-based structure for the development and evaluation of our program. By mapping our objectives, inputs, outputs, and outcomes to the Devi et al. model (Table 1), we ensure methodological rigor and comparability by testing it in another Australian cohort.
3 Methods
The research design draws on a mixed-methods approach (see Figure 2 for an overview), combining a pre- and post-intervention design with the triangulation of quantitative survey data and qualitative results to minimize any limitations associated with the absence of a control group.
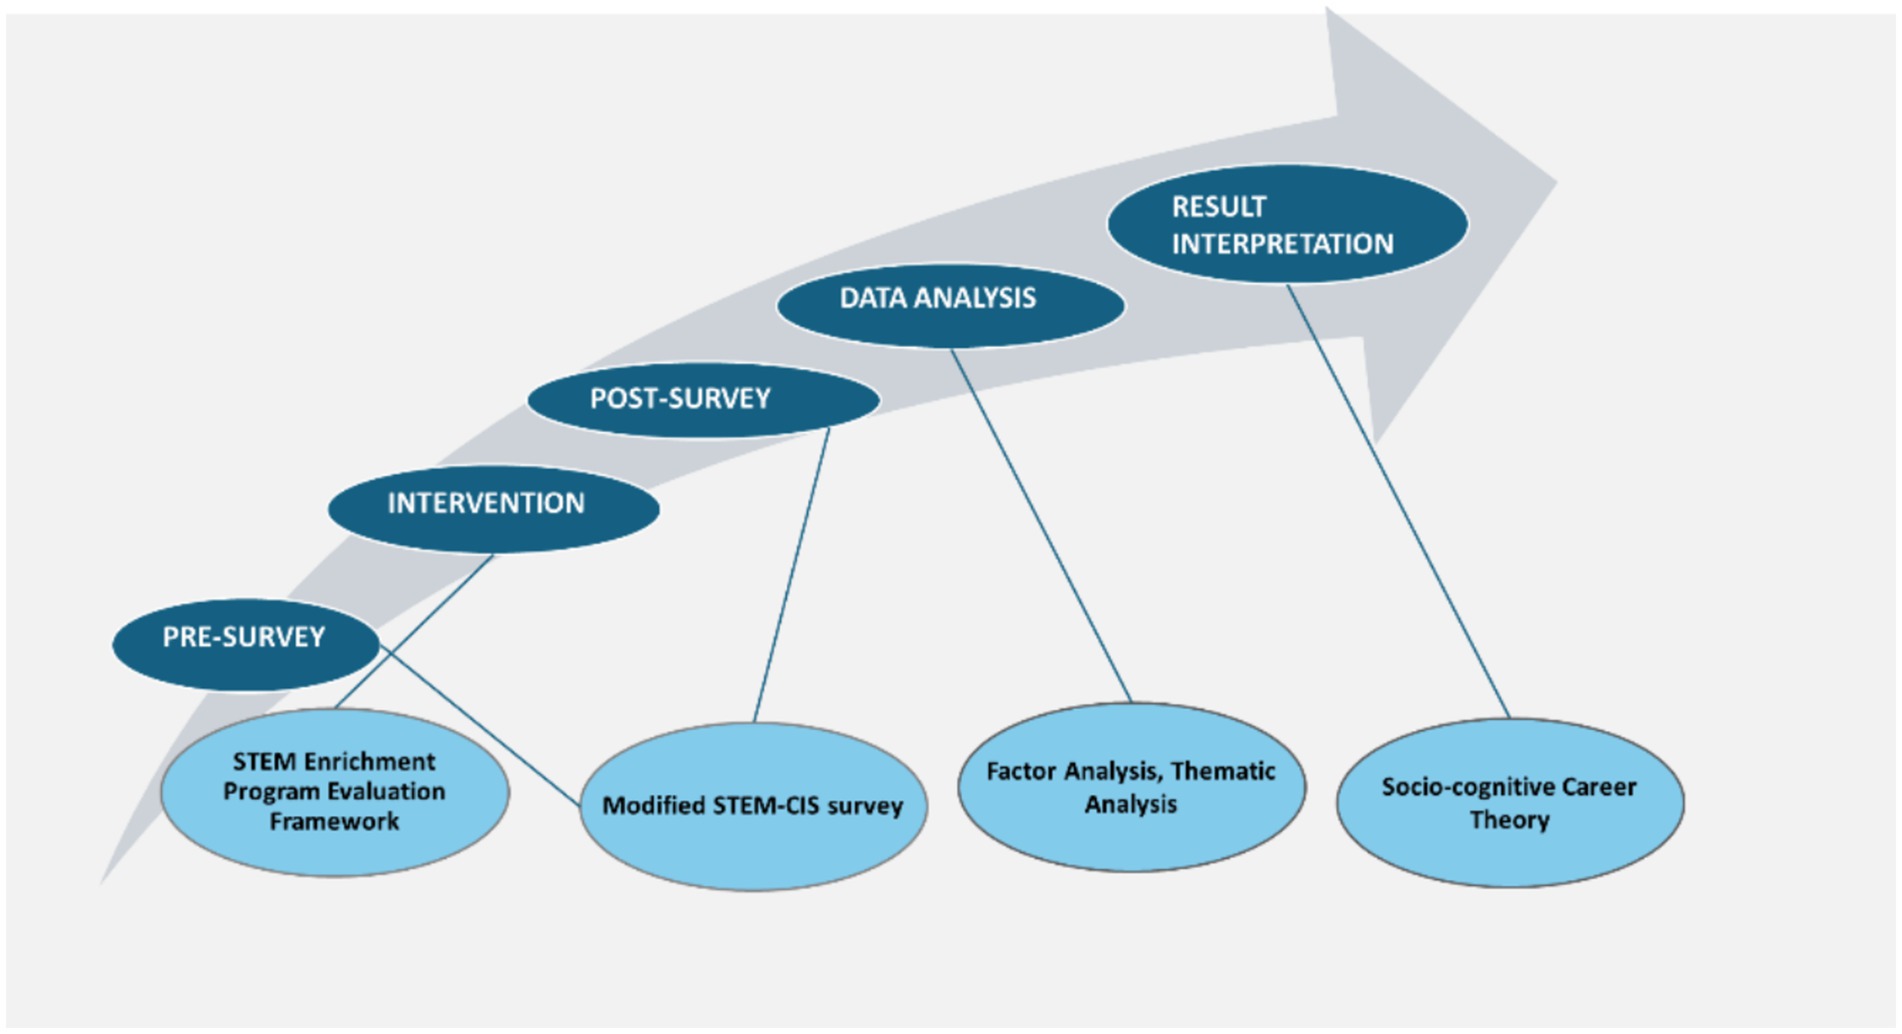
Figure 2. Research methods underpinned by the intersection of relevant methodological frameworks as informed by Devi et al. (2016), Kier et al. (2013), Braun and Clarke (2006, 2022), Kline (2013), Bandura (1986, 2001), and Lent et al. (1994).
3.1 The STEM-enrichment academy program
This phase II study was conducted building upon the success of the Australian Government-funded Phase I of STEM Enrichment Academy (STEM-EA) in increasing Grade 9 girls’ STEM interest. Specifically, STEM-EA provides an engaging STEM experience in a supported environment for girls to reduce perceived barriers in STEM and boost their confidence. The enrichment activities include monthly one-day STEM enrichment workshops and a three-day annual STEM enrichment conference.
Given the program exclusively targets Grade 9 girls to motivate them to pursue STEM subjects upon entering Grades 10 and 11, running a control group study without offering an enrichment program to a separate cohort would have conflicted with the project’s goal of providing equal opportunity to all students.
Hence, the three-day STEM Enrichment Conference held in 2023 and 2024 served as the interventions in this study to measure the impact of the annual conference on improving participants’ self-efficacy and confidence in STEM studies and determining their interest in STEM careers. The components of the conference were identical in each year, which is briefly explained below.
3.1.1 Role models
During each conference, several presentations and Women in STEM Breakfast/Brunch events were held to showcase more than 15 inspiring female role models. The role model sessions were aimed at boosting girls’ confidence in STEM, especially those from low socioeconomic backgrounds. Therefore, the role model speakers were scientists and/or researchers in STEM from diverse backgrounds. Each presenter highlighted the vast potential of STEM careers and shared their stories of overcoming challenges and building successful STEM careers.
3.1.2 Workshops
Each conference held 12 hands-on workshops at State-of-the-art University facilities. The workshops covered a range of topics in physics, engineering, chemistry, technology, sustainability, IT, and cybersecurity, complemented by networking opportunities allowing participants to gain practical insights. Delivery was by university faculty members as well as external presenters from government research institutes.
3.1.3 Industry immersion tours
The industry immersion tours were led by professionals in cutting-edge industry facilities related to automation and advanced technologies in space and defense. The tours enabled girls to broaden their perspectives and experience the real-world applications of STEM.
3.2 Participants
All study participants were Grade 9 girls from metropolitan and regional areas of South Australia (SA) and the Northern Territory (NT) in Australia. A survey information sheet outlining the purpose and procedure of the study was provided to participants and their teachers, and guardians. Consent from participants was obtained before administering the surveys, and it was explained that their participation was entirely voluntary. No participant names or explicit identifiers were recorded.
Participants were from a mixed cohort of public and private schools in SA and NT, selected by the schools or teachers. Each school used its own methods and assessment criteria for selecting suitable girls for attendance. For example, some students were “hand-picked” by their teachers, and some were chosen through their own writing exercises. Low-SES in this study was inferred using school type and location. Public and regional schools typically score lower on the ICSEA compared with metropolitan independent schools (Larsen and Rowe, 2024). Therefore, participants recruited from these schools (11 out of 15) were considered to be from low-SES backgrounds for the purpose of this study.
This study was approved by the University Human Research Ethics Committee (Project Number: Ethics Approval #: 5997) and was conducted in accordance with the Australian National Statement on Ethical Conduct in Human Research (2007) (updated 2018).
3.3 Survey tool and data collection
Our study explored career interest in STEM among Grade 9 high-school students by using a wide variety of both quantitative and qualitative tools. Data were obtained from a large group of participants who were representative of schools in the region in both 2023 and 2024. Collecting data for the same set of questions both before and after each of the two conferences allowed us to evaluate the potential impact of the conferences on the girls’ attitudes toward studying STEM subjects at school and establishing a career in STEM.
The STEM Career Interest Survey (STEM-CIS), which is based on the SCCT model (Lent et al., 1994; Wang et al., 2022), was used as the research instrument for this study. STEM-CIS is a 5-point Likert scale (strongly disagree = 1, strongly agree = 5) developed by Kier et al. (2013) to measure the career interests and motivation of secondary school students. It consists of four sections (Science, Technology, Engineering, Mathematics) with 11 questions on each topic (see Supplementary Appendix 1). The STEM-CIS was modified to capture additional information related to our research aims.
SCCT (Lent et al., 1994) guided mapping (see Table 2), but the closed vs. open-ended distinction comes from STEM-CIS (Kier et al., 2013). Both closed and open-ended questions (Tables 3, 4). Two questions (I have scientists or engineers in my family, and my family has encouraged me to study STEM subjects) were only included in the pre-conference survey.
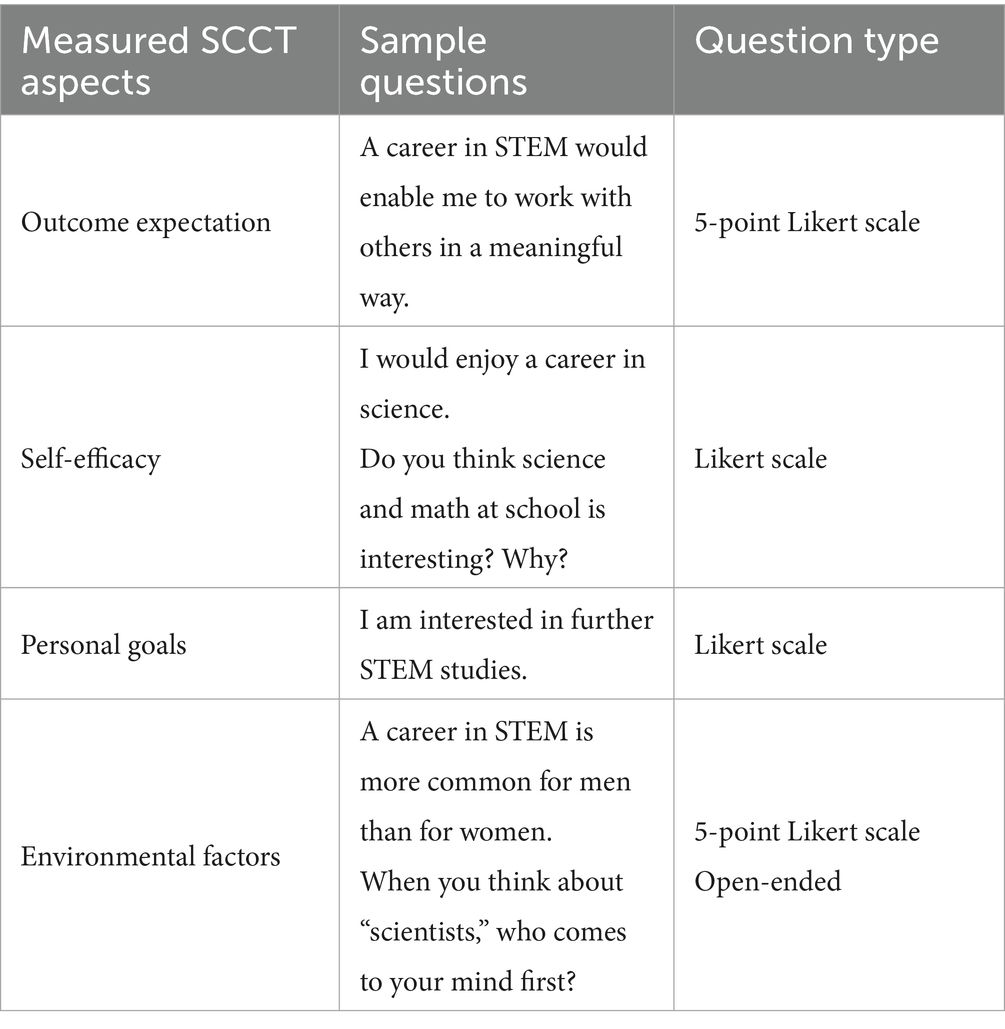
Table 2. Survey questions were aligned to the SCCT.
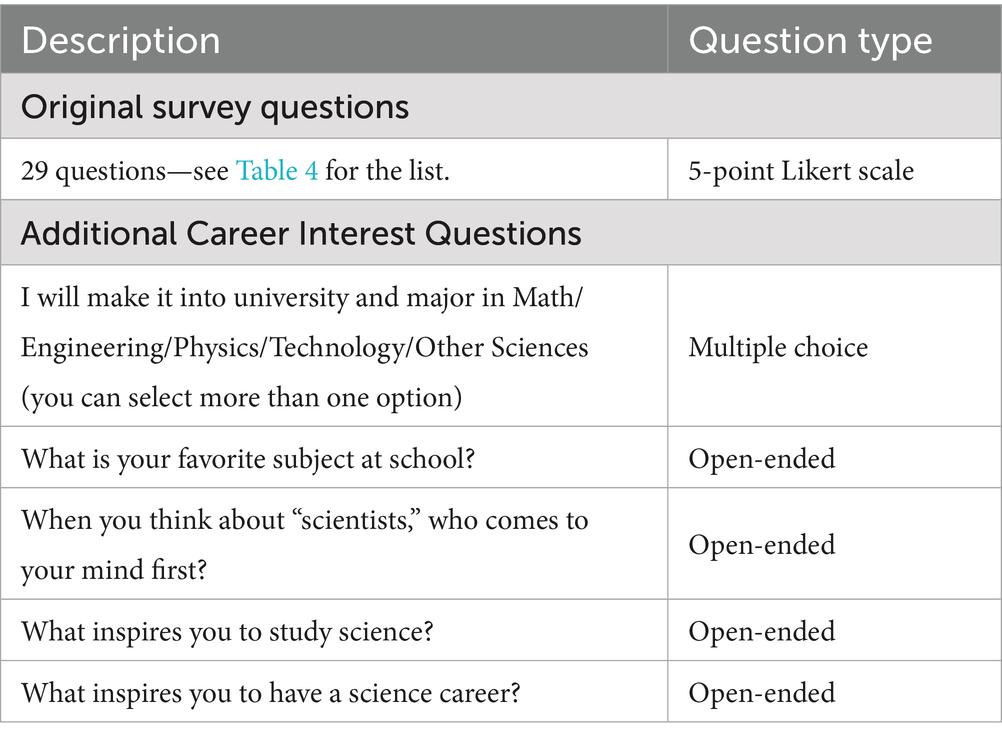
Table 3. Types of questions within the career interest survey.
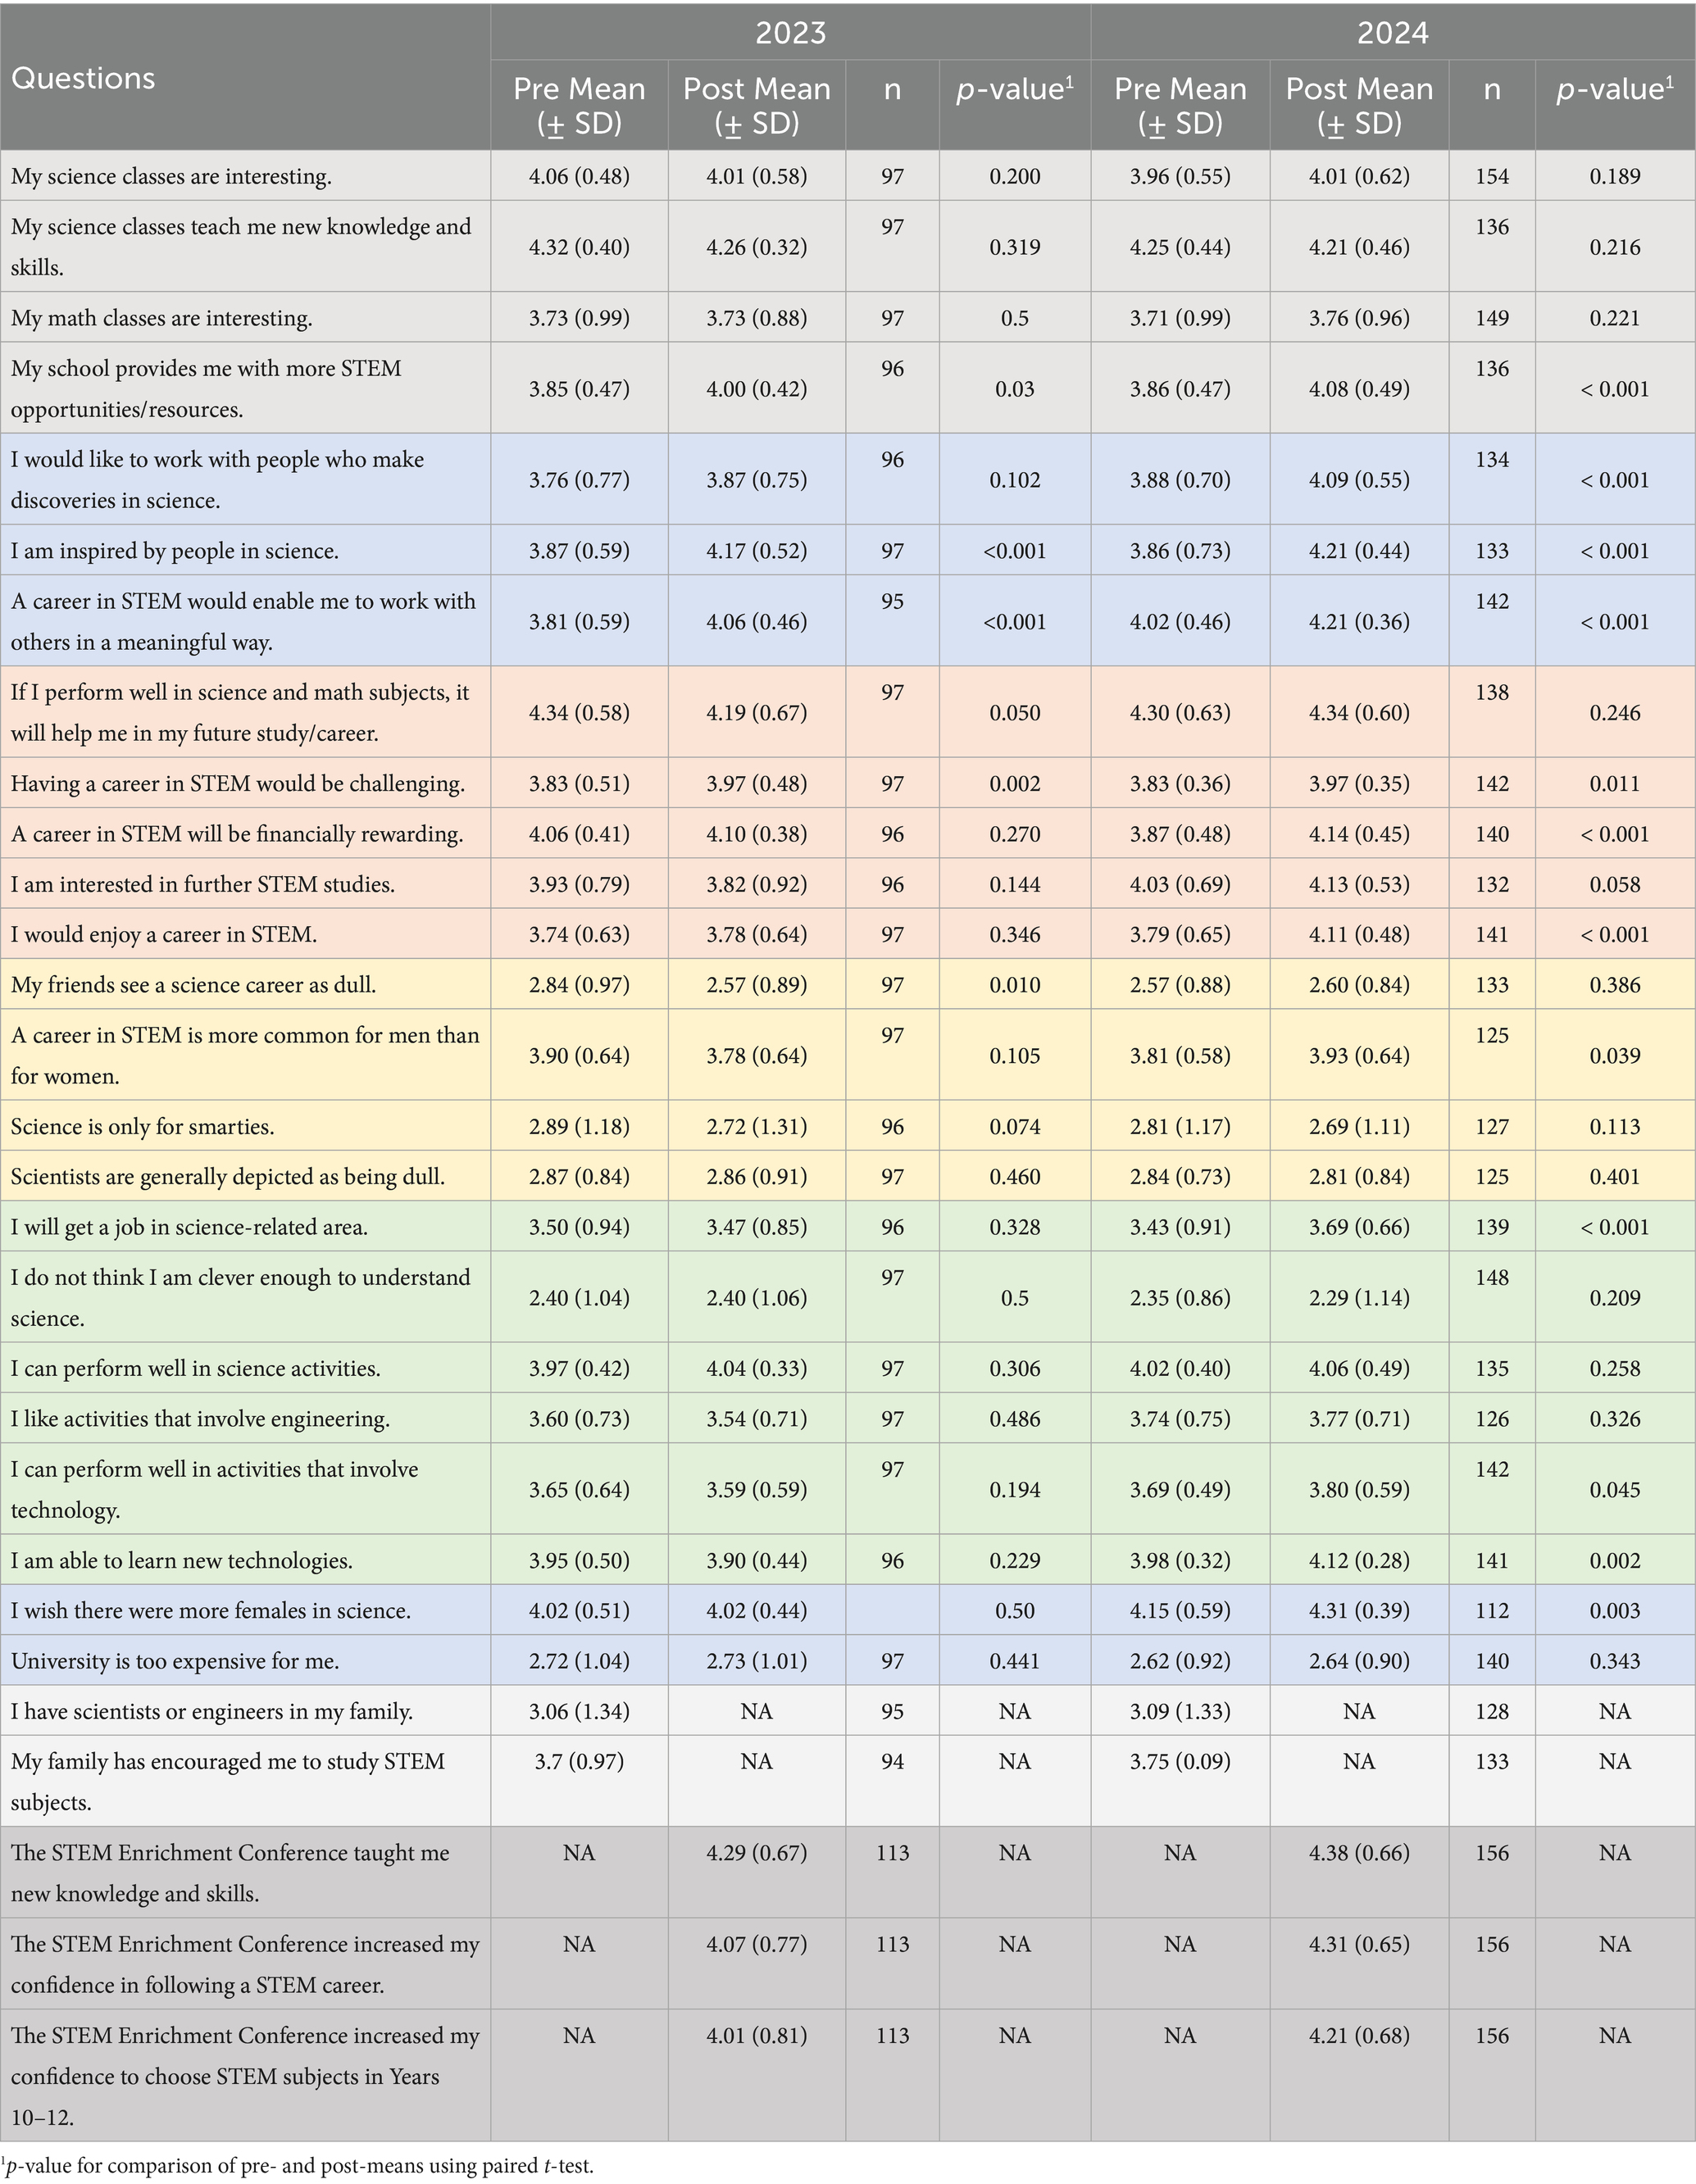
Table 4. Pre- and post-mean scores of participant responses to the modified STEM-CIS survey in a 5-point Likert scale (1 = strongly disagree, 5 = strongly agree).
We adapted SCCT to better reflect the design of our intervention, emphasizing role models, enrichment activities, and contextual influences. While SCCT includes broader constructs, we streamlined the model to align with our survey items and qualitative themes. This adaptation allowed clearer mapping of our findings to the intervention context.
3.3.1 Data collection
The survey was administered to all conference participants a week before and just after they attended the 3-day conference via the online Qualtrics platform. Participants completed the pre-conference survey either in their classroom or at home, depending on the instructions received from their coordinating teachers. The post-conference survey was completed by the participants either at the conference venue or at their schools.
3.4 Data analysis
Prior to analysis, the data were cleaned and processed to ensure consistency and eliminate any outliers. This included checking for missing values and response frequencies, appropriate coding, and identifying unengaged responses through standard deviation analysis (Kothari, 2004). While our design included both quantitative and qualitative data, this study represents a convergent descriptive design rather than a fully integrated mixed-methods approach. The two data types were analyzed in parallel and interpreted together to provide complementary insights.
3.4.1 Likert-scale survey questions
A descriptive analysis of the survey questions was performed using the mean (±SD) for both pre- and post-survey responses. Differences in the mean scores for each question between pre- and post-surveys were assessed using paired t-tests. Analysis was performed using SPSS (Version 29.0) in conjunction with Microsoft Excel. There were missing data from participants who completed only one of the two surveys, so responses from participants who completed both surveys were only considered for analysis. Items were reverse-coded for negatively worded statements.
3.4.2 Factor analysis
In addition to the comparison of means and frequencies for questions in Table 4, we also performed an exploratory factor analysis (EFA) on post-survey responses to explore how students’ perceptions and underlying constructs may have been shaped following their participation in the program.
Prior to EFA, we assessed measures of sampling adequacy using the Kaiser-Meyer-Olkin (KMO) measure (= 0.858) and Bartlett’s test of sphericity (χ2 = 1681.78, df = 276, p < 0.001), confirming the data were suitable for factor analysis (Kline, 2013). Factor extraction was performed using the Principal Axis Factoring method to identify underlying factors, followed by Varimax rotation to maximize interpretability and account for potential correlations among factors.
To retain the appropriate number of factors, we applied the Scree plot and Elbow method (Thorndike, 1953). Factor loadings were examined, with items loading above 0.40 retained, ensuring a meaningful structure. To assess the reliability of the identified factors, Cronbach’s alpha was calculated for each construct, with values above 0.7 considered acceptable for internal consistency. The final factor structure was interpreted based on item content, aligning with key STEM-CIS constructs such as self-efficacy, career interest, and perceptions of STEM fields.
3.4.3 STEM preferences and favorite subjects
Participants’ selections of one or more options between “Math,” “Physics,” “Engineering,” “Technology,” and “Other Sciences” for STEM majors were calculated in percentages. Their choices for favorite subjects were categorized into STEM (e.g., Science, Mathematics) and non-STEM subjects (e.g., Music, Psychology, Arts).
Questions related to the perception of science and scientists (When you think about “scientists”, who comes to your mind first?) were evaluated qualitatively using a Word Cloud from a Microsoft Office Plug-In viz. Pro Word Cloud to visually represent their sentiment emerging from the dataset.
3.4.4 Qualitative evaluation of open-ended questions
The responses to the open-ended questions from the survey were evaluated qualitatively through reflective thematic analysis following the procedure devised by Braun and Clarke (2006, 2022) and exemplified by Byrne (2022). These steps are briefly described as follows:
Step 1: We conducted a thorough reading and re-reading of the entire text to obtain an intimate understanding of the open-ended responses.
Step 2: We developed initial codes by applying semantic coding Byrne (2022) to the text responses by searching for patterns and meaning across the data. In semantic coding, we identify the explicit meaning of the text responses that are relevant to each specific question. This is different from latent coding, where a researcher would attempt to find any hidden meaning within a sentence (Byrne, 2022).
Step 3: We identified initial candidate themes from the generated codes. We examined how different codes could be grouped under a broader umbrella to reflect a common theme or sub-theme. The codes were carefully reviewed and analyzed to determine whether they converged toward an overarching meaning (sub-theme). These sub-themes were developed by organizing the codes around a central commonality or a “central organizing concept” (Braun and Clarke, 2019), outlined in Table 5 with a few examples.
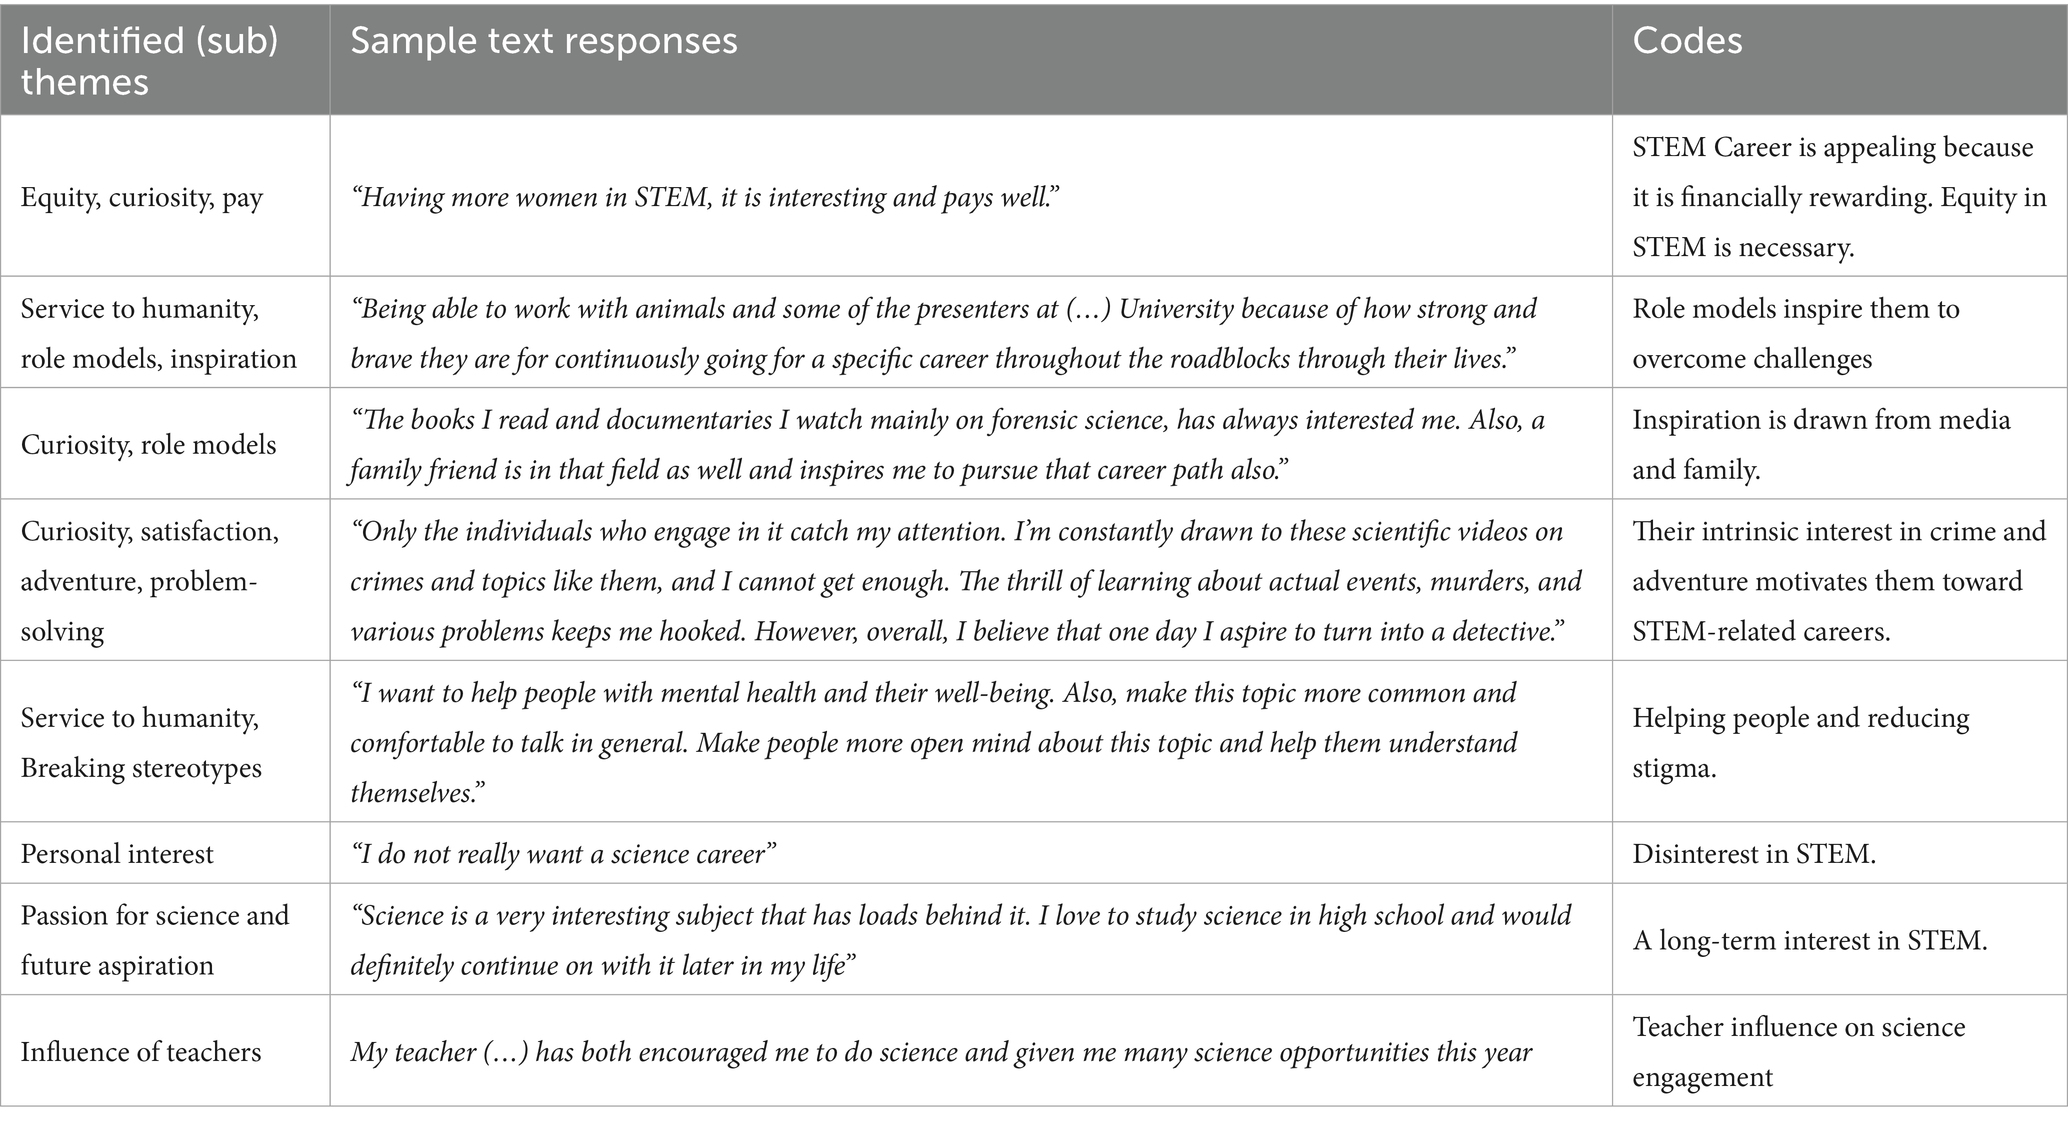
Table 5. Examples of sample texts and identified factors after coding based on student responses to the question, “What inspires you to have a science career?.”
Step 4: We constructed a thematic map illustrated in Figure 3 to present a coherent picture emerging from the themes. A recursive review process was undertaken to refine the candidate themes into fewer unique themes wherever possible. This iterative process of coding, candidate themes, and sub-theme classification ensured accurate capturing of the participants’ perspectives into meaningful narratives.
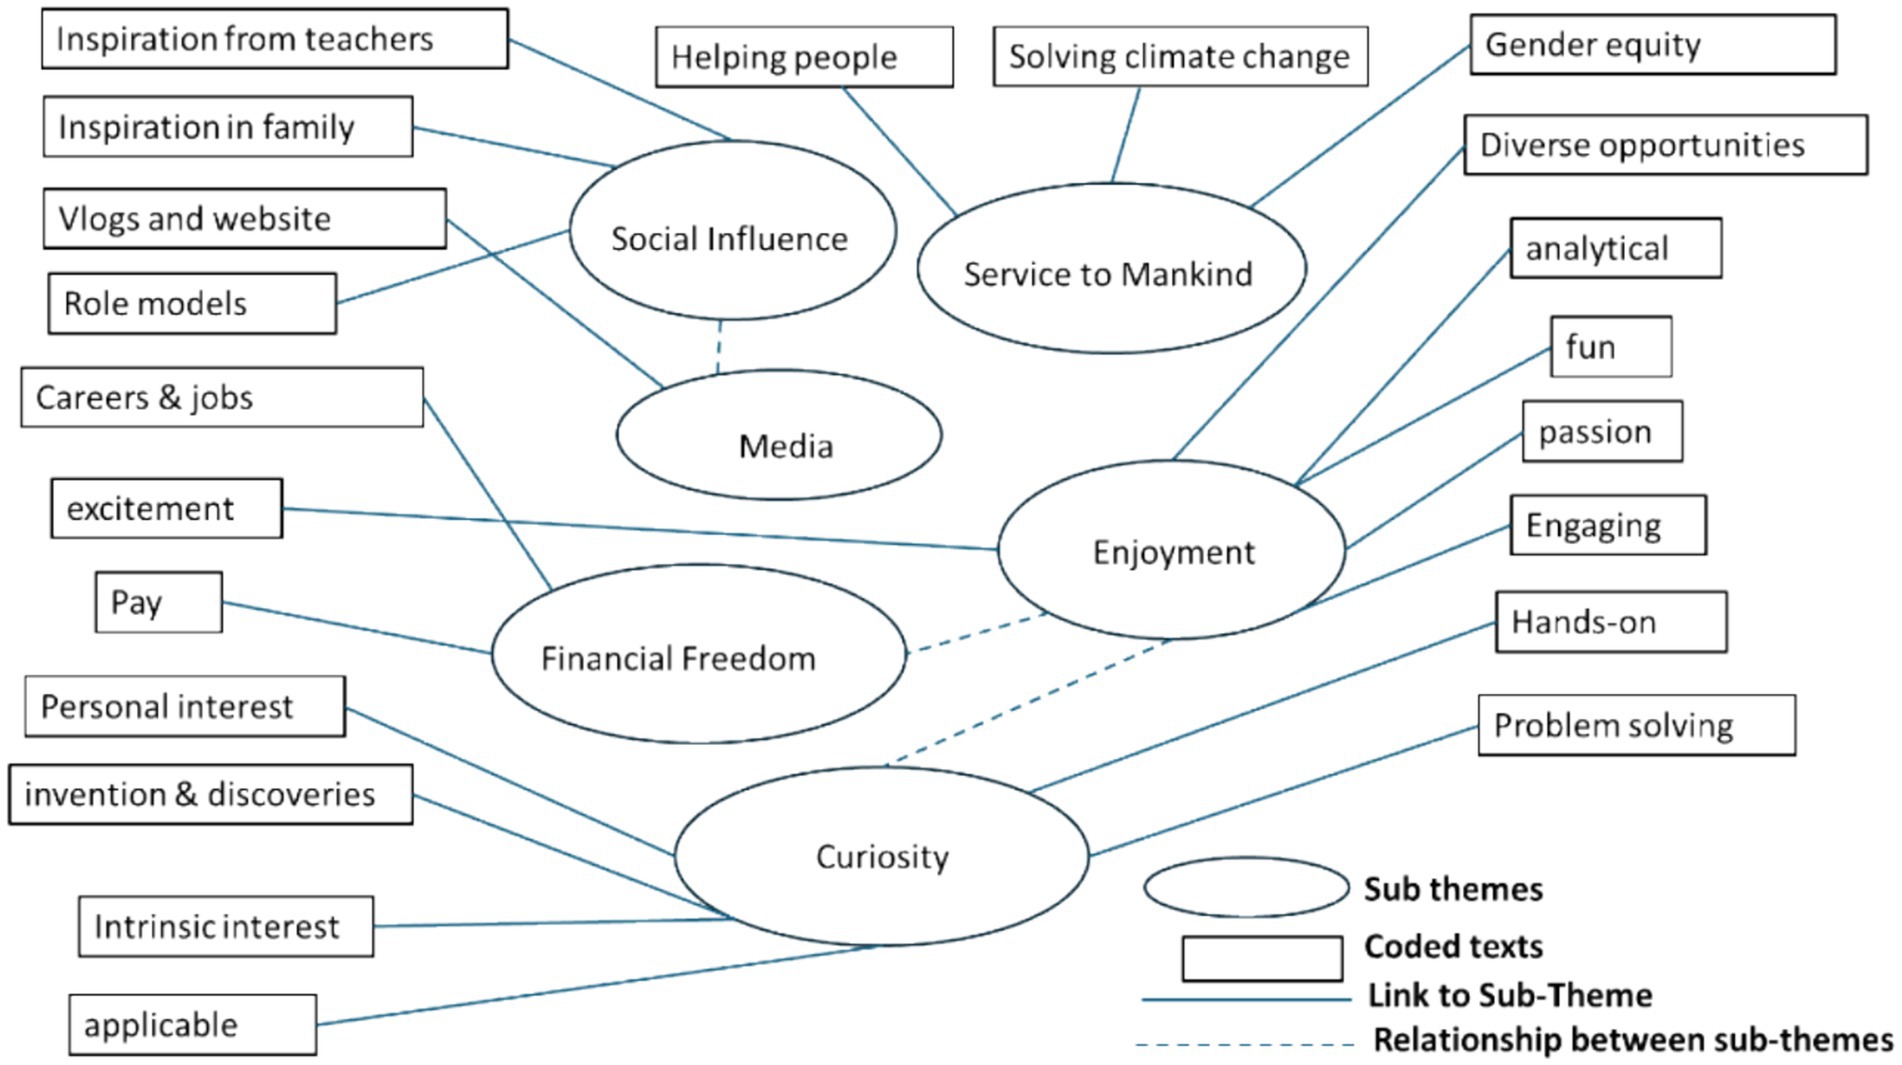
Figure 3. Examples of themes and subthemes obtained after thematic analysis of student responses to Q5 and Q6 (adapted from Byrne, 2022).
Step 5: The identified themes were compared with the quantitative results obtained from the data.
The map illustrates relationships between themes, showing how students’ perceptions of role models, sustainability, and barriers interconnect. This visualization helps address the study aims by linking qualitative findings to SCCT constructs.
4 Results
4.1 Career interest survey
Table 4 describes the mean responses from the career interest survey questions before and after attendance at the conference, and for each of 2023 and 2024. Since the participants in each year were separate, we performed separate t-tests for each cohort. We analyzed 2023 and 2024 separately because the program design evolved, with additional engineering/technology workshops and new role models introduced in 2024. To account for these qualitative differences, separate analyses were conducted.
For the 2023 data, questions related to the hypothesized construct of STEM experience in school did not change significantly with conference participation except for the question relating to the provision of STEM opportunities and resources by the school. The findings for the 2024 data were the same.
There were significant increases between pre- and post-survey responses for 2 of the 3 items related to “Inspiration to work with people in STEM” for the 2023 dataset, and there was a positive shift for all items related to this construct in the 2024 dataset.
Regarding STEM career aspiration, 4 of the 5 questions demonstrated an increase in mean scores in either 2023 or 2024. These changes were all positive, assuming that an increase in the perception that a career in STEM would be challenging is also a positive change, as students often associate challenge with intellectual stimulation and opportunities for growth, rather than as a deterrent. This suggests that participants increasingly viewed STEM careers as engaging and worthwhile.
There were no changes to questions related to career stereotypes, except for the view that a career in STEM is more common among men than among women in 2024.
Scores for self-efficacy questions did not change in 2023, but several questions increased in 2024, including the intention to get a science-related job, and confidence in being able to perform well in learning and performing activities related to technology.
Concerning female representation and financial affordability of STEM education, mean scores for the 2023 conference showed no changes following conference participation. Mean scores of items related to STEM role models within the family were overall neutral for both the 2023 and 2024 datasets, indicating that some students may have role models within their families. For the item, “My family has encouraged me to study STEM,” the mean scores of 3.7 and 3.75 suggest that most girls receive moderate to high encouragement from family members to pursue STEM.
Participant ratings exceeded 4 on a 5-point Likert scale for questions related to the STEM Enrichment Conference experience.
4.2 Exploratory factor analysis
The EFA on the Likert scale items identified two factors (Figure 4) as significant based on the Scree plot shown in Figure 5 and the Elbow method (Thorndike, 1953). Although the first seven extracted factors together explained 62.3% of the total variance, only the first two factors demonstrated adequate reliability.
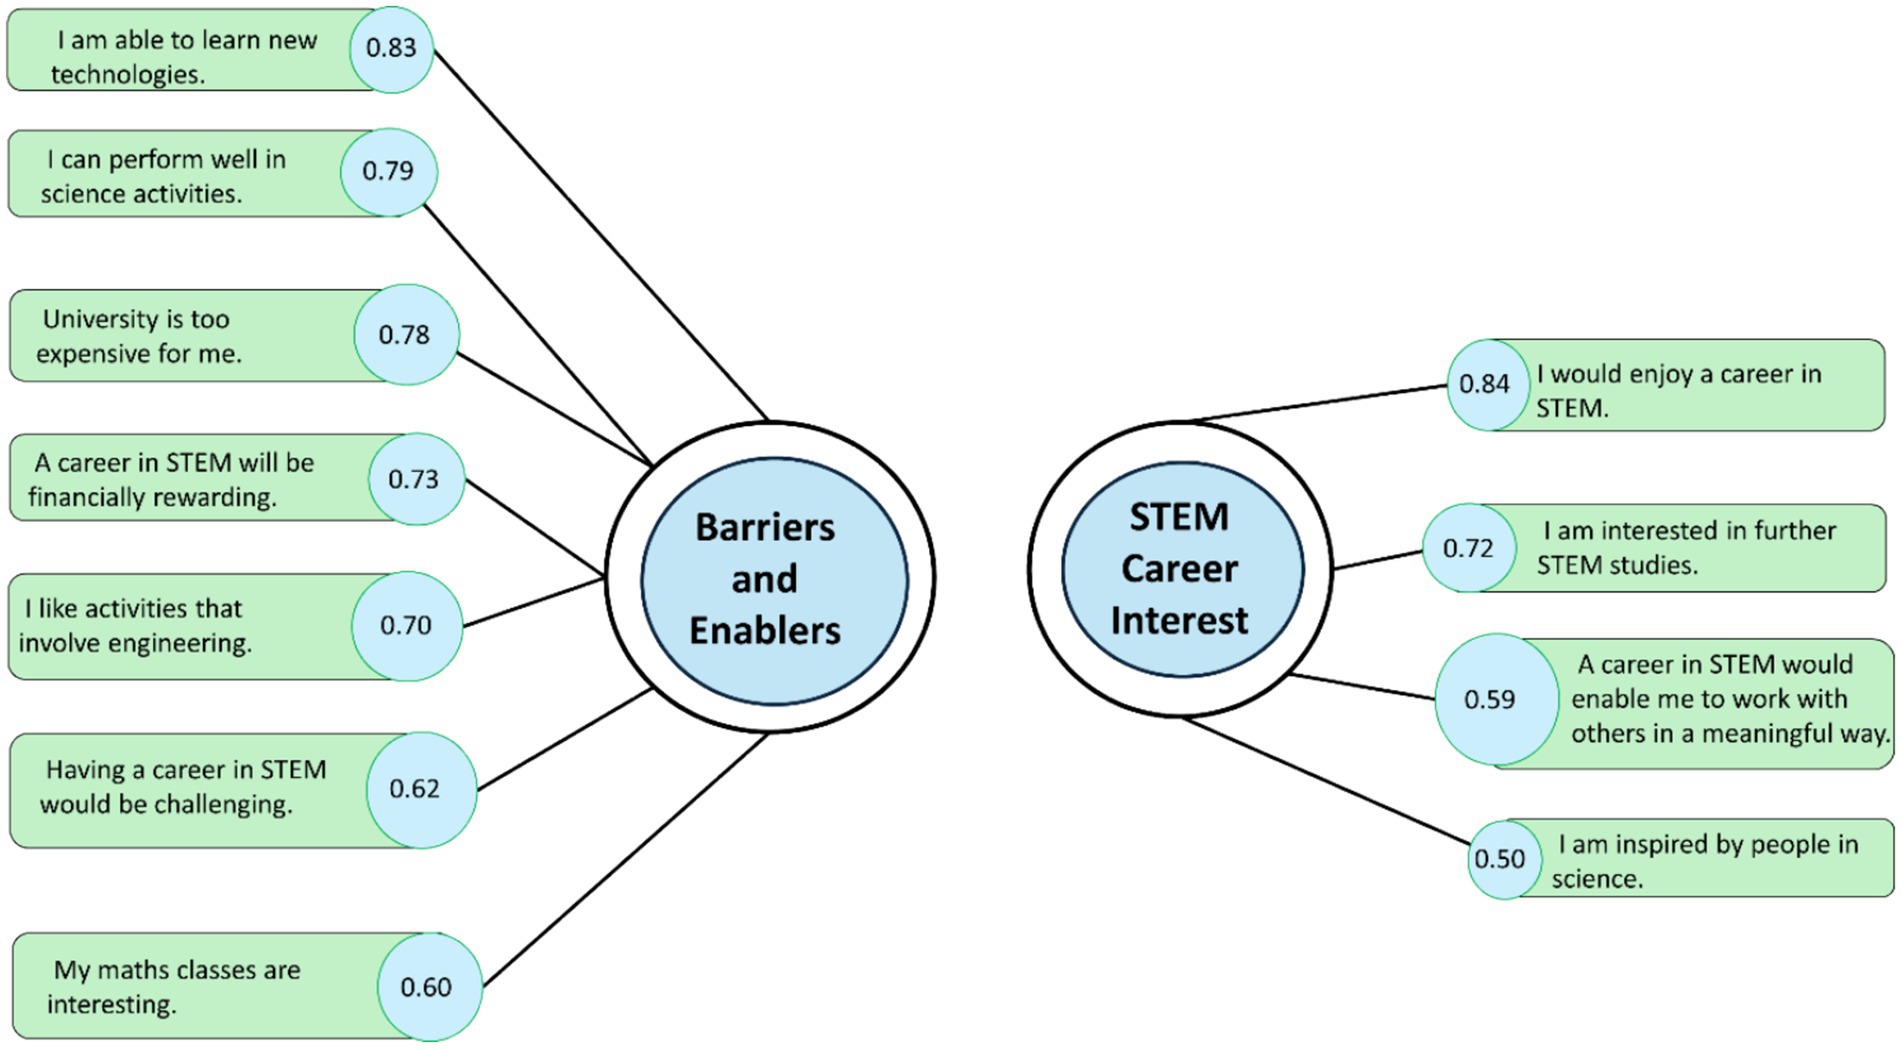
Figure 4. The correlation between the factors and the retained survey items, showing factor loadings.
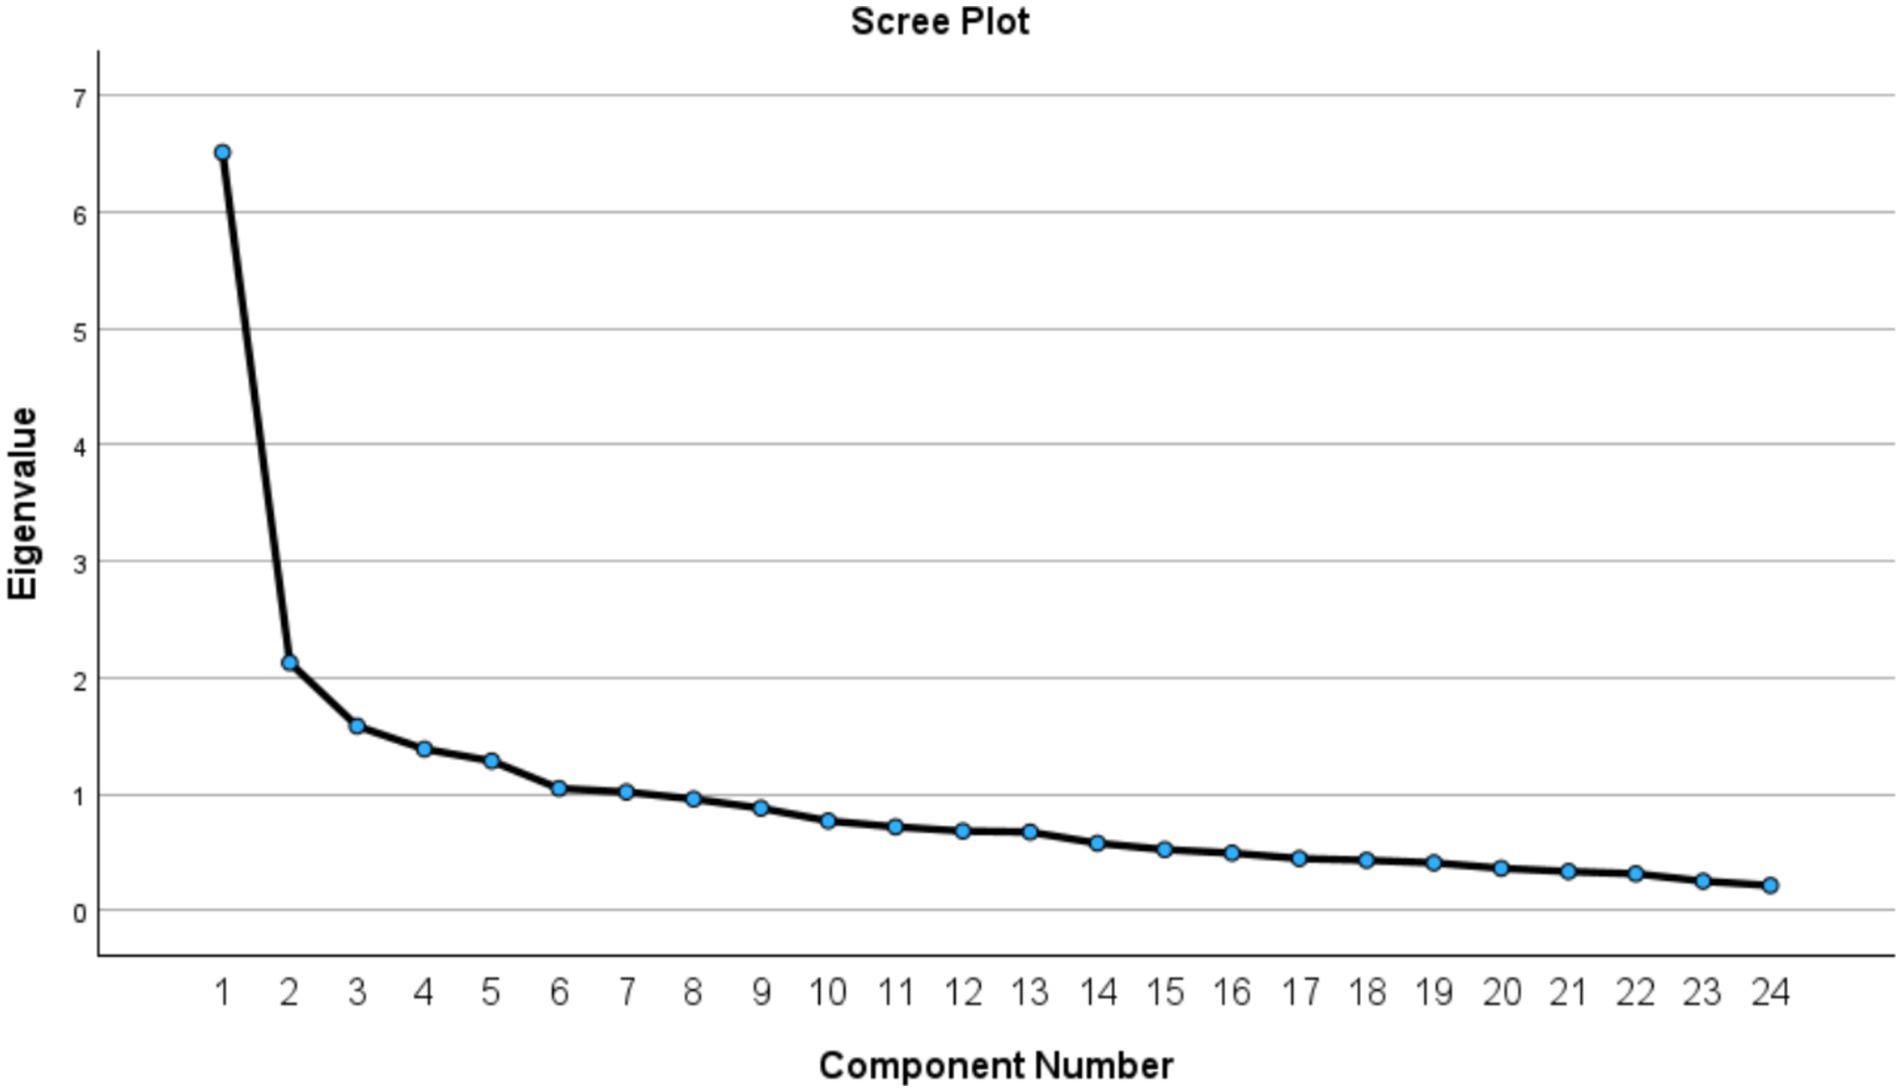
Figure 5. Scree plot with 24 variables.
The first factor, consisting of 7 items, had a Cronbach’s alpha of 0.87, indicating high internal consistency. The second factor, with four items, had a Cronbach’s alpha of 0.71, meeting the acceptable reliability threshold. The remaining five factors had Cronbach’s alpha values below 0.7, suggesting inadequate reliability. Based on these findings, we retained the two most reliable factors. These two factors accounted for 28.35% of the total variance (Factor 1 = 18.1%; Factor 2 = 10.2%), supporting their relative importance in representing post-intervention constructs.
4.2.1 Factor labeling
Barriers and Enablers (Factor 1): This factor captures participants’ perceptions of both challenges and motivations related to STEM studies and careers. There were high factor loadings (≥ 0.70) for items such as “I am able to learn new technologies” (0.83), “I can perform well in science activities” (0.79), “A career in STEM will be financially rewarding” (0.73), and “I like activities that involve engineering” (0.70). This suggests that confidence in abilities, financial incentives, and a positive attitude toward technology and science activities are strongly associated with this factor.
Items with slightly lower loadings, such as “My math classes are interesting” (0.60) and “Having a career in STEM would be challenging” (0.62), suggest these items are less strongly related to the underlying factor than the other 5 items in the factor. The item “University is too expensive for me” loaded strongly onto this factor (0.78), highlighting that the underlying construct of enablers and barriers related strongly to financial concerns as a significant barrier to pursuing STEM studies.
STEM Career Interest (Factor 2): The item “I would enjoy a career in STEM” (0.84) had the highest loading, indicating that the factor strongly relates to this item. Other items, such as “I am interested in further STEM studies” (0.72), also loaded strongly, whereas lower-loading items included “A career in STEM would enable me to work with others in a meaningful way” (0.59) and “I am inspired by people in science” (0.50).
4.3 Subject preferences 2023 and 2024
Responses to questions regarding subject preferences pre- and post-conference are described in Figure 6. Preference for Engineering increased between pre- and post-conference in 2023 from 26.4 to 37% and in 2024 from 24.6 to 34.8%. In Technology, preferences increased in 2023 from 17.6 to 25.9% while in 2024, it improved from 17.9 to 29.2%. In 2024, there was also an increase in the selection of Physics (16.4–23.0%), a larger increase than in 2023 (25.6–26.9%). There was little change from pre- to post-conference in the preference for Other Sciences, which had high pre-conference scores. Moreover, “Other Sciences” was a survey option not further specified by respondents. Based on available responses, this category primarily reflects Biology, though other sciences may also be included. It is worth noting that the response rate for this question was significantly greater than that of the Likert scale items.
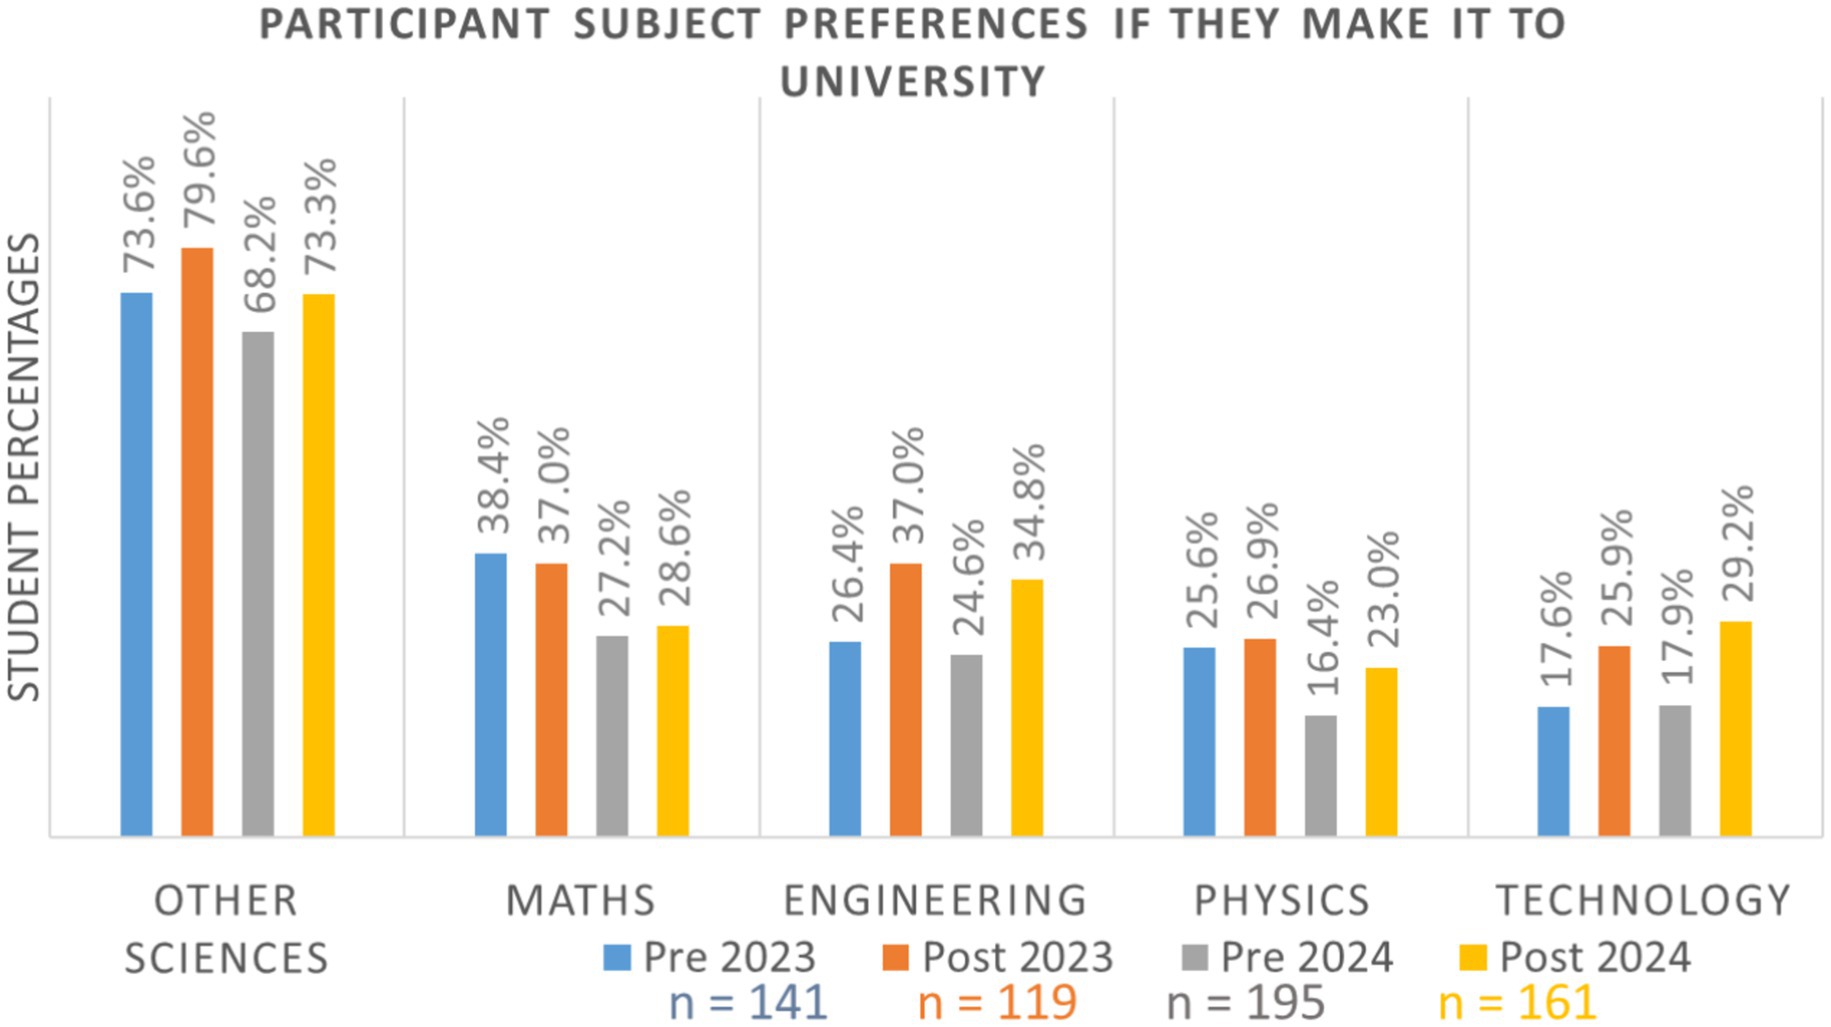
Figure 6. Participants’ selection of STEM-based subject choices before and after the conferences, when asked about their subject preferences, if they study at a university. Here, the pre- and post-values vary depending on the respondents.
4.4 Favorite subjects
In 2023, 60% of participants (N = 141) reported a STEM-related subject as their favorite before the conference, and 61.3% (N = 119) after the conference. In 2024, participants selecting a STEM subject increased from 41% (N = 195) pre-conference to 50.1% (N = 161) post-conference. The p-value of 0.226 indicates there was no statistically significant difference in pre- and post-survey scores.
A difference in the percentages of favorite subject selection between cohorts may be attributed to demographic differences. The 2024 sample comprised a substantially larger proportion of students from regional areas (N = 81) compared to the previous cohort (N = 41). Given that individual interests and classroom experiences often influence subject preferences, it is reasonable to assume that these preferences remain invariant to a single intervention. It is likely that demographic factors, rather than the intervention itself, may be driving the observed differences in subject selection.
4.5 Perception of “science” and “scientists”
Participants’ perceptions of scientists were assessed through the open-ended question, “When you think about “scientists,” who comes to your mind first?.” For the pre-conference data, the names of famous scientists such as Albert Einstein (pre = 45%, post 44%) and Marie Curie (pre = 10%, post 13%) persistently featured in their responses as illustrated in the Word Cloud visualization (Figure 7). The participants largely associated scientists with discoveries and laboratories before the conference. Notably, there were frequent references to science TV shows and pop-culture characters such as The Big Bang Theory and Sheldon Cooper, respectively, which can be an environmental factor leading to the stereotypical depiction of scientists.
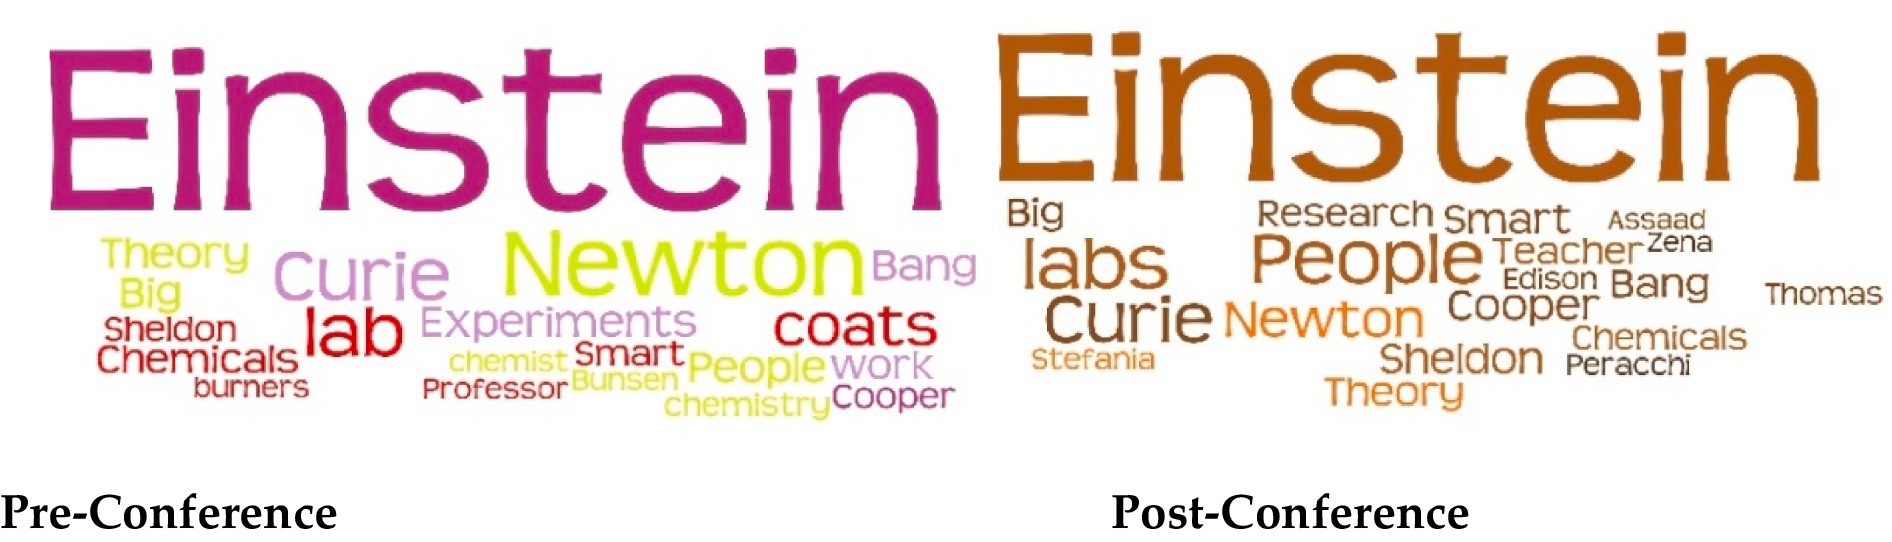
Figure 7. The most common responses (first 20 Words) to the question, “When you think about “scientists,” who comes to your mind first?.” The text sizes are proportional to response frequencies.
After the conference, there was increased recognition of scientists as not only iconic figures but also everyday individuals working collectively toward a common goal. For example, one participant described scientists as “People who have a passion and enjoy it.” At the same time, another noted, “People who are interested in researching, learning, and understanding about the environment around them.” The names of role model speakers (e.g., Stefania, Assaad) are also featured prominently in the post-conference Word cloud.
4.6 Inspiration to study science and have a science career
Thematic analysis of the open-ended questions identified several important factors, including family, teachers, the media, and the financial benefits associated with STEM careers, as influencing girls’ interest in STEM. While some themes were more commonly expressed than others, the emphasis in our analysis was on the depth and nature of responses within each theme rather than their numerical distribution. The key themes that emerged from the coded texts are discussed below, in line with the SCCT model (Lent et al., 1994) as depicted in Figure 8.
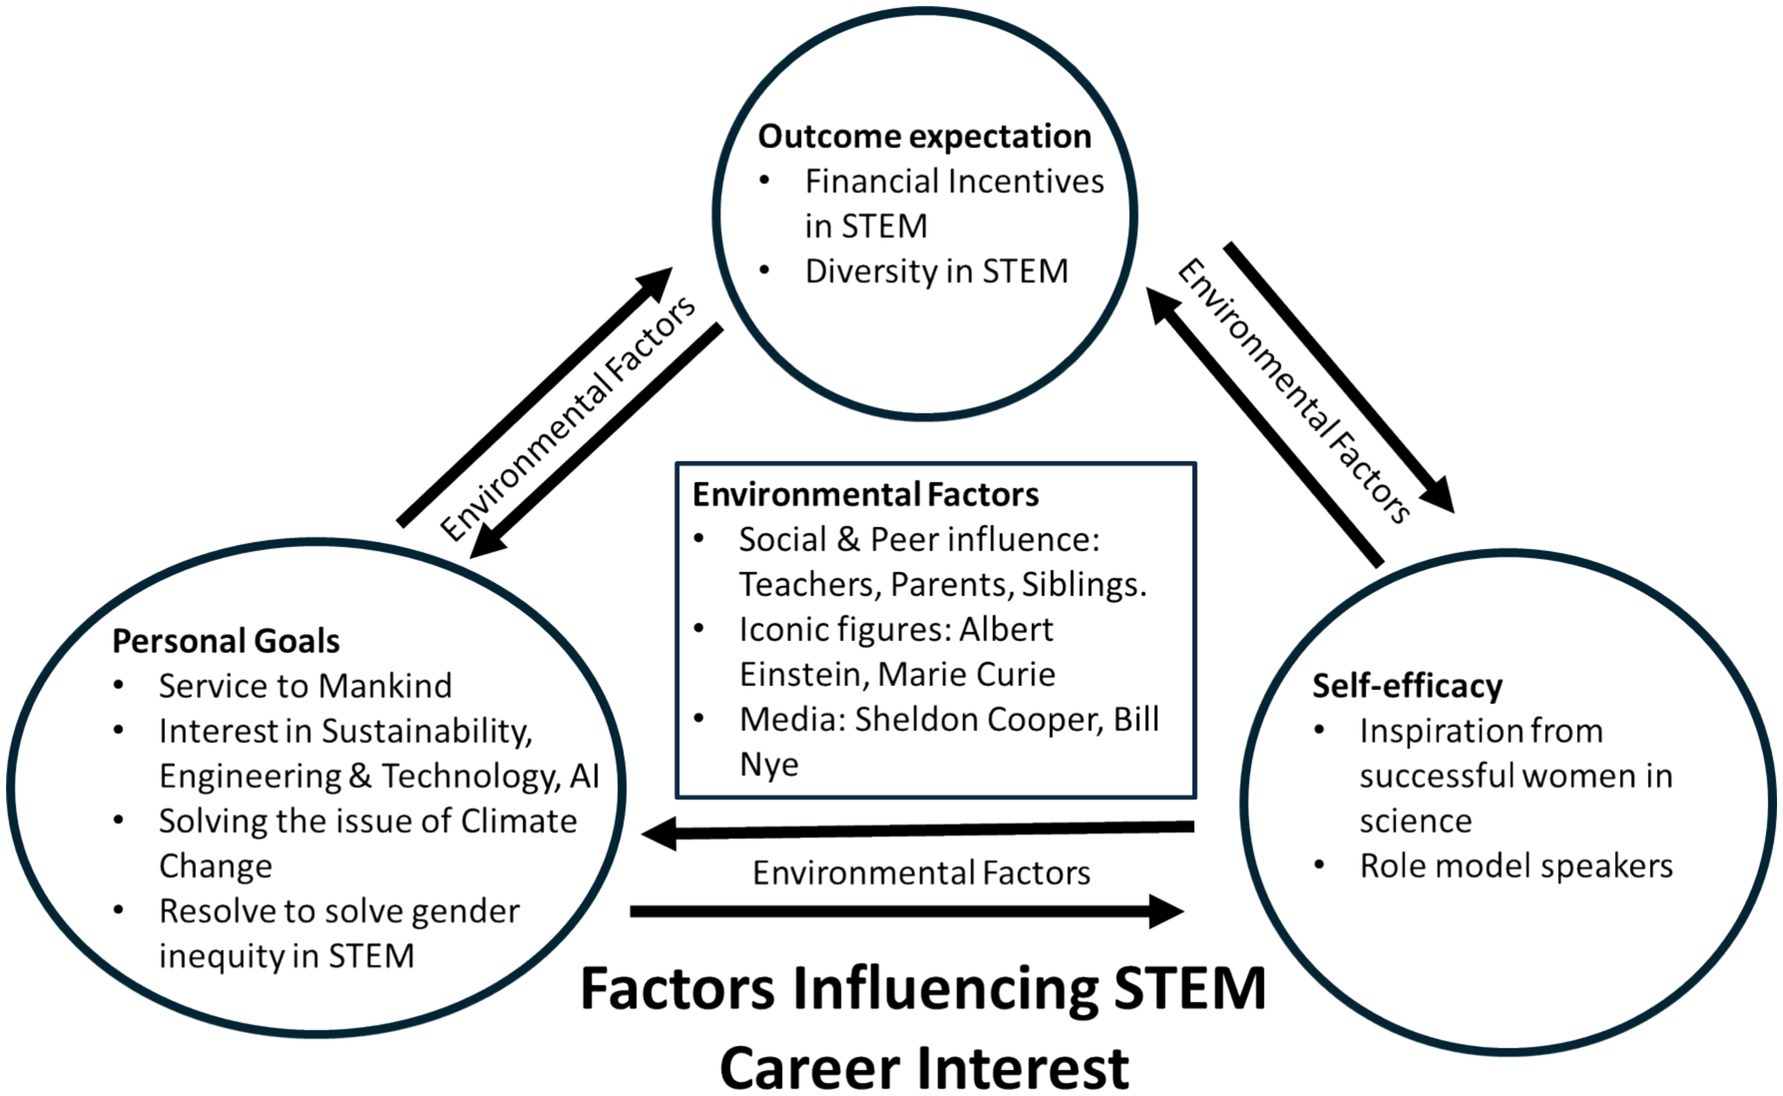
Figure 8. Empirical validation of SCCT. Adapted from Lent et al. (1994) and Wang et al. (2022).
Social influence (environmental factors): Students frequently referred to their siblings or parents pursuing science careers as inspiring them toward STEM and to their teachers. They were motivated by scientists such as Marie Curie and Albert Einstein, and contemporary figures such as Bill Nye. Collectively, their interaction with family members and teachers, historical figures, and media personalities was key to shaping their interest in science. Two examples that support this theme in response to the question, “What inspires you for a science career?” were:
“My environment: school friends, family, and other experiences”
“My teacher (…) I love how she is so interested and knows everything about science, but in the future, I don’t think my job will include science.”
Curiosity (self-efficacy and personal goals): For the pre-conference data, natural curiosity, including the ability to discover new things and understand the world, was included as one form of inspiration to pursue science. Enjoyment of the practical aspects of science was another factor driving interest. A subset of participant data showed that students were interested in careers related to engineering and technology, medicine, and biology. However, their interest in engineering subjects was more visible post-conference and supported the findings relating to subject preferences for university studies.
The post-conference responses further highlighted the keen interest in exploring questions related to the “why” and “how” of various phenomena within science. For example, one student wrote, “I am inspired by the world around us and how everything functions. Science is the basis of life and explains the world we live in and more. I am also inspired by scientific discoveries and how there is so much more we have yet to discover and learn about.”
Another student wrote: “Growing up, I have always had an interest in different sciences, and watching TV shows such as Bones has made me want to become a doctor of sorts and discover the unknown. I also want a job where I can make a change in the world and help people in the field of science, so whether that be through a job in medicine or any other science, I’m happy.”
Service to mankind (personal goals): There was a strong motivation to bring positive change in the world by serving humanity, addressing contemporary challenges of climate change, and learning about artificial intelligence (AI).
Their responses also showed how participants enjoyed the practical and hands-on nature of science, and their enjoyment of the problem-solving aspects offered by STEM was evident. A subset of students mentioned sustainability as a key aspect that inspires them to pursue STEM, likely influenced by the sustainability workshops at the conference (e.g., “I want to make a difference by reducing plastic use or creating something from recycled plastics.”; “I am most interested in engineering and AI because I think they could be very useful in the future.”).
It was evident that girls recognized the gender gap in science before the conference. They were motivated to solve the problem of low representation of women in STEM by studying science. A recurring theme that emerged in their post-conference responses was the inspiration drawn from stories of successful women in STEM. They were inspired by learning about the journeys and experiences of women in the field and how they overcame the challenges. This was likely an outcome of their interactions and exposure to role models at the STEM Enrichment conference, as discussed before.
Two quotes exemplify this sentiment: “Being able to work with animals and some of the presenters at (…) University because of how strong and brave they are for continuously going for a specific career throughout the roadblocks through their lives.”
“Meeting new people and their different knowledge. It is an interesting career, and I will always be doing hands-on activities. The pay is good as well. To have equality with males and females.”
Financial Incentives and Diversity (outcome expectations and personal goals): The most recurring theme before and after the conference was the financial incentives associated with STEM careers, as girls recognize the potential for comparatively higher-paying jobs within STEM fields. Moreover, they were attracted to the diverse opportunities that science offers (e.g., “The international aspect and multi-diversity of the people you are able to work with.”)
5 Discussion
5.1 Aim 1: determine current career interest in STEM among Grade 9 girls
Baseline scores for items related to STEM career aspirations were already high, creating a ceiling for post-conference improvement. An increase in the perception that STEM careers can be challenging following the conference may reflect an increased awareness and understanding of the rigor involved in science. This may also be due to students seeing how few role models were able to build successful careers in STEM despite facing challenges during school education.
Participant responses to explicit questions regarding gender roles (for example, “A career in STEM is more common for men than for women”) showed that there were relatively few stereotypical beliefs about STEM careers and, therefore, only minor changes after the conference were observed. Thus, there were modest improvements in self-efficacy and confidence scores based on the 2024 data but smaller changes in the 2023 quantitative data, as well as in qualitative data.
Local and international contextual factors also shaped students’ interests. For example, Lyons and Quinn (2010) found that rural Australian students’ attitudes toward science are significantly lower than those of their metropolitan counterparts. Given that 34.3% of participants (n = 376) were from a regional or rural location, contextual factors such as low prior interest might be affecting the outcomes. However, Roberts et al. (2024) argue against treating rural–metro differences as a binary, instead emphasizing the complexities of Australian rurality.
Together, these findings suggest that girls’ baseline interest in STEM was relatively strong, with modest gains possible in the short term due to ceiling effects and contextual influences.
5.2 Aim 2: determine the socio-cognitive factors that shape Australian grade 9 school girls’ perceptions and interest in STEM studies and careers
Our findings highlight three key influences consistent with Social Cognitive Career Theory (SCCT).
Self-efficacy and confidence: There was an increase in responses related to “Inspiration to work with people in STEM,” suggesting that direct engagement with STEM professionals and role models had a positive impact on participants’ aspirations. This consistent pattern across both datasets highlights the effectiveness of interventions that provide opportunities for students to connect with individuals working in STEM, reinforcing the importance of mentorship and real-world exposure in shaping career interests.
Personal goals and outcome expectations: Students’ increased awareness of how STEM skills translate into future careers, especially those that are financially rewarding or beneficial for society, was reflected in both quantitative and qualitative data. Survey results showed an increase in girls’ interest in engineering and technology careers following the program. This quantitative shift aligns with qualitative responses, where girls expressed motivation to solve contemporary issues such as climate change and sustainability. These findings resonate with Diekman et al. (2010) work, which shows women’s preference for STEM careers related to community development.
Year 9 students have minimal exposure to engineering-related topics in many Australian schools (Devi et al., 2016). Direct engagement with engineering and technology-related activities, such as workshops and industry immersion tours, may therefore have contributed to a greater improvement than for other topics. Conversely, traditional science topics did not show comparable gains, possibly due to prior familiarity or weaker contextual relevance. The minimal change in preference for mathematics as a career could also be linked to the absence of explicit mathematics-related activities during the conference.
Environmental influences: The findings suggest that while the conference did not significantly shift students’ perceptions of their STEM experience in school, there was a notable improvement in how they perceived their school’s provision of STEM opportunities and resources. This indicates that external enrichment activities may raise students’ awareness of STEM support within their schools.
A subtle shift in participants’ perspectives on scientists was also observed. Initially, many students held stereotypical views, citing famous figures like Albert Einstein or Marie Curie. After engaging with role models and workshops, however, they increasingly described scientists as “ordinary individuals” working toward goals. This implicit change was clearer in qualitative responses, underscoring the importance of visible role models and the inclusion of open-ended questions in evaluations.
While most girls lacked direct STEM role models within their families, they still reported encouragement from family members to pursue STEM studies. Hence, peripheral and distant spheres of influence (Campbell et al., 2020), such as role model intervention and school support, may play a significant role in shaping girls’ STEM career interests and aspirations.
5.3 Aim 3: determine the potential of 3-day STEM-intensive enrichment activities to improve Grade 9 girls’ self-efficacy, confidence, and interest in STEM
Although several p-values reached statistical significance, the absolute differences in mean scores were relatively small. These small changes may reflect modest but consistent shifts in students’ attitudes, which could still be meaningful in the context of a short-term intervention. Importantly, several items did not show significant change, suggesting that some aspects of students’ attitudes, such as subject selection and immediate career choices, may be more resistant to short-term interventions.
Qualitative findings complement these results. For example, the increased interest in engineering and technology careers observed in the surveys was echoed in students’ qualitative comments, particularly about sustainability and problem-solving workshops. This indicates that contemporary, real-world topics resonate more strongly than traditional science content.
In addition, our factor analysis identified areas for future interventions, including addressing financial barriers, fostering confidence in STEM skills, and making subjects like mathematics more engaging to reduce perceived challenges. The analysis also highlighted the importance of cultivating inspiration through role models and emphasizing collaborative, meaningful aspects of STEM careers. It should be noted, however, that because exploratory factor analysis was conducted only on post-intervention data, the factor structures reflect post-program conceptual groupings rather than baseline latent constructs.
International comparisons further contextualize our findings. For example, DeWitt and Archer (2015) found that students’ ideas of “who does science” solidify at primary school, and they recommend linking science to future career relevance rather than presenting vague messages of utility. Similarly, De Meester et al. (2020) found that emphasizing STEM’s role in addressing environmental issues fosters student interest, paralleling our results regarding sustainability workshops.
Together, the evidence suggests that short-term enrichment can generate meaningful though modest gains in STEM attitudes, particularly when linked to socially relevant topics and visible role models.
Quantitative and qualitative findings converge to show that girls’ STEM aspirations are influenced by a mix of baseline interests, exposure to role models, contextual factors, and program design. While ceiling effects limited the scale of measurable gains, the enrichment program was effective in sparking interest in engineering and technology and in shifting perceptions of scientists. The alignment between program content, such as sustainability themes, and students’ values highlights the importance of tailoring interventions to resonate with participants’ lived experiences.
6 Limitations and strengths of the study
A large sample size and the use of repeated data collection allowed for a comparison of students’ subject and career preferences before and after the intervention. The diverse sample enhances the representativeness of the findings. Although our paired-sample analysis considered only completed pre- and post-survey responses, this may not fully represent the entire cohort since students who answered both surveys may be more motivated, leading to the possibility of attrition bias. Therefore, future research may benefit from conducting EFA on pre-intervention data or comparing pre- and post-factor structures using confirmatory factor analysis.
Additionally, the study is observational, for which we cannot infer causality. For example, the changes in subject preferences may be influenced by factors beyond intervention, such as external experiences or broader educational influences. Hence, a control group analysis would be more useful to draw strong causal inferences in future studies. Another limitation includes the potential influence of peer-learning and behavior modification in conference settings, which may have affected participant responses. Furthermore, the short duration of the 3-day STEM conference may not have captured long-term impacts, and future studies could benefit from longer observation periods.
Finally, the high baseline scores on several measures raise the possibility of ceiling effects, which may have constrained the extent of observable improvement. It is possible that some selected students were already interested in STEM, while others were nominated based on teacher judgment. This may have biased results, potentially inflating baseline interest or limiting observable change.
7 Future directions
While the current study provides initial evidence of the program’s impact, future studies should incorporate a control group design to more rigorously evaluate causality and rule out alternative explanations. In addition, extending the factor analysis to include both pre- and post-intervention data, ideally using confirmatory factor analysis, would provide stronger evidence for the stability and validity of the constructs identified. Addressing these methodological refinements would substantially enhance the robustness and generalizability of future findings. Moreover, the 3-day duration may not have been sufficient to shift more entrenched constructs such as long-term career commitment. Future work should examine longer or repeated interventions to assess sustained impacts.
8 Conclusion
The findings from our study offer empirical evidence on the distinct factors that are associated with Grade 9 girls’ STEM-related career aspirations and perceptions toward STEM in Australia. The changes in perception were especially reflected in qualitative data and therefore underline the importance of incorporating qualitative questions into a survey instrument to enable a more holistic understanding of the factors influencing students’ STEM career aspirations and perceptions.
Our results highlight the potential influence of targeted programs that combine role models with hands-on activities, especially in engineering, technology, and sustainability. These results reinforce the need for continued investment in STEM enrichment initiatives that not only expose students to diverse role models but also provide meaningful, hands-on experiences, which may help strengthen their confidence and sense of belonging in STEM fields.
For policymakers and curriculum developers, this study recommends developing STEM programs that build upon students’ enthusiasm for cutting-edge topics such as climate change and sustainability. By making these topics visible through hands-on workshops, industry immersion tours, and diverse role model engagements, the program appeared to engage the students and their curiosity, support more positive attitudes toward STEM, and deepen their interest.
Together with role models, financial incentives associated with STEM remain key enablers for girls’ pursuit of STEM education. To conclude, this study provides both quantitative and qualitative empirical data on student career interests (Wang et al., 2022) through the lens of SCCT by providing a comprehensive overview of girls’ interests in STEM studies and aspirations for STEM careers. Our findings can also guide the design and effective intervention of programs aimed at increasing girls’ participation in STEM, providing valuable insights for researchers and policymakers working to close the gender gap in STEM fields.
Data availability statement
The raw data supporting the conclusions of this article will be made available by the authors, without undue reservation.
Ethics statement
The studies involving humans were approved by Flinders University Human Research Ethics Committee (Ethics Approval #: 5997). The studies were conducted in accordance with the local legislation and institutional requirements. Written informed consent for participation in this study was provided by the participants’ legal guardians/next of kin.
Author contributions
RC: Conceptualization, Data curation, Formal analysis, Investigation, Methodology, Software, Validation, Visualization, Writing – original draft, Writing – review & editing. MP: Funding acquisition, Project administration, Supervision, Writing – review & editing. RW: Funding acquisition, Visualization, Writing – review & editing.
Funding
The author(s) declare that financial support was received for the research and/or publication of this article. This research was supported by a federal grant from the Australian Government Department of Industry Science and Resources (Grant #: WISEIV000078).
Acknowledgments
We express our sincere gratitude to all the teachers who contributed to the success of our programs through their school’s participation. We would like to especially acknowledge Susanne Sahlos for her outstanding support in coordinating and running the overall project activities. Our heartfelt thanks also go to all the presenters and volunteers who delivered engaging STEM workshops, particularly Adele Mastroyannis and Dr. Laurence Campbell for their invaluable contributions.
Conflict of interest
The authors declare that the research was conducted in the absence of any commercial or financial relationships that could be construed as a potential conflict of interest.
Generative AI statement
The authors declare that no Gen AI was used in the creation of this manuscript.
Any alternative text (alt text) provided alongside figures in this article has been generated by Frontiers with the support of artificial intelligence and reasonable efforts have been made to ensure accuracy, including review by the authors wherever possible. If you identify any issues, please contact us.
Publisher’s note
All claims expressed in this article are solely those of the authors and do not necessarily represent those of their affiliated organizations, or those of the publisher, the editors and the reviewers. Any product that may be evaluated in this article, or claim that may be made by its manufacturer, is not guaranteed or endorsed by the publisher.
Supplementary material
The Supplementary material for this article can be found online at: https://www.frontiersin.org/articles/10.3389/feduc.2025.1685063/full#supplementary-material
References
Arhin, V. (2018). Relationship between career aspirations and study behaviours among first year distance learners of the University of Cape Coast Ghana. Afr. Educ. Res. J. 6, 173–180. doi: 10.30918/AERJ.63.18.043
Australian Government Department of Education. (2023). Selected higher education statistics – 2022 student data. Available online at: https://www.education.gov.au/higher-education-statistics/student-data/selected-higher-education-statistics-2022-student-data
Australian Government Department of Education. (2025). Which school students need STEM education? Early secondary students. Australian Curriculum. Available online at: https://www.education.gov.au/australian-curriculum/national-stem-education-resources-toolkit/i-want-know-about-stem-education/which-school-students-need-stem-education/early-secondary
Bandura, A. (1986). Social foundations of thought and action: a social cognitive theory. Englewood Cliffs, NJ: Prentice-Hall, Inc.
Bandura, A. (2001). Social cognitive theory: an agentic perspective. Annu. Rev. Psychol. 52, 1–26. doi: 10.1146/annurev.psych.52.1.1
Blickenstaff, J. C. (2005). Women and science careers: leaky pipeline or gender filter? Gend. Educ. 17, 369–386. doi: 10.1080/09540250500145072
Boaler, J., Dieckmann, J. A., LaMar, T., Leshin, M., Selbach-Allen, M., and Pérez-Núñez, G. (2021). The transformative impact of a mathematical mindset experience taught at scale. Front. Educ. 6:784393. doi: 10.3389/feduc.2021.784393
Braun, V., and Clarke, V. (2006). Using thematic analysis in psychology. Qual. Res. Psychol. 3, 77–101. doi: 10.1191/1478088706qp063oa
Braun, V., and Clarke, V. (2019). Reflecting on reflexive thematic analysis. Qual. Res. Sport Exerc. Health 11, 589–597. doi: 10.1080/2159676X.2019.1628806
Braun, V., and Clarke, V. (2022). Toward good practice in thematic analysis: avoiding common problems and be(com)ing a knowing researcher. Int. J. Transgender Health 24, 1–6. doi: 10.1080/26895269.2022.2129597
Byrne, D. A. (2022). A worked example of Braun and Clarke's approach to reflexive thematic analysis. Qual. Quant. 56, 1391–1412. doi: 10.1007/s11135-021-01182-y
Campbell, C., Hobbs, L., Millar, V., Ragab Masri, A., Speldewinde, C., Tytler, R., et al. (2020). Girls’ future – our future. The Invergowrie Foundation STEM report 2020 update. Melbourne, VIC: Invergowrie Foundation.
Charlesworth, T. E. S., and Banaji, M. R. (2019). Gender in science, technology, engineering, and mathematics: issues, causes, solutions. J. Neurosci. 39, 7228–7243. doi: 10.1523/JNEUROSCI.0475-18.2019
Cheryan, S., Ziegler, S. A., Montoya, A. K., and Jiang, L. (2017). Why are some STEM fields more gender balanced than others? Psychol. Bull. 143, 1–35. doi: 10.1037/bul0000052
Christidou, V. (2011). Interest, attitudes and images related to science: combining students’ voices with the voices of school science, teachers, and popular science. Int. J. Environ. Sci. Educ. 6, 141–159. Available online at: http://www.ijese.net/makale/1437.html
Damodar, P., Shetty, A., Dsouza, M. P., Prakash, A., and Gudi, N. (2024). Crafting careers through theory-driven interventions: a scoping review of the utility of social cognitive career theory and career maturity inventory. Int. J. Adolesc. Youth 29. doi: 10.1080/02673843.2024.2308081
De Meester, J., Boeve-de Pauw, J., Buyse, M.-P., Ceuppens, S., De Cock, M., De Loof, H., et al. (2020). Bridging the gap between secondary and higher STEM education – the case of STEM@school. Eur. Rev. 28, S135–S157. doi: 10.1017/S1062798720000964
Devi, B., Rifkin, W., Arthy, M., Delhomme, F., May, K., and Reategui Olguin, C. (2016). An evaluation framework for STEM education programs. Centre for Social Responsibility in mining, sustainable minerals institute, The University of Queensland. Available online at: https://www.csrm.uq.edu.au/media/docs/1366/uqstemevalnframeworkpublic16-2-16.pdf
DeWitt, J., and Archer, L. (2015). Who aspires to a science career? A comparison of survey responses from primary and secondary school students. Int. J. Sci. Educ. 37, 2170–2192. doi: 10.1080/09500693.2015.1071899
Diekman, A. B., Brown, E. R., Johnston, A. M., and Clark, E. K. (2010). Seeking congruity between goals and roles: a new look at why women opt out of science, technology, engineering, and mathematics careers. Psychol. Sci. 21, 1051–1057. doi: 10.1177/0956797610377342
Eaton, A. A., Saunders, J. F., Jacobson, R. K., and West, K. (2019). How gender and race stereotypes impact the advancement of scholars in STEM: professors’ biased evaluations of physics and biology post-doctoral candidates. Sex Roles 82, 127–141. doi: 10.1007/s11199-019-01052-w
Farrell, L., and McHugh, L. (2020). Exploring the relationship between implicit and explicit gender-STEM bias and behaviour among STEM students using the implicit relational assessment procedure. J. Context. Behav. Sci. 15, 142–152. doi: 10.1016/j.jcbs.2019.12.008
Gibbons, M. M., Hardin, E. E., Taylor, A. L., Brown, E., and Graham, D. (2020). Evaluation of an SCCT-based intervention to increase postsecondary awareness in rural Appalachian youth. J. Career Dev. 47, 424–439. doi: 10.1177/0894845319832972
Gladstone, J. R., and Cimpian, A. (2021). Which role models are effective for which students? A systematic review and four recommendations for maximizing the effectiveness of role models in STEM. Int. J. STEM Educ. 8:59. doi: 10.1186/s40594-021-00315-x
Hill, C., Corbett, C., and St Rose, A. (2010).Why so few? Women in science, technology, engineering, and mathematics. American Association of University Women. (ERIC Document Reproduction Service No. ED509653).
Inda, M., Rodríguez, C., and Peña, J. V. (2013). Gender differences in applying social cognitive career theory in engineering students. J. Vocat. Behav. 83, 346–355. doi: 10.1016/j.jvb.2013.06.010
Kier, M. W., Blanchard, M. R., Osborne, J. W., and Albert, J. (2013). The development of the STEM career interest survey (STEM-CIS). Res. Sci. Educ. 44, 461–481. doi: 10.1007/s11165-013-9389-3
Kothari, C. R. (2004). Research methodology: methods and techniques. 2nd revised Edn. Jaipur, India: New Age International Publishers.
Larsen, S., and Rowe, E. (2024). Trends in regional and remote school enrolment: how does school socioeconomic composition differ according to geographical location and sector? Paper presented at the AARE Conference. Available online at: https://www.aare.edu.au/publications/aare-conference-papers/show/15221/trends-in-regional-and-remote-school-enrolment-how-does-school-socioeconomic-composition-differ-according-to-geographical-location-and-sector
Lent, R. W., Brown, S. D., and Hackett, G. (1994). Toward a unifying social cognitive theory of career and academic interest, choice, and performance. J. Vocat. Behav. 45, 79–122. doi: 10.1006/jvbe.1994.1027
Lindahl, B. (2007). A longitudinal study of students' attitudes towards science and choice of career. Paper presented at the 80th NARST International Conference, New Orleans, LA.
Lyons, T., and Quinn, F. (2010). Choosing science: understanding the declines in senior high school science enrolments. Armidale, Australia: Australian Department of Education, Employment and Workplace Relations.
Makarova, E., Aeschlimann, B., and Herzog, W. (2019). The gender gap in STEM fields: the impact of the gender stereotype of math and science on secondary students' career aspirations. Front. Educ. 4:60. doi: 10.3389/feduc.2019.00060
Maltese, A. V., and Tai, R. H. (2009). Eyeballs in the fridge: sources of early interest in science. Int. J. Sci. Educ. 32, 669–685. doi: 10.1080/09500690902792385
McDonald, C. V. (2016). Stem education: a review of the contribution of the disciplines of science, technology, engineering and mathematics. Sci. Educ. Int. 27, 530–569.
Middlecamp, C. H., and Subramaniam, B. (1999). What is feminist pedagogy? Useful ideas for teaching chemistry. J. Chem. Educ. 76, 520–526. doi: 10.1021/ed076p520
Murphy, C., and Beggs, J. (2005). Coteaching as an approach to enhance science learning and teaching in primary schools. Counterpoints 294, 207–231.
Mwaura, M. N. (2020). The relationship between career aspiration and academic performance of students in public secondary schools in Nairobi County, Kenya. Int. J. Multidiscip. Res. Public. 3, 68–73.
Myint, E. T., and Robnett, R. D. (2023). Correlates of adolescents’ STEM career aspirations: the importance of academic motivation, academic identity, and gender. Eur. J. Psychol. Educ. 39, 189–209. doi: 10.1007/s10212-023-00681-w
Nosek, B. A., and Banaji, M. R. (2002). Math = male, me = female, therefore math ≠ me. J. Pers. Soc. Psychol. 83, 44–59. doi: 10.1037/0022-3514.83.1.44
Parappilly, M., Mayes, S., and Woodman, R. (2025). Effectiveness of enrichment program in increasing middle grade girls’ interest to pursue physics studies and STEM careers. Phys. Educ. 60, 055023. doi: 10.1088/1361-6552/adf0d6
Piloto, C. (2023). The gender gap in STEM | MIT professional education. MIT Professional Education. Available online at: https://professionalprograms.mit.edu/blog/leadership/the-gender-gap-in-stem/
Reinking, A., and Martin, B. (2018). The gender gap in STEM fields: theories, movements, and ideas to engage girls in STEM. J. New Approaches Educ. Res. 7, 148–153. doi: 10.7821/naer.2018.7.271
Roberts, P., Downes, N., and Reid, J. A. (2024). Engaging rurality in Australian education research: addressing the field. Aust. Educ. Res. 51, 123–144. doi: 10.1007/s13384-022-00587-4
Sebastián-Tirado, A., Félix-Esbrí, S., Forn, C., and Sanchis-Segura, C. (2023). Are gender-science stereotypes barriers for women in science, technology, engineering, and mathematics? Exploring when, how, and to whom in an experimentally-controlled setting. Front. Psychol. 14:1219012. doi: 10.3389/fpsyg.2023.1219012
Starr, C. R., and Simpkins, S. D. (2021). High school students’ math and science gender stereotypes: relations with their STEM outcomes and socializers’ stereotypes. Soc. Psychol. Educ. 24, 273–298. doi: 10.1007/s11218-021-09611-4
Tai, R. H., Liu, C. Q., Maltese, A. V., and Fan, X. (2006). Planning early for careers in science. Science 312, 1143–1144. doi: 10.1126/science.1128690
Tang, M., Pan, W., and Newmeyer, M. D. (2008). Factors influencing high school students’ career aspirations. Prof. Sch. Counsel. 11, 285–295. doi: 10.5330/PSC.n.2010-11.285
Thorndike, R. L. (1953). Who belongs in the family? Psychometrika 18, 267–276. doi: 10.1007/BF02289263
Wang, D., Liu, X., and Deng, H. (2022). The perspectives of social cognitive career theory approach in current times. Front. Psychol. 13:1023994. doi: 10.3389/fpsyg.2022.1023994
Wang, N., Tan, A. L., Zhou, X., Liu, K., Zeng, F., and Xiang, J. (2023). Gender differences in high school students’ interest in STEM careers: a multi-group comparison based on structural equation model. Int. J. STEM Educ. 10:59. doi: 10.1186/s40594-023-00443-6
Wegemer, C. M., and Eccles, J. S. (2019). Gendered STEM career choices: altruistic values, beliefs, and identity. J. Vocat. Behav. 110, 28–42. doi: 10.1016/j.jvb.2018.10.020
Zhang, Y. C., Zhou, N., Cao, H., Liang, Y., Yu, S., and Fang, X. (2019). Career-specific parenting practices and career decision-making self-efficacy among Chinese adolescents: the interactive effects of parenting practices and the mediating role of autonomy. Front. Psychol. 10:363. doi: 10.3389/fpsyg.2019.00363
Keywords: STEM, STEM enrichment, schoolgirls, mixed-methods research, career choice
Citation: Choudhary R, Parappilly M and Woodman R (2025) Perceptions, barriers, and aspirations: understanding Grade 9 girls’ interest in STEM through three-day enrichment programs. Front. Educ. 10:1685063. doi: 10.3389/feduc.2025.1685063
Edited by:
Vanda Santos, University of Aveiro, PortugalReviewed by:
Kelli Paul, Indiana University, United StatesCopyright © 2025 Choudhary, Parappilly and Woodman. This is an open-access article distributed under the terms of the Creative Commons Attribution License (CC BY). The use, distribution or reproduction in other forums is permitted, provided the original author(s) and the copyright owner(s) are credited and that the original publication in this journal is cited, in accordance with accepted academic practice. No use, distribution or reproduction is permitted which does not comply with these terms.
*Correspondence: Rahul Choudhary, cmtjLmdpcmlqYUBnbWFpbC5jb20=