 Wilmer Alexander Edquén Barboza1
 Roberto Carlos Flores Ramirez1
 Jhon Marcos Luna Villanueva1
 Yngue Elizabeth Ramirez Pezo1
 Danny Lévano2
 Nancy Esther Casildo-Bedón2*
- 1Faculty of Engineering and Architecture, School of Systems Engineering, Universidad Peruana Unión, Tarapoto, Peru
- 2Faculty of Engineering and Architecture, School of Systems Engineering, Universidad Peruana Unión, Juliaca, Peru
Objective: To evaluate the effect of an AI-assisted attentional monitoring system on the perception of class dynamism and the self-assessment of attention among university students.
Methods: A quasi-experimental design was employed with 160 students divided into an experimental group, which attended classes with attentional monitoring and real-time feedback provided to the teacher, and a control group, which received traditional instruction. Perception of attention and dynamism was assessed pre- and post-intervention using the AIDA questionnaire.
Results: The experimental group exhibited significant increases in perceived class dynamism and attentional self-regulation compared to the control group (p < 0.05), demonstrating improved engagement during the session.
Conclusion: AI-assisted immediate feedback was associated with enhanced attention and student participation, highlighting the potential of such tools to support and strengthen teaching dynamics in in-person educational settings.
1 Introduction
Student attention is a dynamic process manifested through observable behaviors, such as body posture, head movements, and gaze direction. These indicators reflect not only the student’s cognitive engagement but also their affective disposition toward learning. Recent research has empirically validated this relationship: the combination of trunk posture and gaze orientation allows predicting attentional state with moderate accuracy (75.3%) (Zaletelj and Košir, 2017), and these visual features correlate with neurophysiological measures of cognitive engagement (Sukumaran and Manoharan, 2025). It is important to clarify that in this study, the term ‘attention’ is operationalized through these observable behavioral indicators (posture, head orientation, and gaze). We acknowledge that these are external proxies for cognitive engagement, serving as a ‘behavioral attention’ metric rather than a direct measure of internal cognitive processes. Furthermore, sitting posture has been identified as a key indicator of behavioral engagement in the classroom (Lucía Bernal Castro et al., 2017). Therefore, its monitoring in educational settings has become a priority line of pedagogical research.
Classroom attention levels do not depend solely on the student’s intrinsic motivation but also on teaching strategies, group dynamics, and the physical conditions of the environment. The ergonomic design of school furniture influences the sitting posture adopted by students during prolonged class periods, affecting their physical well-being (Lucía Bernal Castro et al., 2017). Moreover, teacher support in the classroom—understood as timely feedback, clarity of instructions, and pedagogical adaptation—has been identified as the strongest predictor of behavioral and cognitive engagement, even in vulnerable contexts (Fernández-Vega et al., 2021). Digital competence in higher education is crucial for the effective integration of emerging technologies (Fernández et al., 2018).
Recently, advances in artificial intelligence have enabled the automation of student behavior recognition using computer vision. Systems based on architectures such as YOLOv8 can detect postures, head movements, and gaze direction in real time, offering an objective and non-invasive alternative to traditional observational methods (Han et al., 2025). These tools not only reduce human bias but also allow for the generation of continuous metrics that can inform pedagogical decisions in real time (Qureshi et al., 2024).
In the last decade, advances in computer vision and deep learning have enabled multimodal approaches that combine signals of posture, facial orientation, and expression to evaluate student engagement more comprehensively. Qi et al. (2023) demonstrated that multimodal analysis models outperform traditional unimodal methods in accuracy by simultaneously capturing cognitive and emotional components of attention. This type of evidence reinforces the relevance of the AIDA-IA design as a system capable of integrating visual and perceptual dimensions into the measurement of attention in real time.
The combination of computer vision models with behavioral variables improves the accuracy of cognitive pattern recognition in natural environments (Han et al., 2025). In particular, the integration of object detection, body pose estimation, and gaze analysis constitutes a multimodal approach that more accurately reflects the student’s attentional states (Zaletelj and Košir, 2017). This type of approach has inspired the creation of hybrid systems that combine AI-generated data with validated psychopedagogical instruments, strengthening the triangulation between objective evidence and subjective perception (Qureshi et al., 2024).
This design aligns with contemporary approaches that understand school engagement as a multifaceted phenomenon, composed of behavioral, emotional, and cognitive dimensions (Fredricks et al., 2004). This holistic view has recently been supported by neurophysiological and virtual reality evidence confirming the strong influence of emotional states on the modulation of sustained attention and cognitive performance (Luo et al., 2025; Shen et al., 2024). From this perspective, attention is not limited to visual passivity but implies an active agency of the student in their formative process, modulated by personal, pedagogical, and contextual factors (Aspeé et al., 2018).
Within the framework of this research, the authors developed the AIDA (Artificial Intelligence for Dynamic Attention) system, which evaluates student attention across three complementary dimensions: the student’s perceived dynamism, attentional self-assessment, and the perception of change in teaching methodology. This instrument was validated by expert judgment and designed to be applied alongside an artificial intelligence system that analyzes three objective indicators in real time: sitting posture, head movement, and gaze direction. The integration of both tools allows for obtaining a mixed, objective, and subjective measurement of the attention level during in-person classes (Li and Liu, 2024).
Han et al. (2025) state that the introduction of artificial attention mechanisms within architectures such as YOLOv8 improves accuracy in behavior detection in classrooms with multiple students and variable visual conditions. These improvements are pertinent to university contexts where body positions and gaze directions constantly change, and where systems must adapt without interfering with the natural flow of the class. In this sense, artificial intelligence is proposed as a supportive pedagogical resource that enhances, but does not replace, the teaching role.
Finally, this study analyzes the effect of using the AIDA system with artificial intelligence on the attention level of university students, analyzed through its three dimensions: perceived dynamism, attentional self-assessment, and perception of teacher change. The research establishes that the impact is more significant in the first two dimensions as they are directly linked to the individual student experience, while the third could manifest indirect effects mediated by pedagogical practice. This approach constitutes a non-invasive educational innovation, contextualized within the Peruvian university environment, combining visual analytics with psych pedagogical self-assessment to comprehensively understand the phenomenon of attention in the classroom.
Zhang et al. (2025) state that recent artificial intelligence-based models, such as YOLOv8 visual detection architectures, have enabled the automation of student behavior recognition through real-time video analysis. These tools offer advantages over traditional observational methods by reducing human bias and enabling continuous, non-invasive, and multimodal monitoring. Their application in education allows for obtaining objective metrics on attention, movement, and interaction, which facilitates data-driven pedagogical decision-making (Han et al., 2025).
Complementarily, Huang et al. (2022) demonstrated that human pose analysis using deep neural networks allows for identifying patterns of attention and fatigue in educational environments, contributing precision to the detection of non-verbal behaviors associated with active learning. This approach aligns with the trend of integrating computer vision with pedagogical analysis, strengthening the ecological validity of the models.
Likewise, Anh et al. (2019) developed a computer vision application to monitor student behaviors in the classroom through facial recognition and gaze estimation, achieving an accuracy greater than 90%. These results support the viability of applying automated detection models to analyze attention in real-world classroom settings, consistent with the systems used in this research.
Finally, Khan et al. (2024) proposed an approach based on the Deep Face Profiler (DeFaP), which allows for the non-invasive understanding of facial expressions and eye trajectories in real time, consolidating the relationship between facial recognition, posture, and cognitive evaluation. This type of method reinforces the possibility of capturing multimodal attention indicators without affecting the natural dynamics of the classroom.
The present research is framed within this emerging context of artificial intelligence applied to education, analyzing the impact of an automated student attention level detection system in university classrooms by integrating the dimensions of sitting posture, head movement, and eye tracking, in conjunction with the students’ own perception using the AIDA instrument.
2 Methodology
The study of attention in educational contexts requires considering both individual cognitive processes and the social, physical, and technological conditions that modulate them (Fredricks et al., 2004; Luo et al., 2025; Machado-Bagué et al., 2021). Therefore, this research adopted a quantitative, quasi-experimental, and cross-sectional approach, aimed at evaluating the effect of using the AIDA system with artificial intelligence on the attention level of university students during in-person classes.
This design aligns with contemporary approaches that understand school engagement as a multifaceted phenomenon, composed of behavioral, emotional, and cognitive dimensions (Bhavani et al., 2025; Fredricks et al., 2004). Accordingly, the methodology was organized into two complementary components: (1) the development and integration of an artificial intelligence system for the automated detection of attention indicators, and (2) an educational experimental design focused on the application of a psychopedagogical instrument and the comparison between control and experimental groups.
2.1 Development of the AIDA-IA system
Recent advances in computer vision have enabled the development of systems capable of detecting attentional behaviors in real time in dynamic environments such as the classroom. In particular, architectures like YOLOv8 have demonstrated high precision in detecting human postures and movements (Han et al., 2025). The selection of the YOLOv8-Pose architecture was supported by its state-of-the-art performance benchmarks on the COCO Keypoints dataset. The model demonstrates high reliability with a mean Average Precision (mAP) at 0.5 IoU ranging from 79.7 to 85.8% (depending on the model variant, nano or small). Furthermore, given the reported CPU inference latency of approximately 130 ms to 230 ms per image, the implementation of a frame-skipping strategy (processing 1 frame per second) was technically justified to maintain system stability and avoid latency accumulation during real-time monitoring. Following this line, the AIDA-IA system integrated three technical modules (Ji et al., 2025):
• Sitting posture detection, based on evidence that body posture is a key indicator of behavioral engagement and correlates with attentional stability (Lucía Bernal Castro et al., 2017);
• Head movement tracking, adapted from the OpenPose model, to detect turns or deviations that indicate distraction (Zaletelj and Košir, 2017);
The choice of these indicators is justified because, in the absence of eye-tracking, the combination of head orientation and sitting posture allows for inferring the student’s attentional focus with greater precision than the analysis of each signal separately. In online learning environments, head pose estimation using Euler angles combined with the analysis of the face bounding box area has proven to achieve an accuracy of 85.5% in detecting attentional states (mAP on WiderFace), functioning efficiently in real time with conventional cameras and low-cost hardware (Li and Liu, 2024). Furthermore, multimodal research combining electroencephalography with automatic visual feature analysis has validated that postural and facial signals can serve as non-invasive proxies of attentional engagement, showing that head pose and facial expression data consistently correlate with brain patterns of attention in cross-validation studies (Sukumaran and Manoharan, 2025).
Regarding the nature of the artificial intelligence implementation, the system is defined as an automated detection tool based on pre-trained Deep Learning models (YOLOv8) used for real-time inference. It does not employ online learning or adaptive mechanisms that update model parameters during the class session; rather, it provides immediate feedback based on established thresholds.
To integrate these three behavioral indicators into a single attention metric, a deterministic additive logic was implemented. Each indicator (head orientation, gaze direction, and sitting posture) is evaluated against calibrated thresholds (e.g., torso angle < 155° for posture), generating a binary state (Correct = 1/Incorrect = 0). These threshold values were established based on the ergonomic classification of ‘active sitting’ proposed by Lucía Bernal Castro et al. (2017) and were subsequently fine-tuned through empirical testing to filter out natural body adjustments. The individual attention score is calculated as the sum of these valid states (Range: 0–3). A score of 3 is categorized as ‘High Attention’, 2 as ‘Medium’, and 0–1 as ‘Low’. This additive approach provides robustness against common classroom behaviors such as note-taking. For instance, if a student looks down to write, they may lose the ‘gaze’ indicator point. However, as long as their torso remains upright (posture) and their head does not rotate laterally toward peers (head orientation), the system assigns a score of 2 (‘Medium Attention’). This prevents the system from misclassifying productive academic activities as disengagement, addressing the ambiguity of visual signals without requiring invasive monitoring.
The system was optimized to operate in real time with conventional cameras, respecting ethical principles of anonymization and non-intervention (Lara-Jacho et al., 2020). Visual alerts were triggered when group attention averages fell below predefined thresholds, a strategy validated in automatic behavior detection systems to promote timely pedagogical interventions (Han et al., 2025; Anguera et al., 2020).
The architecture of the AIDA-IA system is grounded in recent developments integrating computer vision and the Internet of Things (IoT) in educational contexts, allowing for continuous and ethical monitoring of student attention. The term IoT (Internet of Things) refers to the interconnection of physical devices such as cameras, sensors, and computers that collect and share data through digital networks to generate real-time feedback. In the educational field, this integration enables artificial intelligence systems to operate autonomously during class, without interrupting the pedagogical process. Riad et al. (2024) implemented a similar model based on convolutional networks and smart sensors, highlighting the importance of connectivity and immediate feedback to maintain participation in real-world classroom environments.
2.2 Educational experimental design
The experimental design was implemented at the Universidad Peruana Unión, Juliaca campus, during the first academic term of 2025. The independent variable was the use of the AIDA-IA system (present in the experimental group, absent in the control group). A quasi-experimental design was adopted due to the ecological constraints of a real university setting, where randomization of students was not feasible as academic sections were pre-established by the university enrollment system. To mitigate selection bias, a pre-test/post-test design was employed to control for initial differences. The intervention lasted for 8 weeks (one academic unit), a duration considered sufficient to overcome the initial novelty effect and observe stabilization in behavioral patterns. The dependent variables corresponded to the three dimensions of the AIDA instrument: perceived dynamism, attentional self-assessment, and perception of teacher change, in addition to the objective indicator of group attention derived from the AI system.
This approach addresses the need for triangulation between objective and subjective data, a central principle in modern observational methodologies (Anguera et al., 2020). Participation was voluntary and anonymous, with informed consent and approval from the Institutional Ethics Committee.
2.3 Technological and psychopedagogical integration
The proposal is framed within an ecological perspective of educational technology, in which ICT is not imposed but articulated with teaching practice, the curriculum, and school culture (Anguera et al., 2020). The AIDA-IA system does not replace the teacher but provides them with contextualized information to adjust their strategy in real time, in line with the principles of teacher agency and noticing (van Es and Sherin, 2021).
This integration addresses the need to build intelligent educational environments that combine visual analytics with self-reflection, strengthening the ecological validity of attentional monitoring (Anh et al., 2019; Qureshi et al., 2024; Zhang et al., 2025).
2.4 Experimental procedure
The intervention was carried out over a period of 8 weeks. To minimize the teacher effect, the sessions were conducted by two instructors who followed a standardized pedagogical protocol. Both instructors coordinated weekly to ensure consistency in the syllabus content, teaching style, and the application of the AIDA system’s feedback. Additionally, the experimental and control groups were balanced between the two instructors to prevent bias.
3 Population and sample
The population consisted of 160 students enrolled in the Communication Skills course at the Juliaca campus of Universidad Peruana Unión, during the first academic unit of the year 2025. The participants belonged to the Civil Engineering, Environmental Engineering, and Systems Engineering programs, corresponding to the first cycle of university studies.
In compliance with ethical principles of confidentiality and anonymity, gender information was not recorded. However, information regarding age was obtained, ranging between 17 and 20 years, with a mean of 18.4 years (SD = 0.9), which corresponds to the typical range for students recently entering higher education. This data reinforces the age homogeneity of the sample and the pertinence of the group for analyzing attentional processes in initial university learning contexts.
The sample was determined through non-probabilistic convenience sampling, based on existing academic sections. During the data collection process, variations in enrollment were recorded due to transfers, absenteeism, and non-participation in the AIDA questionnaire, which reduced the effective number of valid cases analyzed.
For the Wilcoxon tests, the effective sample consisted of 89 students, distributed by professional school as follows: Environmental Engineering (n = 26), Civil Engineering (n = 28), and Systems Engineering (n = 35). In the case of the Mann–Whitney U intergroup tests, 60 valid participants were considered, distributed across Environmental (n = 17), Civil (n = 22), and Systems (n = 21).
In the global analyses, the research team, with the advice of a statistical specialist, carried out a process of data cleaning and case matching to ensure the validity of the comparisons. Thus, the final samples consisted of 61 participants for Wilcoxon and 122 participants for Mann–Whitney U, respectively.
The reduction in the effective sample size was due to natural factors inherent to the ecological validity of the study, such as student absenteeism and withdrawal from the course. Strict data cleaning criteria (listwise deletion) were applied to ensure that only students with complete paired data (pre- and post-test) were included in the Wilcoxon analysis, prioritizing data quality over quantity (Table 1).

Table 1. Baseline characteristics of participants by group.
3.1 Instruments
The assessment of complex cognitive constructs, such as attention, requires multimodal approaches for a comprehensive evaluation. Recent research indicates that, while observational metrics (such as eye-tracking) are valuable, they have limitations in capturing the entirety of cognitive processes. In line with this, and seeking an integration of quantitative and qualitative data, this research employed two complementary instruments:
The automated AIDA-IA system, based on computer vision. The psychopedagogical instrument AIDA (Artificial Intelligence for Dynamic Attention), designed by the authors and validated through expert judgment.
Recent advances in computer vision have enabled the development of systems capable of detecting attentional behaviors in real-time in dynamic environments such as the classroom. In particular, architectures such as YOLOv8 have demonstrated high accuracy in detecting human postures and movements (Han et al., 2025). Indeed, the application of video-based approaches for real-time monitoring, through the analysis of multiple facial and body features, is considered a robust method for detecting distraction and engagement in learning environments (Wang et al., 2025). Following this line, the AIDA-IA system integrated three technical modules:
Sitting posture, detected using a YOLOv8 model adapted to the lighting and spatial conditions of the classroom, a choice based on evidence linking body posture with behavioral engagement and attentional stability (Lucía Bernal Castro et al., 2017); head movement, calculated from the estimation of keypoints obtained with OpenPose, allowing for the recording of turns or deviations associated with distraction (Zaletelj and Košir, 2017); and gaze direction, determined through facial orientation analysis using the OpenFace library, which estimates visual attention toward the teacher or class material (Li and Liu, 2024). The system processed data in real-time and generated a continuous visualization of the group attention level. When a collective decrease was detected, a non-intrusive visual alert was issued to the teacher, who could perform immediate pedagogical interventions (Qureshi et al., 2024). The design was non-invasive, used conventional cameras, and respected ethical principles of anonymization and confidentiality, consistent with best practices in educational research with AI (Moreno Padilla, 2019).
3.1.1 AIDA psychopedagogical instrument
The AIDA (Artificial Intelligence for Dynamic Attention) questionnaire was developed and validated with the purpose of evaluating student attention from a multidimensional perspective. The instrument consists of 14 items distributed across three theoretically grounded dimensions:
Perceived Student Dynamism (5 items), Attentional Self-Assessment (5 items), and Perception of Teacher Change (4 items). Each item was answered on a five-point Likert scale (1 = strongly disagree; 5 = strongly agree). Items included statements such as: “The teacher maintained my interest for a period of time (20–30 min),” “The teacher modifies their methodology when class attention is lost,” or “I maintain an adequate physical posture that favors my attention during class.”
Although the questionnaire was applied for the first time in this research, its content aligns with constructs validated in the literature:
The attentional self-assessment dimension reflects cognitive self-regulation, a key predictor of academic performance (Cid-Sillero et al., 2020). The dimension of perception of teacher change is linked to pedagogical credibility and adaptability, factors that directly influence emotional and behavioral engagement (Froment et al., 2021). The instrument was reviewed by specialists in education and applied technology, who confirmed its conceptual coherence and adequacy for the university context. During its application, no comprehension difficulties were reported, suggesting acceptable content validity and promising practical reliability.
3.1.1.1 Psychometric validation
Although the instrument was initially validated through expert judgment, a post-hoc reliability analysis was conducted using JASP software to ensure internal consistency. The Cronbach’s alpha coefficient (α) was calculated for the global scale and for each of the three dimensions. The results indicated excellent reliability, with a global α of 0.970. The specific dimensions also demonstrated high internal consistency, ranging from 0.900 to 0.932, well above the acceptable threshold of 0.70 (see Table 2). These values confirm that the AIDA questionnaire is a reliable instrument for measuring student attention perceptions in this context.

Table 2. Reliability analysis of the AIDA instrument (Cronbach’s alpha).
3.1.1.2 Technological and psychopedagogical integration
The combination of computer vision models with behavioral variables improves the accuracy of cognitive pattern recognition in natural environments (Han et al., 2025). Consistent with this evidence, the AIDA-IA system and the AIDA instrument were designed to function in an articulated manner: the visual data obtained by artificial intelligence were interpreted in light of the perceptions reported by the students.
This multimodal and interdisciplinary approach strengthens the ecological validity of the study by capturing both observable aspects (posture, gaze, and movement) and self-referential ones (subjective perception of attention and dynamism). Furthermore, it aligns with contemporary approaches advocating for methodological triangulation in complex educational contexts (Anguera et al., 2020).
3.2 Implementation
3.2.1 Practical implementation and system interface
To guarantee viability and acceptance by the teacher, the AIDA-IA system was designed with an intuitive and non-intrusive user interface. The practical implementation was carried out in the classroom during face-to-face sessions, using conventional cameras installed on the ceiling or on the front wall (Figures 1, 2).

Figure 1. Engineering design of the attention system.

Figure 2. AIDA-IA system dashboard interface for the teacher.
The system processes data in real-time and generates two types of visual outputs:
• Teacher dashboard: A web platform accessible from any device, displaying key metrics such as the class average attention level, the number of alerts generated, and details of the current class (course, school, classroom, and schedule). This interface allows the teacher to monitor class dynamics without the need to interpret complex technical data.
• Real-time visualization on video: Overlaid on the camera video feed, the system tags each student with their estimated attention level (low, medium, and high), along with the percentages of sitting posture and head orientation. This analysis is performed using the YOLOv8 architecture and pose estimation models, as described in the previous section.
The complete dashboard interface is shown during a class session. It is observed how the system presents a general summary (total classes, average attention, alerts) and a line graph reflecting the attention level in real-time, allowing the teacher to identify moments of low concentration (Figure 3).

Figure 3. Real-time visualization of student attention on the camera video.
It illustrates the real-time visualization on the camera video. Each student is identified with a bounding box and text labels indicating their attention state based on three indicators: sitting posture, gaze direction, and head movement. The colors (green, yellow, red) provide a quick coding of the attention level, facilitating immediate pedagogical decision-making.
Finally, Figure 4 notification generated by the operating system on the teacher’s equipment shows an example of the alert functionality. When the class average attention level drops below a predefined threshold (for example, 42%), the system activates a visual alert (a warning icon) and displays a textual recommendation (“Low attention level detected”). This immediate and contextualized feedback is the core of the system’s pedagogical approach, as it seeks to empower the teacher to adjust their strategy at the precise moment.

Figure 4. Example of objective data from the AIDA-AI system during a class session.
4 Results
During the experimental process, data from the AIDA questionnaire and automatic records from the AIDA-IA system were collected. Statistical analyses were performed using non-parametric tests: Wilcoxon signed-rank for intragroup comparisons (pre and post) and Mann–Whitney U for intergroup comparisons (experimental and control), with a significance level of α = 0.05.
The detailed score distributions, median changes, and visual comparisons between groups are presented in Figures 5–13, complementing the statistics presented in the tables below.
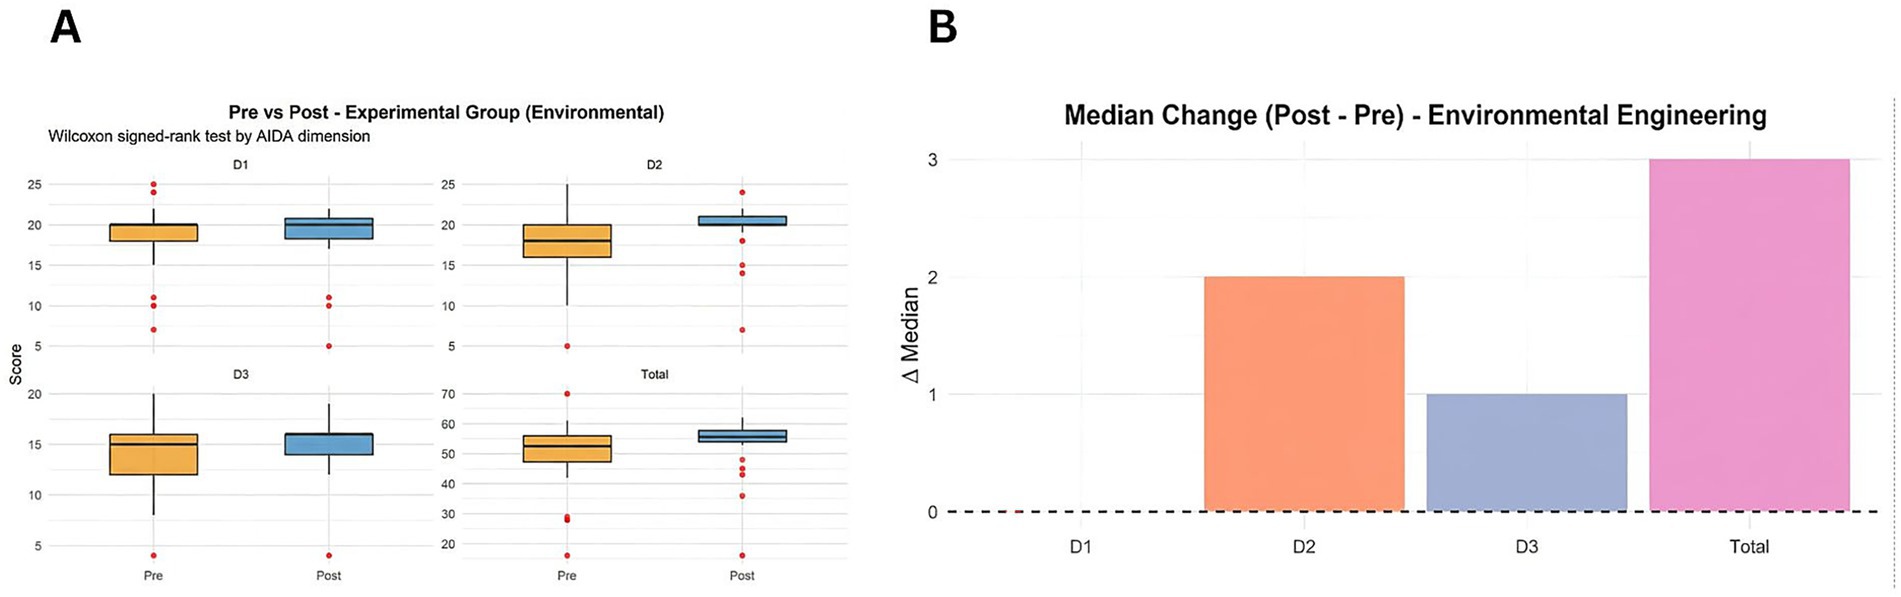
Figure 5. Results for environmental engineering (Wilcoxon signed-rank test). (A) Pre-test vs. post-test score distribution across dimensions. (B) Median change (post – pre) highlighting significant improvements in perceived dynamism and self-assessment.

Figure 6. Results for civil engineering (Wilcoxon signed-rank test): (A) pre-test vs. post-test score distribution and (B) median change showing stability in scores across dimensions.

Figure 7. Results for systems engineering (Wilcoxon signed-rank test). (A) Pre-test vs. post-test score distribution. (B) Median change per dimension showing no significant variations.

Figure 8. Inter-group comparison for environmental engineering (Mann–Whitney U). (A) Distribution of post-test scores for experimental vs. control groups. (B) Effect size indicating the magnitude of the difference between groups.
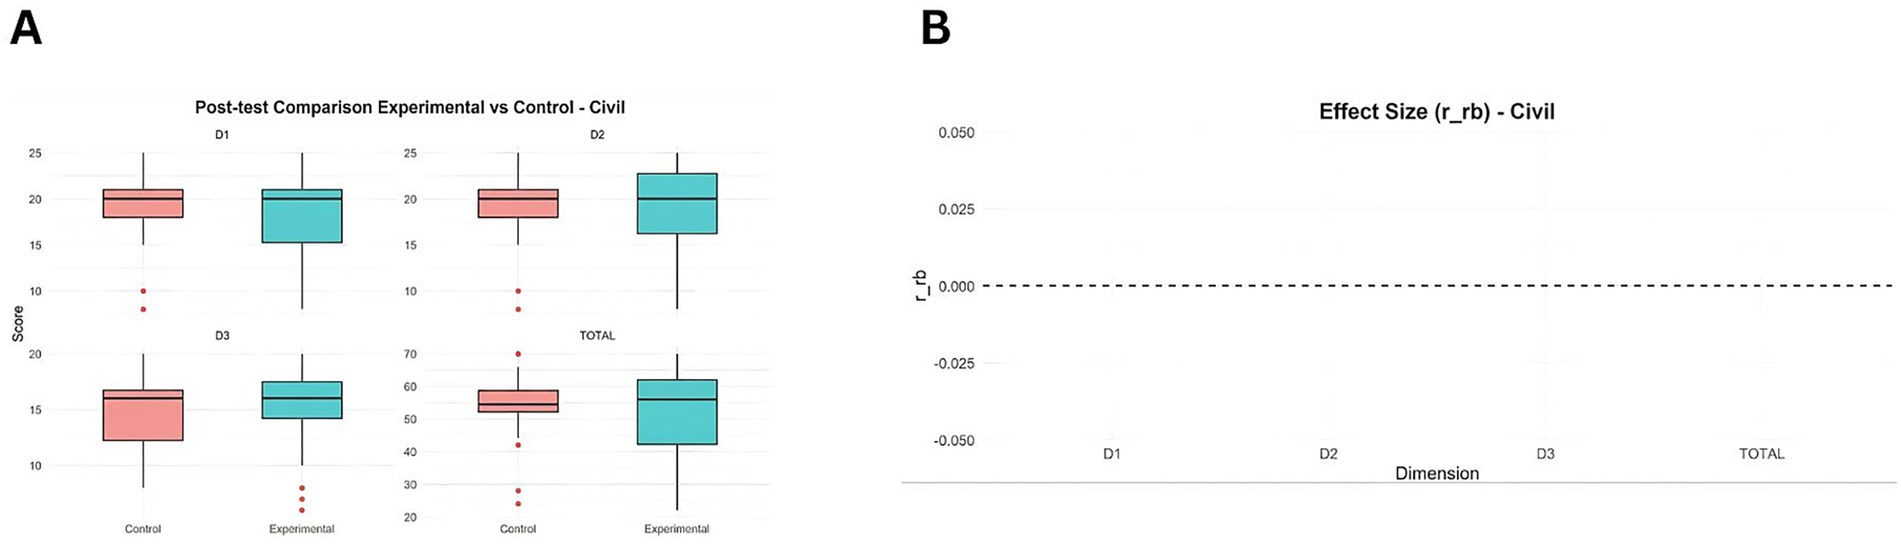
Figure 9. Inter-group comparison for civil engineering (Mann–Whitney U). (A) Distribution of post-test scores. (B) Effect size per dimension.

Figure 10. Inter-group comparison for systems engineering (Mann–Whitney U). (A) Distribution of post-test scores. (B) Effect size per dimension.

Figure 11. General intra-group results (n = 61). (A) Overall pre-test vs. post-test distribution for the combined sample. (B) General median change showing overall stability.

Figure 12. Comparative intra-group analysis by program. (A) Detailed pre-post distribution comparing the three engineering programs. (B) Median change contrasted by school, highlighting the specific increase in environmental engineering.

Figure 13. General inter-group results (N = 122). (A) Overall comparison between experimental and control groups. (B) Post-test distribution broken down by academic program.
4.1 Intra-group results (Wilcoxon signed-rank test)
In the Environmental Engineering Program (n = 26), significant differences were observed between the pre-test and post-test in two dimensions of the AIDA instrument: Perceived Dynamism and Attentional Self-Assessment. In both dimensions, the results suggest an improvement following the AIDA-AI system intervention, while the total score showed only a non-significant trend (see Table 3).

Table 3. Wilcoxon signed-rank test results by program (pre vs. post): W, z, p y r_rb statistics by dimension and total.
Conversely, in the Civil Engineering (n = 28) and Systems Engineering (n = 35) Programs, no statistically significant changes were evidenced between the pre- and post-measurements. Scores maintained a relative stability, which may indicate lower system sensitivity to the pedagogical conditions of these specific environments or a higher homogeneity in initial attention levels.
Figure 2 illustrates the average attention level estimated by the AIDA-AI system during a 90-min session with Civil Engineering students. The graph shows natural fluctuations in the attentional level, with peaks occurring during participatory activities and decreases during traditional lectures. These objective records complement the AIDA questionnaire data by providing a dynamic visualization of group behavior.
4.2 Inter-group results (Mann–Whitney U test)
In the comparison between groups (experimental group with AIDA-AI system use and control group without technological intervention), the results showed significant differences exclusively within the Environmental Engineering Program, particularly in the Attentional Self-Assessment dimension. In this program, experimental group students reported a more favorable perception of their attention level after the intervention (see Table 3).
In Civil Engineering and Systems Engineering, no significant differences were found between the groups, suggesting that the effectiveness of the AIDA-AI system may depend on contextual factors such as teaching style, interaction modality, or class structure.
4.3 General results
Following data cleaning and case matching (n = 61 for the Wilcoxon signed-rank test and N = 122 for the Mann–Whitney U test), the global analyses did not show significant differences in any of the evaluated dimensions. In both tests, the obtained values suggest a tendency toward stability between the pre-test and post-test, with no statistically relevant changes in perceived attention at the general level (see Tables 4, 5).

Table 4. Mann–Whitney U test results by program (post-intervention comparison: experimental vs. control): U, p y r_rb by dimension and total.
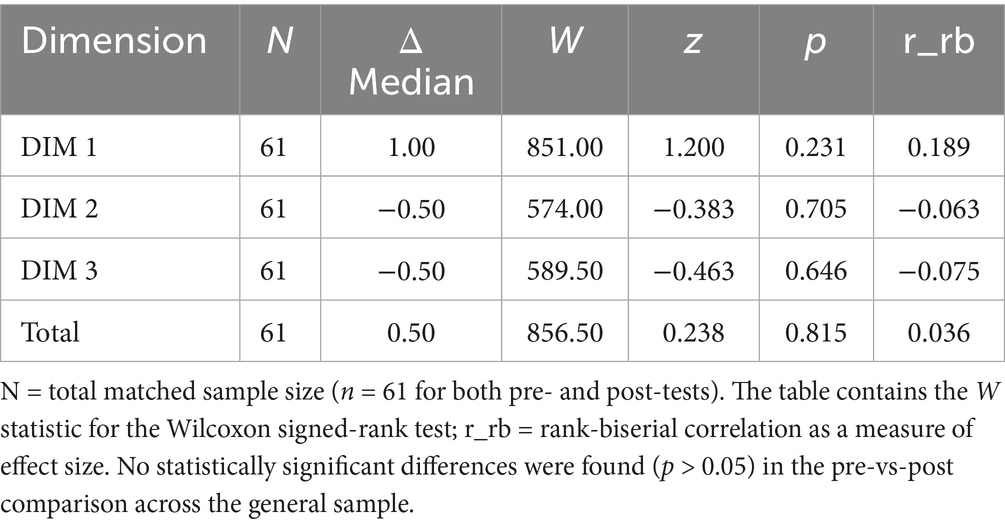
Table 5. General Wilcoxon results (n = 61): W, z, p, rrb.
4.4 Synthesis of findings
Synthesis of findings collectively, the results indicate that:
• In the intra-group analysis, significant improvements in Perceived Dynamism and Attentional Self-Assessment were identified exclusively within the Environmental Engineering Program.
• In the inter-group analysis, significant differences were also concentrated in the Attentional Self-Assessment dimension for the same program.
• In the global analyses, no significant differences were found between groups or between measurement time points.
These results suggest that the use of the AIDA-AI system may be associated with specific, localized improvements in the attentional perception of Environmental Engineering students, although no generalized effects were evidenced across the entire sample. These quantitative findings provide a solid basis for the pedagogical interpretation developed in the Discussion section (Table 6).

Table 6. General Mann–Whitney U test results (N = 122).
4.5 Objective attention metrics and group-level consistency
Due to the privacy-by-design architecture of the AIDA-AI system, which processes anonymized group metrics in real-time without storing individual biometric profiles, a direct student-level correlation analysis was not ethically feasible. However, to address the relationship between objective monitoring and subjective perception, a group-level analysis was conducted across the effective sessions captured during the 8-week intervention period.
Table 7 presents the comparison between the objective attention levels recorded by the AI system and the self-reported perception scores. It is important to note that while the intervention spanned an academic unit of 2 months, the number of analyzed sessions varies per group due to ecological validity factors common in real-world university settings (e.g., holidays, institutional events, or hybrid modality days where camera detection was null).

Table 7. Comparison of objective AI attention levels vs. subjective perception by program.
The heterogeneity in results across programs suggests that technology alone does not guarantee improvement. While Environmental Engineering students showed significant gains in self-perception (p < 0.05), aligning with a consistent AI-monitored attention level (53.7%), the Civil Engineering group exhibited a decreasing trend in objective attention (dropping from 59% in the first recorded session to 45% in the last). This objective decline provides a plausible explanation for the lack of significant improvement in their self-reported AIDA scores. Similarly, although Systems Engineering maintained the highest average objective attention (55.0%), the lack of perceived improvement may be attributed to the specific time block (14:05–16:50), where circadian fatigue could mask the perception of dynamism despite high behavioral compliance. This highlights that the AIDA-AI system acts as a pedagogical mediator whose effectiveness depends heavily on the quality of the subsequent human intervention and contextual factors.
5 Discussion
The results suggest that the implementation of an Artificial Intelligence (AI) system aimed at monitoring student attention was associated with localized improvements in specific dimensions of the AIDA instrument, particularly in Perception of Teaching Change (D2) and Attentional Self-Assessment (D3). These improvements were statistically significant within the Environmental Engineering program, yielding p < 0.05 values in the Wilcoxon signed-rank test and moderate to large effect sizes (r_rb = 0.52–0.58), which suggests a potentially substantive impact of the intervention rather than merely a marginal change.
These findings articulate with the results reported by Lu and Cutumisu (2022), who demonstrated that self-regulated attention and engagement act as mediators between participation and academic performance. Consequently, the observed increases in the dimensions of Perceived Teaching Dynamism and Attentional Self-Assessment suggest that the AIDA-AI system not only facilitates the observation of attentional behavior but also promotes more sustained cognitive engagement.
While the strict privacy-by-design architecture precluded a traditional student-level correlation analysis (Spearman) between AI metrics and questionnaire scores, the group-level analysis (Table 7) revealed a functional convergence. In the Environmental Engineering group, the sustained objective attention levels (53.6%) aligned consistently with the significant improvements in self-perception (p < 0.05). Conversely, in the Civil Engineering group, the decreasing trend in objective attention (dropping from 59 to 45%) successfully predicted the lack of subjective improvement. This macroscopic alignment validates the system’s ability to reflect collective classroom dynamics, satisfying the need to link objective and subjective measures without compromising student anonymity.
Complementarily, Trabelsi et al. (2023) developed an attention detection system based on YOLOv5, demonstrating the feasibility of using lightweight computer vision architectures for real-time monitoring of student behavior. Similar to that study, the AIDA-AI system implemented in this research prioritized a non-invasive and ethical approach, focusing on the improvement of the pedagogical process rather than behavioral control.
According to Han et al. (2025), l systems based on visual detection models like YOLOv8 enable the automatic, real-time capture of behavioral and attentional patterns in the classroom, thereby facilitating immediate pedagogical interventions. This empirical evidence supports the principle that educational AI should not only collect data but also integrate into formative feedback processes that enhance classroom dynamics. In our case, the visual feedback and real-time alerts likely served as input for the instructor to adjust their methodology, which could have fostered the observed improvement in dimensions D2 and D3.
The heterogeneity in results across programs (significant only in Environmental Engineering) suggests that technology alone does not guarantee improvement. The positive effect in the Environmental group may be attributed to a higher sensitivity or more effective adoption of the alerts by the instructor in that specific group. This highlights that the AI system acts as a pedagogical mediator whose effectiveness depends heavily on the quality of the subsequent human intervention.
From a statistical standpoint, the combined use of the Wilcoxon signed-rank test (for intra-group comparisons) and the Mann–Whitney U test (for inter-group contrasts) allowed the intervention effects to be analyzed without assuming normality in data distributions, which was appropriate given the ordinal nature of the Likert scales employed. The effect sizes, calculated using r_rb and Cohen’s d, complemented the interpretation of the significance, indicating that the impact was moderate in Environmental Engineering but only slight in Civil and Systems. This supports the methodological recommendations of Fritz et al. (2012), who emphasize the importance of reporting effect sizes alongside significance to evaluate the actual magnitude of educational changes.
Pedagogically, the results align with the framework proposed by Black and Wiliam (1998), who suggest that immediate formative feedback strengthens both instructor and student self-regulation. In our study, the AI–instructor system functioned precisely under this principle, enabling real-time adjustments that favored classroom interaction and dynamism. Similarly, Marquez-Carpintero et al. (2023) reported that emerging technologies providing immediate feedback enhance participation and reduce distraction in university settings, which is in concordance with our overall results.
We recognize, however, relevant limitations. The effective sample size was reduced due to variability in student attendance and changes in enrollment, which may have affected the statistical power of some tests, particularly within the Civil and Systems Engineering programs. Furthermore, the AIDA instrument evaluates self-reported perceptions, making the data susceptible to subjective bias, and the duration of the intervention (2 months) limits the inference regarding the sustainability of the effects. Finally, technical conditions (e.g., lighting, classroom setup) could have influenced the system’s precision, as noted by Han et al. (2025) concerning the challenges of visual detection in uncontrolled environments. Additionally, we acknowledge the potential influence of the Hawthorne effect, where students might modify their behavior due to the awareness of being monitored. However, the system used discreet cameras, and a habituation process was observed over the 8 weeks, suggesting a decrease in initial reactivity.
Taken together, these findings are consistent with the hypothesis that the integration of artificial intelligence systems with adaptive pedagogical strategies could enhance sustained attention and engagement in real university contexts. The statistical evidence obtained, coupled with the theoretical and empirical coherence from previous research, suggests that AI can act as an effective pedagogical mediator, fostering more dynamic, reflective, and data-driven learning.
6 Conclusion
In this research, we implemented and evaluated an instructor support system aimed at promoting sustained attention in the university classroom. Based on its application, the results suggest localized improvements in engagement and attentional self-regulation within the experimental group. This suggests that attention can be stimulated when the student actively engages in classroom dynamics and reflects on their own attentional process.
The system was established not only as a means of recording and monitoring but also as a resource that facilitated pedagogical adjustment during the session, promoting more dynamic, participatory, and group-needs-adapted classes. Thus, these findings provide preliminary evidence on the utility of integrating immediate feedback mechanisms into the classroom, highlighting their potential to support the quality of the educational in experience specific contexts where teacher adoption is active.
We consider it relevant that future studies explore the application of this system in other academic contexts or teaching modalities, as well as its integration with complementary technological tools that allow for a deeper understanding of the attentional process in real learning environments.
Data availability statement
The original contributions presented in the study are included in the article/supplementary material, further inquiries can be directed to the corresponding author.
Ethics statement
The studies involving humans were approved by Research and Innovation Ethics Committee, Peruvian Union University. The studies were conducted in accordance with the local legislation and institutional requirements. The participants provided their written informed consent to participate in this study. Written informed consent was obtained from the individual(s) for the publication of any potentially identifiable images or data included in this article.
Author contributions
WE: Methodology, Investigation, Writing – original draft, Software, Project administration. RC: Formal analysis, Data curation, Writing – original draft, Validation. JL: Writing – original draft, Methodology, Software, Investigation, Data curation. YR: Software, Data curation, Writing – review & editing. DL: Writing – review & editing, Software, Conceptualization, Validation, Supervision. NC-B: Supervision, Writing – review & editing, Validation, Investigation.
Funding
The author(s) declared that financial support was not received for this work and/or its publication.
Conflict of interest
The author(s) declared that this work was conducted in the absence of any commercial or financial relationships that could be construed as a potential conflict of interest.
Generative AI statement
The author(s) declared that Generative AI was used in the creation of this manuscript. Generative artificial intelligence was used exclusively for grammatical refinement and stylistic improvement of the manuscript, aiming to optimize clarity and readability. The authors have thoroughly reviewed the resulting content and assume full responsibility for the accuracy, originality, and integrity of the information presented in this document.
Any alternative text (alt text) provided alongside figures in this article has been generated by Frontiers with the support of artificial intelligence and reasonable efforts have been made to ensure accuracy, including review by the authors wherever possible. If you identify any issues, please contact us.
Publisher’s note
All claims expressed in this article are solely those of the authors and do not necessarily represent those of their affiliated organizations, or those of the publisher, the editors and the reviewers. Any product that may be evaluated in this article, or claim that may be made by its manufacturer, is not guaranteed or endorsed by the publisher.
References
Anguera, M., Blanco-Villaseñor, A., Luis Losada, J., and Sánchez-Algarra, P. (2020). Integración de elementos cualitativos y cuantitativos en metodología observacional. Ámbitos Rev. Int. Comun. 49, 49–70. doi: 10.12795/Ambitos.2019.i49.04
Anh, B. N., Son, N. T., Lam, P. T., Chi, L. P., Tuan, N. H., Dat, N. C., et al. (2019). A computer-vision based application for student behavior monitoring in classroom. Appl. Sci. 9:4729. doi: 10.3390/APP9224729
Aspeé, J. E., González, J. A., and Cavieres-Fernández, E. A. (2018). Student engagement in higher education as a complex agency. Form. Univ. 11, 95–108. doi: 10.4067/S0718-50062018000400095
Bhavani, B. D., Shetty, R., and D M, M. (2025). Enhancing student engagement and personalized learning through AI tools: a comprehensive review. Comput. Sci. Engineer. Int. J. 15, 111–119. doi: 10.5121/CSEIJ.2025.15113
Black, P., and Wiliam, D. (1998). Assessment and classroom learning. Int. J. Phytoremediation 5, 7–74. doi: 10.1080/0969595980050102
Cid-Sillero, S., Pascual-Sagastizabal, E., and Martinez-de-Morentin, J. I. (2020). Influence of self-esteem and attention on the academic performance of ESO and FPB students. Rev. Psicodidact. 25, 59–67. doi: 10.1016/j.psicod.2019.06.001
Fernández, C. C., Cortés, C. M. A. C., and Morueta, R. T. (2018). Understanding the improvement of the engagement of students of educational compensation. Rev. Unav. 35, 473–498. doi: 10.15581/004.34.473-498
Fernández-Vega, I., Santos-Juanes Jiménez, J., and Quirós, L. M. (2021). Uso de la app Kahoot para cuantificar el grado de atención del alumno en la asignatura de Anatomía Patológica en Medicina y evaluación de la experiencia. Educación Médica 22, 375–379. doi: 10.1016/j.edumed.2020.01.003
Fredricks, J. A., Blumenfeld, P. C., and Paris, A. H. (2004). School engagement: potential of the concept, state of the evidence. Rev. Educ. Res. 74, 59–109.
Fritz, C. O., Morris, P. E., and Richler, J. J. (2012). Effect size estimates: current use, calculations, and interpretation. J. Exp. Psychol. Gen. 141, 2–18. doi: 10.1037/A0024338,
Froment, F., Bohórquez, M. R., and García González, A. J. (2021). The impact of teacher credibility and student motivation on teaching evaluations. Rev. Esp. Pedagog. 79, 413–435. doi: 10.22550/REP79-3-2021-03
Han, L., Ma, X., Dai, M., and Bai, L. (2025). A WAD-YOLOv8-based method for classroom student behavior detection. Scient. Report 15, 1–15. doi: 10.1038/s41598-025-87661-w
Huang, Y. M., Cheng, A. Y., and Wu, T. T. (2022). Analysis of learning behavior of human posture recognition in maker education. Front. Psychol. 13:868487. doi: 10.3389/FPSYG.2022.868487,
Ji, Y., Jin, Y., Wang, Z., and Tan, S. (2025). EPLC-pose: a lightweight student posture recognition network under panoramic classroom. IEEE Access 13, 86799–86811. doi: 10.1109/ACCESS.2025.3570792
Khan, W., Topham, L., Alsmadi, H., Al Kafri, A., and Kolivand, H. (2024). Deep face profiler (DeFaP): towards explicit, non-restrained, non-invasive, facial and gaze comprehension. Expert Syst. Appl. 254:124425. doi: 10.1016/J.ESWA.2024.124425
Lara-Jacho, S. B., Albarracín-Zambrano, L. O., and Ponce-Ruiz, D. V. (2020). Prototipo de reconocimiento facial para mejorar el control de asistencia de estudiantes en UNIANDES, Quevedo. Rev. Arbitrada Interdisc. Koinonía 5:60. doi: 10.35381/r.k.v5i2.876
Li, B., and Liu, P. (2024). Online learning state evaluation method based on face detection and head pose estimation. Sensors 24:1365. doi: 10.3390/s24051365,
Lu, C., and Cutumisu, M. (2022). Online engagement and performance on formative assessments mediate the relationship between attendance and course performance. Int. J. Educ. Technol. High. Educ. 19:2. doi: 10.1186/S41239-021-00307-5,
Lucía Bernal Castro, M., Rincón Becerra, O., Ricardo Zea Forero, C., and Vanesa Durán Cortés, L. (2017). Método para la categorización de posturas en el aula de clase. Hacia la Promoción de la Salud 22, 114–126. doi: 10.17151/hpsal.2018.23.1.3
Luo, J., Zheng, C., Yin, J., and Teo, H. H. (2025). Design and assessment of AI-based learning tools in higher education: a systematic review. Int. J. Changes. Educ. 1, 1–12. doi: 10.1186/S41239-025-00540-2
Machado-Bagué, M., María Márquez-Valdés, A., and Acosta-Bandomo, R. U. (2021) Consideraciones teóricas sobre la concentración de la atención en educandos theoretical considerations on the concentration of attention in students. Revista de Educación y Desarrollo 59, 75–82.
Marquez-Carpintero, L., Pina-Navarro, M., Suescun-Ferrandiz, S., Escalona, F., Gomez-Donoso, F., Roig-Vila, R., et al. (2023). Artificial intelligence-based system for detecting attention levels in students. J. Vis. Exp. e65931. doi: 10.3791/65931
Moreno Padilla, R. D. (2019). La llegada de la inteligencia artificial a la educación. Rev. Invest. Tecnol. Inform. 7, 260–270. doi: 10.36825/riti.07.14.022
Qi, Y., Zhuang, L., Chen, H., Han, X., and Liang, A. (2023). Evaluation of students’ learning engagement in online classes based on multimodal vision perspective. Electronics 12:1845. doi: 10.3390/electronics12081845
Qureshi, F. M., Šola, H. M., Qureshi, F. H., and Khawaja, S. (2024). AI eye-tracking technology: a new era in managing cognitive loads for online learners. Educ. Sci. 14, 1–25. doi: 10.3390/educsci14090933
Riad, M., Qbadou, M., and Aoula, E. S. (2024). Learner’s attention detection in connected smart classroom using internet of things and convolutional neural networks. Int. J. Electr. Comput. Engineer. 14, 3455–3466. doi: 10.11591/IJECE.V14I3.PP3455-3466
Shen, Y., Zheng, H., Li, Y., and Tian, X. (2024). Understanding emotional influences on sustained attention: a study using virtual reality and neurophysiological monitoring. Front. Hum. Neurosci. 18:1467403. doi: 10.3389/FNHUM.2024.1467403/BIBTEX
Sukumaran, A., and Manoharan, A. (2025). Student engagement recognition: comprehensive analysis through EEG and verification by image traits using deep learning techniques. IEEE Access 13. doi: 10.1109/ACCESS.2025.3526187
Trabelsi, Z., Alnajjar, F., Parambil, M. M. A., Gochoo, M., and Ali, L. (2023). Real-time attention monitoring system for classroom: a deep learning approach for student’s behavior recognition. Big Data Cogn. Comput. 7:48. doi: 10.3390/BDCC7010048
van Es, E. A., and Sherin, M. G. (2021). Expanding on prior conceptualizations of teacher noticing. Mathemat. Educ. 53, 17–27. doi: 10.1007/s11858-020-01211-4
Wang, J., Yuan, S., Lu, T., Zhao, H., and Zhao, Y. (2025). Video-based real-time monitoring of engagement in E-learning using MediaPipe through multi-feature analysis. Expert Syst. Appl. 288:128239. doi: 10.1016/J.ESWA.2025.128239
Zaletelj, J., and Košir, A. (2017). Predicting students’ attention in the classroom from Kinect facial and body features. Eurasip J. Image Video Process. 2017, 1–12. doi: 10.1186/S13640-017-0228-8
Keywords: artificial intelligence (AI), behavioral engagement, computer vision, deep learning, higher education, real-time feedback, student attention
Citation: Edquén Barboza WA, Carlos Flores Ramirez R, Luna Villanueva JM, Ramirez Pezo YE, Lévano D and Casildo-Bedón NE (2026) Application of artificial intelligence to measure attention levels in university students. Front. Educ. 11:1753873. doi: 10.3389/feduc.2026.1753873
Edited by:
Rany Sam, National University of Battambang, CambodiaReviewed by:
Juan-Francisco Álvarez-Herrero, University of Alicante, SpainFelipe Cabezas, University of the Americas (UDLA), Chile
Copyright © 2026 Edquén Barboza, Carlos Flores Ramirez, Luna Villanueva, Ramirez Pezo, Lévano and Casildo-Bedón. This is an open-access article distributed under the terms of the Creative Commons Attribution License (CC BY). The use, distribution or reproduction in other forums is permitted, provided the original author(s) and the copyright owner(s) are credited and that the original publication in this journal is cited, in accordance with accepted academic practice. No use, distribution or reproduction is permitted which does not comply with these terms.
*Correspondence: Nancy Esther Casildo-Bedón, bmFuY3kuY2FzaWxkb0B1cGV1LmVkdS5wZQ==