 Arianna Azzellino1,2*
 Caterina Lanfredi1,2
 Luigia Riefolo2,3
 Valentina De Santis1
 Pasquale Contestabile2,3
 Diego Vicinanza2,3
- 1Department of Civil and Environmental Engineering (DICA), Politecnico di Milano, Milan, Italy
- 2CoNISMa Inter-University National Consortium for Marine Sciences, Rome, Italy
- 3Department of Engineering, University of Campania “Luigi Vanvitelli,” Aversa, Italy
The opportunity to co-locate wind and wave energy exploitation is analyzed in the Italian seas grounding on the rationale that benefits are greater when un-correlated resources are combined. The study shows that, although waves and winds are generally strongly correlated, in some conditions their correlation is lower and the combined energy harvesting more interesting. As spatial conflicts of sea use and demand for maritime space are increasing, the development of the marine renewable energy sector needs to be evaluated in the perspective of the cumulative pressures deriving from present activities or expected from future developments. The evaluation of areas of potential conflicts among human activities, environmental vulnerabilities and marine renewable developments may facilitate the early development of mitigation actions and negotiations between stakeholders. In this study the opportunity of co-locating offshore wind turbines and wave energy converters is analyzed through a spatial planning approach. Both the potential for combining different renewable technologies, and the impact associated to such development was considered in the context of the existing pressures (e.g., naval traffic; mariculture activities; submarine cables routes; dredge spoils dumping; offshore activities; windfarms and ocean energy projects) and vulnerabilities (Marine Protected Areas, Key habitat presence) through quantitative indicators. The portion of Tyrrhenian coast south of Elba island, the northern-western Sardinian coast, and the southern Adriatic and Ionian coastal waters appear to be the most suitable sites. Moreover, the study presents a spatial quantitative methodology to identify sites of potential interest for the development of the marine renewable energy sector in the perspective of cost-effectiveness and environmental impact minimization.
Introduction
The marine environment represents a vast source of renewable energy. Ocean renewable energy infrastructures could contribute significantly to the future energy power supply (Ocean Energy Systems, 2017). Among the different developed marine renewable technologies, marine wind energy is the most mature type as regards technological development, commercialization, policy frameworks, and installed capacity (Soukissian et al., 2017; Agora Energiewende and Sandbag, 2018). Actually, most of the interest is focused on the development of new offshore solutions, such as wind turbines with larger rotors, deep water sites and floating platform (e.g., Hywind Scotland project www.statoil.com) (Onea et al., 2017). Floating technology can be considered in fact, as a commercially viable solution in order to harness available wind resource also at greater depth (>50 m) where the conventional fixed offshore wind turbines are no more economically feasible (McMillan and Ault, 2010). In addition, also Wave Energy Converters (WECs) have been identified as a technology with the potential to offer a significant contribution in the medium to long term (Liu et al., 2017). Globally, in 2017 wave energy deployments have doubled its capacity respect to the previous year, up to 8 MW (Ocean Energy Systems, 2017).
In Europe, most of the fully operating projects have been developed by the northern countries where there is a high source availability. However, also the Mediterranean sea is considered an attractive hot-spot for future developments of both technologies (Vicinanza et al., 2011, 2013; Liberti et al., 2013; Iuppa et al., 2015a,b; Onea et al., 2015, 2016a,c; Onea and Rusu, 2016b). Up to now, no offshore wind installations are operating in the Mediterranean waters, however the first offshore wind farm in the Italian seas has been approved and is going to be built in the Ionian sea off Taranto. It consists of 10 fixed-turbines with a total installed capacity of 30 MW, to power ~9,000 households (EIA Report iLStudio Engineering Consulting Studio, 2009). Regarding the wave energy, only two typologies of WECs have been considered suitable to be entirely embedded into traditional coastal defense structures: the Oscillating Water Column (OWC) (Torre-Enciso et al., 2009; Arena et al., 2013; Viviano et al., 2016) and the OverTopping Device (OTD). The latest example of the second group is denominated OBREC (Overtopping Breakwater for Energy Conversion) (Vicinanza et al., 2014;Contestabile et al., 2017).
The feasibility of combining a floating wind turbine and a wave energy converters has been already investigated by several authors (Fusco et al., 2010; Veigas and Iglesias, 2013, 2015; Veigas et al., 2014a,b; Gao et al., 2016; Karimirad and Koushan, 2016). wind-wave technology is a viable solution to reduce the intermittence of the wind and wave resources regardless of the time interval, increasing in this way the attractiveness of a site in terms of its overall marine energy potential (Fusco et al., 2010; Azzellino et al., 2013a; Perez-Collazo et al., 2013; Onea et al., 2017). Therefore, the diversification of the mixed renewable energy technologies, determines a reduction of the power's variability (Fusco et al., 2010; Stoutenburg et al., 2010) and the energy costs (Astariz and Iglesias, 2016, 2017; Astariz et al., 2016).
The alternatives to combine wind and wave energy technologies have been investigated for the Mediterranean region by (Pérez-Collazo et al., 2015). In particular, according to the ORECCA1 project results, the Mediterranean suitable sites are mainly restricted to three possible areas: the Blue Coast (southern France coast), the strait of Sicily (between Sicily and Tunisia) and the Aegean Greek islands. In recent years, the potential marine environmental impacts of renewable energy devices have been reported in different studies (Margheritini et al., 2012; Bailey et al., 2014; Riefolo et al., 2016).
In the EEA assessment of the onshore and offshore wind energy potential of the European seas (EEA European Environment Agency, 2009), it is shown that the offshore wind energy potential, between 10 and 30 kilometers from the coast, is concentrated in the Baltic, the North Sea (including the English Channel) and the Mediterranean, respectively accounting for 29, 25, and 20% of the 2030 projected total offshore wind potential (7,100 TWh). However, some offshore areas at this distance class have sea depths >50 meters that are not so much suitable for wind energy development. The same report states that at 30–50 kilometers from the coast, the Baltic, the North Sea (including the English Channel) and the Mediterranean sea respectively account instead for 30, 30, and 20% of total wind potential, that is estimated as 3,300 TWh in 2030. As far as wave energy is concerned, the closed basins, such as the Mediterranean, the Black and the Baltic Sea, are characterized by low wave power density values (<5 kW/m), due to the short fetching that does not let long period waves to be created (Kalogeri et al., 2017). In the Mediterranean sea, there are regions where the both wind and wave energy present low, but not negligible average values. Favorable areas for combined exploitation are in fact located in the Gulf of Lions, in the Sicily Straits (Central Mediterranean), off the coasts of Sardinia, off the NE coasts of the Balearic Islands (NW Mediterranean) and in specific sites in the Aegean Sea. The same authors indicated the Gulf of Lions (NW Mediterranean) and the Aegean Sea (NE Mediterranean) as ideal areas for wind power exploitation having wind power potential comparable to the most energetic northern sea areas, included the Baltic Sea (mean wind power potential ~500–800 W/m2).
It is worthwhile to stress the fact that any ocean energy development is likely to result in further transformation of the selected sites, already affected by other pressures. The Mediterranean Sea is known to be one of the world's most impacted marine environments (Micheli et al., 2013; Stock and Micheli, 2016). In this perspective, both the possible combination of different renewable technologies, and their potential impact on the environment, should be considered in the context of the existing pressures through a Marine Spatial Planning (MSP) approach (Douvere and Ehler, 2008; Ehler and Douvere, 2009; Jay, 2010; Backer, 2011; Azzellino et al., 2013b).
Focal point of this planning process is the analysis of the spatial data of the different vulnerabilities, the assessment of levels of vulnerability occurring in the area of interest and the quantification of the cumulative impacts affecting the area (Douvere and Ehler, 2008; Ehler and Douvere, 2009). The combination of vulnerability and cumulative impact can be used as a decision support tool to identify areas where ecosystem vulnerability and cumulative impact levels meet the objective of maintaining healthy ecosystems or where they are mismatched. The early prediction of the areas of potential conflicts creates the ground for mitigation actions or early negotiations between stakeholders. The exchange between decision makers, stakeholders, experts allow an integrated management of sea uses in the perspective of an optimized spatial decision support systems.
In this study the opportunity of co-locating offshore wind turbines and wave energy converters in the central Mediterranean area is analyzed and their environmental sustainability is evaluated through a quantitative Marine Spatial Planning approach.
Materials and Methods
Study Area
The area considered in this study encompasses the waters around Italy in particular the Adriatic Sea, Ligurian Sea, Tyrrhenian Sea, and partially the Ionian, Sardinia Sea, as well as the northern part of the Strait of Sicily, from 36 to 46 degrees of Latitude and 6 to 20 degrees of Longitude (see Figure 1).
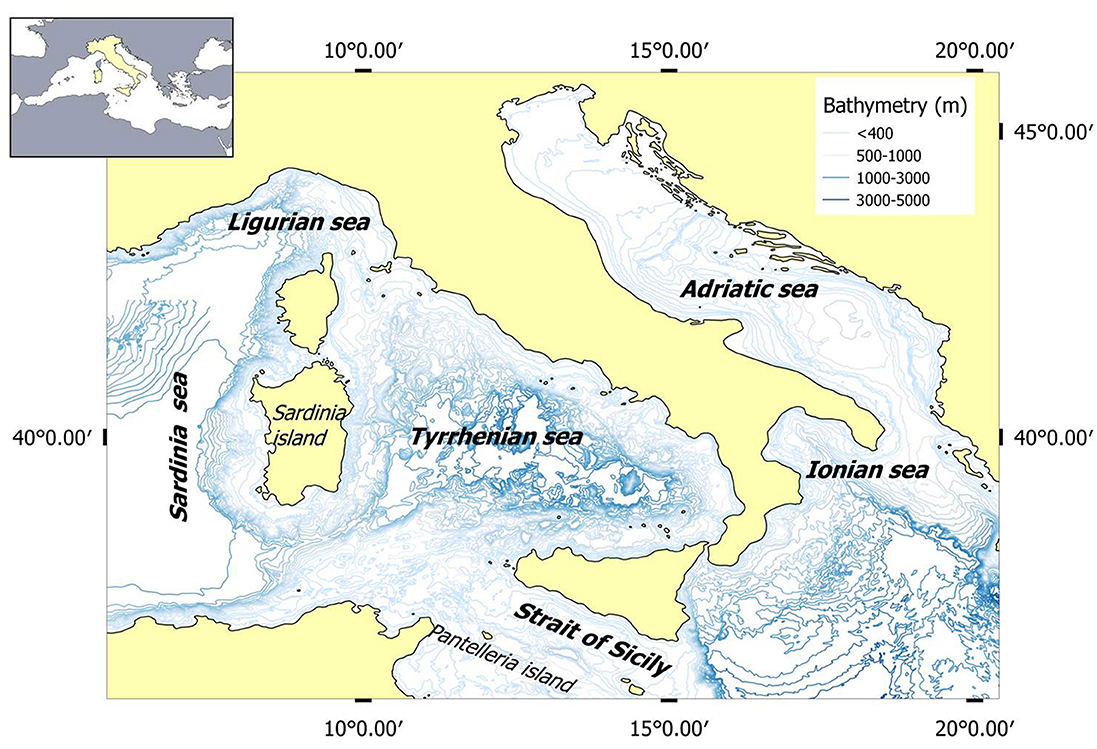
Figure 1. Map of the study area.
Data Gathering and Preparation
An analysis grid of 425 cells of 60 × 50 kilometers size was created (Figure 2) and data about wind and wave meteo climatic conditions, bathymetry and a set of vulnerability indicators and human pressures were gridded and used for the purpose of the spatial analysis. Bathymetry data were obtained through the GEBCO (General Bathymetric Chart of the Oceans)2. One minute Digital Atlas.
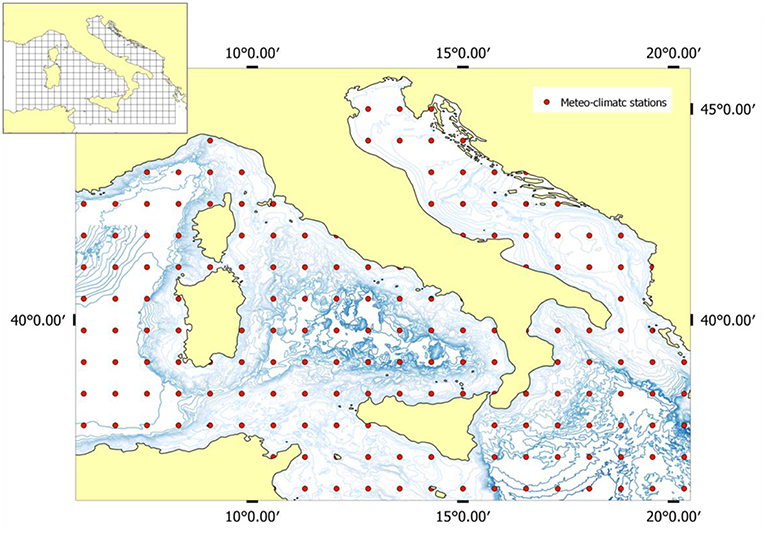
Figure 2. Meteo-climatic stations (n = 164). The analysis grid is also shown.
Wind and wave data have been extracted from the database ECMWF ERA-Interim Data Set (http://www.ecmwf.int/en/research/climate-reanalysis/era-interim). Data, available for 164 stations (Figure 2) covering a 10-year time series from 2005 to 2014 were considered. Wind data were available every 3 h while wave data every 6 h, so the latter was assumed as reference unit for the study. Data used for this study were: horizontal and vertical components of wind speed at 10 m, mean wave direction, mean wave period, significant wave height.
The following set of vulnerabilities were used for the analysis:
- Marine Protected Areas presence;
- Posidonia beds;
- Cymodocea beds;
- Mediterranean coralligenous communities.
Marine Protected Areas (MPA) presence was considered based on the dataset available from the World Database on Protected Areas (WDPA, https://protectedplanet.net/) (UNEP-WCMC, 2016).
Posidonia and Cymodocea beds as well as Mediterranean coralligenous communities have been considered among the vulnerable seabed habitats. These data, updated in September 2016, were extracted from the European Marine Observation Data Network (EMODnet) Seabed Habitats project3 Seabed habitats have been derived from EUSeaMap which provides polygons based on individual survey habitat classified according to the EUropean Nature Information System (EUNIS).
As far as human pressure indicators were concerned, data on human activities at sea were extracted from the EMODnet data portal (http://www.emodnet.eu/ updated to 2017) which includes a substantial amount of regionally compiled and freely downloadable geo-referenced data related to different aspects of human impacts (http://www.emodnet.eu/human-activities). Data in the following set of human activities was obtained from the EMODnet geoportal:
- Main ports;
- Mariculture activities (finfish and shellfish farms at sea);
- Submarine cables routes;
- Dredge spoils dumping;
- Dredging;
- Hydrocarbon extraction (Active Licenses);
- Boreholes Crude oil and Natural gas (Active);
- Oil and gas offshore installation (Operational and Closed down);
- Ocean Energy projects (wave, tidal, salinity gradient, wave/wind);
- Windfarms projects (Planned and Authorized).
In addition, data on naval traffic was derived from the results of PASTA-MARE project4 which processed AIS (Automatic Identification of Ships) data and provide estimates of maritime traffic density.
Figures 3, 4 show the maps of vulnerabilities (i.e., MPA and habitats) and pressures (i.e., human activities) used in this study.
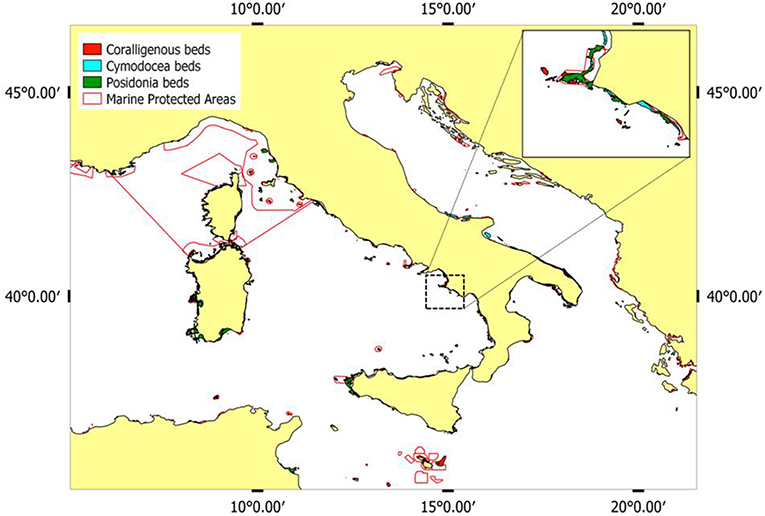
Figure 3. Maps of MPA and Habitats.
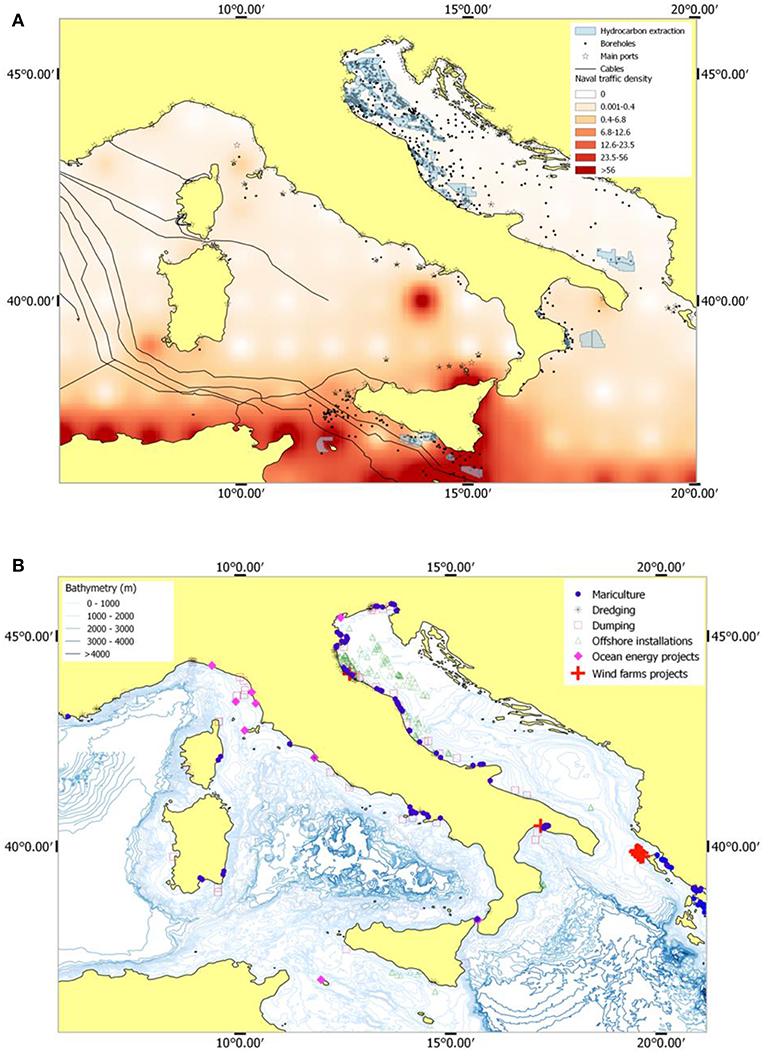
Figure 4. Maps of the pressures: (A) hydrocarbon extraction and naval traffic; (B) mariculture, dredging and dumping and other activities.
Statistical Methods
The correlation between wind and wave parameters at the different locations was investigated by means of the Pearson's correlation coefficient:
where μx, μy, σx, σy are the mean and the standard deviation of the variables x and y, of k observations and N is the total sample size.
In order to reduce the dimensionality of the meteo-climatic dataset, Principal Component (PCA) and Factor (FA) and Cluster Analyses (CA) (Afifi and Clark, 1996) have been used. Particularly, PCA and FA were chosen to reduce the dimensionality of the wind and wave statistics. PCA extracted the eigenvalues and eigenvectors from the covariance matrix of the original variances. A Varimax rotation criterion allowing to reduce the contribution of the less significant parameters within each principal component, and rotating the axes defined by the preliminary PCA extraction. The Varimax rotation maintains the axes orthogonality condition. The number of factors to retain was chosen on the basis of the “eigenvalue higher than 1” criterion (i.e., all the factors that explained less than the variance of one of the original variables were discarded).
Cluster Analysis (CA), both hierarchical (HCA) and the not hierarchical K-means (Afifi and Clark, 1996), were used to analyse the similarities of meteo-climatic data groups. The Euclidean Distance was chosen as distance measure:
K-means was used when the data set was constituted by several thousands of records (i.e., time resolution year-month across the decade) whereas HCA was preferred when the data set accounted only some hundreds of records (i.e., time resolution: decade). When the hierarchical procedure was run, the Ward linkage method was selected as agglomeration criterion. K-means CA, on the other hand, was run three times: the final cluster centroids of the solution obtained after the second run were in fact used as initial centers in the third run. Only the third run results are showed in the present study.
Results and Discussion
Wind and Wave Conditions
The main descriptive statistics of wind speed vw, mean wave direction, mean wave period Tz and significant wave height Hs have been calculated (see Table 1) and their temporal variability has been also investigated. It can be observed in Figure 4 that data in the study area are characterized by a certain degree of inter-annual (Figure 5A) and seasonal (Figure 5B) variability in terms of wind and wave patterns.
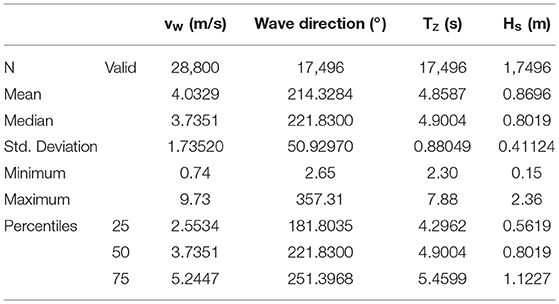
Table 1. Main statistics of the wind and wave parameters.
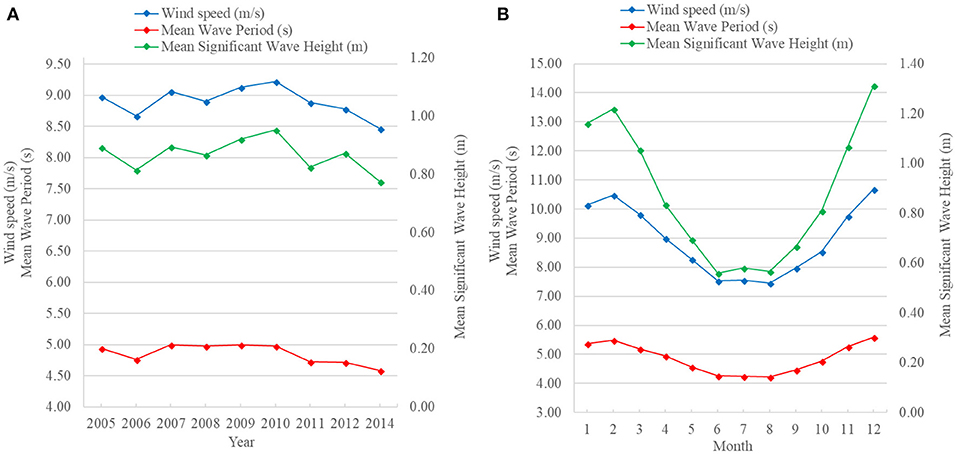
Figure 5. (A) Inter-annual and (B) monthly variability in wind and wave patterns.
The correlations among parameters and their correlation with time (month and year) were investigated. As expected, mean wave period and significant wave height were found correlated to each other and both correlated with the wind speed (Table 2).
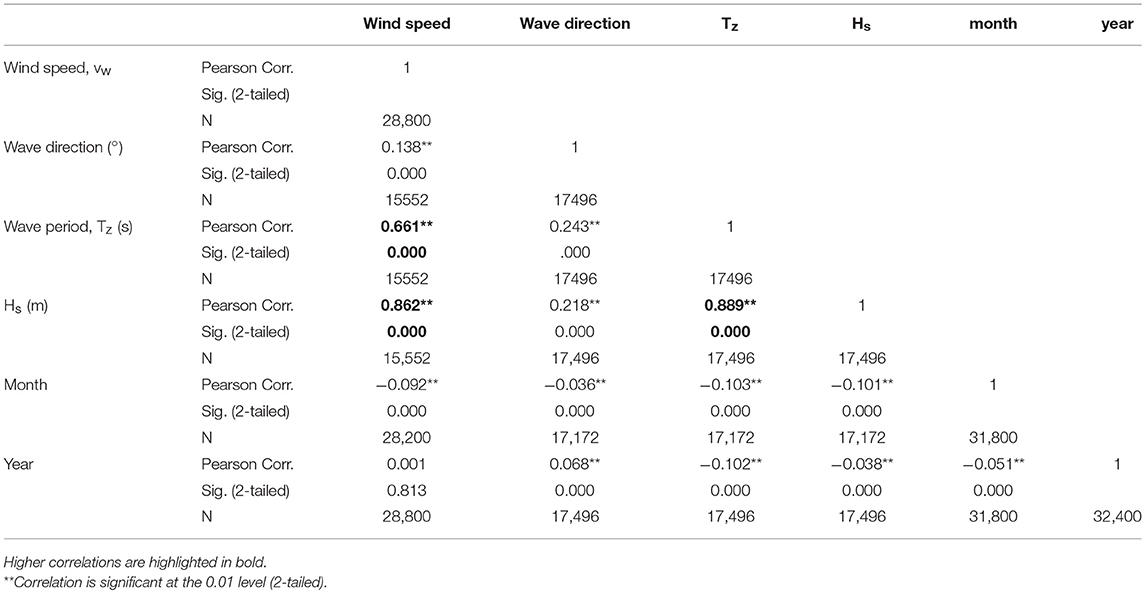
Table 2. Correlations Matrix of wind speed (m/s), mean wave direction (°), wave period Tz (s) and significant wave height, Hs (m), month and year.
For the purpose of the combined exploitation of offshore wind and wave energy, the most favorable conditions occur when wind and wave temporal patterns are less correlated. Therefore, in order to identify cases where the variability of the produced wind and wave power would be reduced, the different meteo-climatic conditions were analyzed by using a PCA/FA and then classified by means of K-means CA and HCA.
Classification of the Meteo-Climatic Conditions
PCA/FA was applied to the horizontal (U) and vertical (V) wind components, vw, wave direction, Tz and Hs. The resulting three components explains 89.9% of the original variance. The first component explain the 44.3% of the whole variance, while 28.6 and 17% of the variance is explained, respectively by the second and the third component. The factor loadings of the PCA/FA solution are shown in Table 3. The factor selection was evaluated on the basis of the scree plot (see Figure 6).
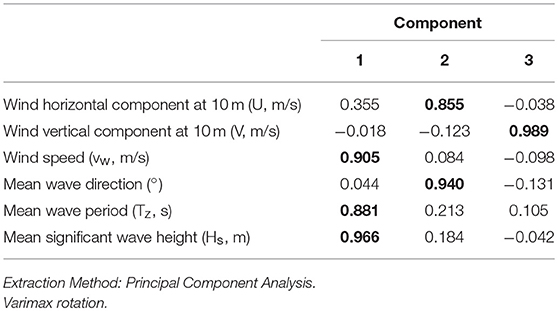
Table 3. Factor loadings of the PCA solutions. Higher correlations are highlighted in bold.
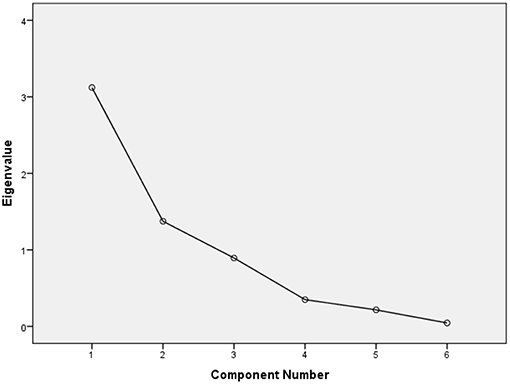
Figure 6. Scree plot showing the extracted components and their corresponding eigenvalues. Three components present eigenvalue higher than 1. Only these were considered in the analysis.
It can be observed that the first component accounts for the vw, Hs and Tz and, consequently, it is the component that should be minimized to find wind and wave uncorrelated pattern. The second component accounts for wave direction and wind horizontal component and the third component accounts only for the wind vertical component.
A K-means CA was then applied to the factor scores obtained by the PCA/FA extraction at the time scale of year-month (e.g., 2008-1, 2009-4 etc.).
A five K-means clusters solution was chosen, where K-means cluster 1 and 2 show the most favorable meteo-climatic conditions for both wind and wave energy (see Figure 7):
• K-means cluster 1: shows vw, Tz, Hs, wave direction and U wind component above the average and V wind component below the average;
• K-means cluster 2: shows all wind and wave characteristics highly above the average;
• K-means cluster 3: shows wave direction, U and V components below the average and vw, Tz and Hs slightly above the average;
• K-means cluster 4: shows vw, Tz, Hs and V wind component well below the average while wave direction and U wind component are above the average;
• K-means cluster 5: shows vw, Tz, Hs, wave direction and U wind component below the average but V wind component above the average.
In Table 4 the different meteo-climatic characteristics of the five k-means clusters solution are summarized.
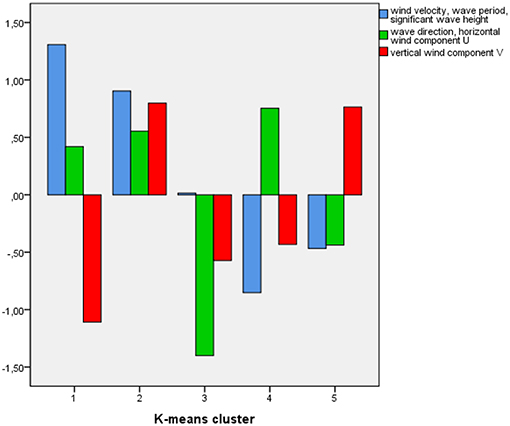
Figure 7. Standardized characteristics of the five K-means clusters. K-means cluster 1 and 2 shows the most favorable meteo-climatic conditions for combined offshore wind and wave energy technologies.
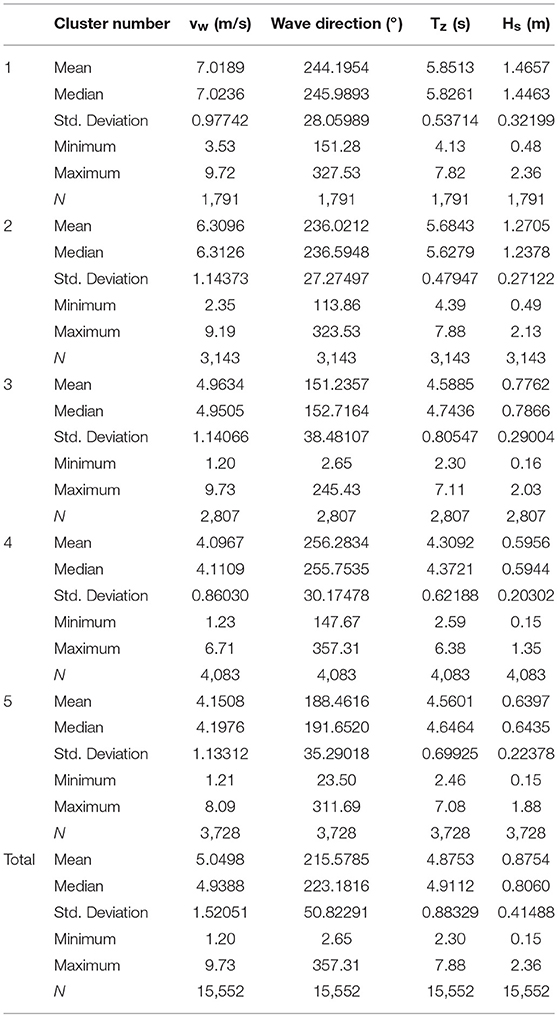
Table 4. Summary of the descriptive statistics of meteo-climatic parameters in the five selected clusters.
It is interesting to compare the correlations between the wind and wave parameters obtained pooling all the data set (reported in Table 2) with the ones (shown in Table 5) obtained after splitting the dataset into the described meteo-climatic clusters. The clusters showing the lowest correlation between wind speed, wave period and significant wave heights are the K-means cluster 4 and 5 that refer the meteo-climatic conditions that should be dominant to maximize the advantage to combine wind and wave.
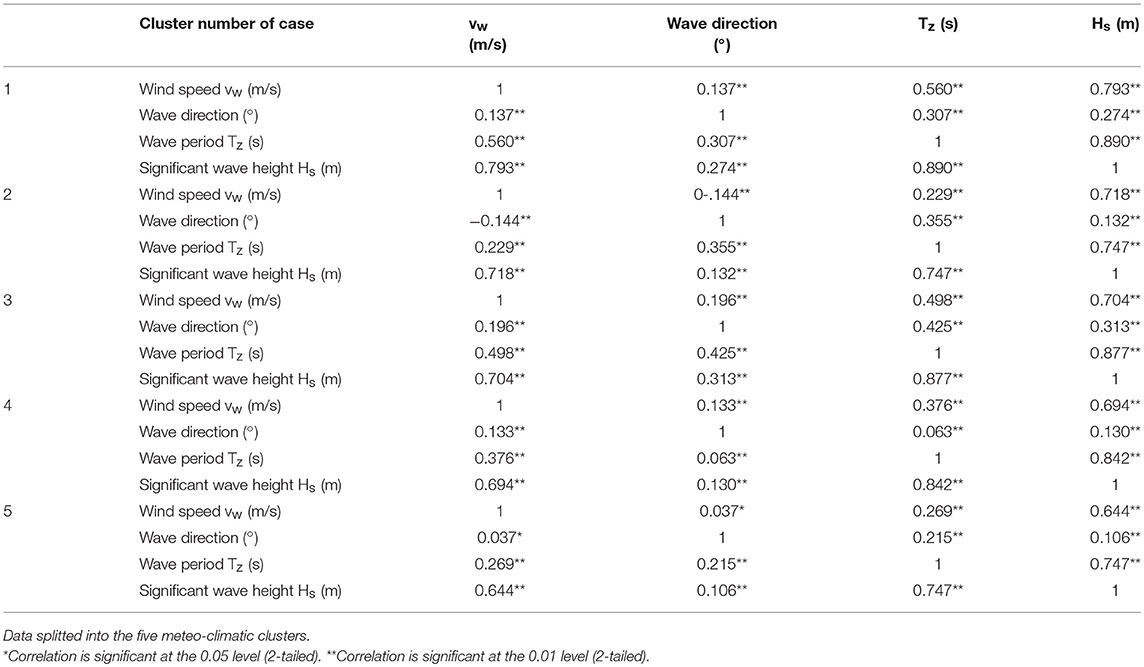
Table 5. Correlation analysis between wind and wave.
To highlight the areas where the most favorable meteo-climatic conditions are dominant, a new cluster analysis was performed aggregating the derived K-means clusters values by station over the whole 10-year series. The aggregation allowed to reduce the dataset from several thousands of records to a hundred and to run a second cluster analysis by using a hierarchical approach (HCA) with the Ward method to classify the station meteo-climatic dominant conditions.
Figure 8 shows the characteristics of this new six clusters solution: for the purpose of this study, the most interesting clusters are 1 and 4 and 5 which include the stations where the K-means cluster 4 and K-means cluster 5 (i.e., the ones showing the most favorable meteo-climatic conditions according to the K-means CA results over the time scale of the year-month) are dominant.
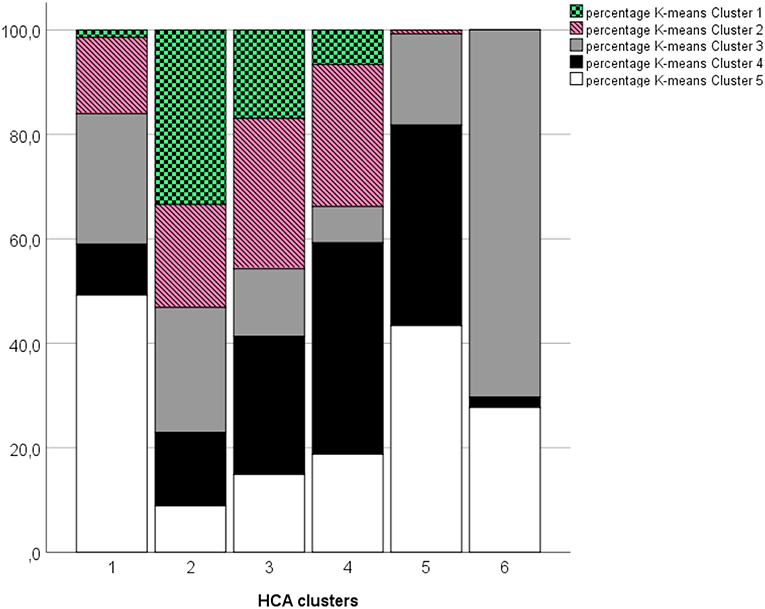
Figure 8. HCA analysis aggregated by stations over the 10-year time series: each bar represents a cluster identified through HCA and colors represent the percentage of K-means Clusters present on each cluster. The HCA clusters of highest interest are 1, 4, and 5 which include the stations where the most favorable meteo-climatic conditions (i.e., K-means cluster 4 and 5) are dominant.
Finally, HCA clusters 1, 4, and 5 were mapped in order to identify stations showing the most favorable meteo-climatic conditions in terms of wind and wave energy availability (Figure 9).
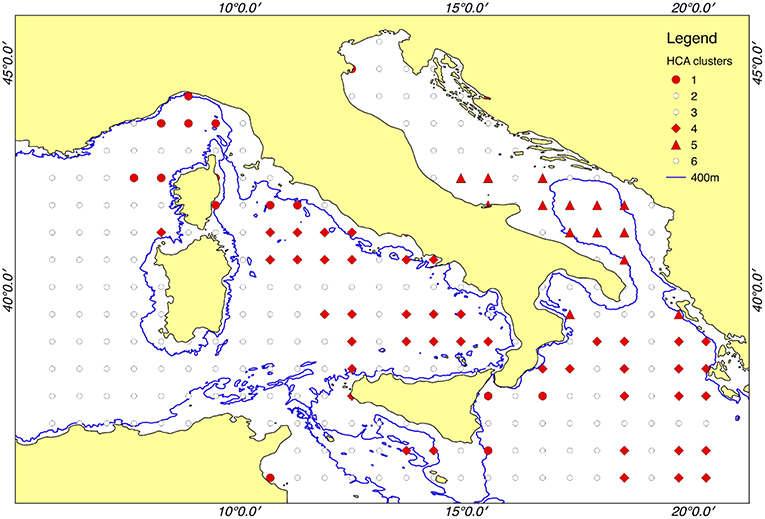
Figure 9. Map of the HCA clusters. The 400 m bathymetry is also shown.
Spatial Analysis of Vulnerabilities and Human Pressure
Due to the high complexity and the regional scale involved, the environmental background of the central Mediterranean Sea area, was considered through a set of multiple indicators, both of environmental vulnerability, and anthropic pressures. A matrix of 12 indicators of anthropogenic pressures and 4 indicators of environmental vulnerability was created for each of the 425 grid units.
For each indicator and every grid cell, two new variables have been calculated: the cell's presence/absence (1/0) and the frequency of occurrence (i.e., as the number of vulnerability elements or human activities per cell unit). Then, Vulnerability and Pressure Indexes were created of the kind presented by Azzellino et al. (2013b).
A Vulnerability Index (hereinafter VI) was defined for each grid cell by summing the presence of Marine Protected Areas, Posidonia and Cymodocea beds and the Mediterranean coralligenous communities. In this way, five classes of Vulnerability (from 1 to 5) were obtained and mapped (Figure 10).
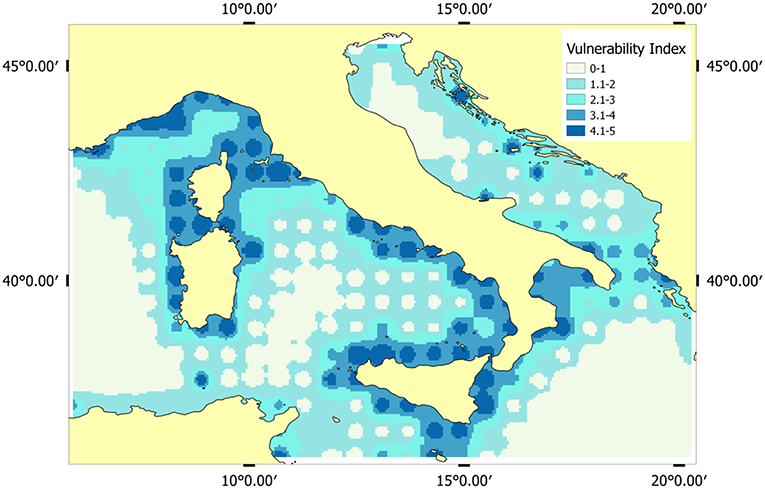
Figure 10. Map of the Vulnerability Index (VI).
Only 42% of the grid analysis cells had values higher than 1. The extension of the study area size and the existing data availability gaps both contribute to determine such condition. Grid cells falling in the lowest vulnerability classes (i.e., class 1 and 2) represent the 22 % of the total, reflecting the presence of MPA in offshore waters. The rest 19% of the grid cells are mostly concentrated in coastal areas and present the higher vulnerability classes (i.e., class > 2) due to the concurrent presence of protected areas, seagrass beds and coralligenous habitats (Figure 11).
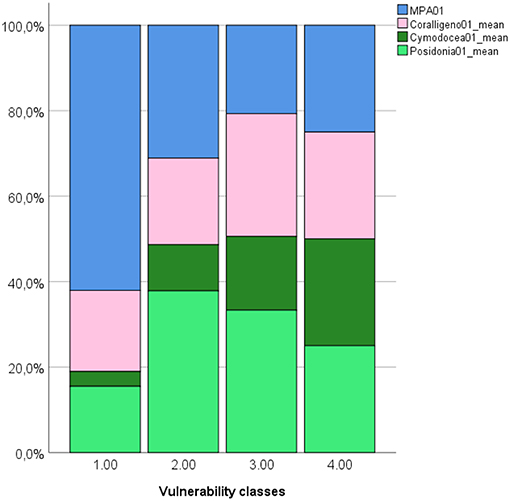
Figure 11. Vulnerability classes description. Only the 4 classes with vulnerability higher than zero are shown.
So, in order to create a Cumulative Pressure Index (hereinafter CPI) avoiding any bias due to the variability in the unit of measurements, the frequency of the 12 different human pressures was normalized to 1 and the sum of the different anthropogenic activities within each cell unit was calculated and obtain a quantitative CPI (see Figure 12).
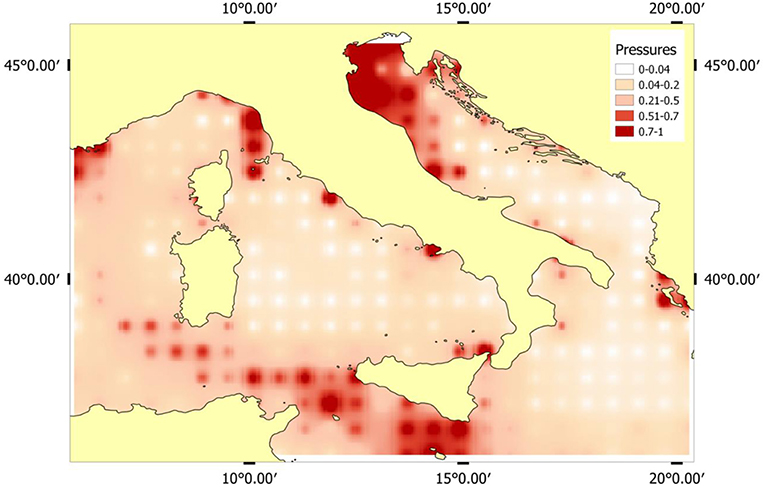
Figure 12. Map of the Cumulative Pressure Index (CPI).
Finally, a cumulative impact index was drawn by multiplying the CPI by the VI. The obtained values of the Impact Index, specified on a logarithmic scale, were ranked into 4 classes of impact (≤ 0.04 low impact; 0.05–0.33 moderate impact; 0.34–0.61 high impact; > 0.62 very high impact) based on the distribution of the data. As expected, areas showing the higher score (high and very high impact classes) are in general coastal areas and mostly concerns the northern Tyrrhenian Sea, the waters surrounding Sicily and the northern Adriatic Sea. On the other hand, the analysis allowed to identify sites characterized by a low and moderate potential impact, where future wind-wave energy installation could be developed such as the central and southern Tyrrhenian sea, the southern Adriatic sea and the Ionian sea (see Figure 13).
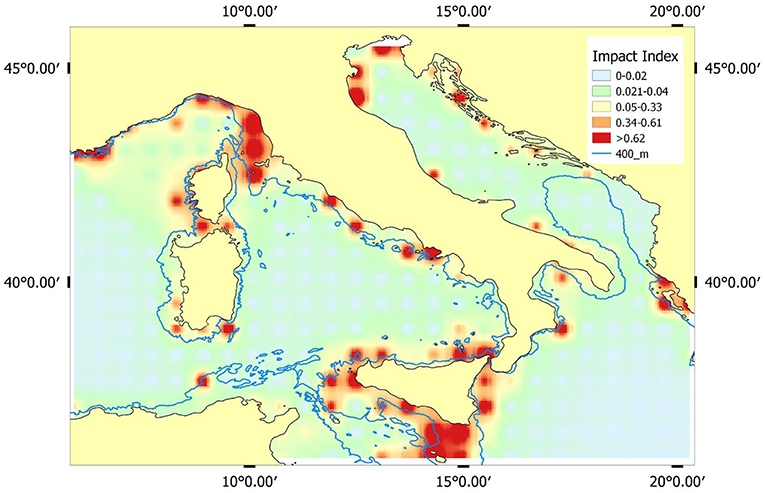
Figure 13. Map showing the Impact Index, ranked into 4 classes of impact (≤ 0.04 low impact; 0.05–0.33 moderate impact; 0.34–0.61 high impact; >0.62 very high impact) based on the distribution of the data.
Optimal Siting of Wind-Wave Energy Technology
The optimal locations for future wind-wave energy infrastructures can be identified by overlaying the areas showing the most favorable meteo-climatic conditions (i.e., stations classified as HCA Clusters 1, 4, and 5) with areas presenting medium and lower values of Impact Index (Figure 13). Based on this analysis (Figure 14) the optimal sites for future wind-wave energy installations can be identified for waters ranging between 50 and 350 m of depth (i.e., depth range suitable for floating offshore wind installations) and they appear mostly located along the Tyrrhenian coast south of Elba island, the northern-western Sardinian coast offshore Alghero, the southern Tyrrhenian off the Aeolian islands and along the southern Adriatic and Ionian coastal waters. Although the analysis been conducted at a coarse spatial scale, and is certainly affected by larger errors in those locations near the coast where hindcast models reveal their limits, still we believe it will be very useful as support for planning future wind-wave installations for the early minimization of potential impacts. Finer scale studies allowing a more accurate characterization of the local meteo-climatic conditions will be needed for the selection of the optimal wind turbine and wave energy converter combination that will leadto a less variable power output.
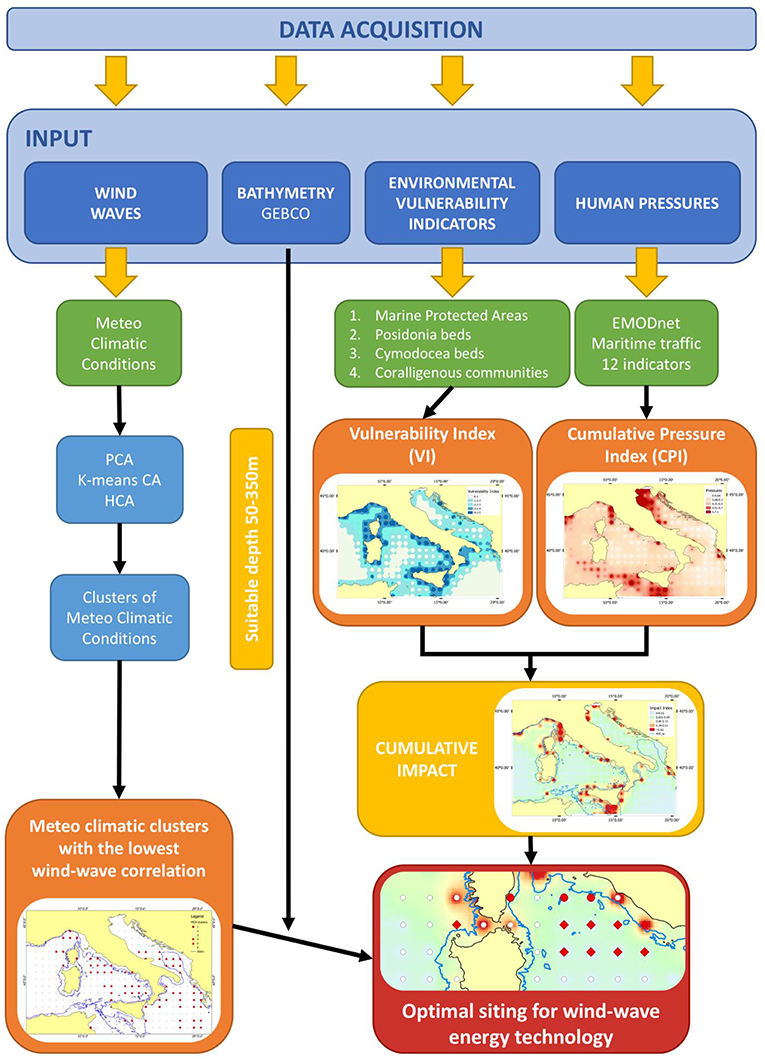
Figure 14. Flow chart showing the optimal siting proposed methodology.
Conclusions
The present study highlights areas where a combined technology of wind and wave energy can be potentially developed in the perspective of energy availability and environmental impact minimization.
It is known that the diversification of wind and wave energies generates benefits in terms of produced power. The results of this study showed that despite the general strong correlation between wind and waves, local and temporary conditions of wind –wave weak correlation exist and may be exploited. for effective combined production of marine renewable energy. The wind-wave meteo climatic analysis here presented showed that these conditions occur in the western and southern part of the study area, in both coastal and offshore deep waters. These results are in partial agreement with the ORECCA project outcomes that suggest only the Strait of Sicily and the French Blue Coast as potential development sites in the Mediterranean Sea area which corresponds to our study. However, their conclusions are mostly based on QuikSCAT5 satellite offshore measurements of wind speed and direction (Furevik et al., 2010) which are known to have limitations. QuikSCAT data in fact make it possible to draw up homogeneous wind maps of large areas with 0.25° resolution, however measurements taken from satellites by means of scatterometers do have rather high uncertainties (up to 2 m/s) especially in closed basins such as the Mediterranean Sea and, even more, the Adriatic Sea or the Black Sea. So, the fact that our analysis, based on ECMWF data, outlines additional sites of potential developments, such as the Tyrrhenian coast south of Elba island, the southern Tyrrhenian off the Aeolian islands and the southern Adriatic and Ionian coastal waters complements and does not contradict ORECCA results.
Optimal water depth for the development of wind turbines ranges from 50- to 350 meters, so, even though the favorable meteo-climatic conditions appear to be widely available, in some areas (e.g., waters off Corsica, and Ligurian Sea) these resources cannot be easily exploited due to the unfavorable conditions, the low feasibility, and the costs outweighing the benefits.
The study also demonstrates how quantitative elements of impact and vulnerability could be used to better coordinate the different uses of marine space, and to address the need for protecting the common interests from the unsustainable exploitation of finite spatial resources. Vulnerable coastal habitats (i.e., protected species presence as Posidonia oceanica, Delile, 1813) should be considered to estimate the ecosystem vulnerability within the suitable depth range for offshore wind farms installations. The used methodological approach allowed to restrict the optimal siting for combined wind wave energy offshore installations to some areas of potential development: along the Tyrrhenian coast south of Elba island, the northern-western Sardinian coast off the town of Alghero, the southern Tyrrhenian Sea off the Aeolian islands and along the southern Adriatic and Ionian coastal waters, all characterized by a good energy potential and a low Cumulative Impact Index.
The cumulative impact indexes developed in this study, although based on a smaller set of human pressures, appear to be coherent with the cumulative human impact assessment presented by Stock and Micheli (2016) and Micheli et al. (2013).
Environmental impact studies of this kind may feed quantitative spatial planning and support the selection of the sites of potential interest for co-locating wind and wave energy installations, providing support for the sustainable development of future wind-wave offshore parks.
Author Contributions
AA and CL conceived the study, analyzed the data and wrote the paper. LR and VD contributed to data analysis and to the revised paper writing. PC and DV supervised the meteo climatic data assessment, revised the paper draft.
Conflict of Interest Statement
The authors declare that the research was conducted in the absence of any commercial or financial relationships that could be construed as a potential conflict of interest.
Acknowledgments
The work presented was partially supported by the University of Campania Luigi Vanvitelli through the VALERE program (VAnviteLli pEr la RicErca, 2017). We are deeply grateful to the reviewers who greatly helped us with their valuable comments to significantly improve the original manuscript.
Footnotes
1. ^ORECCA Website (2015). Available online at: https://cordis.europa.eu/project/rcn/94058_it.html (accessed on July 2018).
2. ^http://www.gebco.net/ (accessed on May 04, 2018).
3. ^http://www.emodnet-seabedhabitats.eu/access-data/download-data/
4. ^Maritime traffic density-results of PASTA MARE project (2011). Available online at: https://webgate.ec.europa.eu/maritimeforum/content/1603
5. ^http://manati.orbit.nesdis.noaa.gov/datasets/QuikSCATData.php/
References
Afifi, A., and Clark, V. (1996). Computer-Aided Multivariate Analysis. Texts in Statistical Science, 4th Edn. London: Chapman & Hall/CRC Press.
Agora Energiewende Sandbag (2018). The European Power Sector in 2017 State of Affairs and Review of Current Developments Analysis. Available online at: https://sandbag.org.uk/wp-content/uploads/2018/01/EU-power-sector-report-2017.pdf
Arena, F., Romolo, A., Malara, G., and Ascanelli, A. (2013). “On design and building of a U-OWC wave energy converter in the Mediterranean Sea: a case study,” in 32th International Conference OMAE, (Nantes).
Astariz, S., and Iglesias, G. (2016). Selecting optimum locations for co-located wave and wind energy farms. Part I: The Co-Location Feasibility index. Energy Conversion Manage. 122, 589–598. doi: 10.1016/j.enconman.2016.05.079
Astariz, S., and Iglesias, G. (2017). The collocation feasibility index – A method for selecting sites for co-located wave and wind farms. Renew. Energy 103, 811–824. doi: 10.1016/j.renene.2016.11.014
Astariz, S., Perez-Collazo, A. J., and Iglesias, G. (2016). Hybrid wave and offshore wind farms: a comparative case study of co-located layouts. Int. J. Marine Energy 15, 2–16. doi: 10.1016/j.ijome.2016.04.016
Azzellino, A., Ferrante, V., Kofoed, J. P., Lanfredi, C., and Vicinanza, D. (2013a). Optimal siting of offshore wind-power combined with wave energy through a marine spatial planning approach. Int. J. Mar. Energy 3–4: e11–e25. doi: 10.1016/j.ijome.2013.11.008
Azzellino, A., Kofoed, J. P., Lanfredi, C., Margheritini, L., and Pedersen, M. L. (2013b). A marine spatial planning framework for the optimal siting of marine renewable energy installations: two danish case studies. J. Coastal Res. 65, 1623–1628. doi: 10.2112/SI65-274
Backer, H. (2011). Transboundary maritime spatial planning: a Baltic Sea Perspective. J. Coast. Conserv. 15, 279–289. doi: 10.1007/s11852-011-0156-1
Bailey, H., Brookes, K. L., and Thompson, P. M. (2014). Assessing environmental impacts of offshore wind farms: lessons learned and recommendations for the future. Aquatic Biosyst. 10:8. doi: 10.1186/2046-9063-10-8
Contestabile, P., Iuppa, C., Di Lauro, E., Cavallaro, L., Lykke Andersen, T., and Vicinanza, D. (2017). Wave loadings acting on innovative rubble mound breakwater for overtopping wave energy conversion. Coast. Eng. 122, 60–74, doi: 10.1016/j.coastaleng.2017.02.001
Douvere, F., and Ehler, C. (2008). Introduction. Mar. Policy 32, 759–761. doi: 10.1016/j.marpol.2008.03.019
EEA European Environment Agency (2009). Europe's Onshore and Offshore Wind Energy Potential. An Assessment of Environmental and Economic Constraints, 85. EEA Technical report series.
Ehler, C., and Douvere, F. (2009). Marine Spatial Planning: a step-by-step approach toward ecosystem-based management. Intergovernmental oceanographic Commission and Man and the Biosphere programme. IOC Manuals and Guides 53 ICAM Dossier 6. UNESCO, Paris. 99.
EIA Report iLStudio Engineering Consulting Studio (2009). Progetto Definitivo per la Realizzazione di un Parco Eolico Nella Rada Esterna del Porto di Taranto. Available online at: http://www.va.minambiente.it/. In Italian
Furevik, B. R., Sempreviva, A. M., Cavaleri, L., Lefèvre, J. M., and Transerici, C. (2010). Eight years of wind measurements from scatterometer for wind resource mapping in the Mediterranean Sea. Wind Energ. 14, 355–372. doi: 10.1002/we.425
Fusco, F., Nolan, G., and Ringwood, J. V. (2010). Variability reduction through optimal combination of wind/wave resources—an Irish case study. Energy 35, 314–325. doi: 10.1016/j.energy.2009.09.023
Gao, Z., Moan, T., and Wan, L. (2016). Comparative numerical and experimental study of two combined wind and wave energy concepts. J. Ocean Eng. Sci. 1, 36–51. doi: 10.1016/j.joes.2015.12.006
Iuppa, C., Cavallaro, L., Foti, E., and Vicinanza, D. (2015b). Potential wave energy production by different wave energy converters around Sicily. J. Renew. Sustain. Energy 7:061701. doi: 10.1063/1.4936397
Iuppa, C., Cavallaro, L., Vicinanza, D., and Foti, E. (2015a). Investigation of suitable sites for wave energy converters around Sicily (Italy). Ocean Sci. 11, 543–557. doi: 10.5194/os-11-543-2015
Jay, S. (2010). Built at sea: marine management and the construction of marine spatial planning. Town Plan. Rev. 81, 173–191. doi: 10.3828/tpr.2009.33
Kalogeri, C., Galanis, G., Spyrou, C., Diamantis, D., Baladima, F., Koukoula, M., et al. (2017). Assessing the European offshore wind and wave energy resource for combined exploitation. Renew. Energy 101, 1–21. doi: 10.1016/j.renene.2016.08.010
Karimirad, M., and Koushan, K. (2016). “WindWEC: combining wind and wave energy inspired by hywind and wavestar,” in Proceedings of the International Conference on Renewable Energy Research and Applications, (Birmingham), 20. (accessed November 23, 2016).
Liberti, L., Carillo, A., and Sannino, G. (2013). Wave energy resource assessment in the Mediterranean, the Italian perspective. Renew. Energy 50, 938–949. doi: 10.1016/j.renene.2012.08.023
Liu, Y., Li, Y., He, F., and Wang, H. (2017). Comparison study of tidal stream and wave energy technology development between China and some Western Countries. Renew. Sustain. Energy Rev. 76, 701–716. doi: 10.1016/j.rser.2017.03.049
Margheritini, L., Hansen, A. M., and Frigaard, P. (2012). A method for EIA scoping of wave energy converters-based on classification of the used technology. Environ. Impact Assess. Rev. 32, 33–44. doi: 10.1016/j.eiar.2011.02.003
McMillan, D., and Ault, G. W. (2010). Techno-economic comparison of operational aspects for direct drive and gearbox-driven wind turbines. IEEE Trans. Energy Convers. 25, 191–198. doi: 10.1109/TEC.2009.2032596
Micheli, F., Halpern, B. S., Walbridge, S., Ciriaco, S., Ferretti, F., Fraschetti, S., et al. (2013). Cumulative human impacts on mediterranean and black sea marine ecosystems: assessing current pressures and opportunities. PLoS ONE 8:e79889. doi: 10.1371/journal.pone.0079889
Ocean Energy Systems (OES) - International Energy Agency (IEA) (2017). Annual Report an Overview of Activities in 2017.
Onea, F., Ciortan, S., and Rusu, E. (2017). Assessment of the potential for developing combined wind-wave projects in the European nearshore. Energy Environ. 28, 580–597. doi: 10.1177/0958305X17716947
Onea, F., Deleanu, L., Rusu, L., and Georgescu, C. (2016a). Evaluation of the wind energy potential along the Mediterranean Sea coasts. Energy Explor. Exploit. 34, 766–792. 594. doi: 10.1177/0144598716659592
Onea, F., Raileanu, A., and Rusu, E. (2015). Evaluation of the wind energy potential in the coastal environment of two enclosed seas. Adv. Meteorol. 14, 1–14. doi: 10.1155/2015/808617
Onea, F., Raileanu, A., and Rusu, E. (2016c). “Evaluation of the wave energy potential in some locations where European offshore wind farms operate,” in Maritime Technology and Engineering 3: MARTECH – 3rd International Conference on Maritime Technology and Engineering, eds C. G. Soares, and T. A. Santos (Lisbon), (London: Taylor & Francis Group), 1119–1124.
Onea, F., and Rusu, E. (2016b). Efficiency assessments for some state of the art wind turbines in the coastal environments of the Black and the Caspian seas. Energy Explor. Exploit. 34, 217–234. doi: 10.1177/0144598716629872
Pérez-Collazo, C., Greaves, D., and Iglesias, G. (2015). A review of combined wave and offshore wind energy. Renew. Sustain. Energy Rev. 42 141–153. doi: 10.1016/j.rser.2014.09.032
Perez-Collazo, C., Jakobsen, M. M., Buckland, H., and Fernández-Chozas, J. (2013). Synergies for a Wave-Wind Energy Concept. Frankfurt: EWEA.
Riefolo, L., Lanfredi, C., Azzellino, A., Vicinanza, D., Tomasicchio, G. R., D'Alessandro, F., et al. (2016). “Offshore wind turbines: an overview of the effects on the marine environment,” in ISOPE International Society Of Offshore And Polar Engineers Rhodes (Rodos), 427–434.
Soukissian, T., Karathanasi, F., and Axaopoulos, P. (2017). Satellite-Based Offshore wind resource assessment in the mediterranean sea. IEEE J. Ocean. Eng. 42, 73–86. doi: 10.1109/JOE.2016.2565018
Stock, A., and Micheli, F. (2016). Effects of model assumptions and data quality on spatial cumulative human impact assessments. Global Ecol. Biogeogr. 25, 1321–1332. doi: 10.1111/geb.12493
Stoutenburg, E. D., Jenkins, N., and Jacobson, M. Z. (2010). Power output variations of co-located offshore wind turbines and wave energy converters in California. Renew. Energy 35, 2781–2791. doi: 10.1016/j.renene.2010.04.033
Torre-Enciso, Y., Ortubia, I., Lopez de Aguileta, L. I., and Marques, J. (2009). “Mutriku. 159 wave power plant: from the thinking out to the reality,” in Proceeding of the 8th 160 European Wave Tidal Energy Conference, (Uppsala), 319–329.
UNEP-WCMC (2016). World Database on Protected Areas User Manual 1.4. Cambridge: UNEP-WCMC. Available online at: http://wcmc.io/WDPA_Manual
Veigas, M., Carballo, R., and Iglesias, G. (2014a). Wave and offshore wind energy on an island. Energy Sustain. Dev. 22, 57–65. doi: 10.1016/j.esd.2013.11.004
Veigas, M., and Iglesias, G. (2013). Wave and offshore wind potential for the island of Tenerife. Energy Convers. Manage. 76, 738–745. doi: 10.1016/j.enconman.2013.08.020
Veigas, M., and Iglesias, G. (2015). A hybrid wave—wind offshore farm for an island. Int. J. Green Energy 12, 570–576. doi: 10.1080/15435075.2013.871724
Veigas, M., Ramos, V., and Iglesias, G. (2014b). A wave farm for an island: detailed effects on the nearshore wave climate. Energy 69, 801–812. doi: 10.1016/j.energy.2014.03.076
Vicinanza, D., Cappietti, L., Ferrante, V., and Contestabile, P. (2011). Estimation of the wave energy in the Italian offshore. J. Coast. Res. 64, 613–617.
Vicinanza, D., Contestabile, P., and Ferrante, V. (2013). Wave energy potential in the north-west of Sardinia (Italy). Renew. Energy 50, 506–521. doi: 10.1016/j.renene.2012.07.015
Vicinanza, D., Contestabile, P., Nørgaard, J., and Lykke Andersen, T. (2014). Innovative rubble mound breakwaters for overtopping wave energy conversion. Coastal. Eng. 88, 154–170. doi: 10.1016/j.coastaleng.2014.02.004
Keywords: Marine Spatial Planning, wind energy, wave energy, Mediterranean sea, environmental impact, renewable energy
Citation: Azzellino A, Lanfredi C, Riefolo L, De Santis V, Contestabile P and Vicinanza D (2019) Combined Exploitation of Offshore Wind and Wave Energy in the Italian Seas: A Spatial Planning Approach. Front. Energy Res. 7:42. doi: 10.3389/fenrg.2019.00042
Received: 31 August 2018; Accepted: 08 April 2019;
Published: 24 April 2019.
Edited by:
Simone Bastianoni, University of Siena, ItalyReviewed by:
Dimitrios Angelopoulos, National Technical University of Athens, GreeceGiuliana Mattiazzo, Polytechnic University of Turin, Italy
Javier Abanades, Typsa Group, Spain
Copyright © 2019 Azzellino, Lanfredi, Riefolo, De Santis, Contestabile and Vicinanza. This is an open-access article distributed under the terms of the Creative Commons Attribution License (CC BY). The use, distribution or reproduction in other forums is permitted, provided the original author(s) and the copyright owner(s) are credited and that the original publication in this journal is cited, in accordance with accepted academic practice. No use, distribution or reproduction is permitted which does not comply with these terms.
*Correspondence: Arianna Azzellino, YXJpYW5uYS5henplbGxpbm9AcG9saW1pLml0