 Hui Cheng
 Aaron Bai Yanlin2
 Jun Wang
 Jiyun Zhao
- 1Department of Mechanical Engineering, City University of Hong Kong, Hong Kong, China
- 2Shanghai Chuangyi Fluid Machinery Co., Ltd., Shanghai, China
- 3College of Engineering, University of Wisconsin-Madison, Madison, WI, United States
Diameter effect on heat transfer deterioration (HTD) for supercritical water upward flow in circular tubes and annular channels at low mass flux and high heat flux was studied numerically based on validated turbulence model. When the same boundary conditions were applied, i.e., mass flux, heat flux, and inlet temperature, it was observed that for circular tubes the first peak of wall temperature moves upstream and its magnitude increases at first then decreases as tube diameter increases, the second peak moves downstream as tube diameter increases. For annular channels with a fixed inner diameter, HTD is suppressed with small outer diameter, while HTD occurs gradually as outer diameter increases. The phenomenon agrees with previous experiment studies. The mechanism was analyzed based on fully developed turbulent velocity profiles at the heated sections inlet. Increasing inner diameter for circular tubes or outer diameter for annular channels will result in the decrease of maximum velocity and velocity gradient in the near heated wall region, which makes velocity profile in this region much easier to be flattened by the buoyancy. Then an M-shaped axial velocity profile is formed, which will significantly decrease the Reynolds shear stress and the turbulent kinetic energy and hence impair the heat transfer and cause HTD. At the same flow conditions, HTD is much easier to occur in circular tubes than in annular channels with the same hydraulic diameters.
Introduction
The supercritical water reactor (SCWR) is one of the six generation IV nuclear systems. One advantage of SCWR is to increase the nuclear power plants thermal efficiency, which is now about 36–38%, to about 45–50% (Pioro and Mokry, 2011). Because no phase change occurs for supercritical water, SCWR can reduce the capital and operational costs through eliminating steam related facilities (Cheng et al., 2003; Pioro and Duffey, 2005).
Pioro and Mokry (2011) provided the pressure-temperature diagram of water (Figure 1). The critical temperature and critical pressure of water are 373.95 and 22.06 MPa, respectively. Figure 2 shows the thermophysical properties of water at 25.3 MPa. Because of the strong variation of the thermophysical properties in the area near the pseudocritical point, the characteristics of supercritical water heat transfer are quite different from subcritical water (Shitsman, 1963; Cheng et al., 2003, 2007; Hu and Gu, 2018; Xiao et al., 2018).
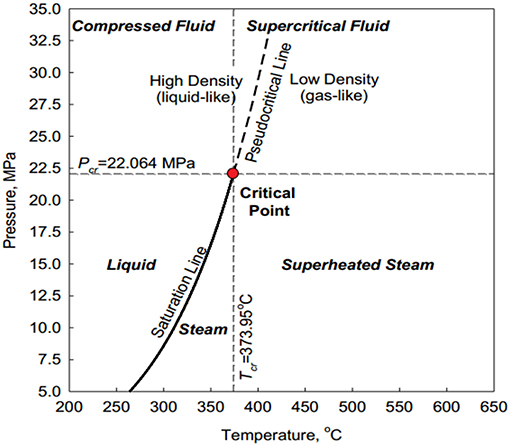
Figure 1. Pressure-temperature diagram of water, reprinted from Pioro and Mokry (2011) with permission of IntechOpen.
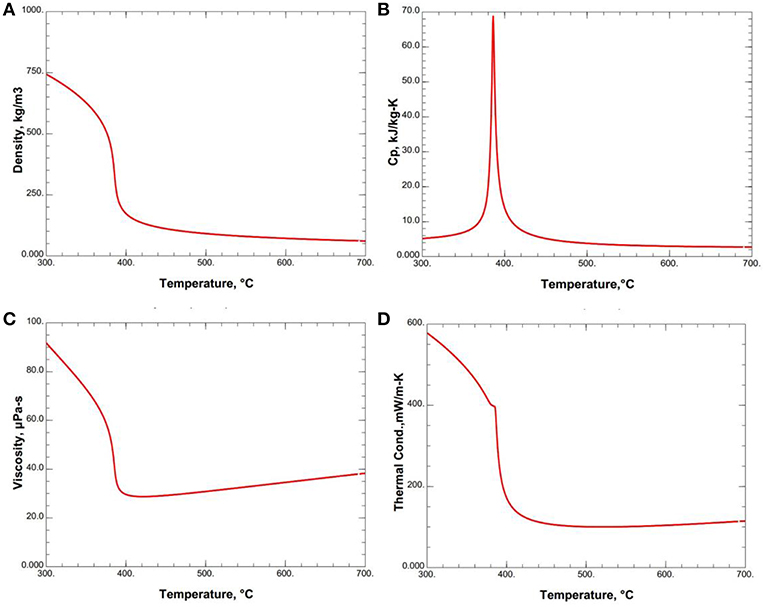
Figure 2. Thermophysical properties of water at 25.3 MPa, reprinted from Cheng et al. (2017) with permission of Elsevier. (A) Density, (B) Specific heat, (C) Viscosity, and (D) Thermal conductivity.
In the design of SCWR, one important safety issue due to the drastic property variation is the heat transfer deterioration (HTD). Shitsman was one of those who early pointed out the phenomenon (Shitsman, 1963). HTD usually occurs in a situation when fluid at supercritical pressure flows upward in a circular tube or an annular channel while it goes through the pseudocritical point at low mass fluxes and high heat fluxes conditions. When HTD occurs, the heated wall temperature increases drastically and then recovers, which may cause the fuel rod failure in SCWR. This phenomenon has been studied for decades and it is concluded that buoyancy force leads to the HTD (Jackson and Evans-Lutterodt, 1968; Hall and Jackson, 1969; Hall, 1971; Jackson et al., 1989; Kurganov and Kaptil'ny, 1992; Wang et al., 2004; Bae et al., 2005, 2008; Bae and Kim, 2009; Jackson, 2013; Cheng et al., 2017).
This paper aims to investigate the diameter effect on the behavior of HTD and to reveal the mechanisms behind these phenomena, which could provide some valuable guidance and support for the risk assessment in the design of SCWR. In the following, studies of diameter effect in heat transfer experiments of supercritical fluids in the past 50 years are reviewed (Yildiz and Groeneveld, 2014).
Yamagata et al. (1972) experimentally studied heat transfer characteristics of supercritical water flowing vertically upward in tubes. They reported the relation between the limit heat flux and mass flux for the flow in 10 mm ID tube (Figure 3A). For a given mass flux, when heat flux is larger than the limit value, HTD occurs. However, this relation was achieved at a fixed tube diameter (10 mm ID) and may not be applicable to other diameter tubes. For a given mass flux, heat flux and inlet temperature, if we know the diameter effect on the heat transfer, then we can estimate whether HTD is more or less severe in a different diameter tube based on previous experimental data and get a deeper understanding on HTD phenomenon.
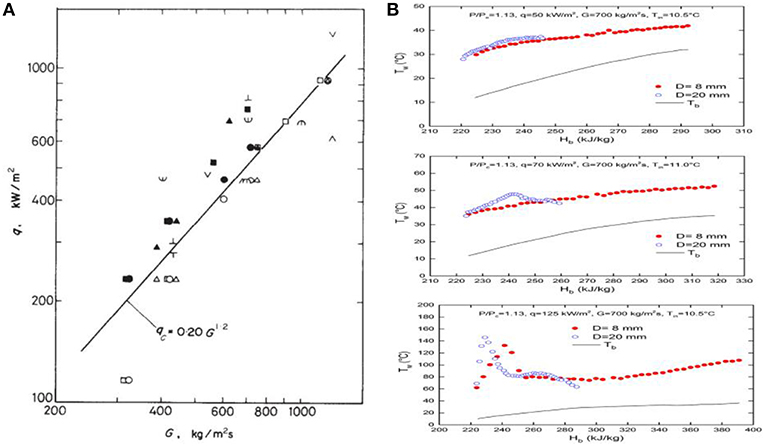
Figure 3. (A) Limit heat flux vs. mass flux for HTD, reprinted from Yamagata et al. (1972) with permission of Elsevier, (B) Diameter effect on Tw at a supercritical pressure with different heat fluxes, adapted from Zahlan et al. (2015) with permission of Elsevier.
Ackerman (1970) conducted experiments on supercritical water heat transfer at extensive flow conditions in tubes of several different diameters. For a given pressure and tube diameter, the limit curve between the heat flux which will cause HTD and mass flux is presented in Figure 9 in their paper (Ackerman, 1970). The limit curve shows that operation in the lower right region of the curve for a given diameter will cause HTD. Operation above and to the left will result in normal heat transfer. For a given pressure and mass flux, increasing the diameter will move the curve to the left and HTD will occur at a lower heat flux. They found that the HTD onset heat flux decreased about 28.6% for the 24.4 mm tube when compared with the 9.4 mm tube.
Shiralkar and Griffith (1970) studied HTD of supercritical CO2 flowing upward in two tubes with 3.18 and 6.35 mm diameter, respectively. It was observed that the peaks of wall temperature during HTD of the 6.35 mm ID tube were much sharper than the 3.18 mm ID tube.
Yamashita et al. (2003) conducted experiments on heat transfer of a supercritical pressure fluid flowing upward in uniformly heated tubes with different diameters, using HCFC22 as a test fluid. They reported the relation between the HTD onset heat flux and bulk enthalpy considering the tube diameter effect. It was found that the limit heat flux increases with smaller tube diameters, which is similar to Ackerman et al.'s results.
Song et al. (2008) experimentally investigated the heat transfer of supercritical CO2 flowing upward in tubes at two different diameters (4.4 mm and 9.0 mm ID) for the same mass flux and heat flux. They found that in larger diameter tubes the flow was more susceptible to HTD due to buoyancy.
Kim et al. (2008) conducted lots of experiments on supercritical CO2 heat transfer for various geometries including tubes with 4.4 and 9.0 mm ID, respectively, and an annular channel with 10 mm OD and 8.0 mm ID. They found that under the same flow conditions with low mass fluxes, HTD occurred in a 9.0 mm tube, while HTD was suppressed in the 4.4 mm tube and in the annular channel.
Bae et al. (2010) studied heat transfer to supercritical CO2 flowing upward and downward in tubes with 6.32 mm ID. The results were compared with the data provided by Song et al. (2008) and Kim et al. (2008) of 4.4 mm and 9.0 mm tubes and they found that under the relatively low heat flux of 30 kW/m2, HTD occurred in the 9.0 mm tube while normal heat transfer persisted in the tubes of 4.4 and 6.32 mm.
Zahlan et al. (2015) performed extensive thermal hydraulic tests for CO2 upward flow in two heated tubes with 8 mm and 22 mm ID at supercritical pressure conditions. The heat transfer characteristics of supercritical CO2 in the two tubes are shown in Figure 3B. When q equals 50 kW/m2, normal heat transfer occurs in both tubes. While when q equals 70 kW/m2, some HTD is observed in the 22 mm ID tube but not in the 8 mm ID tube. When q equals 125 kW/m2, obvious HTD occurs in both tubes and it can be seen the wall temperature peak moves upstream and its value is larger in 22 mm ID tube.
It can be concluded from these previous experimental results that the HTD onset heat flux is decreased with larger diameter tubes, HTD is much easier to occur in larger diameter tubes for the same flow conditions, i.e., mass flux, heat flux, and inlet temperature. However, these conclusions are all drawn directly from experimental data and the mechanism behind these phenomena is still not clear. Compared with experiments, numerical method has got its advantage to extract more information from the fluid field and has already been successfully applied in the researches of supercritical fluid heat transfer (Koshizuka et al., 1995; Yang et al., 2007; Palko and Anglart, 2008; Cheng et al., 2017). In the present work, numerical simulations were conducted for supercritical water flowing vertically upward in circular tubes and annular channels at low mass flux and high heat flux based on validated turbulence model to study the diameter effect on HTD and the corresponding mechanisms.
Numerical Methodology
Governing Equations and Turbulence Model
Because the geometries of circular tubes and annular channels are axisymmetric, the heat flux is uniformly applied on the heated wall, 2D axisymmetric model is used in the current simulation, which aims to greatly reduce the computational cost. The continuity, momentum and energy governing equations in cylindrical coordinates are given by:
Equation of continuity:
Equation of U-momentum:
Equation of V-momentum:
where U is the x-direction velocity, V is the r-direction velocity, ρ is the density. μe is the effective viscosity given by μe = μ + μt, μt is the turbulent viscosity defined by:
where fμ is the damping function considering near-wall effect, Cμ is a constant.
Equation of energy:
where Pr is molecular Prandtl number, h is enthalpy. σt is turbulent Prandtl number, which is 0.9 in all simulations.
In the past two decades, various turbulence models based on Reynolds Averaged N-S equations were used to investigate supercritical fluid heat transfer by a lot of researchers. However, these models are not universally applicable and have their own limitations, especially in predicting heat transfer deteriorations. It is widely accepted that k-ε models are usually found to overestimate the heat transfer deterioration while k-ω models usually underestimate it (Pucciarelli et al., 2015). Hence, it should be very careful when choosing these models to quantitatively study supercritical fluid heat transfer.
The Shear Stress Transport (SST) k-ω turbulence model has the advantage to combine the accuracy of k-ω model in near wall region with the good performance of k-ε model in the main flow region. Several researchers (Palko and Anglart, 2008; Wen and Gu, 2010, 2011; Jaromin and Anglart, 2013) claimed that SST k-ω model has better performance in predicting HTD in their applications. To qualitatively study the diameter effect on HTD, the SST k-ω turbulence model is used here. Details of SST k-ω turbulence model is referred to the help documents of Fluent 15.0.
Computational Domains
To investigate diameter effect on HTD, 7 circular tubes with different IDs ranging from 7 to 32 mm and 6 annular channels with fixed 8 mm inner diameter and different outer diameters ranging from 12 to 32 mm are used as computational domains. The geometric parameters for these circular tubes and annular channels are shown in Table 1. Schematic of the boundary conditions of circular tubes and annular channels are shown in Figure 4. Among all these cases, geometric parameters of Case C2 is taken from experimental data of Shitsman (Shitsman, 1963). In Shitsman's experiment, heat transfer of the supercritical water flowing upward in 8 mm ID tubes was investigated.
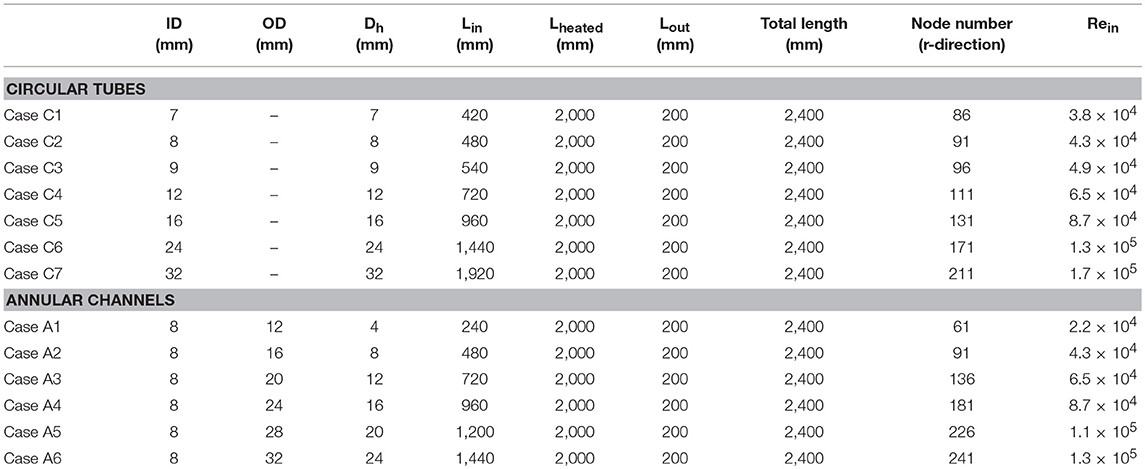
Table 1. Geometric parameters of computational domains for circular tubes and annular channels.
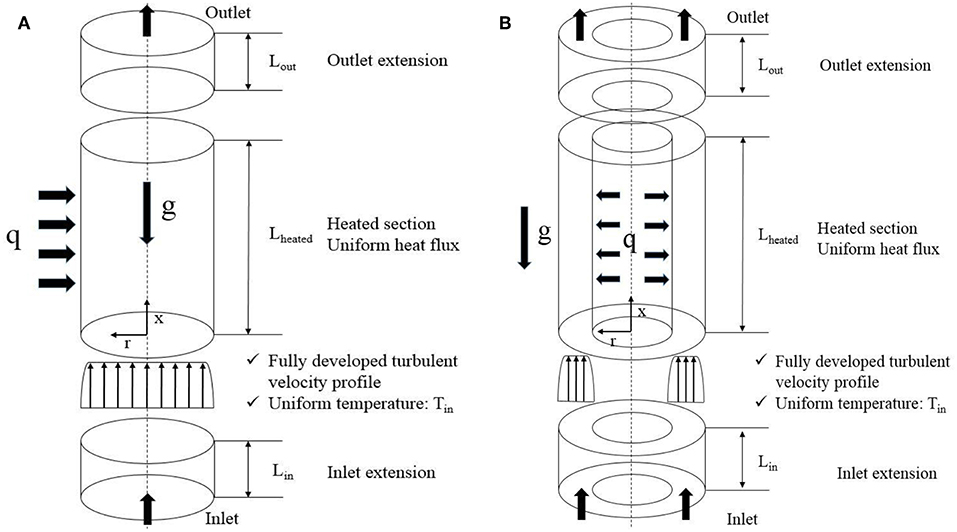
Figure 4. Schematic of the boundary conditions in (A) circular tubes, reprinted from Cheng et al. (2017) with permission of Elsevier, (B) annular channels.
The computational domains of both circular tubes and annular channels are divided into three connecting sections. The inlet extension is used to achieve fully developed turbulence flow without heat flux. In all cases, the length of the unheated inlet extension is set to be 60 times of the hydraulic diameter. In the heated section, heat flux is uniformly applied at its inner wall. The outlet extension is to ensure no backflow occurs on the outlet surface.
In all cases as shown in Table 1, the grids along axial x-direction are uniform and are set to 2 mm. While the grids along the radial r-direction are non-uniform, to increase the accuracy (Cheng et al., 2007; Yang et al., 2007), the grids near the wall are fine enough to make sure that y+ at the first element to be smaller than 1. In all cases, the size of the first grid is set to be 1e-3 mm, the size ratio is 1.08. The r-direction node numbers are also shown in Table 1. The values of y+ in all cases are <0.3.
Boundary Conditions
The thermophysical properties are already embed into Fluent, which are based on the database of The National Institute of Standards and Technology (NIST). The boundary conditions in Table 2 come from Shitsman's experiment. The operating pressure is 25.3 MPa. Inlet is set as mass flow inlet and the corresponding turbulence intensity and turbulence viscosity ratio are 5% and 10, respectively. Outlet is set as pressure outlet. Heat flux is uniformly applied on the inner wall for both circular tubes and annular channels. Bulk temperature at inlet is 324.5 at subcritical condition. Buoyancy force is taken into account, the acceleration of gravity is 9.8 m/s2. Steady-state simulations are conducted for all cases.
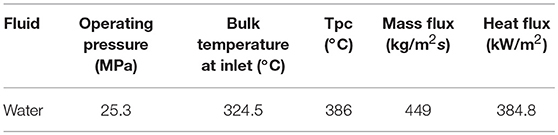
Table 2. Boundary and operating conditions.
Numerical Method Validation
In our previous work, Case C2 was simulated with the same computational domain, flow conditions and turbulence model to study HTD phenomena. Grid independence tests were conducted and the calculated results agreed with Shitsman's experiment results. In this paper, details of the validation process is not provided, interested readers can refer to Cheng et al. (2017).
Results and Discussions
Bulk Enthalpies and Temperatures
Using the following equation, the bulk enthalpies can be calculated:
where x is the axial position, hin is the inlet bulk enthalpy corresponding to Tin. q is heat flux, ID is inner diameter of circular tubes or annular channels, G is mass flux, and Aflow is cross-sectional area. With the bulk enthalpy and the operating pressure, the bulk temperature can be obtained.
Diameter Effect in Circular Tubes
In Cheng et al.'s recent work (Cheng et al., 2017), two peaks of wall temperature were found in the simulation results of mixed convective heat transfer at the same flow condition corresponding to Case C2 in the present study when HTD occurred, which was consistent with Shitsman's experimental results. The wall temperature distribution in the axial direction is shown in Figure 5 and the mechanism was explained in detail with axial velocity profiles and turbulent kinetic energy (TKE) distributions in radial direction.
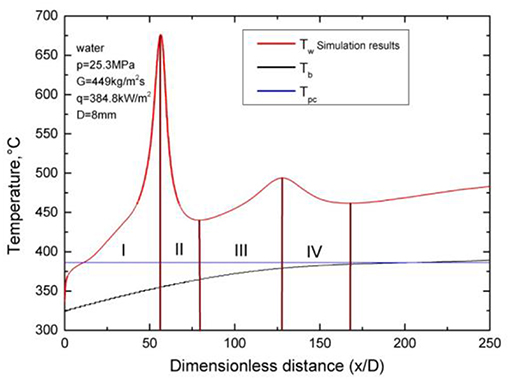
Figure 5. Wall temperature distribution in the axial direction in 8 mm ID tube, reprinted from Cheng et al. (2017) with permission of Elsevier.
In the present study, the simulated wall temperature distributions in the axial direction in circular tubes with different IDs at the same flow conditions are shown in Figure 6. The bulk temperature in the axial direction of 8 mm ID circular tube is presented in this figure. It shows that two wall temperature peaks always occur at present flow conditions, no matter tube diameter increases or decreases. The positions of wall temperature peaks in the axial direction for different diameter tubes are shown in Figure 7. From these figures, it can be seen that with the increase of tube diameter, the first peak of wall temperature moves upstream gradually and its magnitude increases first when inner diameter is ≤ 16 mm and then decreases when inner diameter is larger than 16 mm. This phenomenon is consistent well with the experiment result of Shiralkar and Griffith (1970) and Zahlan et al. (2015) as presented in Figure 3B. For the second peak, it moves downstream gradually as tube diameter increases.
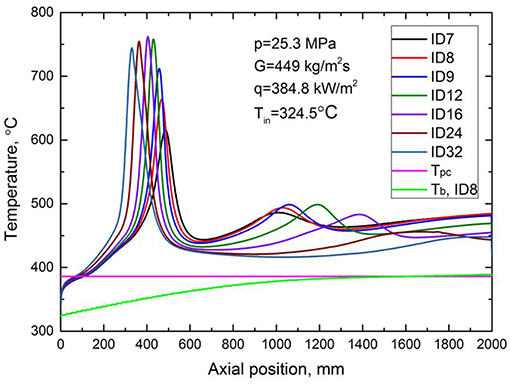
Figure 6. Wall temperature distributions in the axial direction in circular tubes.
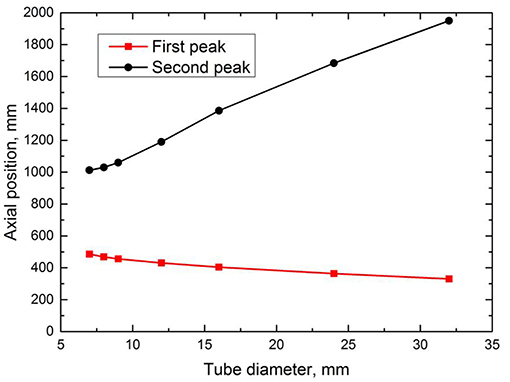
Figure 7. Wall temperature peak positions for different diameter tubes.
To explore the mechanism behind these phenomena, the fully developed turbulent axial velocity profiles at the heated sections inlet with different inner diameters for circular tubes are extracted and shown in Figure 8. In order to facilitate comparison of these fully developed turbulent velocity profiles, the radial positions of the heated walls are aligned to the right. It shows clearly that for the same mass flux and inlet temperature, the boundary layer velocity profiles are different. As tube diameter increases, the maximum velocity in the main flow region gradually decreases and the velocity gradient in the boundary layer also gradually decreases. These conclusions can also be derived by theoretical analysis. In fact, there are numerous empirical fully developed velocity profiles for turbulent circular tube flows. The most famous one is the power-law velocity profile given by:
where Umax is the maximum axial velocity at the centerline. n is a constant, which increases as Reynolds number increases. The average velocity can be derived by integrating Equation (7):
Since the average velocity is the same for all circular tubes due to the same mass flux and inlet temperature, the exponent n increases with the increase of Reynolds number and diameter, we can conclude from Equation (10) that the maximum velocity in the main flow region decreases with the increase of tube diameter. Based on velocity profile in Equation (11), we can see that at the same position (R-r has the same value in Figure 8) away from the heated wall, U decreases monotonously as tube diameter increases. Hence, there is no intersection point for these fully developed turbulent velocity profile when aligned to the right. We can conclude from theoretical analysis that the gradient of axial velocity in the boundary layer gradually decreases with the increase of tube diameter.
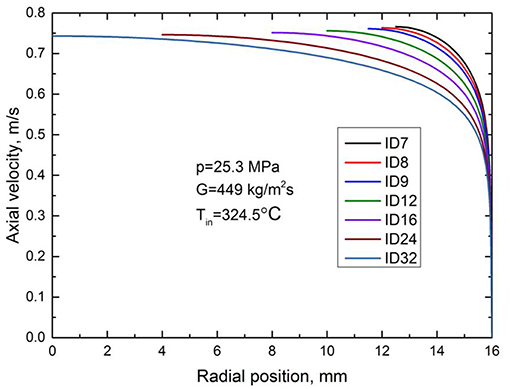
Figure 8. Fully developed turbulent velocity profile in circular tubes.
According to Kurganov et al.'s experimental study (Kurganov and Kaptil'ny, 1992), direct numerical simulations (Bae et al., 2005, 2008; Bae and Kim, 2009) and Cheng et al.'s analysis (Cheng et al., 2017), HTD occurs in upward flow when the axial velocity profile in the near heated wall region is flattened due to buoyancy effect and an M-shaped axial velocity profile is formed. At the same time, Reynolds shear stress and TKE in the near heated wall region are reduced significantly.
In the present study, when tube diameter increases, the maximum axial velocity in the main flow region and the gradient of axial velocity in the near heated wall region are both reduced at the heated section inlet. Hence, for larger diameter tubes, the axial velocity profile in the near heated wall region is much easier to be flattened due to buoyancy, an M-shaped axial velocity profile is formed earlier and hence HTD occurs earlier along the axial position, which moves the first peak upstream. The axial and radial velocity, Reynolds shear stress and TKE distributions at four different axial positions (inlet of heated section, 100 mm before, at and 100 mm after the first wall temperature peak) for Case C2, C4, and C6 are shown in Figure 9. We can see that at the axial position of the first wall temperature peak, an M-shaped axial velocity profile is formed because of buoyancy. The radial velocity has the maximum value, which means that the natural convection is strongest at this position. While the Reynolds shear stress and TKE have the minimum values at the peak position in the near heated wall region as shown in the blue circles, which means that the heat transfer due to turbulence is strongly suppressed. We can also find from these figures that the M-shaped axial velocity profile is formed earlier with the increase of tube diameter.
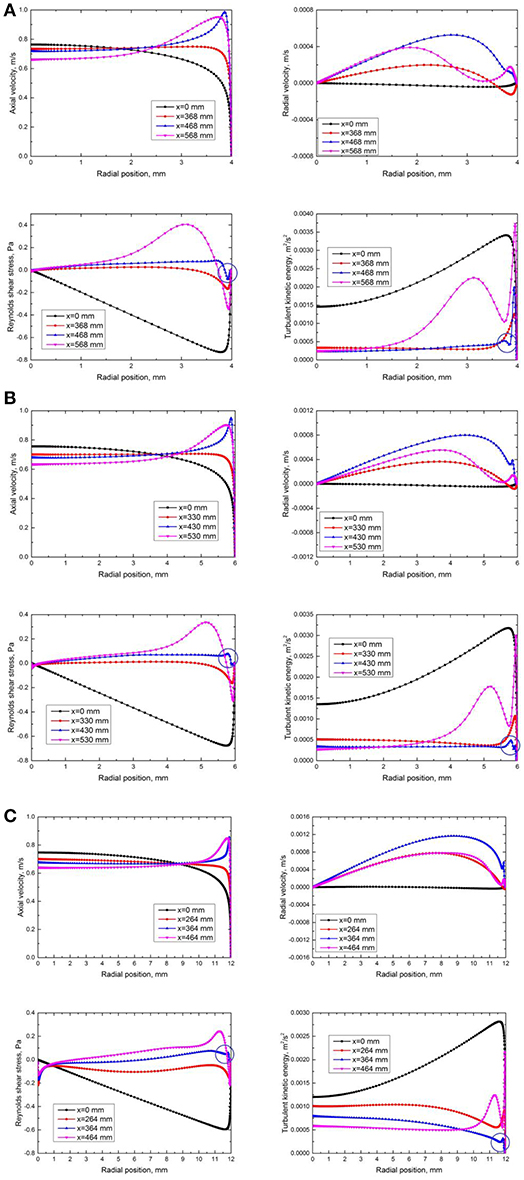
Figure 9. The axial and radial velocity, Reynolds shear stress and TKE distributions at four different axial positions in circular tubes. (A) Case C2, 8 mm ID tube, first wall temperature peak at x = 468 mm. (B) Case C4,12 mm ID tube, first wall temperature peak at x = 430 mm. (C) Case C6, 24 mm ID tube, first wall temperature peak at x = 364 mm.
Regarding the first peak magnitude, it firstly increases, then decreases as tube diameter increases as shown in Figure 6. When the diameters are small, the maximum axial velocity decreases significantly as tube diameter increases as shown in Figure 8. The decrease of velocity gradient and TKE is relatively large, hence HTD is much more severe with the increase of tube diameter. However, when tube diameters are large enough, the maximum axial velocity and near wall velocity profile changes very little as tube diameter increases. In this situation, the effect of mass flow rate becomes larger than velocity gradient effect, more water is used to cool the heated surface, which results in the HTD less severe and the decrease of the first peak magnitude.
The formation process of the second wall temperature peak is described in detail in Cheng et al.'s recent work (Cheng et al., 2017). In phase III of Figure 5, the shear stress makes the axial velocity profile flat in the main flow region and leads to the second peak. Different from phase I, the wall temperature response speed in phase III depends on the tube diameter. With larger tube diameter, the wall temperature response speed is slower and then the second peak moves downstream.
Diameter Effect in Annular Channels
The simulated inner wall temperature distributions in the axial direction in annular channels with fixed inner diameter and various outer diameters are shown in Figure 10. The bulk temperature in the axial direction of the annular channel with 12 mm outer diameter is also shown here. The characteristics of wall temperature in annular channels are quite different from the circular tubes. It is interesting to find that when OD is ≤ 24 mm, even though the flow conditions and the diameter of heated wall are the same as in the circular tubes, HTD is suppressed and wall temperature increases monotonically. The result agrees with the experimental result of Kim (Kim et al., 2008). More interestingly, it is found that when OD is larger than 24 mm, HTD occurs and wall temperature peaks becomes more and more noticeable with the increase of OD. However, compared with the first peaks in circular tubes, the peaks in annular channels are much smaller and smoother.
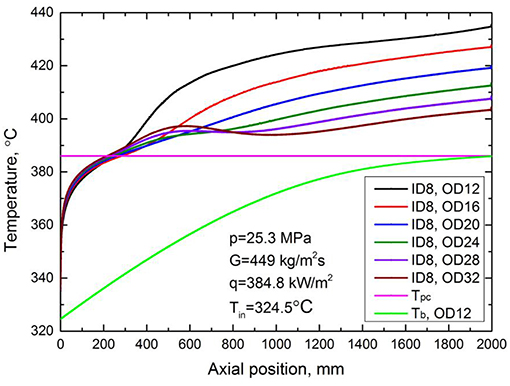
Figure 10. Wall temperature distributions in the axial direction in annular channels.
The fully developed turbulent axial velocity profiles at the heated sections inlet with different outer diameters for annular channels are extracted and shown in Figure 11. Similar to circular tubes, the maximum axial velocity and the velocity gradient in the near heated wall region decreases gradually as outer diameter increases. When OD is small, the velocity gradient is so large that the velocity profile in the near heated wall region cannot be flattened by the buoyancy effect. The Reynolds shear stress and TKE in the near wall region keeps large enough to suppress HTD. With the increase of OD, the maximum axial velocity and the velocity gradient decreases gradually and HTD occurs gradually as shown in Figure 10. The axial and radial velocity, Reynolds shear stress and TKE distributions at four different axial positions (inlet of heated section, 100 mm before, at and 100 mm after the wall temperature peak) for Case A6 is shown in Figure 12. We can see that a half M-shaped axial velocity profile is formed near the heated wall when HTD occurs in the annular channel. Similar to circular tubes, the Reynolds shear stress and TKE have the minimum values at the peak position in the near heated wall region as shown in the blue circles, which means that the heat transfer due to turbulence is suppressed. However, these minimum values in the near heated wall region in annular channels are much larger than those in the circular tubes, which explains why the peaks in annular channels are much smaller and smoother.
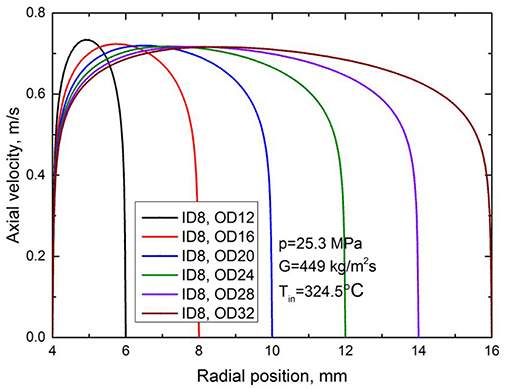
Figure 11. Fully developed turbulent velocity profile in annular channels.
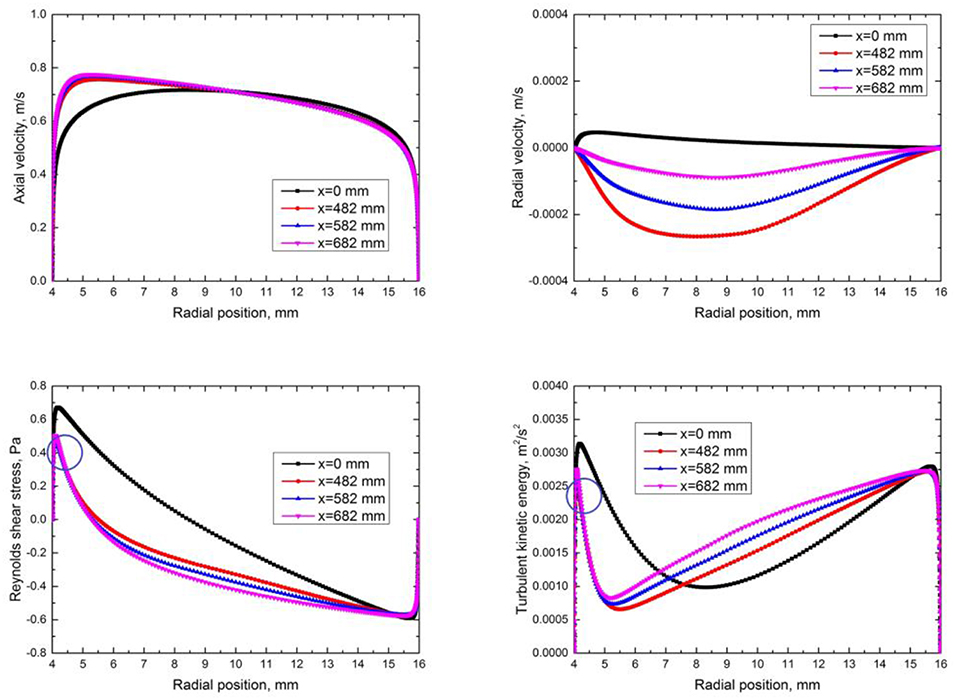
Figure 12. The axial and radial velocity, Reynolds shear stress and TKE distributions at four different axial positions for Case A6 (8 mm ID, 32 mm OD, wall temperature peak at x = 582 mm) in annular channels.
Comparison Between Circular Tubes and Annular Channels
Even though the hydraulic diameters of Case C2 and Case A2 are both 8 mm, it is interesting to find in Figure 13A that the heat transfer behaviors are quite different at the same flow conditions. HTD occurs in the circular tube but not in the annular channel, where the heated wall temperature just increases monotonously. Figure 13B shows the fully developed turbulent axial velocity profiles at the heated section inlet for Case C2 and Case A2, where the heated walls are aligned to the right. We can see that the differences of maximum velocity and velocity gradient between circular tube and annular channel are very small. Hence, the reason that results in the different behaviors of heat transfer does not just depend on the initial velocity profile at the heated section inlet. To explain this phenomenon, let's equally divide the flow regions along radial direction in circular tube and annular channel into pieces as shown in Figure 13C, where each piece is a small annular flow region with the same thickness. For the yellow and green flow region with the same distance away from the inner wall in Figure 13C, the area of the green flow region in annular channel is larger than the yellow one in the circular tube. And the difference becomes more pronounced along the direction of heat flow. Since the heat flux is the same, with larger area of flow region to absorb heat in annular channel, the water temperature in the near heated wall region increases significantly slower than in the circular tube, then buoyancy effect is much weaker and hence HTD is much easier to be suppressed.
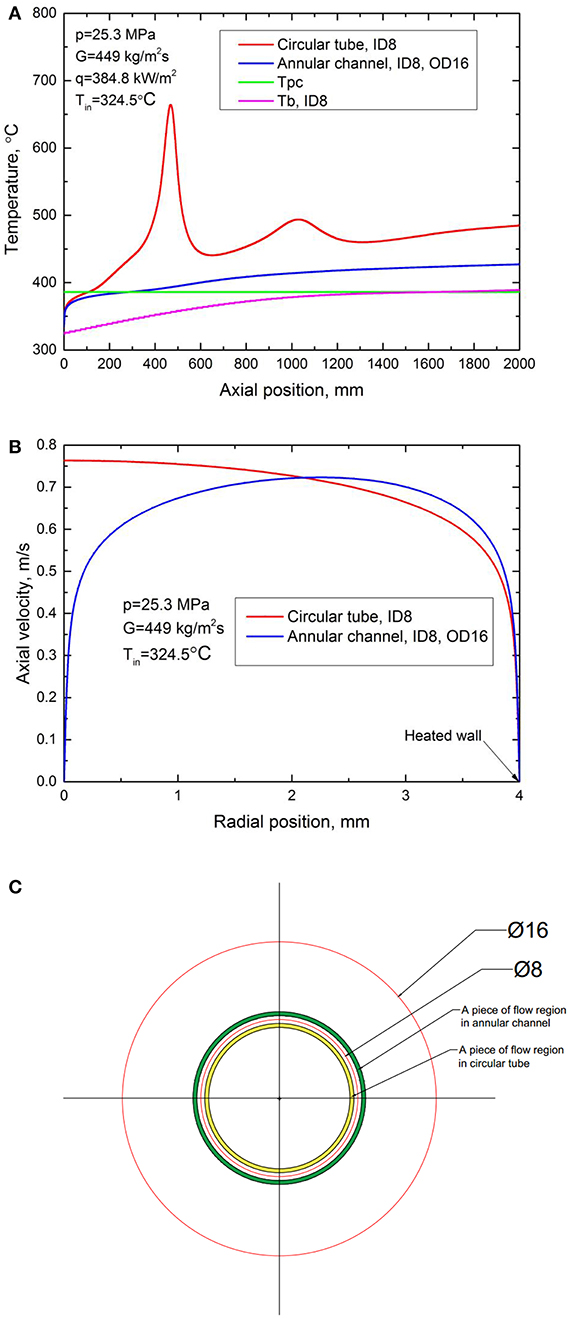
Figure 13. Comparison between Case C2 and Case A2. (A) Wall temperature distributions along axial direction. (B) Fully developed turbulent velocity profiles. (C) Equally divided pieces of flow region.
Conclusions
In this paper, diameter effect on HTD for supercritical water upward flow in circular tubes and annular channels at low mass flux and high heat flux was studied numerically. The simulations were carried out using SST k-ω turbulence model with Fluent 15.0 software. When the same boundary conditions were applied, i.e., mass flux, heat flux, and inlet temperature, it was observed that for circular tubes the first peak of wall temperature moves upstream while the second peak moves downstream as tube diameter increases. The magnitude of the first peak of wall temperature increases first when inner diameter is ≤ 16 mm and then decreases when inner diameter is larger than 16 mm. While at the same boundary conditions in annular channels with fixed inner diameters, we found that HTD is suppressed in the situation when the outer diameter is ≤ 24 mm, and when outer diameter is larger than 24 mm, it was interesting to find that HTD occurs. These phenomena are consistent with previous experiments. The mechanism of these phenomena was analyzed in detail based on fully developed turbulent velocity profiles in the near wall region at the inlet of the heated sections. Increasing inner diameter for circular tubes or outer diameter for annular channels will result in the decrease of maximum velocity and velocity gradient in the near heated wall region, which makes velocity profile in this region much easier to be flattened by the buoyancy. Then an M-shaped axial velocity profile is formed, which will significantly decrease the Reynolds shear stress and TKE and hence impair the heat transfer and cause HTD. At the same flow conditions, HTD is much easier to occur in circular tubes than in annular channels with the same hydraulic diameters.
Data Availability
All datasets generated for this study are included in the manuscript/supplementary files.
Author Contributions
HC conducted the research and wrote the manuscript. AY worked together with the first author in the research. JW provided lots of valuable suggestions during the research. JZ guided the research.
Funding
This study was funded by Shenzhen Science Technology and Innovation Committee with the project number: JCYJ20150601102053068.
Conflict of Interest Statement
The authors declare that the research was conducted in the absence of any commercial or financial relationships that could be construed as a potential conflict of interest.
References
Ackerman, J. (1970). Pseudoboiling heat transfer to supercritical pressure water in smooth and ribbed tubes. J. Heat Transfer 92, 490–497. doi: 10.1115/1.3449698
Bae, J. H., Yoo, J. Y., and Choi, H. (2005). Direct numerical simulation of turbulent supercritical flows with heat transfer. Phys. Fluids 17:105104. doi: 10.1063/1.2047588
Bae, J. H., Yoo, J. Y., and McEligot, D. M. (2008). Direct numerical simulation of heated CO2 flows at supercritical pressure in a vertical annulus at Re = 8900. Phys. Fluids 20:055108. doi: 10.1063/1.2927488
Bae, Y. Y., and Kim, H. Y. (2009). Convective heat transfer to CO2 at a supercritical pressure flowing vertically upward in tubes and an annular channel. Exp. Ther. Fluid Sci. 33, 329–339. doi: 10.1016/j.expthermflusci.2008.10.002
Bae, Y. Y., Kim, H. Y., and Kang, D. J. (2010). Forced and mixed convection heat transfer to supercritical CO2 vertically flowing in a uniformly-heated circular tube. Exp. Ther. Fluid Sci. 34, 1295–1308. doi: 10.1016/j.expthermflusci.2010.06.001
Cheng, H., Zhao, J., and Rowinski, M. K. (2017). Study on two wall temperature peaks of supercritical fluid mixed convective heat transfer in circular tubes. Int. J. Heat Mass Transf. 113, 257–267. doi: 10.1016/j.ijheatmasstransfer.2017.05.078
Cheng, X., Kuang, B., and Yang, Y. H. (2007). Numerical analysis of heat transfer in supercritical water cooled flow channels. Nuclear Eng. Design 237, 240–252. doi: 10.1016/j.nucengdes.2006.06.011
Cheng, X., Schulenberg, T., Bittermann, D., and Rau, P. (2003). Design analysis of core assemblies for supercritical pressure conditions. Nuclear Eng. Design 223, 279–294. doi: 10.1016/S0029-5493(03)00059-1
Hall, W. B. (1971). “Heat transfer near the critical point,” in Advances in Heat Transfer, eds. F. I. Thomas and P. H. James (Elsevier), 1–86. doi: 10.1016/S0065-2717(08)70016-9
Hall, W. B., and Jackson, J. D. (1969). Laminarisation of a Turbulent Pipe Flow by Buoyancy Forces. Minneapolis, MN: ASME, Paper No. 69-HT-55.
Hu, Z. X., and Gu, H. Y. (2018). Heat transfer of supercritical water in annuli with spacers. Int. J. Heat Mass Transf. 120, 411–421. doi: 10.1016/j.ijheatmasstransfer.2017.12.056
Jackson, J. D. (2013). Fluid flow and convective heat transfer to fluids at supercritical pressure. Nuclear Eng. Design 264, 24–40. doi: 10.1016/j.nucengdes.2012.09.040
Jackson, J. D., Cotton, M. A., and Axcell, B. P. (1989). Studies of mixed convection in vertical tubes. Int. J. Heat Fluid Flow 10, 2–15. doi: 10.1016/0142-727X(89)90049-0
Jackson, J. D., and Evans-Lutterodt, K. O. J. (1968). Impairment of Turbulent Forced Convection Heat Transfer to Supercritical Pressure CO2 Caused by Buoyancy Forces. University of Manchester Report N.E.2.
Jaromin, M., and Anglart, H. (2013). A numerical study of heat transfer to supercritical water flowing upward in vertical tubes under normal and deteriorated conditions. Nuclear Eng. Design 264, 61–70. doi: 10.1016/j.nucengdes.2012.10.028
Kim, H., Kim, H. Y., Song, J. H., and Bae, Y. Y. (2008). Heat transfer to supercritical pressure carbon dioxide flowing upward through tubes and a narrow annulus passage. Progr. Nuclear Energy 50, 518–525. doi: 10.1016/j.pnucene.2007.11.065
Koshizuka, S., Takano, N., and Oka, Y. (1995). Numerical analysis of deterioration phenomena in heat transfer to supercritical water. Int. J. Heat Mass Transf. 38, 3077–3084. doi: 10.1016/0017-9310(95)00008-W
Kurganov, V. A., and Kaptil'ny, A. G. (1992). Velocity and enthalpy fields and eddy diffusivities in a heated supercritical fluid flow. Exp. Ther. Fluid Sci. 5, 465–478. doi: 10.1016/0894-1777(92)90033-2
Palko, D., and Anglart, H. (2008). Theoretical and numerical study of heat transfer deterioration in high performance light water reactor. Sci. Technol. Nuclear Install. 2008:405072. doi: 10.1155/2008/405072
Pioro, I., and Mokry, S. (2011). “Thermophysical properties at critical and supercritical conditions,” in Heat Transfer: Theoretical Analysis, Experimental Investigations and Industrial Systems, eds. A. Belmiloudi (Rijeka: INTECH), 573–592. doi: 10.5772/13790
Pioro, I. L., and Duffey, R. B. (2005). Experimental heat transfer in supercritical water flowing inside channels (survey). Nuclear Eng. Design 235, 2407–2430. doi: 10.1016/j.nucengdes.2005.05.034
Pucciarelli, A., Borroni, I., Sharabi, M., and Ambrosini, W. (2015). Results of 4-equation turbulence models in the prediction of heat transfer to supercritical pressure fluids. Nuclear Eng. Design 281, 5–14. doi: 10.1016/j.nucengdes.2014.11.004
Shiralkar, B., and Griffith, P. (1970). The effect of swirl, inlet conditions, flow direction, and tube diameter on the heat transfer to fluids at supercritical pressure. J. Heat Transfer 92, 465–471. doi: 10.1115/1.3449690
Shitsman, M. E. (1963). Impairment of the heat transmission at supercritical pressures (Heat transfer process examined during forced motion of water at supercritical pressures). High Temp. 1, 237–244.
Song, J. H., Kim, H. Y., Kim, H., and Bae, Y. Y. (2008). Heat transfer characteristics of a supercritical fluid flow in a vertical pipe. J. Supercrit. Fluids 44, 164–171. doi: 10.1016/j.supflu.2007.11.013
Wang, J., Li, J., and Jackson, J. D. (2004). A study of the influence of buoyancy on turbulent flow in a vertical plane passage. Int. J. Heat Fluid Flow 25, 420–430. doi: 10.1016/j.ijheatfluidflow.2004.02.008
Wen, Q., and Gu, H. Y. (2010). Numerical simulation of heat transfer deterioration phenomenon in supercritical water through vertical tube. Ann. Nuclear Energy 37, 1272–1280. doi: 10.1016/j.anucene.2010.05.022
Wen, Q. L., and Gu, H. Y. (2011). Numerical investigation of acceleration effect on heat transfer deterioration phenomenon in supercritical water. Progr. Nuclear Energy 53, 480–486. doi: 10.1016/j.pnucene.2011.02.012
Xiao, Y., Pan, J., and Gu, H. (2018). Numerical investigation of spacer effects on heat transfer of supercritical fluid flow in an annular channel. Int. J. Heat Mass Transf. 121, 343–353. doi: 10.1016/j.ijheatmasstransfer.2018.01.030
Yamagata, K., Nishikawa, K., and Hasegawa, S. (1972). Forced convection heat transfer to supercritical water flowing in tubes. Int. J. Heat Mass Transfer 15, 2575–2593. doi: 10.1016/0017-9310(72)90148-2
Yamashita, T., Yoshida, S., Mori, H., Morooka, S., Komita, H., and Nishida, K. (2003). “Heat transfer study under supercritical pressure conditions,” in Proceedings of the International Conference on Global Environment and Advanced Nuclear Power Plants (GENES4/ANP2003) Papaer1119 (Kyoto), 15–19.
Yang, J., Oka, Y., Ishiwatari, Y., Liu, J., and Yoo, J. (2007). Numerical investigation of heat transfer in upward flows of supercritical water in circular tubes and tight fuel rod bundles. Nuclear Eng. Design 237, 420–430. doi: 10.1016/j.nucengdes.2006.08.003
Yildiz, S., and Groeneveld, D. C. (2014). Diameter effect on supercritical heat transfer. Int. Commun. Heat Mass Transfer 54, 27–32. doi: 10.1016/j.icheatmasstransfer.2014.02.017
Zahlan, H., Groeneveld, D., and Tavoularis, S. (2015). Measurements of convective heat transfer to vertical upward flows of CO2 in circular tubes at near-critical and supercritical pressures. Nuclear Eng. Design 289, 92–107. doi: 10.1016/j.nucengdes.2015.04.013
Nomenclature
Keywords: supercritical water, heat transfer deterioration, diameter effect, maximum velocity, velocity gradient, turbulent kinetic energy
Citation: Cheng H, Yanlin AB, Wang J and Zhao J (2019) Diameter Effect on the Wall Temperature Behaviors During Supercritical Water Heat Transfer Deterioration in Circular Tubes and Annular Channels. Front. Energy Res. 7:73. doi: 10.3389/fenrg.2019.00073
Received: 27 May 2019; Accepted: 19 July 2019;
Published: 02 August 2019.
Edited by:
Bruno Panella, Polytechnic University of Turin, ItalyReviewed by:
Walter Ambrosini, University of Pisa, ItalyIvo Kljenak, JoŽef Stefan Institute (IJS), Slovenia
Copyright © 2019 Cheng, Yanlin, Wang and Zhao. This is an open-access article distributed under the terms of the Creative Commons Attribution License (CC BY). The use, distribution or reproduction in other forums is permitted, provided the original author(s) and the copyright owner(s) are credited and that the original publication in this journal is cited, in accordance with accepted academic practice. No use, distribution or reproduction is permitted which does not comply with these terms.
*Correspondence: Jiyun Zhao, aml5dXpoYW9AY2l0eXUuZWR1Lmhr