 Changgang Wang
 Jun An1,2*
- 1Key Laboratory of Modern Power System Simulation and Control and Renewable Energy Technology, Ministry of Education (Northeast Electric Power University), Jilin, China
- 2School of Electrical Engineering, Northeast Electric Power University, Jilin, China
The automatic identification of the topology of power networks is important for the data-driven and situation-aware operation of power grids. Traditional methods of topology identification lack a data-tolerant mechanism, and the accuracy of their performance in terms of identification is thus affected by the quality of data. Topology identification is related to the link prediction problem. The graph neural network can be used to predict the state of unlabeled nodes (lines) through training on features of labeled nodes (lines) with fault tolerance. Inspired by the characteristics of the graph neural network, we applied it to topology identification in this study. We propose a method to identify the topology of a power network based on a knowledge graph and the graph neural network. Traditional knowledge graphs can quickly mine possible connections between entities and generate graph structure data, but in the case of errors or informational conflicts in the data, they cannot accurately determine whether the relationships between the entities really exist. The graph neural network can use data mining to determine whether a connection obtained between entities is based on their eigenvalues, and has a fault tolerance mechanism to adapt to errors and informational conflicts in the graph data, but needs the graph data as database. The combination of the knowledge graph and the graph neural network can compensate for the deficiency of the single knowledge graph method. We tested the proposed method by using the IEEE 118-bus system and a provincial network system. The results showed that our approach is feasible and highly fault tolerant. It can accurately identify network topology even in the presence of conflicting and missing measurement-related information.
Introduction
With access to new energy sources continuously increasing and the scale of power grids growing, the variability and complexity of the operation of power grids has increased drastically (Li et al., 2018). In recent years, several blackouts in areas across the world have caused substantial economic losses and led to adverse social impacts. The prevalent online security defense systems for power grids, which focus on modeling, simulation, and fault prediction, have been severely challenged. With the rapid development of power grid measurement systems and the increasing maturity of big data technology, the state cognition and control of grid operations based on operational information on power grids has emerged as the new model for their secure operation (Liu et al., 2018). In addition, the increasing uncertainties surrounding the use of renewable power has provided unprecedented challenges for ensuring the secure and economic operation of the current power systems (Li et al., 2019).
Understanding the topological structure of a power grid and laws of changes within it in a timely manner based on measurements is the basis for realizing the data-driven operation and control of power grids. Research on identifying the topology of a power network can be divided into several classes. Several studies have used the incidence matrix and the adjacency matrix constructed by using the switching state of the system to determine its connectivity and track topological changes (Zhu et al., 2011; Ma et al., 2014; Lourenco et al., 2015). Such methods are less tolerant of faults and conflicting telemetry data, and their effect depends entirely on the quality of remote signaling data. Other attempts have been made to identify the network topology based on graph theory and object-oriented technology (Song et al., 2005; Nian et al., 2008; Wang et al., 2009; Li et al., 2011; Yansheng et al., 2017). Such approaches involve using technology for the matrix-based identification of topology (Wang et al., 2019). They can compensate for the lower computational efficiency of the original process in terms of timeliness by optimizing the method, but are still reliant on remote signaling data for topology identification and have poor fault tolerance. Recently, the topology identification problem has been transformed into an optimal combination of measurement data problem. (Liu et al., 2019). It is a new attempt to identify network topology based entirely on data. The feasibility of this approach has been verified. Still, this method is not fault tolerant, and requires complete information concerning the active power. The determined optimal combination of data is directly affected when data are missing or when significant errors occur. Furthermore, this algorithm requires a large amount of redundant information as a supporting condition. As Power Management Units are not fully operational, owing to the massive investment required, the requisite supplementary data are difficult to obtain. In summary, current methods of topology identification depend on the quality of data. We thus need a fault-tolerant method of topology identification.
The use of knowledge graph technology has emerged in recent years in several fields, and has attracted widespread attention from both industry and academia (Liu and Wang, 2018). The knowledge graph is a mesh knowledge base of entities with attributes linked through relationships. Its value lies in organizing related information at minimal cost and generating useful knowledge. The topology of a power network is graph data reflecting node-to-node relationships. So the knowledge graph is an excellent vehicle for describing topological information (Park et al., 2019). However, information conflicts may occur in the knowledge graph due to errors or missing information. We thus need a data mining method to identify relationships that cannot be confirmed owing to the informational conflicts.
The graph neural network (GNN) is applicable mainly to non-Euclidean spatial data (Park et al., 2019). It has been applied to a variety of fields (Wu et al., 2018; Jing et al., 2020; Li et al., 2020; Xie et al., 2020; Yu et al., 2020). Multiple types of graph neural networks have been derived for different problems (Zhang et al., 2019; Nikolentzos et al., 2020; Su et al., 2020; Wu et al., 2020). Because the knowledge graph is a kind of graph data, a combination of the GNN and the knowledge graph can be used to solve all types of knowledge graph-related problems. For example, some researchers have modeled the knowledge graph with the GNN (Nathani et al., 2019). The GNN-based approach can adequately capture information on complex and hidden patterns in ternary neighborhoods. It can also achieve the relational complementation of the knowledge graph, in contrast with knowledge-based reasoning that uses individual ternary relationships. A GNN-based entity alignment scheme has been proposed (Cao et al., 2019), and it has been experimentally shown to yield highly consistent data that improve the quality of the knowledge graph on multiple datasets.
In the context of power network topology, a knowledge graph can indicate relationships between entities in the network. The graph neural network can serve as a technical tool for analyzing graph data, mining, and reasoning for relationships among entities in the knowledge graph. It also allows us to consider missing information and determine the correctness of the data, significantly improving the quality of the knowledge graph. Thus, the characteristics of the knowledge graph and the graph neural network are fully compatible with the requirements of topological recognition.
This paper proposes a method of topological identification based on the knowledge graph and the graph neural network. First, we set-up an entity–relationship–entity and entity–attribute/attribute value information triad based on remote signaling data, telemetry data, and a database of component information to construct an informational knowledge base. Second, based on the graph neural network, we determine the relationships that cannot be established owing to conflicting information. Finally, based on knowledge inference, we generate the topology of the power network and track changes in it. The results of tests show that the proposed method is fault tolerant and can accurately determine the network topology of a simulated network as well as a real power grid.
Definition and Structure of Knowledge Graph
Definition of Knowledge Graph
A knowledge graph is a structured semantic knowledge base used to describe concepts and their interrelationships in the physical world in symbolic form. The basic unit is the “entity–relation–entity” triad, and the entity and its associated attribute–value pairs are interconnected through relationships to form a networked knowledge structure.
Based on the above definitions, we can draw the following conclusion:
1) Essentially, the knowledge graph is a semantic network that reveals the relationships between entities.
2) The research value of the knowledge graph lies in the fact that it is a reticular knowledge base built based on data and information. It organizes the information into usable knowledge at minimum cost.
3) The applicative value of the knowledge graph is that it can change the existing method of information retrieval. On the one hand, retrieval is achieved by reasoning. On the other hand, it can graphically display the structured knowledge after classification.
Architecture of the Knowledge Graph
The architecture of the knowledge graph consists of a data layer and a schema layer, as shown in Figure 1. The data layer is toward the logical architecture of the knowledge graph and the schema layer toward its technical architecture. The primary function of the data layer is the extraction of data and information to generate relationships inherent within the latter. The schema layer builds on top of the data layer and is an essential part of processing and analyzing data to generate knowledge, including such means as information fusion and processing, and creating knowledge based on inference.
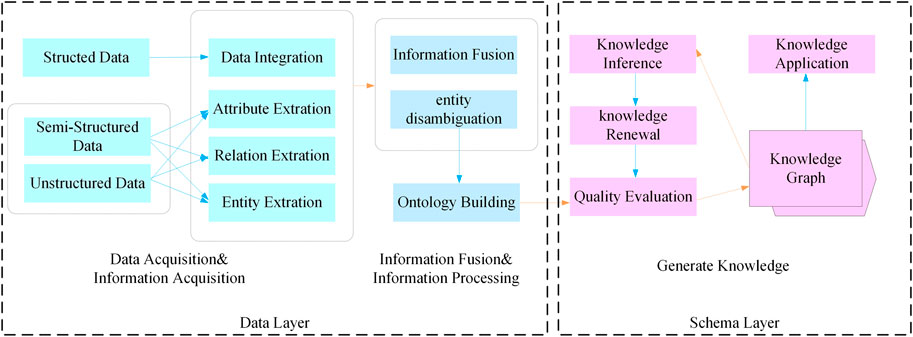
FIGURE 1. The architecture of the knowledge graph.
Methods of Constructing Power Grid Topology-Oriented Knowledge Graphs
The power information system records a large number of structured or semi-structured data. These data are descriptions of the measured attributes and results, and the determined entity attributes. All these data provide the necessary information units to construct knowledge graphs of the topology of the power network.
Methods of Entity–Property Construction
A large number of fields in databases recorded by the power management information system are deconstructed. The measured set of items of entity information O is thus obtained. It contains all information on nodal entities and line entities, given as:
where
The information provided by each entity corresponds to its entity attribute and attribute value. For example, an entity node
The resulting set of properties corresponding to the entity is as follows:
Entity O and attribute V correspond in a one-to-one manner. The expression for entity–attribute Q is as follows:
Methods of Constructing Entity Relationships
Relationships are key to the knowledge graph because they require its use to solve a number of problems. In general, they make it possible to further parse the entity correspondences in the entity information set O, and to organize the entity–relationship information. The expression for the relationship is given as:
where
Methods for Constructing Knowledge Graph Triangles
In this paper, entity–relation–entity and entity–property–attribute (value) are transformed into an integrated entity (attribute–attribute value)–relation–entity (attribute–attribute value) triad to form a knowledge base for generating topologies. The expression is given as:
where G denotes the set of ternary groups, O the set of entities, and each object is unique. V denotes the set of attributes, including the number of nodes and states of line switches, the magnitude of node-injected power, the first-end power of the line, and the line first-end power difference. R denotes the set of relationships of direct correlations between entities.
Graphical Neural Network
Traditional neural networks have had great success in extracting features from spatial Euclidean data, but are deficient in processing non-Euclidean spatial data. In recent years, researchers have learned from the ideas of convolutional networks, cyclic networks, and deep autoencoders. They have used this knowledge to design a neural network structure, called the graph neural network, for processing graph data.
A graph is composed of many vertices and edges, usually represented and stored using an adjacency matrix. The spatial features in graph data have the following characteristics:
1) Node features: Each node has certain features.
2) Structural features: Each node in the graph data has certain structural features.
Thus, there is a connection between pairs of nodes. In general, graph data should consider both node and structural information, and a graph neural network should be able to automatically learn both the characteristics of a node and node-to-node correlation-related information.
GCNs are the first graph-based networks to apply the simple convolution operation to image processing for graph data processing. This paper explains the principles of graph convolutional neural networks mainly from the perspective of spatial construction.
A grid can be substituted with a graph
As shown in Figure 2, we want to convolve node 6, and adjacent to it are nodes 1 and 5 (including node 6 itself); that is
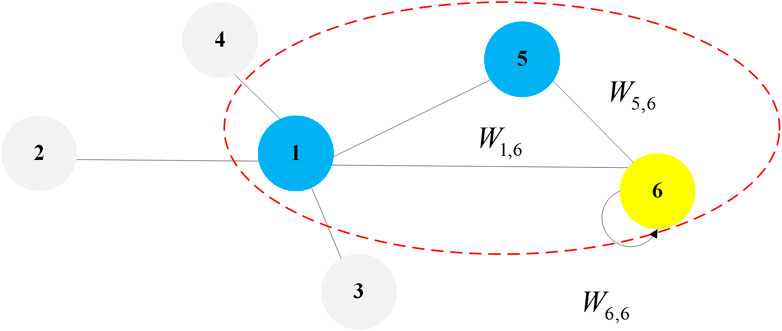
FIGURE 2. Schematic diagram of spatial convolution for node 6.
The input node feature may be a vector with dimensions D. A single convolution operation may contain multiple convolution kernels with dimensions d. We convolve every dimension of the input feature and sum it to obtain the convolution of node
The basic idea of the GCN is to reduce the dimensionality of a node’s high-latitude adjacency information in the graph to a low-dimensional vector representation by aggregating feature-related information from adjacent nodes. It can aggregate the global information of the graph to represent features of the nodes. The process of updating the feature-related information of the node is shown in Figure 3.
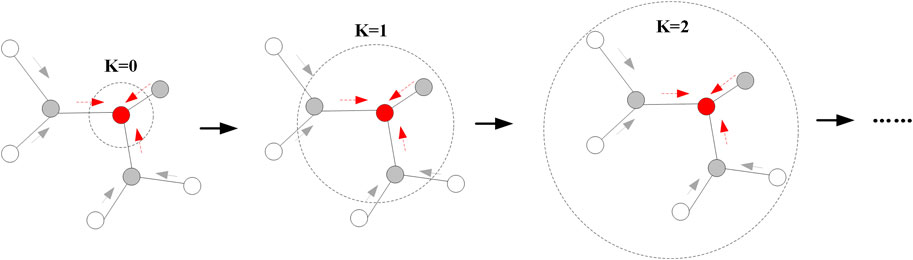
FIGURE 3. Schematic diagram of node feature update based on graph convolutional neural network.
The convolution operator can be defined as (Kipf and Welling, 2017):
where
The matrix form of the above equation is as follows:
The adjacency matrix A does not contain information on the nodes themselves. To solve this problem, given
In short, compared with the basic structure of a neural network, the MLP, the feature matrix multiplied by the weight matrix
The core framework of a graph neural network consists of two matrices: 1) the adjacency matrix A,
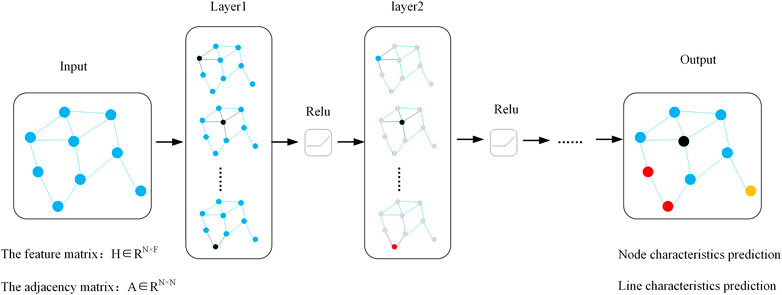
FIGURE 4. Flowchart of graph neural network.
Proposed Method for Identifying Power Network Topology
Constructing Overall Topology of Power Grid
Through information extraction, elements of knowledge such as entities, relations, and properties can be extracted from the original corpus to obtain a series of basic factual expressions.
The relationship between entities can be extended according to knowledge inference. For example, the node Na in the entity information set O directly connects to line Lab, and node Nb in the set is also directly connected to Lab. The relationship can be extended to Na-Lab-Nb. Multiple entity–relation unit elements can form a topology containing all entity–relation information.
Identifying Power Network Topology
The above is not identical to knowledge. To obtain a structured and networked knowledge system, it is necessary to carry out knowledge processing and reasoning. Knowledge processing and knowledge reasoning are the essential means and critical parts of the construction of a knowledge graph. In practice, remote signaling data may be mixed with incorrect information owing to the possible existence of the blade gate relation. Telemetry data may also be combined with errors, such that the resulting data do not comply with the operating rules of the power system. Ambiguity may thus persist within the entity–relation–attribute triad, which is required for the most critical step in topological identification based on the knowledge graph. The authenticity of the entity–relation units is thus verified through the data mining method of graph neural networks.
The main problem in determining power network topology is to identify the connectivity of the lines based on their properties (values). In applying the graph neural network, we use the relationship between entities in the knowledge graph (lines) as “vertices” and the entities (nodes) as “edges.” In this way, the connectivity of lines is directly generated by line training, which helps to avoid the conventional approach of first determining the nodes and then identifying connectivity. The follow chart of the proposed method is shown in Figure 5.
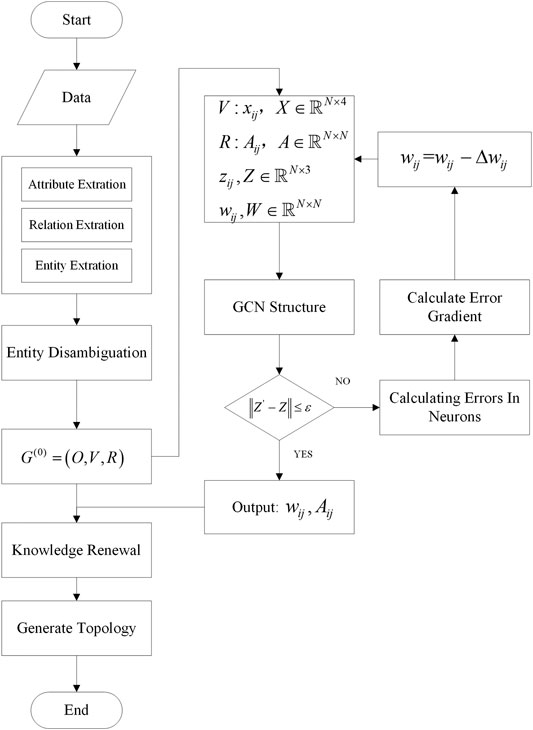
FIGURE 5. The flowchart of the proposed method.
The specific steps are as follows:
Step 1.Extract the attributes and attribute values of edges in the knowledge graph that contain the line input power
Step 2.
Step 3.Define
Step 4.Extract all entity relations of the knowledge graph
Step 5.Set
Step 6.After connectivity determination, update the adjacency matrix
Experiment and Results
Experimental Results on a Test Sample
The IEEE 118-node system containing 186 lines was used for our experiment. The initial active power of the nodes was obtained by the MATPOWER software simulation. We set-up two disconnected lines: 8–30 and 48–49. The lines 17–18, 21–22, 34–36, 76–77, 84–85, 92–100, 105–107, and 114–115 contained conflicting information. The remaining lines were normal. Details of the information in the lines are shown in Table 1. Algorithm 1 shows the overall training and testing processes.
Algortihm 1 | Overall training and testing processInput:
Graph
Output:
Network model , the weight value W, Generate topology
1.Function:
2.Calculating the graph structure G;
3.Normalize input features;
4.Integrate features to get GCN input through G;
5.Integrate features to get corresponding labels.
6.for range of
7.Calculate network through input;
8.Calculate loss through network output and labels;
9.Do backpropagation algorithm through optimizer, update network weight W
10.end
11.Calculate network output;
12.Do anti-normalization for the network output
13.generate topology;
14.Save network model;

TABLE 1. comparison of variables and parameters.
The above sample was selected to demonstrate the effectiveness of the proposed method. We followed the flow of Algorithm 1 in calculating the sample data, and then used the result of the judgment of this sample with the original features of the line. The probability of categorization and the number of line characteristics that determine the presence of conflicting information and “off” lines are shown in Figure 6 and Table 2.

FIGURE 6. Histogram of probability of line determination for a disconnected line or missing information.
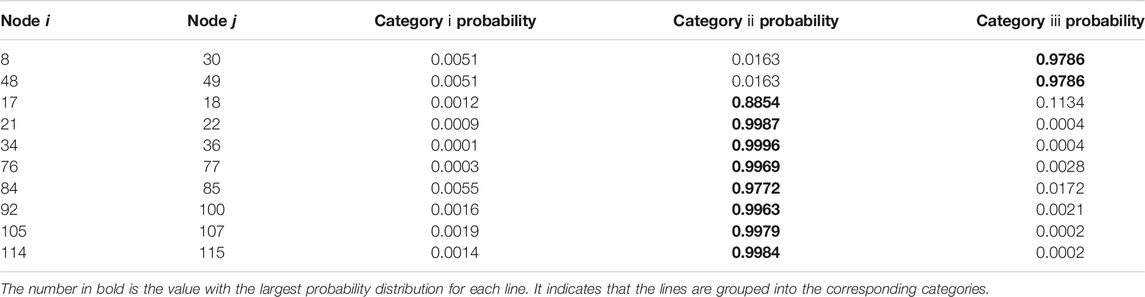
TABLE 2. Probability distribution of the presence of conflicting information and disconnected lines in various classifications.
It is clear that only lines 8–30 and 48–49 had a high probability of falling into category ⅲ in the above diagram. According to the results of training of the graph neural network, these two lines were judged to be disconnected, consistently with the original perturbation.
According to the probability distribution, lines 27–115, 114–115, 68–116, 12, 117, 54–55, 80–81, 75–118, and 76–118 were all judged to be connected but had conflicting information. The results were consistent with the original settings. We updated the knowledge graph based on the above results of identification. A comparison of the results of topological identification is shown in Figure 7.

FIGURE 7. Comparison of results of topological identification.
Experimental Results on the IEEE 118-Node System
We used an IEEE 118-node system containing 186 lines. The initial active power of the nodes was obtained by MATPOWER software simulation. A 1% random error obeying a Gaussian distribution for active node power was mixed in to generate 1,000 training samples. For each sample, two lines were randomly disconnected, and eight lines were made to randomly miss some attribute values. We formed an information base for the topology of the power grid according to the construction of the knowledge graph, and organized the data and relationships in the node, line feature matrix, and adjacency matrix. The feature matrices of 900 training samples were labeled as follows: lines in label category ⅰ represented connected lines, those in label category ⅱ represented lines with conflicting information in the feature matrix despite being related lines, and lines in label category ⅲ represented disconnected lines. One hundred samples were retained as unlabeled samples.
Seven hundred labeled samples were used as input to the graph neural network for training and another 200 were used to compare the ingested topology with the generated topology through the rules learned from the graph neural network.
For each sample, the results of identification of line connectivity could be organized into a 186 × 1 column vector, and the number of dimensions of the matrix of results for 200 samples were 186 × 200. By marking different categories with different colors, a map of the results of connectivity was obtained for all samples. We statistically determined the determinations of the remaining 199 samples. The results are shown in Figure 8.
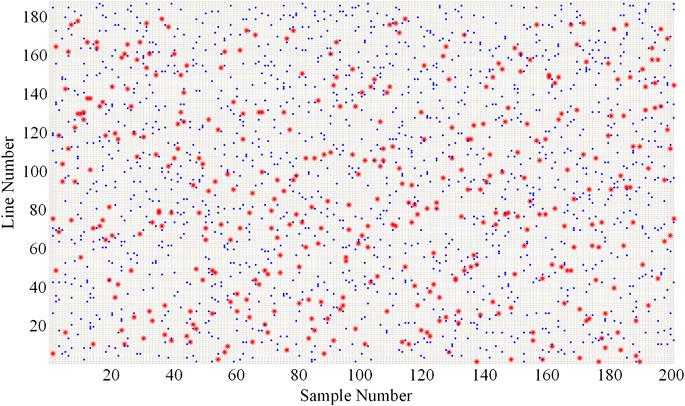
FIGURE 8. Scatter plot of results of identification of test samples.
In the figure above, the abscissa represents the number of test samples and the ordinate the line number. The blue blocks represent lines judged to belong to category ⅱ and the red blocks represent those judged to be in category ⅲ. Each sample contained two category ⅲ lines and eight category ⅱ lines. Compared with the initial topology, the graph neural network method accurately identified the disconnected lines.
By using the rules learned from the graph neural networks, we identified the topologies of the remaining 100 unlabeled samples. The results are shown in Figure 9.

FIGURE 9. Scatter plot of results of identification of unlabeled samples.
As shown in the figure above, we were able to identify the operating status of each line. Each unlabeled sample contained two Category ⅲ lines and eight Category ⅱ lines, which is consistent with the original assumption.
For the samples remaining as labels, the right decision is made to compare the decision results with their original feature quantities, and the results are consistent.
To further verify the proposed method, we selected the above 100 unlabeled samples as test samples. The method used for comparison with the proposed one was a topology identification method based only on knowledge graphs. Both methods are applied to the same data sample.
Each sample contained 184 connected lines and two disconnected lines. Eight of the connected lines were partially missing information. As is shown in Figure 8, the proposed method accurately identified the line connections and determined the classification of each line. We thus determined that there were 18,400 connected lines and 200 disconnected lines in the 100 test samples; 800 of the connected lines had missing partial information, which was consistent with the original settings. The comparison of the results with those of the method for topology identification based only on knowledge mapping is shown in Figure 10.
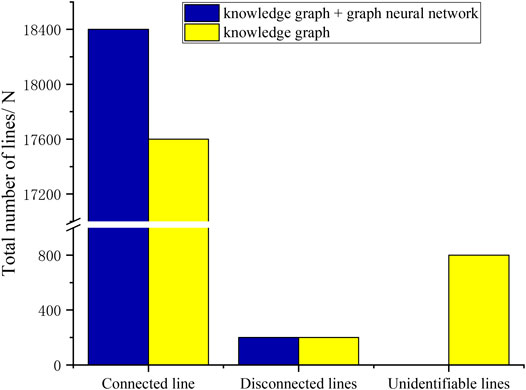
FIGURE 10. Results of topological identification of the two methods.
The method for topology identification based only on knowledge mapping accurately identified disconnected lines, but its accuracy of identifying connected lines was 95.65%. This is mainly because knowledge-based topology identification was less fault tolerant than the proposed method and struggled to deal with missing information.
In summary, the proposed method for topology identification based on a combination of the knowledge graph and the graph neural network can determine the state of line connectivity, identify topological changes, and has strong fault tolerance. Even in the case of conflicting information, it can identify the topology of the power network, and is thus superior to the traditional method of recognition based only on the knowledge graph.
Experimental Results on a Provincial Network
The proposed method was applied to a provincial network consisting of 132 nodes and 181 lines. The data were recorded at intervals of 1 min. We combined the knowledge graphs and the graph neural networks to identify the topology of the power network.
Historical operational data provided a sufficient number of samples to train the graph neural network, thus enabling it to make more accurate decisions. Nevertheless, with increasing numbers of training samples, the number of dimensions of the adjacency matrix A increased from the original N × N to the original
Based on one-month data from the power grid, we found that the provincial network comprised two orphaned network topologies and several isolated nodes. The details are shown in Figure 11.
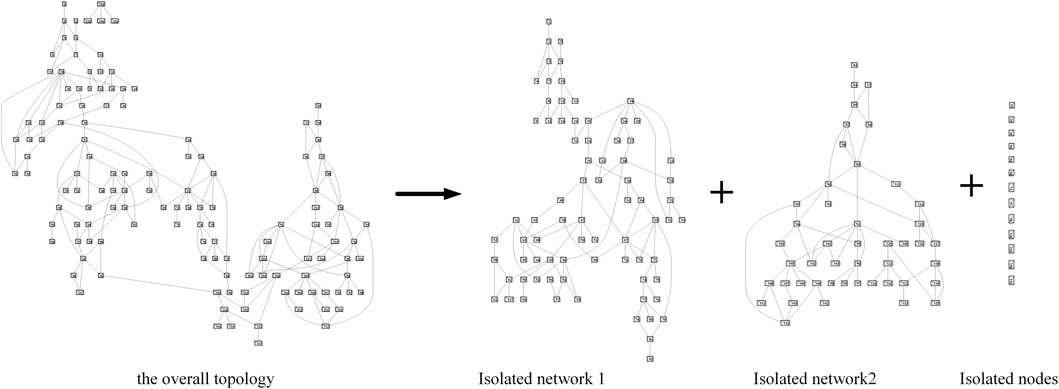
FIGURE 11. Network structure after topology identification.
As shown in Figure 6, the full-time network consisted of 13 remote nodes and two isolated networks, with a total of 119 nodes in continuous operation and 153–155 lines involved. The structural information of the network is shown in Table 3.

TABLE 3. Information on the composition of the network structure.
We verified that 13 of the isolated nodes were planned nodes that had not yet been put into use in the given month, which is consistent with the results of topology identification. Isolated network 1 contained 75 nodes with 94–95 lines in operation, of which lines 28–46, 42–52, and 65–67 had pitching and cutting variations. The remaining lines in isolated network 1 were in stable operation. Isolated network 2 contained 44 nodes and 59–60 lines in operation, of which lines 91–96 and 118–125 had pitching and cutting variations. The number of lines in operation in chronological order in two isolated networks are shown in Figure 12.
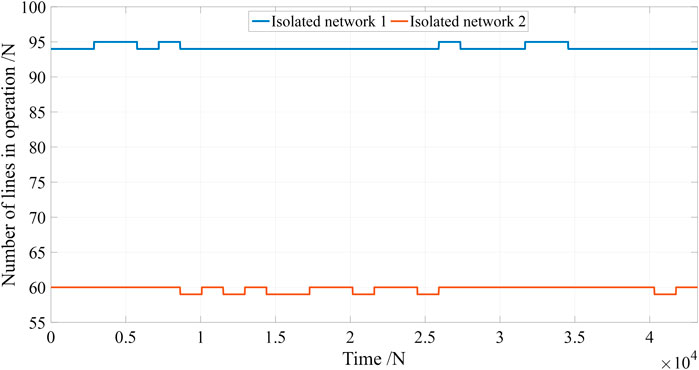
FIGURE 12. Changes in the number of lines in operation on the isolated networks in the time series.
The results show that the proposed method is feasible. It can accurately identify the state of line switching, generate network topology, update the knowledge graph, and improve its quality. It also provides a good basis for analyzing the islanding operation, demodulation control, and the operating state and control of power grids.
Conclusion
The main contribution of this paper is the proposal of a method based on a knowledge graph and a graph neural network. This method transforms the traditional problem of topology identification into one of inferring the state of line connections based on graphical data for topology identification.
The proposed method is distinct from methods that used knowledge graphs only for topology identification because it contains an additional process for inferring conflicting information. After obtaining the overall topology covering all entities in the network, we performed knowledge inference on contradictory information based on graph neural networks. We then determined the line connectivity and updated the entity–relation information in the graph. In this way, we compensated for the deficiency of topological identification based only on the knowledge graph while making substantial gains in identifying topology and tracking changes in it.
We experimentally demonstrated that our proposed method is fault tolerant, unlike traditional methods, and correctly identifies line connectivity even in the case of informational conflicts.
We tested the proposed approach on an operational power grid to show that it can identify network topology, isolated island operations in the network, and can track changes in topology. This can yield valuable information for analyzing power system operations.
The graph neural network expands the training samples using historical data. The dimensionality of the adjacency matrix increases exponentially, which inevitably reduces training efficiency. Optimizing the graph neural network to improve efficiency should be investigated in future work.
Data Availability Statement
The raw data supporting the conclusions of this article will be made available by the authors, without undue reservation.
Author Contributions
CW: Data curation, Writing–Original draft preparation and Writing–Reviewing JA: Conceptualization and Methodology GM: Supervision and Editing.
Funding
This work was supported by the National Natural Science Foundation of China (No. 51877034).
Conflict of Interest
The authors declare that the research was conducted in the absence of any commercial or financial relationships that could be construed as a potential conflict of interest.
References
Cao, Y. X., Liu, Z. Y., Li, C. J., Liu, Z. Y., Li, J. Z., and Chua, T. S. (2019). “Multi-channel graph neural network for entity alignment,” in 57th annual meeting of the association for computational linguistics, Florence, Italy, August 26, 2019 (Stroudsburg, PA: Acl 2019), 1452–1461.
Jing, Y., Wang, J., Wang, W., Wang, L., and Tan, T. (2020). Relational graph neural network for situation recognition. Pattern Recogn. 108, 107544. doi:10.1016/j.patcog.2020.107544
Kipf, T. N., and Welling, M. (2017). “Semi-supervised classification with graph convolutional networks,” in 5th International Conference on Learning Representations, Toulon, France, April 24, 2017–April 26, 2017.
Li, F., Liu, T., and Jiang, D. (2011). Distribution network reconfiguration with multi-objective based on improved immune algorithm. Dianwang Jishu/Power Syst. Technol. 35 (7), 134–138. doi:10.13335/j.1000-3673.pst.2011.07.028
Li, M., Ma, Z., Wang, Y. G., and Zhuang, X. (2020). Fast Haar transforms for graph neural networks. Neural Network. 128, 188–198. doi:10.1016/j.neunet.2020.04.028
Li, Y., Wang, J., Zhao, D., Li, G., and Chen, C. (2018). A two-stage approach for combined heat and power economic emission dispatch: combining multi-objective optimization with integrated decision making. Energy 162, 237–254. doi:10.1016/j.energy.2018.07.200
Li, Y., Yang, Z., Li, G., Zhao, D., and Tian, W. (2019). Optimal scheduling of an isolated microgrid with battery storage considering load and renewable generation uncertainties. IEEE Trans. Ind. Electron. 66 (2), 1565–1575. doi:10.1109/tie.2018.2840498
Liu, D., Zhang, R., Li, B., Yun, Z., Yang, H., and Li, Z. (2019). Research on reverse recognition method of power system topological structure based on state measurement. Zhongguo Dianji Gongcheng Xuebao/Proc. Chin. Soc. Electr. Eng. 39 (24), 7107–7117. doi:10.13334/j.0258-8013.pcsee.182454
Liu, Y., Zhang, N., and Kang, C. (2018). A review on data-driven analysis and optimization of power grid. Dianli Xitong Zidonghua/Autom. Electr. Power Syst. 42 (6), 157–167. doi:10.7500/AEPS20170922003
Liu, Z., and Wang, H. (2018). Retrieval method for defect records of power equipment based on knowledge graph technology. Dianli Xitong Zidonghua/Autom. Electr. Power Syst. 42 (14), 158–164. doi:10.7500/AEPS20180103007
Lourenco, E. M., Coelho, E. P. R., and Pal, B. C. (2015). Topology error and bad data processing in generalized state estimation. IEEE Trans. Power Syst. 30 (6), 3190–3200. doi:10.1109/Tpwrs.2014.2379512
Ma, J., Zhang, Y., Ma, W., and Wang, Z. (2014). Power network topological analysis based on incidence matrix notation method and loop matrix. Dianli Xitong Zidonghua/Autom. Electr. Power Syst. (12), 74–80. doi:10.7500/AEPS20131212003
Nathani, D., Chauhan, J., Sharma, C., and Kaul, M. (2019). “Learning attention-based embeddings for relation prediction in knowledge graphs,” in 57th Annual Meeting of the Association for Computational Linguistics, Florence, Italy, ACL, July 28, 2019–August 2, 2019, (Stroudsburg, PA: Association for Computational Linguistics (ACL)), 4710–4723.
Nian, M., Dong-Yuan, S., and Xian-Zhong, D. J. P. S. T. (2008). A novel method for fast power network topology formation and partial revision based on graph theory. Power Syst. Technol. 32 (13), 35–39.
Nikolentzos, G., Dasoulas, G., and Vazirgiannis, M. (2020). k-hop graph neural networks. Neural Networks 130, 195–205. doi:10.1016/j.neunet.2020.07.008
Park, N., Kan, A., Dong, X. L., Zhao, T., and Faloutsos, C. (2019). Estimating node importance in knowledge graphs using graph neural networks. Proceedings of the 25th Acm Sigkdd International Conferencce on Knowledge Discovery and Data Mining Kdd'19, Anchorage, AK, August 4–8, 2019, (New York, NY: ACM), 596–606.
Song, S.-Q., Zhu, Y.-L., and Yu, H. (2005). A power network topology tracking method based on graph theory and artificial intelligence search technique. Power Syst. Technol. 29 (19), 45–49.
Su, C., Gao, S., and Li, S. (2020). GATE: graph-attention augmented temporal neural network for medication recommendation. IEEE Access 8, 125447–125458. doi:10.1109/Access.2020.3007835
Wang, S., Xu, Q., Zhang, G., and Yu, L. (2009). Modeling of wind speed uncertainty and interval power flow analysis for wind farms. Dianli Xitong Zidonghua/Autom. Electr. Power Syst. 33 (21), 82–86. doi:10.1016/j.apm.2007.10.019
Wang, T., Liu, Y., Gu, X., and Qin, X. (2019). Vulnerable lines identification of power grid based on cascading fault space-time graph. Zhongguo Dianji Gongcheng Xuebao/Proc. Chin. Soc. Electr. Eng. 39 (20), 5962–5972. doi:10.13334/j.0258-8013.pcsee.181730
Wu, B., Liu, Y., Lang, B., and Huang, L. (2018). DGCNN: disordered graph convolutional neural network based on the Gaussian mixture model. Neurocomputing 321, 346–356. doi:10.1016/j.neucom.2018.09.008
Wu, Z., Pi, D., Chen, J., Xie, M., and Cao, J. (2020). Rumor detection based on propagation graph neural network with attention mechanism. Expert Syst. Appl. 158, 113595. doi:10.1016/j.eswa.2020.113595
Xie, Y., Xu, H., Li, J., Yang, C., and Gao, K. (2020). Heterogeneous graph neural networks for noisy few-shot relation classification. Knowl. Base Syst. 194, 105548. doi:10.1016/j.knosys.2020.105548
Yansheng, L., Jing, L. I., Yadi, L., Lingyun, W. U., Qiang, L. I., Jun, Z., et al. (2017). Large power grid topology analysis based on graph partitioning. Power Syst. Prot. Control 45 (23), 108–115. doi:10.7667/PSPC171060
Yu, M., Zhang, Z., Li, X., Yu, J., Gao, J., Liu, Z., et al. (2020). Superposition graph neural network for offshore wind power prediction. Future Generat. Comput. Syst. 113, 145–157. doi:10.1016/j.future.2020.06.024
Zhang, C., Yu, J. J. Q., and Liu, Y. (2019). Spatial-temporal graph attention networks: a deep learning approach for traffic forecasting. IEEE Access 7, 166246–166256. doi:10.1109/Access.2019.2953888
Keywords: knowledge graph, power network, topology identification, graph neural network, knowledge inference
Citation: Wang C, An J and Mu G (2021) Power System Network Topology Identification Based on Knowledge Graph and Graph Neural Network. Front. Energy Res. 8:613331. doi: 10.3389/fenrg.2020.613331
Received: 02 October 2020; Accepted: 21 December 2020;
Published: 17 February 2021.
Edited by:
Chao Long, Cranfield University, United KingdomReviewed by:
Canbing Li, Shanghai Jiao Tong University, ChinaLiang Chen, Nanjing University of Information Science and Technology, China
Copyright © 2021 Wang, An and Mu. This is an open-access article distributed under the terms of the Creative Commons Attribution License (CC BY). The use, distribution or reproduction in other forums is permitted, provided the original author(s) and the copyright owner(s) are credited and that the original publication in this journal is cited, in accordance with accepted academic practice. No use, distribution or reproduction is permitted which does not comply with these terms.
*Correspondence: Jun An, YW5odWlhbmp1bkAxNjMuY29t