 Huijian Huang1
 Chong Chen
 Linfeng Li
 Mingjun Wang
 Suizheng Qiu
- 1Nuclear Power Institute of China, Chengdu, China
- 2Department of Nuclear Science and Technology, Xi’an Jiaotong University, Xi’an, China
Plate-type fuel elements is one of the first fuel structure choice for the novel integrated PWR, however, blisters will appear on the cladding induced by irradiation and fission. In this work CFD method was used to investigate the subcooled boiling characteristic of the water in rectangle channel with round and pillow blisters, the modified RPI model was also proposed, we can draw conclusions as follows: In the channel with round blister, as the blisters will increase the local flow resistance and more fluid will flow through center of the channel. Boiling occurred only in the area near the edges, nearly no vapor appeared at the center of the channel. The boiling region in channel with pillow shape blisters is wider and concentrated between two pillow blisters and downstream of the non-blisters side. The dry out area are both in the downstream region of blisters for the two types of channels.
Introduction
Plate-type fuel elements is one of the first fuel structure choice for the novel integrated pressurized water reactor. Two kinds of fuel pellets had been used for plate-type fuel elements currently, monolithic fuel and dispersion fuel. The above two plate-type fuel elements do not contain air gaps, the fuel pellet and the cladding are contact directly.
In recent years, many experiments had been conduct to investigate the thermal hydraulic characteristics of plate-type fuel elements, including heat transfer characteristics (Lee and Lee, 2001; Wang et al., 2014a; Chen et al., 2015), subcooled boiling characteristics (Li et al., 2013; Wang et al., 2014b; Al-Yahia and Jo, 2017; Song et al., 2017) and critical heat flux (Debortoli et al., 1958; Sudo et al., 1985).
Li et al. (Li et al., 2013) studied the boiling characteristic of water in narrow rectangular channel at atmospheric pressure. The flow rate is 304.1–760.2 kg m−2 s−1, and the inlet temperature is 54.2–86.9°C. They found that the bubble will slide along the wall and two types of sliding bubbles was observed in the experiment. The first type has a short life, and the volume changes rapidly due to rapid evaporation and condensation; the second type of bubble has a long life and slow growth rate. Sudo et al. (Sudo et al., 1985) conducted experiments on 2.25 and 2.80 mm narrow channels for jrr-3 research reactor. The results show that the critical heat flux increases with the mass flow rate, and the inlet subcooling has little effect on CHF when the dimensionless mass flow rate is less than 100.
The behaviors of the plate-type fuel elements in actual operation show that the blisters will be formed on the cladding under irradiation and fission (Dienst et al., 1977; Meyer et al., 2012). On one hand, affected by neutron irradiation, the properties of the cladding material will be changed. On the other hand, fission gas will be released and accumulate in the fuel pellets. The increased gas pressure would cause blistering deformation of the cladding. Li et al. (Li et al., 2019) studied the heat transfer characteristics in single and parallel channels after formation of blisters, the result show that high temperature areas and large temperature gradients will appear, the distribution of heat flux on the surface is not uniform. Under the influence of the blister, vapor will gather at some stagnation areas, which would result in local high void fraction. The high void fraction near the wall affects the heat transfer seriously and the dry out spots will be produced, which may burn out the fuel assembly.
It is difficult to capture the local characteristics of two-phase flow accurately by experimental methods. In recent years, CFD method is widely used in two-phase flow (Chen et al., 2019; Khan et al., 2020; Wang et al., 2021). However, there are no recognized models that can be widely used in various conditions.
Koncar and krepper (Koncar and Krepper, 2008) simulated the subcooled boiling of R-113 in a circular tube, the void fraction, turbulent kinetic energy and liquid temperature on a cross section had been investigate. The simulation results in most working conditions were in good agreement with the experiment. GU et al. (Gu et al., 2017) simulated subcooled boiling characteristic at high pressure (11–15 MPa) using different nucleation site density and bubble departure diameter models, a set of recommendation models are obtained. Lucas (Liao et al., 2018; Liao et al., 2019) proposed a baseline model and establish a set of benchmark model to calculate the two-phase flow.
In present work, CFD method was used to investigate the subcooled boiling characteristic in rectangle channel with round and pillow blisters. The effect of the blisters for mass flow rate, temperature and void fraction in different conditions had also been analyzed.
Numerical Models
Governing Equation
In this section, the Euler-Euler multiphase model was used to investigate the boiling process, and the mass, momentum and energy equations of the two phases were shown as follows.
Continuity Equation
1) Vapor Phase
Where
2) Liquid Phase
Where
Momentum Conservation Equation
1) Vapor Phase
Where p is the pressure/Pa,
2) Liquid Phase
Where
Energy Conservation Equation
1) Vapor Phase
Where
2) Liquid Phase
Where
For the multiphase flow system where only vapor phase and liquid phase exist, the volume fraction of vapor and liquid phase satisfies the following equation:
Interphase Momentum Transfer
The interphase momentum transfer of bubbles dispersed in the liquid could be expressed as:
Where
Drag Force Model
The drag force exerted by the liquid phase on the vapor phase per unit volume can be expressed as:
The drag force coefficient
Lift Force Model
Due to the non uniformity of flow, the liquid velocity on the direction perpendicular to the bulk flow will exist velocity gradient inevitably, bubbles dispersed in the liquid will be influenced by lift force. The direction of lift force is perpendicular to the relative velocity between vapor and liquid, which can be calculated as Eq. 10.
Where CLis lift force coefficient.
In present work, Moraga model (Moraga et al., 1999) was selected to calculate the lift force, and the lift coefficient is calculated as follows:
Where
Turbulent Dispersion Force
The dispersion effect of turbulent flow on the dispersed vapor phase is usually described by the turbulent dispersion force which mainly depends on the volume fraction gradient of vapor. Burns et al. (Burns et al., 2004) consider that turbulent dispersion force was caused by liquid phase vortices which caused by interfacial drag, so the turbulent dispersion force was calculated as:
Where CTD is turbulent dispersion force coefficient with value of 1.0,
Wall Lubrication Force
The wall lubrication force is calculated as:
Where
Where C1 and C2 are infinite constants, which are −0.01 and 0.05 respectively, yw is the distance from the wall.
Interphase Energy Transfer
When the bubbles departure from the heating wall and enter the subcooled bulk flow region, the heat transfer between the subcooled fluid and the interface for unit volume can be expressed as:
Where
Where
Db is the bubble diameter, in this work, the improved model of Anglart and Nylund were adopt. It is considered that when the fluid undercooling is higher than
Where d0 = 0.0001 m; d1 = 0.0015 m;
Based on the literature (Ansys, 2013), Nul can be expressed as:
The heat transfer between the vapor phase and interface for unit volume can be calculated as:
Where
Interphase Mass Transfer
For flow boiling, the interphase mass transfer include two processes: evaporation of liquid phase near the heated wall and mass transfer between vapor and liquid phase in bulk flow. During heating process, the superheated liquid layer near the wall will evaporate and generate bubbles. The evaporation rate of the liquid phase near the wall is calculated as:
Where hfg is latent heat of liquid, cp,l is specific heat capacity of the liquid at constant pressure, qe is heat flux of evaporation.
The mass transfer rate in bulk flow depends on the temperature difference between two phases. When the liquid is subcooled, the vapor phase will condense. And when the liquid temperature is higher than the saturation temperature, the liquid will evaporate.
The mass transfer rate from liquid phase to vapor of per unit volume can be expressed by:
The mass transfer condensation rate from vapor phase to liquid of per unit volume is calculated by:
Wall Boiling Model
Rensselaer Polytechnic Institute (RPI) wall boiling model (Kurul and Podowski, 1990) was a common method to describe near-wall boiling behavior. In this model the total heat flux could be divided into the following three parts:
1) Forced convection heat flux of liquid, qc;
2) The heat flux of evaporation induced by continuous evaporation of liquid near the wall, qe;
3) The quenching heat flux carried away by the subcooled liquid after bubble detaching from nucleation point on the wall, qq.
Therefore, the total heat flux on the wall can be expressed as:
In present work, to investigate the dry out phenomenon, a modified model had been proposed. Convective heat flux of vapor was added to the RPI wall boiling model, the total heat flux can be expressed as:
Where
Where
Convective Heat Flux of Liquid
The forced convective heat flux of single-phase liquid can be calculated as:
Where
The heating area can be divided into two parts: the affected area of nuclear boiling and the area affected by convective heat transfer of liquid. The heating wall is only affected by these two mechanisms and no overlapping area exists. Therefore, these two parts meet the normalization requirements:
Del Valle and Kenning (Del Valle and Kenning, 1985) assumes that every bubble generated at the nucleation site have the same diameter, which is equal to the bubble departure diameter dw, and the distance between any two bubbles were greater than the bubble diameter, influence area of nuclear boiling can be written as:
Where
Evaporative Heat Flux
The heat flux used for evaporation can be expressed as:
Where
Where dw is the departure diameter which depends on the force balance in the process of bubble growth. The bubble departure diameter can be obtained by analyzing the bubble force or by the experimental data. In this paper, the bubble departure diameter is calculated by Tolubinsky et al. (Krepper and Rzehak, 2011):
Where
In this paper, the nucleate site density
Where C = 210; n = 1.805;
Where
Quenching Heat Flux
Quenching heat flux is the cyclic averaged transient energy transfer related to liquid filling the wall vicinity after bubble detachment, The quenching heat flux is expressed as:
Convective Heat Flux of Vapor
The convective heat flux of vapor was calculated as follows:
Where hv is the convective heat transfer coefficient, it determined by the wall function.
Numerical Methods
Geometry Model
The fuel element and fluid channel studied in present work are choosed according to the general test reactor (Jo et al., 2014), it include two types: 1) the large plate used in the real reactor, its size is 2 mm × 60 mm × 600 mm, the channel gap is 2.5 mm; 2) The small plate used in the RERTR irradiation experiment (Meyer et al., 2012), its size is 1.27 mm × 25.4 mm × 101.47 mm, the channel gap is also 2.5 mm.
Under the guidance of RERTR (Research reactor low concentration Program), Argonne National Laboratory has carried out a series of experimental studies on the performance of plate fuel elements (Meyer et al., 2012). Based the results, the blisters could be classified into two types, the first type occurs at low burnup (low irradiation), the blisters are usually round shape and small (less than 0.17 cm2). and it usually appears at the edge of the pellet. The second type occurs under high burnup (high irradiation), the blisters are usually pillow shaped which caused by the merging of small blisters. The size of the pillow blisters ranges from 1 to 6 cm2. The position of pillow blisters also starts from the edge of the pellet and expands to the interface of the pellet and the cladding. The above two types are considered in present work.
Round Blisters
The round blisters were shown in Figure 1, its diameter is 5 mm, and the projection diameter is 4 mm, the height is 1 mm. 112 blisters were formed on each side of the channel, which was divided into two columns. There were 56 blisters in each row. The blisters formed on both sides of the channel were assumed to be the same, correspond to each other.
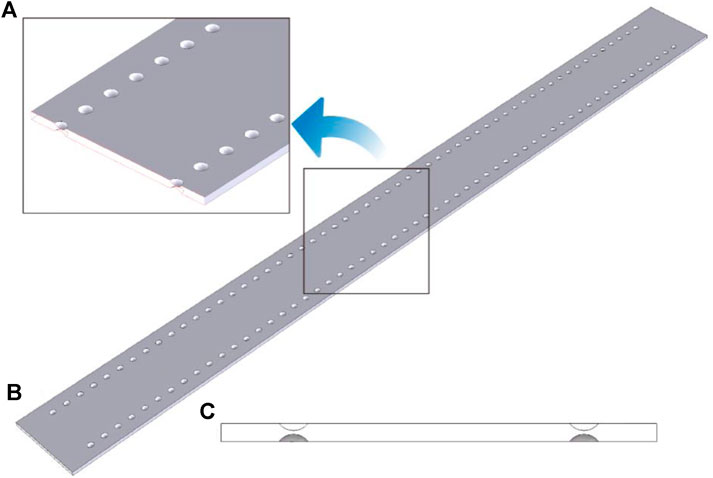
FIGURE 1. The geometric model of round blisters in a single channel. (A) Partial magnification (B) Global geometric (C) cross section.
Pillow Blisters
Pillow blisters occur on the small plate which was shown in Figure 2. The projection area of pillow blister is 9.5 mm × 25 mm rounded rectangle, and the height is 1 mm. Two pillow-shaped blisters were formed on each side of the channel and arranged side by side along the flow direction, the interval between two blisters were 32 mm. The pillow blisters also formed on both sides of the channel, resulting in the 2 mm blockage in the center of the channel, the gap of flow channel is 0.5 mm.
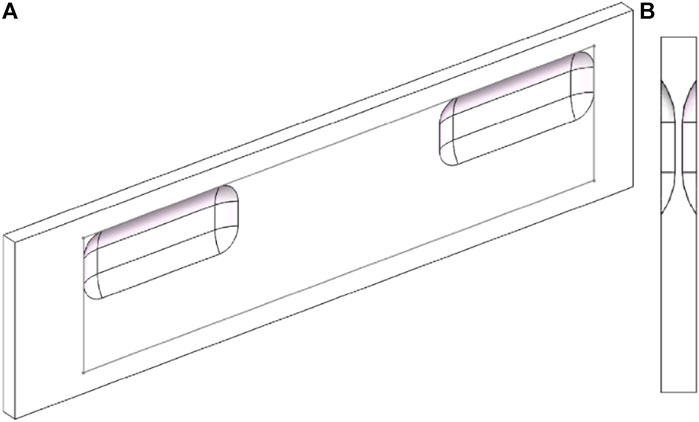
FIGURE 2. The geometric model of pillow blisters. (A) Global geometric (B) Cross section.
Mesh Model
As more equations were needed to be solved compared to single phase flow, the unstructured tetrahedral mesh used in single-phase calculation are not suitable for boiling simulation. So in this work, the hexahedral mesh were used for the channel with blisters.
For the channel with round blisters, due to the array nature of geometry, mesh replication array is also used. The mesh was shown in Figure 3, seven layers of mesh are arranged in the gap direction, and the mesh size in the width and length direction is equal to that in the gap direction. Based on mesh sensitivity analysis, the total number of mesh is about two million, the mesh quality is above 0.6 and the maximum aspect ratio is 6.6.
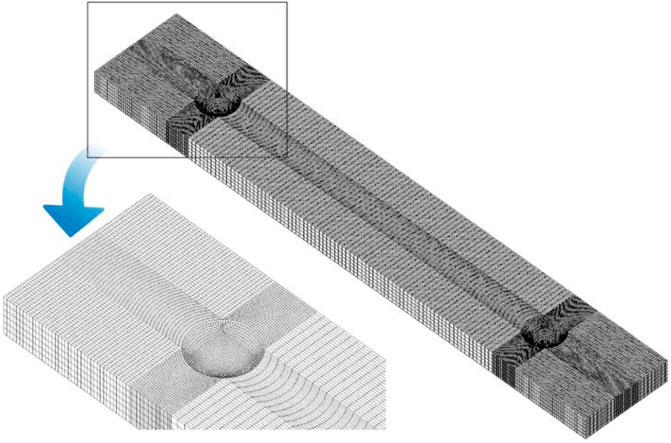
FIGURE 3. Mesh of channel with round blisters.
For the channel with pillow blisters, the trimmed mesh was used. As shown in Figure 4. Through this method, the mesh on the surface with large curvature could be divided into small meshes, thus it could capture the surface structure better. Like the channel with round blisters, seven layers of mesh were arranged in the gap direction, and the mesh size in the width and length direction is the same as that in the gap direction. Based on mesh sensitivity analysis, the total mesh is about 140,000, the mesh quality is more than 0.3, and the maximum aspect ratio is 14.9.
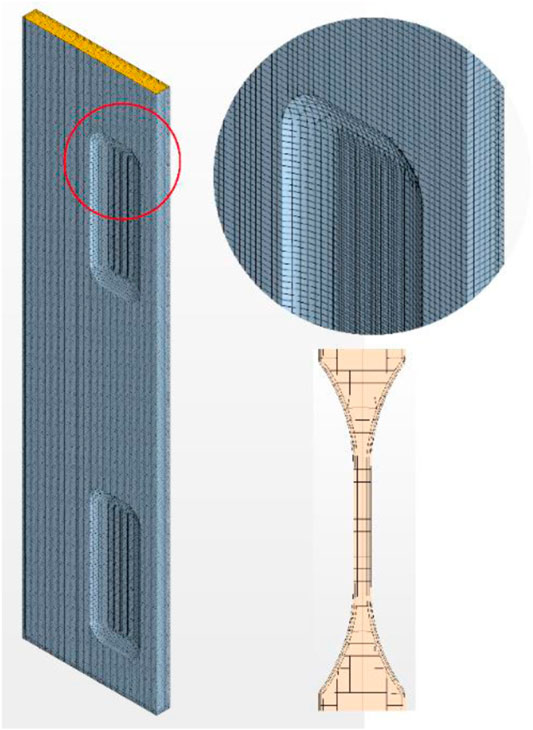
FIGURE 4. The single-channel pillow bubbling deformation mesh.
Boundary Conditions
The boundary conditions are shown in Table 1. In present work, the solid region (pellet and cladding) and the gas cavity formed by fission gas are not considered, and the boundary conditions of solid wall are set according to literature (Li et al., 2019). The velocity inlet was used in this work, the water with high subcooling enters the channel and the volume fraction of the vapor is 0, the velocity of the liquid was 1.5 m/s. The pressure outlet was used and the pressure is 1.0 Mpa. The side wall is the adiabatic and non-slip wall.
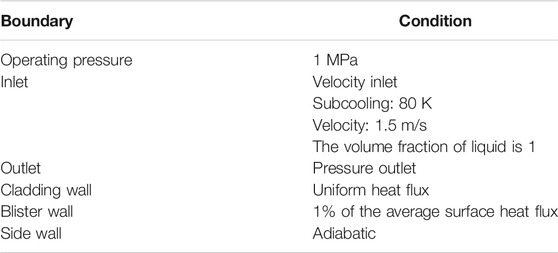
TABLE 1. The boundary conditions for deformation channel.
Uniform heat flux was applied in the wall of cladding and blister. The initial heat flux was calculated according to Jens-Lottes formula. Then the heat flux was increased gradually with 0.5 MW/m2 as step size.
As the heat flux is greatly reduced by the existence of the gas cavity, so the heat flux at the blasters was assumed to be about 1% of that in other cladding areas.
Results and Discussion
According to the single-phase calculation results, the flow will be influenced by blisters in the plate-type fuel channels, the scouring action of fluid at the front of blisters may enhance the heat transfer and the flow separation at the trailing edge of blisters may result in a local stagnation area. Vapor will accumulate in the stagnation region which could reduce the heat transfer characteristic. In this section, the heat transfer characteristics for two different channels were analyzed firstly, then sensitivity analysis of different parameters was carried out. The operation conditions were shown in Table2.
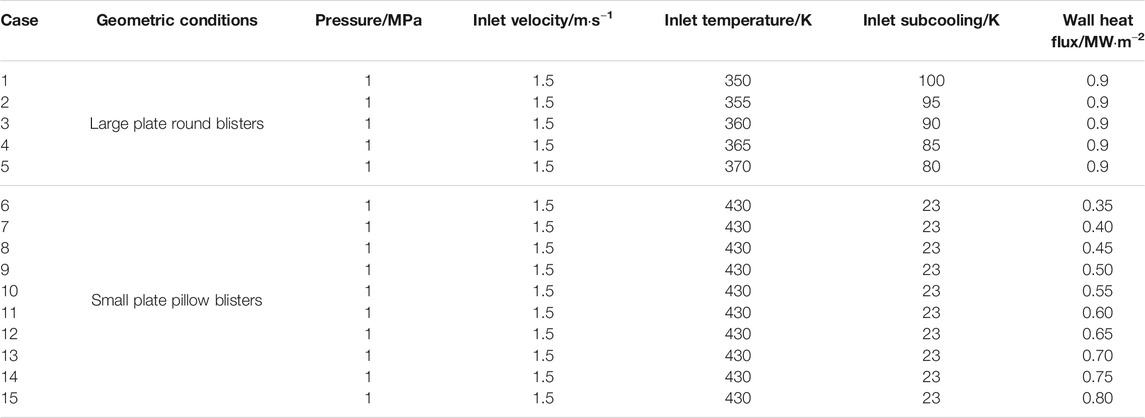
TABLE 2. Operating conditions simulated in this study.
The Round Blisters
The overall boiling phenomenon in the channel depends on evaporation rate and transportation of the vapor phase. In the following, we will first present the void fraction distribution in the channel, which gives the reader an intuitive impression of the boiling region. Then, Wall Temperature discusses wall temperature distribution which is directly related to evaporation heat flux (in the RPI model) and to evaporation rate in Eq. 21. Following that, Flow Distribution Across the Channel analyses the flow distribution in the cross-section of the channel, which explains the uneven distribution of boiling region. Lastly, high-void-fraction region where dryout occurs is closely examined.
Void Fraction Distribution
Firstly case1-case5 were calculated. For these cases, the heat flux was large, subcooled boiling occurred closed to the outlet. The void fraction of the channel was shown in Figure 5. We can see that boiling occurred only in the area affected by the blisters, that is, near the edges of the channel. At the onset of nucleate boiling (the 46th row of blisters in Figure 5), vapor mainly appeared on the front walls of the blisters. As the increasing of void fraction, the high void fraction regions appeared at the rear edge of the blisters (54th row). The local void fraction almost reached 1.0 near the 55th and 56th rows of blisters. It suggested that dry out may occur more easily at the trailing edge of the blisters, and cladding will be burnout more easily in this region.
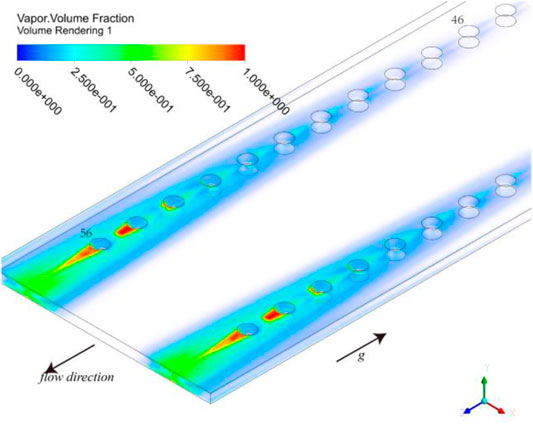
FIGURE 5. Void fraction distribution of channels for case5.
We can also see from Figure 5 that no boiling occurred at the center of the channel. Although uniform heat flux conditions were applied to the entire wall, boiling phenomenon in the center of the channel was different from that on the edge of the channel. This indicates that blisters may have an important influence on the flow rate, so it may affect the initiation and development of boiling.
Wall Temperature
Figure 6 shows the temperature distribution of the cladding surface. We can see that the superheat of the cladding surface was mostly about 15 K, but the temperature in the middle of the fuel plate was lower. Due to the thermal resistance of the internal air, the heat derived from the blisters was less than that from other area, so the temperature was also lower. And the temperature of most blisters surface was lower than the saturation temperature (453 K) at the operating pressure (1 MPa) except for the dry out area.
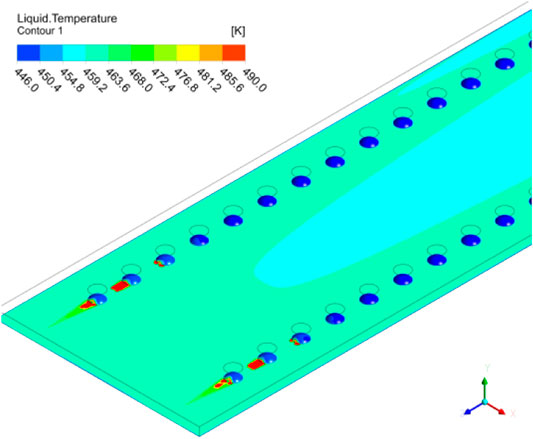
FIGURE 6. Temperature of cladding for case 5.
Flow Distribution Across the Channel
As shown in Figure 7B, the cross sections were divided into three parts in the width direction, the mass flow in each part were shown in Figure 7A. The blisters in the channel will increase the local flow resistance and reduce the mass flow rate greatly in the blister region, so more fluid will flow through center of the channel. As the decrease of mass flow rate in the blister regions, the heat transfer ability will be weakened, the temperature in these regions was higher.
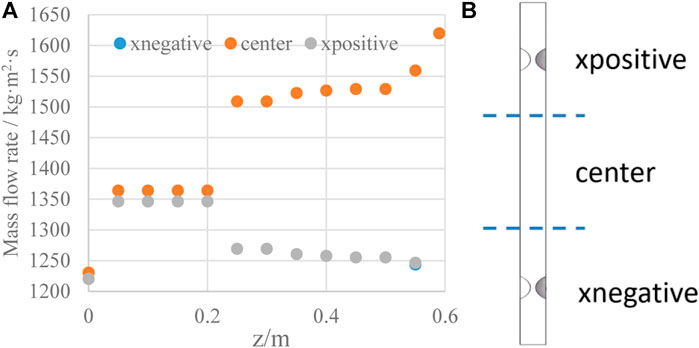
FIGURE 7. Mass flow rate distribution in the cross section of round blister channel.
As water flowing through a row of blisters, the velocity and heat transfer coefficient will change periodically, which may result in different phenomenon for the leading and trailing edges of the blisters.
Figure 8 shows the bulk velocity at different cross sections along the flow direction. After flowing through the first row of blisters, a stagnation area will appear at the trailing edge of the blisters (32 and 42 mm). We can see from the figure of 33–38 mm, there was a low-velocity region near the wall, and the temperature in this region will increase faster along the flow direction. Therefore, boiling is more likely to occur before reaching the next blister (front of blisters). After flowing through the blister, the transverse flow will eliminate the local high temperature of the fluid. So, the onset of nucleate boiling usually occurred at the front of blisters (e.g., 46th row of blisters in Figure 5).
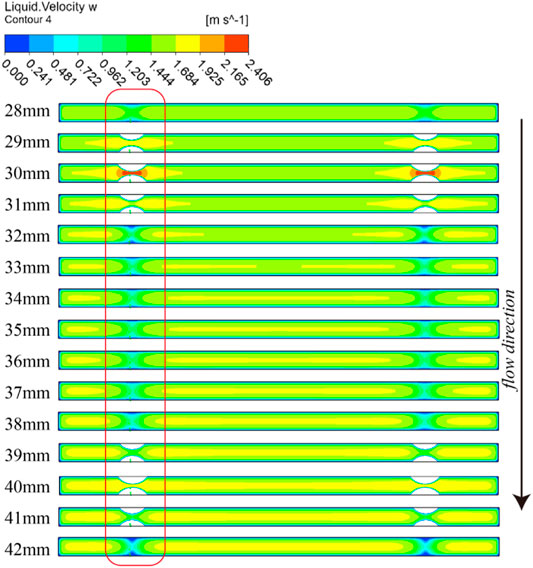
FIGURE 8. Velocity of liquid phase on different cross-sections channel (number on the left marked positions of cross-sections).
Stagnation and Dryout
Figure 9 shows the blisters temperature and the streamline near the 54th row of blisters. We can see that the temperature at the back of blisters is very high and the dry out will also appear in this region. It can be concluded that the backflow and stagnation may be the main reasons for the deterioration of local flow heat transfer, which lead to the local dry out.
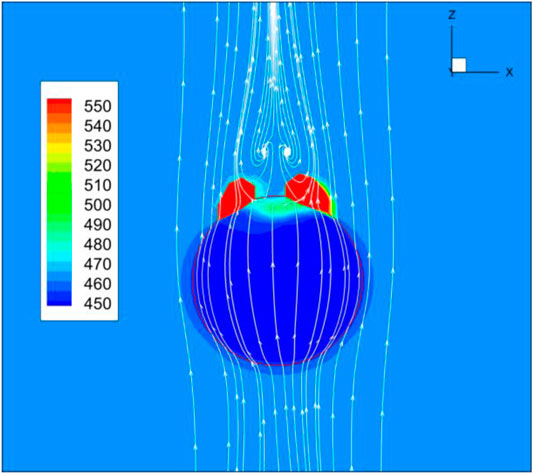
FIGURE 9. The temperature and wall streamline of the 54th row of blisters for case 5.
Pillow Blisters
The void fraction calculated from case 6–15 were shown in Figure 10. In case 6, the heat flux of the wall is 0.35 MW/m2, and boiling begins to occurring at this condition. Boiling first occurs in regions between two pillow blisters, and then disappears after entering the downstream of blisters. In case 7 (0.40 MW/m2), vapor will also appear in the downstream of the non-blisters side except regions between two pillow blisters. For the case 8–15 (0.45–0.75 MW/m2), the regions of boiling are nearly the same. The vapor mostly concentrated in two regions: the region between two pillow blisters and downstream of the channel without blisters. With the increasing of heat flux, the region of boiling will increase gradually. In case 15 (0.80 MW/m2), the maximum void fraction on the wall is more than 0.9 and local dry out occurs.
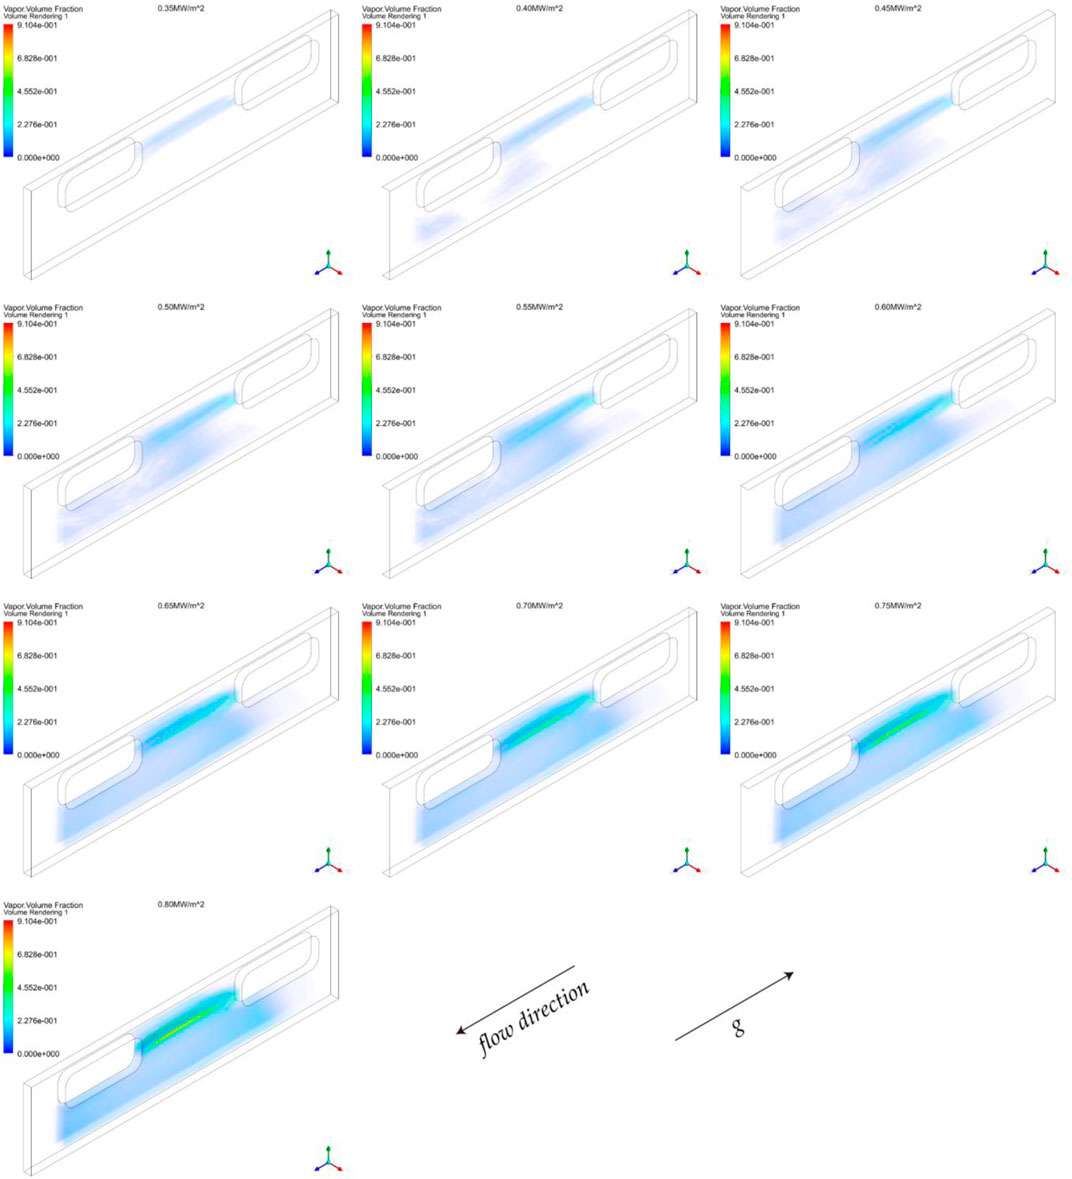
FIGURE 10. Void fraction in channel with pillow-like blisters.
The temperature of the cladding surface in case15 was shown in Figure 11. It can be seen that the temperature in regions between two pillow blisters is higher. Especially for the region with void fraction higher than 0.9, the local dry out occurs and the temperature is more than 500 K. Due to the accumulation of vapor, convection heat transfer of vapor phase will increase, the overall heat transfer coefficient reduce greatly compared with other regions, so that the temperature will rise sharply.
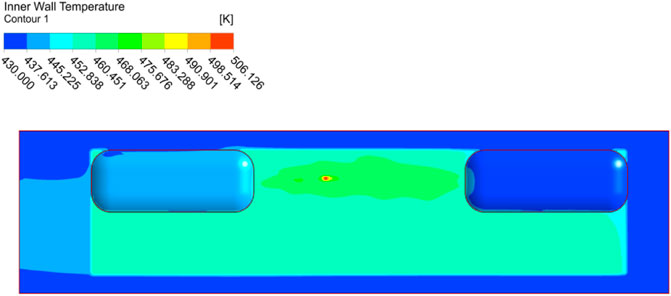
FIGURE 11. Temperature distribution of cladding with pillow-like blisters.
As shown in Figure 12B, the cross sections were divided into two parts in the Y direction, in which the +y half of the channel has blisters and the –y half has no blisters. The mass flow rate and average void fraction along the flow direction were shown in Figure 12A. Under the influence of pillow-blisters, more fluid will flow through the non-blisters side, the flow rate in the +y half will decrease. And more vapor will be generated in the region with pillow blisters. As the lower velocity and higher heat flux in downstream region of the blisters, there is a higher risk of dryout. This is consistent with the result in Figure 10.
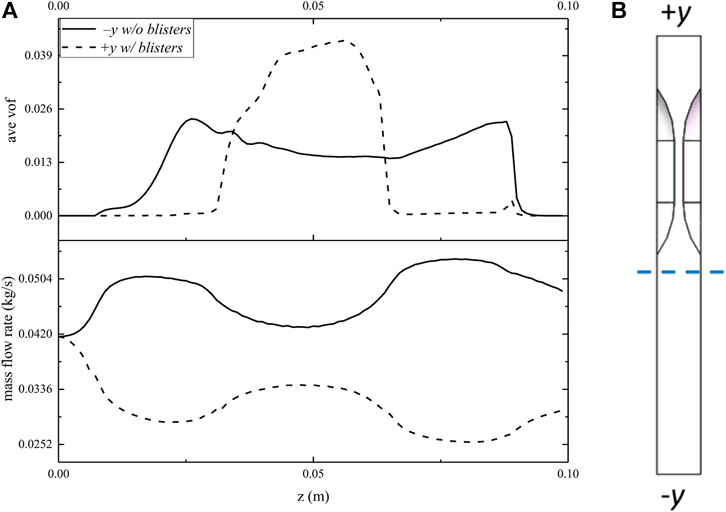
FIGURE 12. Average void fraction and flow rate in cross section.
Compared with the round blisters, the boiling region of pillow-blisters is wider. However, the dry out area for channel with pillow-blisters and round blisters are consistent, both in the downstream region of blisters.
Conclusion
In present work, the subcooled boiling characteristic had been investigated for the rectangle channel with round and pillow blisters, mass flow rate, temperature and void fraction for different conditions had also been analyzed, we can draw conclusions as follows:
1) For round blisters, boiling starts at the front edge of the blisters, however, for pillow blisters, boiling starts at the downstream region;
2) For the channel with round blister, the blisters will increase the local flow resistance and more fluid will flow through center of the channel;
3) For round blister channel, boiling occurred only in the area near the edges, no boiling occurred at the center of the channel;
4) The boiling region of pillow-blisters is wider and concentrated in the region between two pillow blisters and the downstream of the non-blisters side;
5) The dry out area for channel with pillow-blisters and round blisters are both in the downstream region of blisters.
Data Availability Statement
The original contributions presented in the study are included in the article/Supplementary Material, further inquiries can be directed to the corresponding author.
Author Contributions
YL and HH contributed to conception and design of the study. CC wrote the first draft of the manuscript. LuL and LiL organized the database. HY performed the statistical analysis. MW and SQ sections of the manuscript. All authors contributed to manuscript revision, read, and approved the submitted version.
Conflict of Interest
HH, CC, LuL, YL, and HY was employed by the company Nuclear Power Institute of China.
The remaining authors declare that the research was conducted in the absence of any commercial or financial relationships that could be construed as a potential conflict of interest.
References
Al-Yahia, O. S., and Jo, D. (2017). Onset of Nucleate Boiling for Subcooled Flow through a One-Side Heated Narrow Rectangular Channel. Ann. Nucl. Energ. 109 (1), 30–40. doi:10.1016/j.anucene.2017.05.014
Antal, S. P., Lahey, R. T., and Flaherty, J. E. (1991). Analysis of Phase Distribution in Fully Developed Laminar Bubbly Two-phase Flow. Int. J. Multiphase Flow 17 (5), 635–652. doi:10.1016/0301-9322(91)90029-3
Burns, A., Frank, T., Hamill, I., and Shi, J. M. (2004). “The Favre Averaged Drag Model for Turbulent Dispersion in Eulerian Multi-phase Flows,” in 5th International Conference on Multiphase Flow. (ICMF’04), 392.
Chen, C., Gao, P.-z., Tan, S.-c., Chen, H.-y., and Chen, X.-b. (2015). Forced Convective Boiling Heat Transfer of Water in Vertical Rectangular Narrow Channel. Nucl. Eng. Des. 291 (1), 133–144. doi:10.1016/j.nucengdes.2015.05.012
Chen, C., Wang, M., Zhao, X., Ju, H., Wang, X., Tian, W., et al. (2019). Numerical Study on the Single Bubble Rising Behaviors under Rolling Conditions. Nucl. Eng. Des. 349, 183–192. doi:10.1016/j.nucengdes.2019.04.039
Cole, R. (1960). A Photographic Study of Pool Boiling in the Region of the Critical Heat Flux. Aiche J. 6 (4), 533–538. doi:10.1002/aic.690060405
Debortoli, R. A., Green, S. J., Letourneau, B. W., Troy, M., and Weiss, A. (1958). Forced-convection Heat Transfer Burnout Studies for Water in Rectangular Channels and Round Tubes at Pressures above 500 psiaWAPD-188 [R]. Westinghouse Electric Corporation.
Del Valle, V. H., and Kenning, D. B. R. (1985). Subcooled Flow Boiling at High Heat Flux. Int. J. Heat Mass Transfer 28 (10), 1907–1920. doi:10.1016/0017-9310(85)90213-3
Dienst, W., Nazaré, S., and Thümmler, F. (1977). Irradiation Behaviour of UAlx-Al Dispersion Fuels for thermal High Flux Reactors. J. Nucl. Mater. 64 (1), 1–13. doi:10.1016/0022-3115(77)90002-2
Gu, J., Wang, Q., Wu, Y., Lyu, J., Li, S., and Yao, W. (2017). Modeling of Subcooled Boiling by Extending the RPI wall Boiling Model to Ultra-high Pressure Conditions. Appl. Therm. Eng. 124, 571–584. doi:10.1016/j.applthermaleng.2017.06.017
Jo, D., Park, J., and Chae, H. (2014). Development of thermal Hydraulic and Margin Analysis Code for Steady State Forced and Natural Convective Cooling of Plate Type Fuel Research Reactors. Prog. Nucl. Energ. 71, 39–51. doi:10.1016/j.pnucene.2013.11.006
Khan, I., Wang, M., Zhang, Y., Tian, W., Su, G., and Qiu, S. (2020). Two-phase Bubbly Flow Simulation Using CFD Method: A Review of Models for Interfacial Forces. Prog. Nucl. Energ. 125, 103360. doi:10.1016/j.pnucene.2020.103360
Koncar, B., and Krepper, E. (2008). CFD Simulation of Convective Flow Boiling of Refrigerant in a Vertical Annulus [J]. Nucl. Eng. Des. 238 (3), 693–706. doi:10.1016/j.nucengdes.2007.02.035
Krepper, E., and Rzehak, R. (2011). CFD for Subcooled Flow Boiling: Simulation of DEBORA Experiments. Nucl. Eng. Des. 241 (9), 3851–3866. doi:10.1016/j.nucengdes.2011.07.003
Kurul, N., and Podowski, M. Z. (1990). “Multidimensional Effects in Forced Convection Sub Cooled Boiling,” in Proceedings of the International Heat Transfer Conference. (Jerusalem, Israel: Begell). doi:10.1615/ihtc9.40
Lee, H. J., and Lee, S. Y. (2001). Heat Transfer Correlation for Boiling Flows in Small Rectangular Horizontal Channels with Low Aspect Ratios. Int. J. Multiphase Flow 27 (12), 2043–2062. doi:10.1016/s0301-9322(01)00054-4
Li, L., Fang, D., Zhang, D., Wang, M., Tian, W., Su, G., et al. (2019). Flow and Heat Transfer Characteristics in Plate-type Fuel Channels after Formation of Blisters on Fuel Elements. Ann. Nucl. Energ. 134, 284–298. doi:10.1016/j.anucene.2019.06.030
Li, S., Tan, S., Xu, C., Gao, P., and Sun, L. (2013). An Experimental Study of Bubble Sliding Characteristics in Narrow Channel. Int. J. Heat Mass Transfer 57 (1), 89–99. doi:10.1016/j.ijheatmasstransfer.2012.10.002
Liao, Y., Krepper, E., and Lucas, D. (2019). A Baseline Closure Concept for Simulating Bubbly Flow with Phase Change: A Mechanistic Model for Interphase Heat Transfer Coefficient. Nucl. Eng. Des. 348, 1–13. doi:10.1016/j.nucengdes.2019.04.007
Liao, Y., Ma, T., Liu, L., Ziegenhein, T., Krepper, E., and Lucas, D. (2018). Eulerian Modelling of Turbulent Bubbly Flow Based on a Baseline Closure Concept. Nucl. Eng. Des. 337, 450–459. doi:10.1016/j.nucengdes.2018.07.021
Meyer, M. K., Moore, G. A., and Jue, J. F. (2012). INL/EXT-12-26500; TRN: US1300072 United States 10.2172/1055982 TRN: US1300072 INL English [R]. Idaho National Laboratory (INL).
Moraga, F. J., Bonetto, F. J., and Lahey, R. T. (1999). Lateral Forces on Spheres in Turbulent Uniform Shear Flow. Int. J. Multiphase Flow 25 (6), 1321–1372. doi:10.1016/s0301-9322(99)00045-2
Song, J. H., Lee, J., Chang, S. H., and Jeong, Y. H. (2017). Onset of Nucleate Boiling in Narrow, Rectangular Channel for Downward Flow under Low Pressure. Ann. Nucl. Energ. 109 (1), 498–506. doi:10.1016/j.anucene.2017.05.050
Sudo, Y., Miyata, K., Ikawa, H., Kaminaga, M., and Ohkawara, M. (1985). Experimental Study of Differences in DNB Heat Flux between Upflow and Downflow in Vertical Rectangular Channel. J. Nucl. Sci. Tech. 22 (8), 604–618. doi:10.1080/18811248.1985.9735705
Wang, C., Wang, H., Li, X., and Gao, P. (2014). Experimental Study of Saturated Boiling Heat Transfer and Pressure Drop in Vertical Rectangular Channel. Nucl. Eng. Des. 273 (1), 631–643. doi:10.1016/j.nucengdes.2014.03.053
Wang, C., Wang, H., Wang, S., and Gao, P. (2014). Experimental Study of Boiling Incipience in Vertical Narrow Rectangular Channel. Ann. Nucl. Energ. 66 (1), 152–160. doi:10.1016/j.anucene.2013.12.011
Keywords: plate fuel element, rectangle channel, blister, subcooled boiling, CFD
Citation: Huang H, Chen C, Liu L, Liu Y, Li L, Yu H, Wang M and Qiu S (2021) Study on Flow Boiling Characteristics in Rectangle Channel After Formation of Blisters. Front. Energy Res. 9:676586. doi: 10.3389/fenrg.2021.676586
Received: 05 March 2021; Accepted: 11 June 2021;
Published: 12 July 2021.
Edited by:
Jinbiao Xiong, Shanghai Jiao Tong University, ChinaReviewed by:
Muhammad Saeed, East China University of Technology, ChinaLuteng Zhang, Chongqing University, China
Copyright © 2021 Huang, Chen, Liu, Liu, Li, Yu, Wang and Qiu. This is an open-access article distributed under the terms of the Creative Commons Attribution License (CC BY). The use, distribution or reproduction in other forums is permitted, provided the original author(s) and the copyright owner(s) are credited and that the original publication in this journal is cited, in accordance with accepted academic practice. No use, distribution or reproduction is permitted which does not comply with these terms.
*Correspondence: Yu Liu, bHktTGl1eXVAMTYzLmNvbQ==