Abstract
The severity of the ongoing environmental crisis has prompted the development of renewable energy generation and smart grids integration. The access of enewable energy makes the economic dispatching of smart grid complicated. Therefore, the economic dispatching model for smart grid is very necessary. This paper presents an economic dispatching model of smart power grid, which considers both economy and pollution emission. The smart grid model used for the simulation is construced of wind energy, solar energy, fuel cell, and thermal power, and the use of fuel cell enables the smart grid to achieve multi-energy complementar. To overcome the defect of the traditional centralized communication methods, which are prone to communication jams, this paper adopts a multi-agent inform ation exchange method to improve the stability and efficiency. In terms of the solution method for this model, this paper proposes Improved Strength Pareto Evolutionary Algorithm 2(ISPEA2) and Improved Non-dominated Sorting Genetic Algorithm 2(INSGA2) that solves the economic dispatch problem of a smart grid. The strength Pareto evolutionary algorithm 2(SPEA2),non-dominated sorting genetic algorithm 2(NSGA2) and the improved algorithms are simultaneously applied to the proposed smart grid model for economic dispatching simulation. The simulation results show that ISPEA2 and INSGA2 are effective. ISPEA2 and INSGA2 have shown improvements over SPEA2 and NSGA2 in accuracy or running times.
1 Introduction
While traditonal fossil fuels has brought tremendous postive impact to the world, its large negative impacts to the environment is hard to ignore and many would argue that it’s one of the most important problems faced by humanity right now. The concept of “carbon peak” and “carbon neutral” make people pay more and more attention to the application of renewable energy in power generation. The economic dispatching problem of power grid is very important all the time. The original economic dispatch problem of electric power grid can be traced back to the 1920s. The main types of generators in traditional electric power grids are thermal power generators. At the same time, the total number of power units is small, which makes the economic dispatch problem of the ancient electric power grid relatively simple. The access of renewable energy makes the economic dispatch problem of smart grid complicated and the economic dispatching model of smart grid becomes very important. Many scholars have carried out research in related fields. A new distributed dual-Newton descent (DDND) algorithm for energy management of multiple energy bodies is proposed in Literature Yushuai et al. (2020). Literature Li et al. (2019) proposed an event-triggered based distributed algorithm for energy management of multi-energy systems. In order to enhance the adaptability and flexibility of multi-energy systems, a double-mode energy management model of multi-energy systems is established in Literature Li et al. (2020). Literature Jing (2018) many studies on the economic dispatch of smart grids. Literature Tang et al. (2019) applies the Lagrangian method to solve economic scheduling problems in large wind power scenarios. literature Liang et al. (2017) proposes a state-based potential game approach to solve the smart grid economic dispatch problem. Literature Yin et al. (2020) combined deep learning with the economic dispatch of smart grids, and the authors proposed a possibility for the future development of smart grids. Literature Elnozahy et al. (2021) applied artificial neural network and sliding mode control to new energy operation control. As shown by the recent research trends, it’s inevitable that power grid will become more and more intelligent, requireing more information exchange between different components of the powergrid and communication congestion will become one of the most prevalent challenges as mentioned in Ali et al. (2018). To address the communication congestion issues, this paper proposes a dis tributed communication scheme that greatly improves the communication efficienc and robustness of the communication network. It can better meet the plug-and-play of smart grids. Literature Younes et al. (2021) proposes a new smart grid economic dispatch method, but this method is a single-objective optimization. This paper proposes a multi-objective (Zx and Kai, 2021; Simonetti et al., 2021; Zhou et al., 2021) optimization in the true sense, and the results are expressed by the Pareto-front (Hja et al., 2019; Zheng and Wang 2019), which expresses the relationship between cost and emissions. Therefore, the solution method for the economic dispatch model of smart grid proposed in this paper shall use multi-objective optimization algorithms. Among many published multi-objective optimization algorithms, some of them have received very high attention in scientific, engineering and commercial applications because of their powerful ability to obtain the closest approximation to the real Pareto frontier. SPEA2 and NSGA2 are two widely adopted multi-objective optimization algorithms, but their computational performances still have the potential to improve due to fixed genetic parameters. In this paper, the two algorithms are improved, and the simulation results show that the improved algorithms are effective.
The main contributions of this paper are as follows: Firstly, wind power, thermal power, solar power, and fuel cells are used to construct a multi-energy complementary smart grid economic dispatching model. Both economy and pollution emission are considered in this model. Secondly, two algorithms are improved in this paper. The performance of four algorithms in solving the economic dispatching of a smart grid is compared. The solutions and running time are analyzed, providing more algorithm choices for the economic dispatching of the smart grid. Experimental results show that ISPEA2 is more accurate than before. INSGA2 has higher computational accuracy and higher computational speed than before. Finally, a distributed communication method is proposed in this article to obtain information through the neighbor nodes, which is suitable for the plug-and-play mode of smart grids.
2 Problem Description
In this paper, a mathematical model is established with generators of photovoltaic(PV) wind, thermal, and fuel cells. In this model, multi-energy complementarity is reflected.
2.1 Cost Function and Constraints
As mentioned in Zhang and Liang (2021), Hetzer et al. (2008), the cost of the system is the sum of the costs of all generators.The acronyms are shown as follows Cz(t) total cost of grid, Cr,i(t) cost of thermal unit, Cf,i(t) cost of wind unit, Cf,i,f(t) penalty cost of wind, Cf,i,r(t) reserve cost of wind, Cd,i(t) cost of fuel cell, Cd,i,r(t) thermal load cost, Cd,i,H(t) hydrogen storing cost, CPV,i(t) Photovoltaic power generation cost, All generators can not exceed their respective generating capacity (Hetzer et al., 2008; El-Sharkh et al., 2006; Yin et al., 2021).The acronyms are shown as follows Pr,i(t) power of thermal unit, maximum thermal generator power, minimum thermal generator power, Pd,i(t) power of fuel cell, maximum fuel cell power, minimum fuel cell power, Pf,i(t) power output of wind unit, Pf,i,r wind unit rated power, PPV,i(t) Photovoltaic generator output power, Maximum output power of photovoltaic generator, The total generating power must meet the sum of power demand, PDem(t) is total power demand.
2.2 The Model of Unit Operation
Thermal power generating units conform to the following model (Hemamalini and Simon, 2009; Cheong et al., 2010; Bahrani and Patra, 2017; Wang et al., 2010; Wei et al., 2021).ai; bi; ci; ei; fi are emission coeffcients. θi; βi; γi; ςi; κi are cost coefficients. This article takes θi = 1, βi = 1.25, γi = 1, ςi = 0.3, κi = 15, ai = 0.036, bi = 0.04256, ci = 0.06490, ei = 2.6615–10, fi = 2.857. Wind turbine generators conforms to the following model (Hetzer et al., 2008). kpi is penalty cost coefficient and Pf,i,k is available wind for generator,
This article takes kpi = 2. If the power of the wind turbine is less than the required value, then power compensation must be obtained from the outside world (Hetzer et al., 2008).
This article takes kri = 4. PEM fuel cell conforms to the following model El-Sharkh et al., 2006).Cn is price of natural gas, Pfz(t) is auxiliary devices power, Py(t) is equivalent power for hydrogen production, ηi_ is electrical efficiency of fuel cell. This article takes Cn = 0.4. When the fuel cell is loaded enough, the heat generated can be used to generate electricity. It is worth mentioning that multi-energy complementarity is achieved in this case. At this point, the working situation of the fuel cell unit is more complicated. This paper considers the operation of the fuel cell unit in this case. The use of fuel cells can meet not only the electrical load, but also the thermal load. Partial load ratio is represented here by PR. The ratio of heat energy to electric energy is expressed asγR,D = 0.6801. When PR0.05, ηi_ = 0.2716. When PR ≥ 0.05, ηi_ is expressed in Eq. 13.
The ratio of heat energy to electric energy is expressed as Eq. 14.
The thermal power from the fuel cell can be expressed as
The cost generated by heat load is expressed as
C F,i,R(t) is the cost generated by heat load, PF,i,R(t) is the thermal power from the fuel cell. Photovoltaic units are conformed to the following model (Niknam et al., 2012). This cost includes two parts: operation cost and penalty cost.kPV,i is Photovoltaic power generation cost coefficient, PPV,f is Photovoltaic forecast power, ΔPPV is the value of Photovoltaic actual power minus predicted power, is actual light intensity, is forecast light intensity, CP,PV,i(t) is Photovoltaic power penalty cost, kP,PV,i is PV power penalty cost coefficient.
2.3 System Structure
As shown in Figure 1, each generator is connected to an agent. Each agent exchanges information with the agents of its neighboring units (Li et al., 2018). Before the entire system starts to work, the operating parameters of each unit are first uploaded to their respective agents. After several information exchanges, the operating parameters and weather conditions of all units are uploaded to each agent. Then the system starts to work. Finally, the instructions are sent to each unit through distributed information transmission to achieve harmony and unity of the entire system. In this system, thermal power units and wind turbines generate alternating current, while fuel cells and photovoltaic units generate direct current. All the electricity is modulated by the inverter and sent to the loads.
FIGURE 1

System structure.
Due to limited space, this article uses four agents to describe the communication process briefly. The process is shown in Figure 2.
FIGURE 2
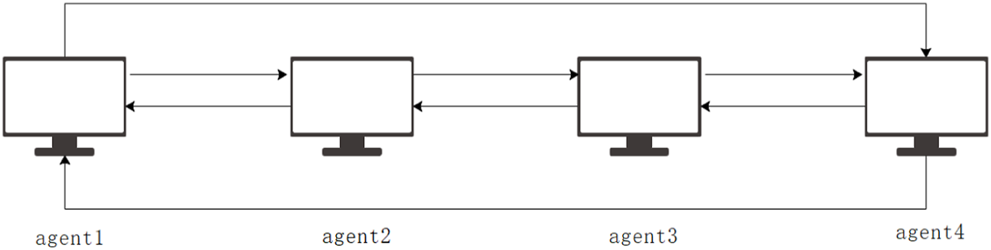
Communication progress.
Before the information exchange begins, each agent has their own information. After information exchange, the information of each agent is described as follows.
Agent1:{1, < 2, 4 >},
Agent2:{2, < 1, 3 >},
Agent3:{3, < 2, 4 >},
Agent4:{4, < 3, 1 >},
For example, Agent 1 communicates with Agent 2 and Agent 4. At this point, Agent 1 gets the informations from Agent 2 and Agent 4. Other agents get the informations in exactly the same way. At this time, each agent not only has its own information, but also obtains the information of neighboring nodes. After a step of information exchange again, each agent has more abundant information. The details are as follows.
Agent1:{1, < 2, 4 >}, {2, < 1, 3 >}, {4, < 3, 1 >},
Agent2:{2, < 1, 3 >}, {1, < 2, 4 >}, {3, < 2, 4 >},
Agent3:{3, < 2, 4 >}, {2, < 1, 3 >}, {4, < 3, 1 >},
Agent4:{4, < 3, 1 >}, {3, < 2, 4 >}, {1, < 2, 4 >},
The amount of information held by each agent increases again. For the reader’s convenience, the expression here does not remove duplicate informations owned by the Agents. After the information exchange, each agent will have global information. For example, Agent1 has informations from all other agents. In this way, global informations are stored in each agent.
3 Algorithm
SPEA2 (Sla et al., 2020; Cao et al., 2020; Mk et al., 2020; Biswas and Pal, 2020) and NSGA2 (Khammassi and Krichen, 2020; Che et al., 2021; Prakash et al., 2020; Zhang and Liu, 2020; Yeh, 2019), as classical multi-objective optimization algorithms, can be widely used in solving multi-objective optimization problems. For example, Literature Sla et al. (2020) applies SPEA2 to solve multiobjective optimization of a continuous kraft pulp digester. Literature Yeh (2019) applies NSGA2 to solve a bi-objective optimization problem of multi-state electronic transaction network. This paper is to solve a multi—objective optimization problem. So these two algorithms can be used. However, these two algorithms have limitations. In order to get the optimal solution faster and more accurately, the two algorithms are improved in this paper. Experimental results show that the improved algorithms are effective.
3.1 SPEA2
SPEA2 is a broadly used multi-objective optimization algorithm. It can be known the procedure from Figure 3.
FIGURE 3
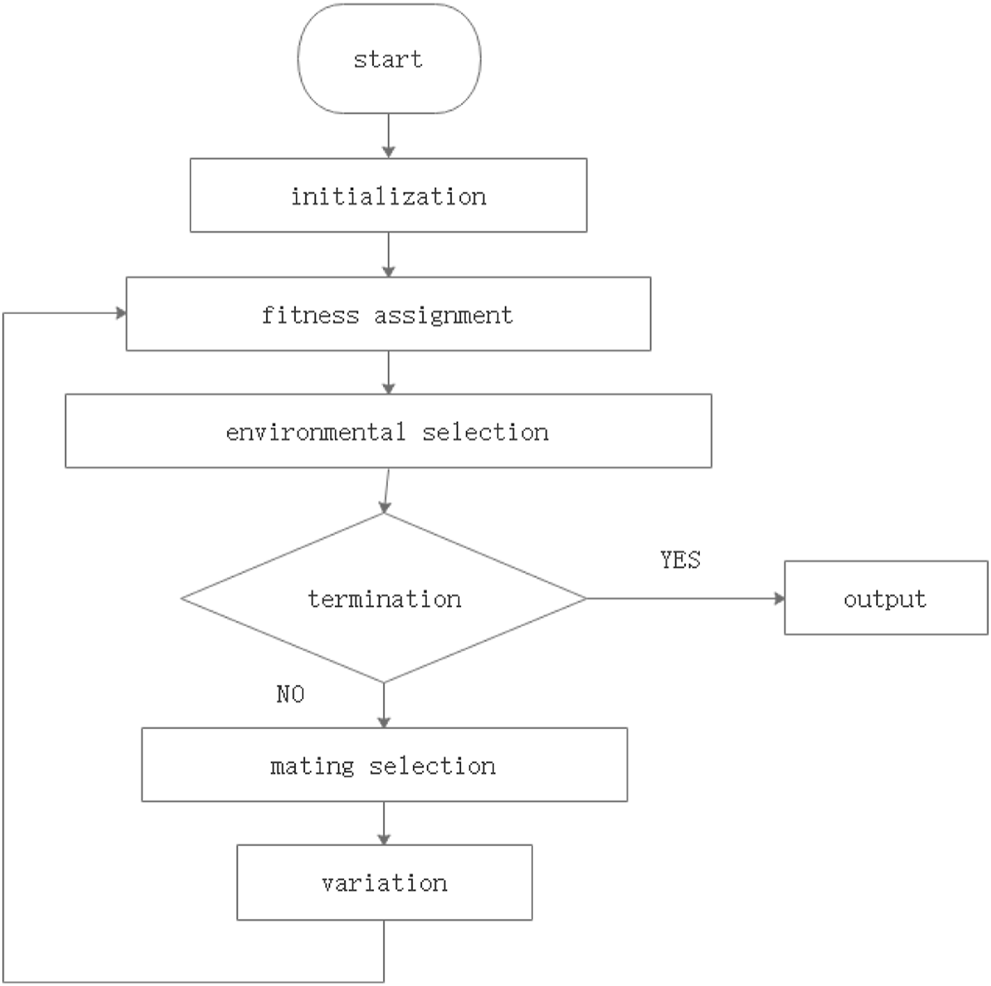
Workflow of spea2.
3.1.1 Start
Generating initial solutions whose number is N. At the same time, an empty achieve is needed. The initial solutions are stored inp0_, and the empty achieve is called A0_.
3.1.2 Fitness Assignment
Each solution is given an strength value S(i) whether in P0_ or A0_.
Each individual is assigned a fitness value called R(i).
Next, the density information should be known. The values are calculated from the kth neighbor.the means the distance from i to the kth nearest neighbor, and the 2 makes D(i) is a value between 0 and 0.5. In this way, multiple individuals having the same S(i) value is avoided. So, the fitness F(i) is the sum of R(i) and D(i).
3.1.3 Selection From Environment
The non-dominated solutions are transferred to the next generation.
If the solutions can fit the archive size, then At+1_ = N. Otherwise, some other methods are taken to make the number of current solutions is equal to N.
3.1.4 Termination
When the condition is met, the loop ends.
3.1.5 Mating Selection
The mating pool is filled by binary tournament selection from |At+1_|.
3.1.6 Variation
Perform mutation and reorganization operations.
3.2 NSGA2
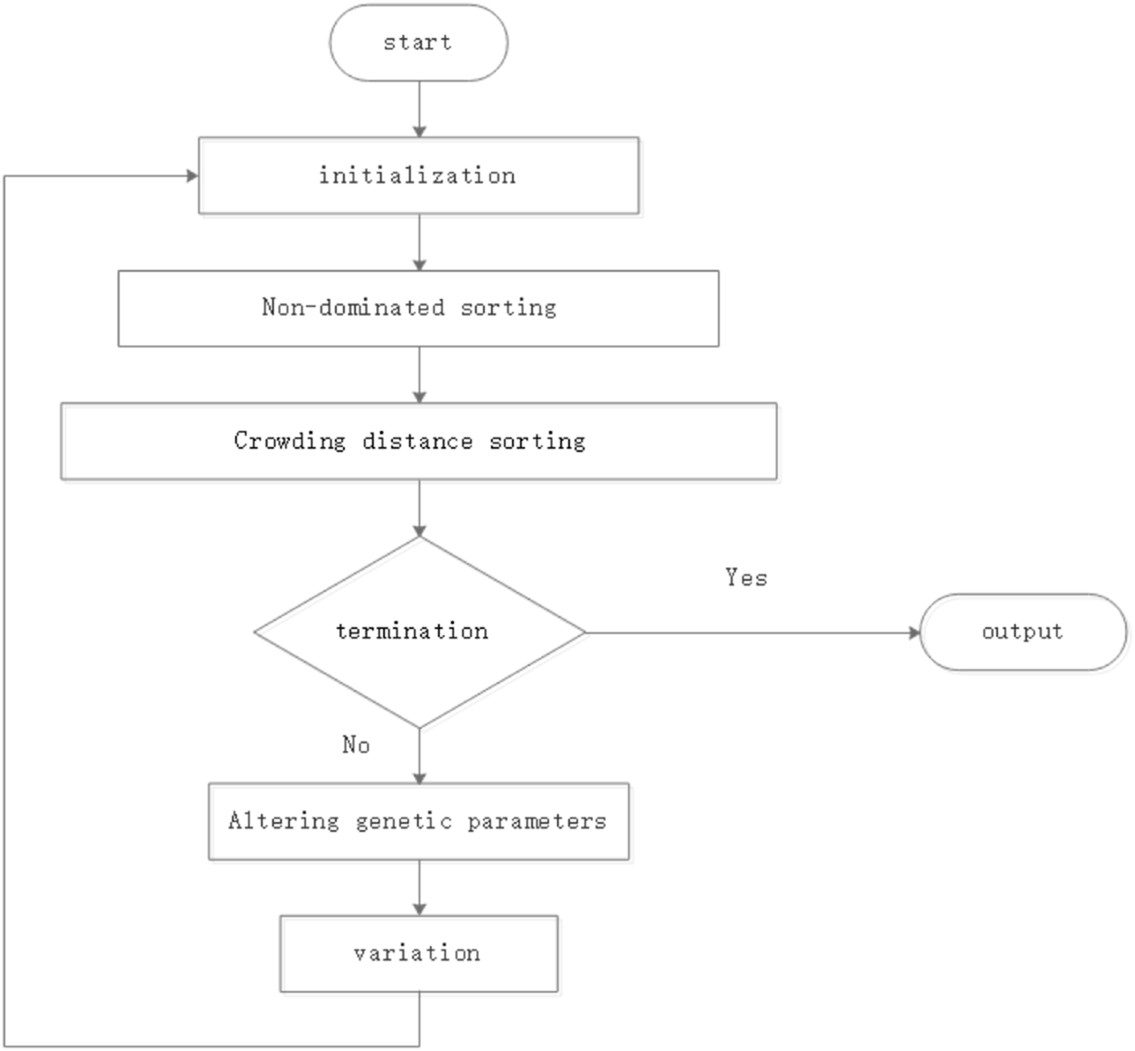
Non-dominated sorting genetic algorithm (NSGA2) is another multi-objective optimization algorithm. The workflow NSGA2 is shown in Figure 4.
FIGURE 4
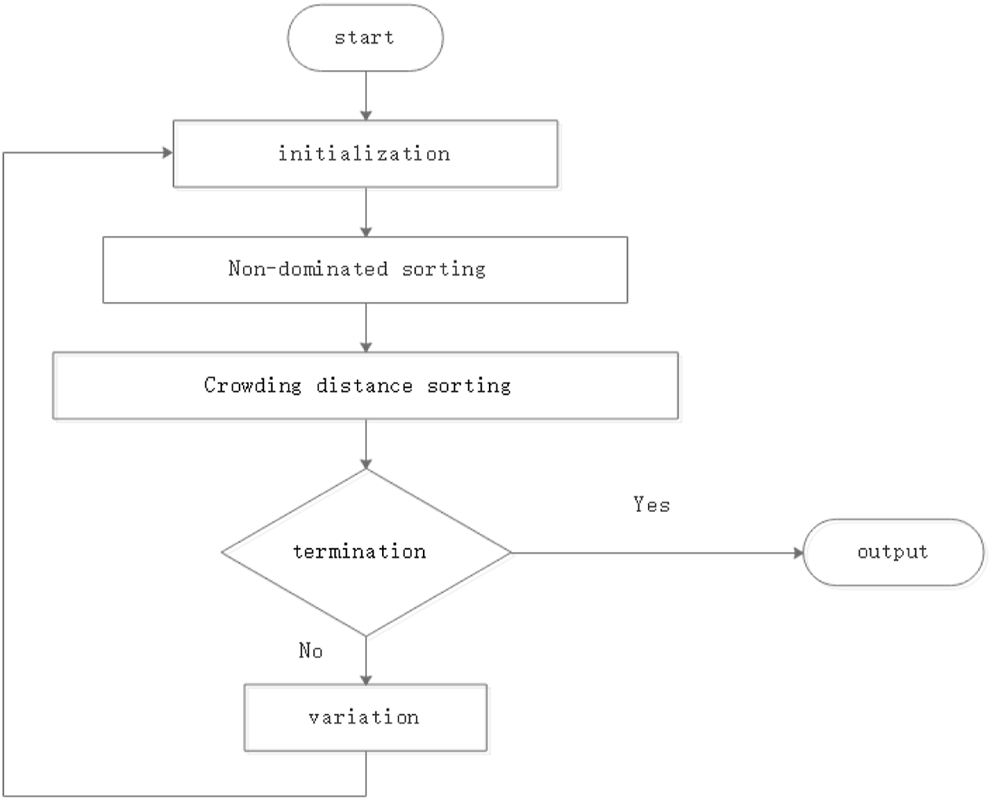
Workflow of nsga2.
3.2.1 Start
Parent solutions P0_ is gererated randomly. Next, each solution is assigned a fitness from its dominance rank.
3.2.2 Variation
Then the next generation individuals Q0_ whose size is N. The whole solutions are P0_ ∪ Q0_.
3.2.3 Sorting According to Ranks
The solutions should be sorted according to ranks.
3.2.4 Sorting According to Crowding Distance
Then selecting the individual F1 of the best rank, that is, all non-dominated solutions appear. If the number of F1 is not enough, sub-optimal solutions called F2 will also be selected. Repeat this process until N individuals are met. Obviously, N is sure, so the selected individuals in the lowest rank need to be eliminated. In other words, only the best part of the lowest-rank individuals selected can be transferred to the next step. It can be called the lowest rank F3. The selection of the optimal solution in F3 has its own rules. The rules are called crowded distance sort.
Dis(i) is distance of solutions in spea2, where Dis(1) = Dis(l) = ∞. After the crowding distance sorting, the best individuals whose size is from F3 are chosen.
3.2.5 Termination
When the condition is met, the loop ends.
3.3 ISPEA2
The defects of SPEA2 cannot be ignored. From the variation point of view, the values of crossover and mutation are invariable. Therefore, the flexibility of SPEA2 is reduced severely. This paper adopts a method to make the probabilities of crossover and variation vary with the current solution. The workflow of ISPEA2 is shown in Figure 5.
FIGURE 5
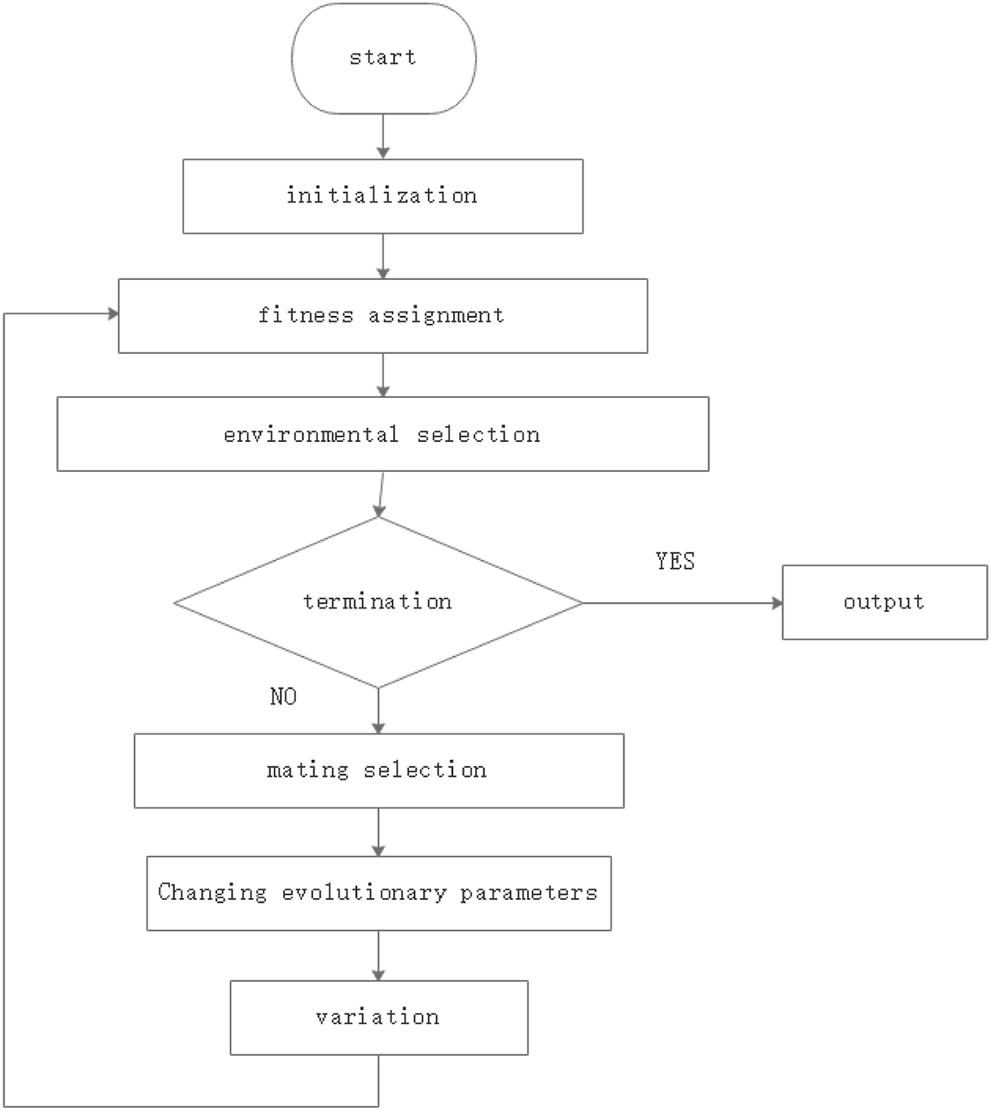
Workflow of ispea2.
In this paper, a few concepts Chengwang and Lixin, 2010) need to be understood. The population diversity index is used to evaluate the quality of population diversity. The population diversity index is defined as H.
The m represents groups quantity, pi represents the proportion of the ith species to the whole groups. Suppose the distance of several individuals is less than D. In that case, they are very resemblance. These individuals are defined as one group. H ∈ [0, 1], The more even the distribution of the population, the greater the value of H, so it is more likely to find the suspected optimal solutions. According to the population diversity parameter H, the crossover and mutation probability values will be dynamically changed in the next step.
P cMin , PcMax, PmMin and PmMax are the preset range of crossover and mutation probability values respectively. It should be noted in particular that the variation range of genetic parameters can be determined by experimenter according to the actual situation. The numerical range adopted in this paper are: PcMin = 0.001, PmMax = 0.1, PcMin = 0.9, PcMax = 0.97. It is worth mentioning that this range can be changed according to the actual needs of the researchers. In this way, the probabilities of crossover and mutation from SPEA2 are adaptive. So the algorithm performance is improved.
3.4 INSGA2
The genetic parameters of traditional NSGA2 are fixed. In this paper, dynamic genetic parameters are adopted to enhance the adaptability of the algorithm. As the number of iterations changes, the crossing probability of INSGA2 is updated according to Eq. 28. The workflow of INSGA2 is shown in Figure 6.
FIGURE 6
Workflow of insga2.
As the number of iterations changes, the mutation probability of INSGA2 is updated according to Eq. 29.i is the current iteration, M is the total number of iterations. pc1max, pc1min are the maximum and minimum crossover probability, and pm1max, pm1min are the maximum and minimum mutation probability. Their range of variation can be determined by the researchers according to the actual situation. The values adopted in this paper are as follows:pc1max = 0.95, pc1min = 0.4, pm1max = 0.1, pm1min = 0.01. Researchers can change this range to suit their different needs.
4 Simulation Results
Before the simulation starts, the configuration number of each kind of generator needs to be determined. The system consists of five thermal power generators, three fuel cells, two wind power generators, and two photovoltaic generators. In this paper, it is considered that the computational performance of the algorithms mentioned above for smart grid economic dispatch with fewer iterations. Before the algorithms running, the initialization individuals of the four algorithms are the same. Running the algorithms 20 times and the average valus are taked as the final results. In this paper, the output of the generators is expressed by the sum of normalized values.
As shown in Figure 7 and Tables 1–3, the number of iterations is 100. The performance of SPEA2 is better than that of NSGA2 from the point of view of the solutions. Compared with the improved algorithm, the accuracy and diversity of ISPEA2 solutions are better than that of SPEA2. INSGA2 solutions are not significantly better than NSGA2 solutions. In terms of running time, NSGA2 runs much faster than SPEA2, and INSGA2 runs faster than NSGA2.
FIGURE 7
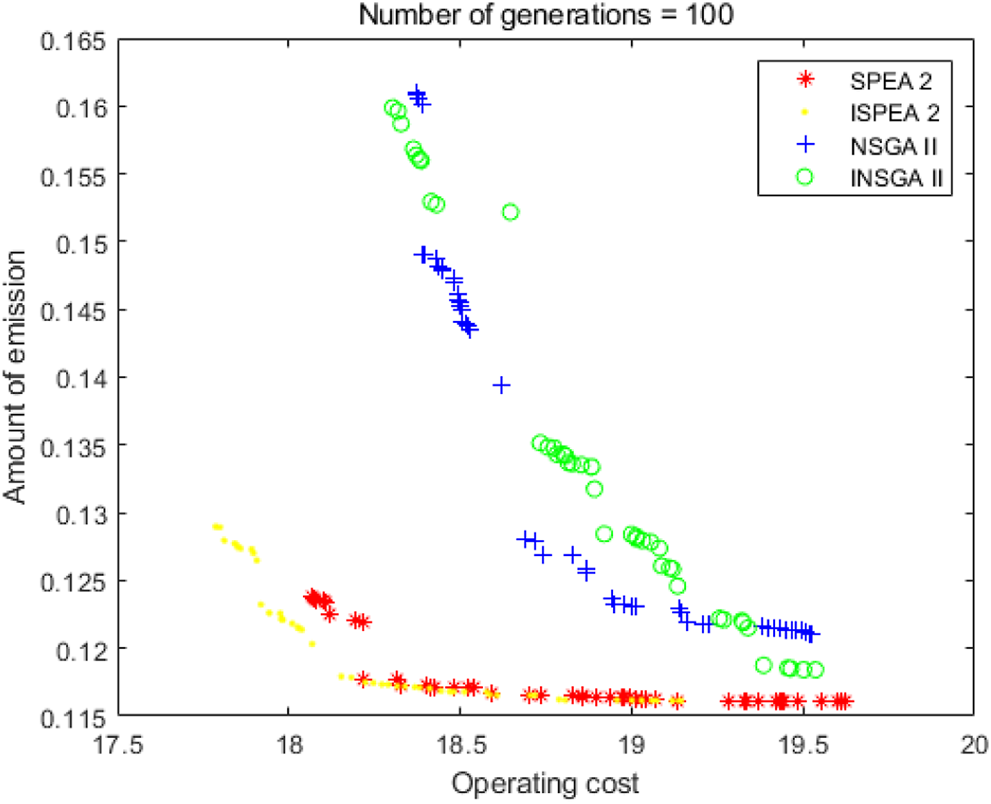
100 iterations.
TABLE 1
| Algorithm | SPEA2 | ISPEA2 | NSGA2 | INSGA2 |
|---|---|---|---|---|
| Emin(ton/h) | 0.1161 | 0.1161 | 0.1211 | 0.1184 |
| Cmin($/h) | 18.0646 | 17.8420 | 18.3700 | 18.3027 |
| time(s) | 3.9730 | 4.3210 | 1.4070 | 1.3690 |
100 iterations.
TABLE 2
| Algorithm | Thermal power | Wind power | Photovoltaic | Fuel cell |
|---|---|---|---|---|
| SPEA2 | 1.684942 | 1.172386 | 1.263625 | 3.379047 |
| NSGA2 | 2.921474 | 1.247965 | 0.760825 | 2.569737 |
| ISPEA2 | 2.093457 | 1.015058 | 1.054696 | 3.336788 |
| INSGA2 | 2.907721 | 1.176557 | 0.738921 | 2.676801 |
The least cost scheme at 100 iterations.
TABLE 3
| Algorithm | Thermal power | Wind power | Photovoltaic | Fuel cell |
|---|---|---|---|---|
| SPEA2 | 1.303302 | 1.41503 | 1.766311 | 3.015357 |
| NSGA2 | 1.721885 | 1.870412 | 1.155672 | 2.752032 |
| ISPEA2 | 1.323214 | 1.507701 | 1.310309 | 3.358776 |
| INSGA2 | 1.60489 | 1.620995 | 1.425408 | 2.848707 |
The least emissions scheme at 100 iterations.
As shown in Figure 8 and Tables 4–6, the number of iterations is 200. SPEA2 is better than NSGA2 overall. From the perspective of solutions, ISPEA2 is superior to SPEA2, while INSGA2 is not superior to NSGA2. ISPEA2 runs longer than SPEA2. In terms of running time, ISPEA2 runs slower than SPEA2, and INSGA2 runs faster than NSGA2.
FIGURE 8
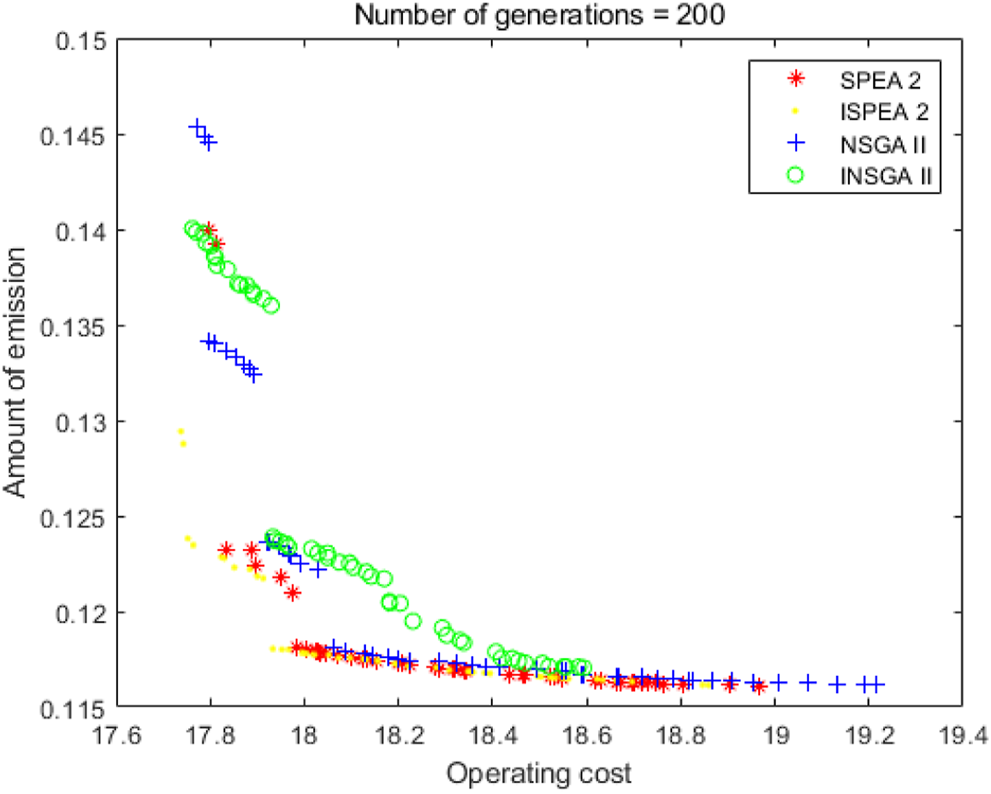
200 iterations.
TABLE 4
| Algorithm | SPEA2 | ISPEA2 | NSGA2 | INSGA2 |
|---|---|---|---|---|
| Emin(ton/h) | 0.1161 | 0.1161 | 0.1161 | 0.1170 |
| Cmin($/h) | 17.7960 | 17.7379 | 17.7722 | 17.7623 |
| time(s) | 7.9060 | 8.1200 | 2.2810 | 2.2380 |
200 iterations.
TABLE 5
| Algorithm | Thermal power | Wind power | Photovoltaic | Fuel cell |
|---|---|---|---|---|
| SPEA2 | 2.303944 | 0.93989 | 1.028783 | 3.227382 |
| NSGA2 | 2.514736 | 0.957151 | 0.809179 | 3.218934 |
| ISPEA2 | 2.116473 | 0.946305 | 1.018767 | 3.418455 |
| INSGA2 | 2.317267 | 0.990976 | 0.845954 | 3.345803 |
The least cost scheme at 200 iterations.
TABLE 6
| Algorithm | Thermal power | Wind power | Photovoltaic | Fuel cell |
|---|---|---|---|---|
| SPEA2 | 1.312516 | 1.149055 | 1.586885 | 3.451544 |
| NSGA2 | 1.332547 | 1.018 | 1.786001 | 3.363453 |
| ISPEA2 | 1.340919 | 1.378198 | 1.372097 | 3.408787 |
| INSGA2 | 1.495224 | 1.102759 | 1.548095 | 3.353922 |
The least emissions scheme at 200 iterations.
As shown in Figure 9 and Tables 7–9, in this case, the solutions from INSGA2 are better than these of NSGA2. The running time of INSGA2 is less than that of NSGA2. On the other hand, the solutions produced by ISPEA2 are not obviously different from solutions of SPEA2 on the whole, and ISPEA2 has a slight advantage in obtaining lower-cost solutions. The running time of ISPEA2 is slightly longer than SPEA2.
FIGURE 9
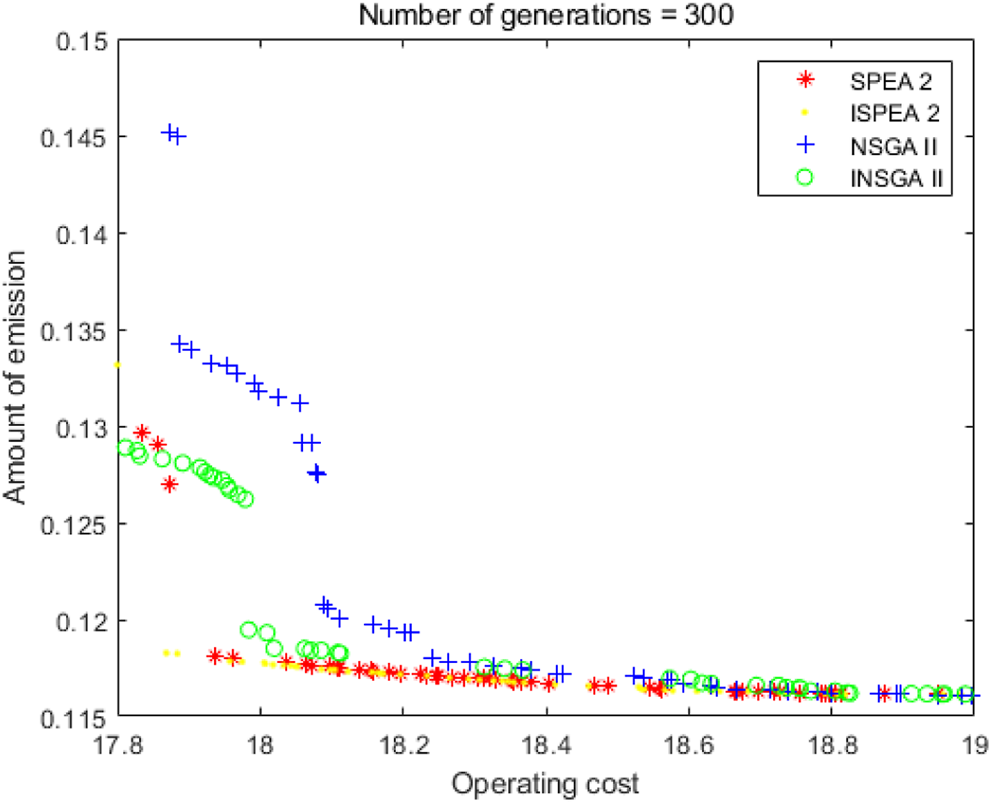
300 iterations.
TABLE 7
| Algorithm | SPEA2 | ISPEA2 | NSGA2 | INSGA2 |
|---|---|---|---|---|
| Emin(ton/h) | 0.1161 | 0.1161 | 0.1161 | 0.1161 |
| Cmin($/h) | 17.8337 | 17.8000 | 17.8745 | 17.8115 |
| time(s) | 12.0550 | 12.2210 | 3.9090 | 3.6880 |
300 iterations.
TABLE 8
| Algorithm | Thermal power | Wind power | Photovoltaic | Fuel cell |
|---|---|---|---|---|
| SPEA2 | 2.112679 | 0.997161 | 1.050533 | 3.339627 |
| NSGA2 | 2.511344 | 0.990781 | 0.951936 | 3.045939 |
| ISPEA2 | 2.272125 | 1.038351 | 0.907097 | 3.282427 |
| INSGA2 | 2.092264 | 1.03601 | 1.089012 | 3.282715 |
The least cost scheme at 300 iterations.
TABLE 9
| Algorithm | Thermal power | Wind power | Photovoltaic | Fuel cell |
|---|---|---|---|---|
| SPEA2 | 1.314326 | 1.35376 | 1.412212 | 3.419701 |
| NSGA2 | 1.309147 | 1.307245 | 1.483354 | 3.400254 |
| ISPEA2 | 1.313774 | 1.541804 | 1.255385 | 3.389037 |
| INSGA2 | 1.333483 | 1.320083 | 1.46705 | 3.37943 |
The least emissions scheme at 300 iterations.
As shown in Figure 10 and Tables 10–12, the iteration number is 400. The solutions from ISPEA2 are better than those from SPEA2, and the solutions from INSGA2 are better than those from NSGA2. From the running time perspective, as before, ISPEA2 is faster than SPEA2. INSGA2 is still faster than NSGA2.
FIGURE 10
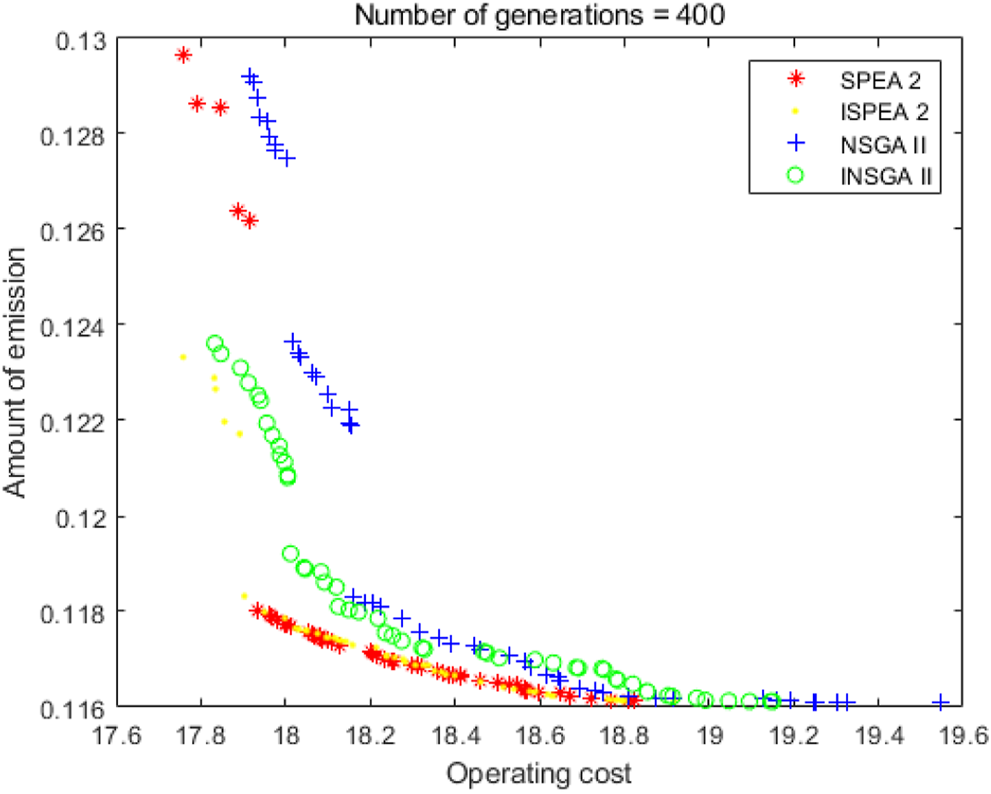
400 iterations.
TABLE 10
| Algorithm | SPEA2 | ISPEA2 | NSGA2 | INSGA2 |
|---|---|---|---|---|
| Emin(ton/h) | 0.1161 | 0.1161 | 0.1161 | 0.1161 |
| Cmin($/h) | 17.7613 | 17.7588 | 17.9167 | 17.8333 |
| time(s) | 11.4770 | 11.2050 | 3.9080 | 3.2300 |
400 iterations.
TABLE 11
| Algorithm | Thermal power | Wind power | Photovoltaic | Fuel cell |
|---|---|---|---|---|
| SPEA2 | 2.119391 | 1.053909 | 0.901614 | 3.425086 |
| NSGA2 | 2.106319 | 1.15936 | 1.075992 | 3.158328 |
| ISPEA2 | 1.875477 | 1.051127 | 1.102771 | 3.470626 |
| INSGA2 | 1.885996 | 1.160107 | 1.048259 | 3.405638 |
The least cost scheme at 400 iterations.
TABLE 12
| Algorithm | Thermal power | Wind power | Photovoltaic | Fuel cell |
|---|---|---|---|---|
| SPEA2 | 1.31305 | 1.388701 | 1.320382 | 3.477867 |
| NSGA2 | 1.310583 | 1.509376 | 1.540883 | 3.132084 |
| ISPEA2 | 1.313774 | 1.541804 | 1.255385 | 3.389037 |
| INSGA2 | 1.308089 | 1.605501 | 1.255914 | 3.330496 |
The least emissions scheme at 400 iterations.
As shown in Figure 11 and Tables 13–15, the iteration number is 500. At this point, the computing power of ISPEA2 and SPEA2 tends to be the same. The solutions of INSGA2 are better than these of NSGA2. The running time of NSGA2 is significantly shorter than that of SPEA2. The running time of INSGA2 is shorter than that of NSGA2. It is important to note that the pollution emission provided by the solutions will not be zero. The main reason is that the operation cost of thermal power unit is less, and its operation stability is stronger. In actual operation, the waste caused by shutting down the thermal power unit completely and restarting it is very serious. Therefore, the minimum value of pollution emission in this paper is not zero.
FIGURE 11
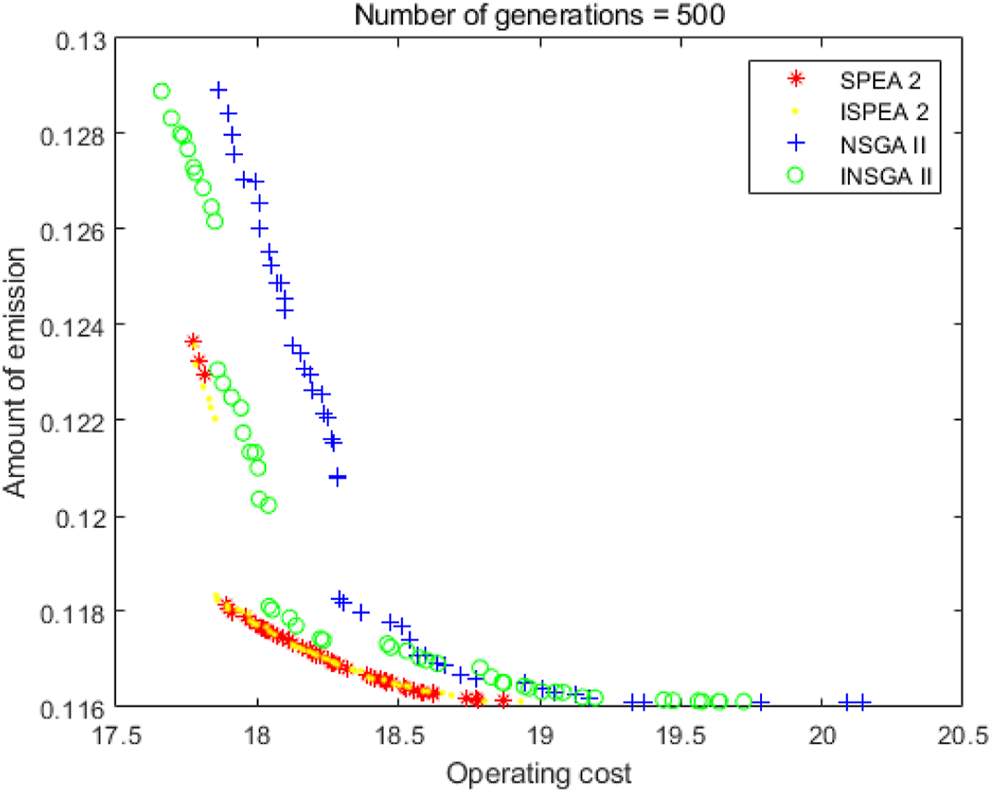
500 iterations.
TABLE 13
| Algorithm | SPEA2 | ISPEA2 | NSGA2 | INSGA2 |
|---|---|---|---|---|
| Emin(ton/h) | 0.1161 | 0.1161 | 0.1161 | 0.1161 |
| Cmin($/h) | 17.7700 | 17.7793 | 17.8608 | 17.6607 |
| time(s) | 12.0970 | 12.6820 | 4.1460 | 3.7670 |
500 iterations.
TABLE 14
| Algorithm | Thermal power | Wind power | Photovoltaic | Fuel cell |
|---|---|---|---|---|
| SPEA2 | 1.893881 | 1.056683 | 1.102907 | 3.446529 |
| NSGA2 | 2.093862 | 1.190873 | 0.991284 | 3.22398 |
| ISPEA2 | 1.881558 | 1.056786 | 1.128345 | 3.4331 |
| INSGA2 | 2.092246 | 0.868215 | 1.052962 | 3.486576 |
The least cost scheme at 500 iterations.
TABLE 15
| Algorithm | Thermal power | Wind power | Photovoltaic | Fuel cell |
|---|---|---|---|---|
| SPEA2 | 1.327454 | 1.448908 | 1.236683 | 3.486955 |
| NSGA2 | 1.310583 | 1.509376 | 1.540883 | 3.139158 |
| ISPEA2 | 1.312474 | 1.451972 | 1.324006 | 3.411548 |
| INSGA2 | 1.303875 | 1.548222 | 1.637543 | 3.010359 |
The least emissions scheme at 500 iterations.
5 Conclusion
This paper presents a multi-energy complementary model for smart grid economic dispatching and provides the solution to the model. The economic dispatching model of smart grid constructed in this paper can well reflect the characteristics of multi-energy complementarity of smart grid, and also meet the plug and play mode of new energy. In terms of the solution method, this paper has demonstrated improvements of ISPEA2 and INSGA2 over SPEA2 and NSGA2 via this model. From the point of view of the obtained solution, ISPEA2 is better than SPEA2 regardless of the number of iterations. When the number of iterations is small, the output results of INSGA2 and NSGA2 are not significantly different. When the number of iterations is large, INSGA2 is consistently better than NSGA2. From the perspective of running time, ISPEA2 is slightly slower than SPEA2, and INSGA2 is slightly faster than NSGA2. In the next phase, the smart grid economic dispatching model needs to be further improved. The calculated speed of ISPEA2 still needs to be accelerated, and the accuracy of INSGA2 also needs to be improved. In summary, ISPEA2 has the best accuracy and INSGA2 has the best efficienchy out of the four algorithms compared. Depends on the needs, either ISPEA2 or INSGA2 can be suitable for the model.
Statements
Data availability statement
The original contributions presented in the study are included in the article/Supplementary Material, further inquiries can be directed to the corresponding author.
Author contributions
BL contributed to the conception of the study; BL and JW performed the experiment; BL contributed significantly to analysis and manuscript preparation; JW performed the data analyses and wrote the manuscript.
Funding
This work is supported by the National Natural Science Foundation of China (61873057), Education Department of Jilin Province, China (JJKH20200118KJ).
Acknowledgments
We would like to deepest gratitude to the reviewers for their valuable comments, which helped us improve this manuscript.
Conflict of interest
The authors declare that the research was conducted in the absence of any commercial or financial relationships that could be construed as a potential conflict of interest.
Publisher’s note
All claims expressed in this article are solely those of the authors and do not necessarily represent those of their affiliated organizations or those of the publisher, the editors, and the reviewers. Any product that may be evaluated in this article, or claim that may be made by its manufacturer, is not guaranteed or endorsed by the publisher.
References
1
Ali M. Mohammad D. Elham G. (2018). Game Theoretic Spectrum Allocation in Femtocell Networks for Smart Electric Distribution Grids. Energies.11 (7), 1635. 10.3390/en11071635
2
Bahrani L. A. Patra J. C. (2017). Orthogonal Pso Algorithm for Economic Dispatch of Thermal Generating Units Under Various Power Constraints in Smart Power Grid. Appl. Soft Comput.58, 401. 10.1016/j.asoc.2017.04.059
3
Biswas A. Pal T. (2020). A Comparison between Metaheuristics for Solving a Capacitated Fixed Charge Transportation Problem With Multiple Objectives. Expert Syst. Appl.170 (1), 114491. 10.1016/j.eswa.2020.114491
4
Cao J. Pan R. Xia X. Shao X. Wang X. (2020). An Efficient Scheduling Approach for an Iron-Steel Plant Equipped With Self-Generation Equipment Under Time-Of-Use Electricity Tariffs. Swarm Evol. Comput.60, 100764. 10.1016/j.swevo.2020.100764
5
Che Z. H. Chiang T.-A. Lin T.-T. (2021). A Multi-Objective Genetic Algorithm for Assembly Planning and Supplier Selection With Capacity Constraints. Appl. Soft Comput.101, 107030. 10.1016/j.asoc.2020.107030
6
Chengwang X. Lixin D. (2010). Research on Diversity Strategy in Multi-Objective Evolutionary Algorithm. Computer Sci.37 (2), 175–179. 10.3969/j.issn.1002-137X.2010.02.042
7
Cheong K. Li P. Y. Xia J. (2010). Control Oriented Modeling and System Identification of a Diesel Generator Set (Genset). In American Control Conference. 10.1109/acc.2010.5530454
8
El-Sharkh M. Y. Tanrioven M. Rahman A. Alam M. S. (2006). Cost Related Sensitivity Analysis for Optimal Operation of a Grid-Parallel Pem Fuel Cell Power Plant. J. Power Sourc.161, 1198–1207. 10.1016/j.jpowsour.2006.06.046
9
Elnozahy A. Yousef A. M. Abo-Elyousr F. K. Mohamed M. Abdelwahab S. (2021). Performance Improvement of Hybrid Renewable Energy Sources Connected to the Grid Using Artificial Neural Network and Sliding Mode Control. J. Power Electronics.21, 1166–1179. 10.1007/s43236-021-00242-8
10
Hemamalini S. Simon S. P. (2009). Maclaurin Series-Based Lagrangian Method for Economic Dispatch With Valve-point Effect. Iet Generation Transm. Distribution.3, 859–871. 10.1049/iet-gtd.2008.0499
11
Hetzer J. Yu D. C. Bhattarai K. (2008). An Economic Dispatch Model Incorporating Wind Power. IEEE Trans. Energ. Convers.23, 603–611. 10.1109/tec.2007.914171
12
Hja B. Ckk B. Cyc B. Kly B. (2019). A Multi-Objective Evolutionary Approach for Fuzzy Regression Analysis. Expert Syst. Appl.130, 225–235. 10.1016/j.eswa.2019.04.033
13
Jing L. (2018). A Survey on Multi-Objective Evolutionary Algorithms for the Solution of the Environmental/Economic Dispatch Problems. Swarm Evol. Comput.38, 1. 10.1016/j.swevo.2017.06.002
14
Khammassi C. Krichen S. (2020). A Nsga2-Lr Wrapper Approach for Feature Selection in Network Intrusion Detection. Computer Networks.172, 107183. 10.1016/j.comnet.2020.107183
15
Li B. Wang Y. Li J. Cao S. (2018). A Fully Distributed Approach for Economic Dispatch Problem of Smart Grid. Energies.11, 1993. 10.3390/en11081993
16
Li Y. Gao D. W. Gao W. Zhang H. Zhou J. (2020). Double-mode Energy Management for Multi-Energy System via Distributed Dynamic Event-Triggered Newton-Raphson Algorithm. IEEE Trans. Smart Grid.1, 1. 10.1109/tsg.2020.3005179
17
Li Y. Zhang H. Liang X. Huang B. (2019). Event-Triggered-Based Distributed Cooperative Energy Management for Multienergy Systems. IEEE Trans. Ind. Inf.15, 2008–2022. 10.1109/tii.2018.2862436
18
Liang Y. Liu F. Mei S. (2017). Distributed Real-Time Economic Dispatch in Smart Grids: A State-Based Potential Game Approach. IEEE Trans. Smart Grid.9, 4194–4208. 10.1109/TSG.2017.2652919
19
Mk A. Ohm B. Na C. Ma A. (2020). Multi-Objective Optimization and the Effect of the Economic Factors on the Design of the Microgrid Hybrid System - Sciencedirect. Sustainable Cities Soc.65, 102646. 10.1016/j.scs.2020.102646
20
Niknam T. Azizipanah-Abarghooee R. Narimani M. R. (2012). An Efficient Scenario-Based Stochastic Programming Framework for Multi-Objective Optimal Micro-grid Operation. Appl. Energ.99, 455–470. 10.1016/j.apenergy.2012.04.017
21
Prakash V. P. Patvardhan C. Srivastav A. (2020). A Novel Hybrid Multi-Objective Evolutionary Algorithm for the Bi-Objective Minimum Diameter-Cost Spanning Tree (Bi-mdcst) Problem. Eng. Appl. Artif. Intelligence.87, 103237. 10.1016/j.engappai.2019.103237
22
Simonetti H. L. de Assis das Neves F. Almeida V. S. (2021). Multiobjective Topology Optimization With Stress and Strain Energy Criteria Using the Seso Method and a Multicriteria Tournament Decision. Structures.30, 188–197. 10.1016/j.istruc.2021.01.002
23
Sla B. Lp B. Ip A. Fs A. (2020). Multiobjective Optimization of a Continuous Kraft Pulp Digester Using spea2. Comput. Chem. Eng.143(1), 107086. 10.1016/j.compchemeng.2020.107086
24
Tang C. Xu J. Tan Y. Sun Y. Zhang B. (2019). Lagrangian Relaxation With Incremental Proximal Method for Economic Dispatch With Large Numbers of Wind Power Scenarios. IEEE Trans. Power Syst.34, 2685–2695. 10.1109/tpwrs.2019.2891227
25
Wang D. H. Nayar C. V. Wang C. (2010). Modeling of Stand-Alone Variable Speed Diesel Generator Using Doubly-Fed Induction Generator. In The 2nd International Symposium on Power Electronics for Distributed Generation Systems. 10.1109/pedg.2010.5545769
26
Wei Y. Ye Q. Ding Y. Ai B. Tan Q. Song W. (2021). Optimization Model of a Thermal-Solar-Wind Power Planning Considering Economic and Social Benefits. Energy.222, 119752. 10.1016/j.energy.2021.119752
27
Yeh C.-T. (2019). An Improved Nsga2 to Solve a Bi-objective Optimization Problem of Multi-State Electronic Transaction Network. Reliability Eng. Syst. Saf.191, 106578. 10.1016/j.ress.2019.106578
28
Yin L. Gao Q. Zhao L. Wang T. (2020). Expandable Deep Learning for Real-Time Economic Generation Dispatch and Control of Three-State Energies Based Future Smart Grids. Energy.191, 116561. 10.1016/j.energy.2019.116561
29
Yin L. Luo S. Ma C. (2021). Expandable Depth and Width Adaptive Dynamic Programming for Economic Smart Generation Control of Smart Grids. Energy.232, 120964. 10.1016/j.energy.2021.120964
30
Younes Z. Alhamrouni I. Mekhilef S. Reyasudin M. (2021). A Memory-Based Gravitational Search Algorithm for Solving Economic Dispatch Problem in Micro-grid. Ain Shams Eng. J.65 (1), 1985–1994. 10.1016/j.asej.2020.10.021
31
Yushuai L. Gao W. Gao W. Zhang H. Zhou J. (2020). A Distributed Double-Newton Descent Algorithm for Cooperative Energy Management of Multiple Energy Bodies in Energy Internet. IEEE Trans. Ind. Inform.(99), 1. 10.1109/TII.2020.3029974
32
Zhang H. Liang S. (2021). Convergence Analysis of a Distributed Gradient Algorithm for Economic Dispatch in Smart Grids. Int. J. Electr. Power Energ. Syst.134, 107373. 10.1016/j.ijepes.2021.107373
33
Zhang Y. Liu M. (2020). Adaptive Directed Evolved Nsga2 Based Node Placement Optimization for Wireless Sensor Networks. Wireless Networks.26 (10), 1–14. 10.1007/s11276-020-02279-2
34
Zheng F. Wang Z. (2019). Bi-objective Flexible Job Shop Scheduling With Operation Overlapping Costs. IFAC-PapersOnLine.52, 893–898. 10.1016/j.ifacol.2019.11.308
35
Zhou T. Hu Z. Zhou Q. Yuan S. (2021). A Novel Grey Prediction Evolution Algorithm for Multimodal Multiobjective Optimization. Eng. Appl. Artif. Intelligence.100, 104173. 10.1016/j.engappai.2021.104173
36
Zx A. Kai Z. (2021). Multiobjective Multifactorial Immune Algorithm for Multiobjective Multitask Optimization Problems - Sciencedirect. Appl. Soft Comput.107, 107399. 10.1016/j.asoc.2021.107399
Summary
Keywords
economic dispatch (ED) problem, multi-objective optimization (MOO), SPEA2 method, NSGA2, smart grid (SG) power system
Citation
Li B and Wang J (2021) Economic Dispatch Methods for Smart Grid Based on Improved SPEA2 and Improved NSGA2. Front. Energy Res. 9:767721. doi: 10.3389/fenrg.2021.767721
Received
31 August 2021
Accepted
10 November 2021
Published
07 December 2021
Volume
9 - 2021
Edited by
Chandrasekhar Perumalla, Indian Institute of Technology Bhubaneswar, India
Reviewed by
Yushuai Li, University of Denver, United States
Minh Quan Duong, The University of Danang, Vietnam
Updates
Copyright
© 2021 Li and Wang.
This is an open-access article distributed under the terms of the Creative Commons Attribution License (CC BY). The use, distribution or reproduction in other forums is permitted, provided the original author(s) and the copyright owner(s) are credited and that the original publication in this journal is cited, in accordance with accepted academic practice. No use, distribution or reproduction is permitted which does not comply with these terms.
*Correspondence: Bo Li, libo@neepu.edu.cn
This article was submitted to Smart Grids, a section of the journal Frontiers in Energy Research
Disclaimer
All claims expressed in this article are solely those of the authors and do not necessarily represent those of their affiliated organizations, or those of the publisher, the editors and the reviewers. Any product that may be evaluated in this article or claim that may be made by its manufacturer is not guaranteed or endorsed by the publisher.