 Xin Huang1
 Yundong Yu
 Xiaohe Yan
 Nian Liu
- 1Grid Planning and Research Center Guangdong Power Grid Co., Ltd., Guangzhou, China
- 2State Key Laboratory of Alternate Electrical Power System With Renewable Energy Resources, North China Electric Power University, Beijing, China
With the increase in multi-energy loads and renewable energy (RE) penetration, the valley-to-peak value of the electric-heat system is gradually increasing. Although the integrated energy system (IES) and power-to-hydrogen (P2H) technology are widely used to improve energy efficiency and promote the consumption of REs, the dispatch strategies for the IES with P2H to provide integrated demand response (IDR) are not investigated clearly. Thus, this paper presents an optimal dispatch strategy for the IES to provide IDR with multiple P2H technologies. Firstly, a unified mathematical model is built for describing multiple P2H technologies with joint consideration of start/shutdown and ramping constraints. Then, a bi-level P2H-coupled IDR dispatch model is built where the upper level is the IES model including P2H and hydrogen storages with consideration of electric/gas/thermal multi-energy coupling, and the lower level is a flexible user model including transferrable and reduced loads. The Karush–Kuhn–Tucker (KKT) condition and big M methods are used to reformulate the lower-level user model into several complementary relaxation constraints. Then, the whole model is transferred into a solvable single level and linearized model. Finally, the case study shows that the proposed method can improve system flexibility and effectively reduce load peak-to-valley difference. Besides, the addition of P2H and HS into the IES can further optimize the whole economic profits, energy efficiency, and ability to consume REs.
Introduction
With the stern situation of the carbon emission problems, the penetration of renewable resource (RE) is further increasing. However, the increasing volatility makes it more difficult for the system to handle peak-valley regulation only depending on conventional thermal units. The integrated energy system (IES) is a new energy utilization form to combine multiple energy, which can greatly enhance the holistic energy efficiency and comprehensive capability to consume REs. Thus, the IES is recognized as a fit resource to provide integrated demand response (IDR) (Wang et al., 2017; Feng and Zhang, 2018; Jiang et al., 2021; Liu, 2021). However, the needs for IDR are more and more multiple, which makes the IES uneasy to get sufficient economics by providing IDR under current circumstances. Thus, it is necessary to put focus on modeling and optimized dispatching and controlling methods for the IES to provide IDR for earning more profits while enhancing the consumption of REs at the same time.
Normally, a conventional IES modeling method is to build power source models containing electricity, heat, gas, and cold power with their converting equipment. However, the IDR is mainly the needs of loads. Thus, it is necessary to consider the coupling between the power resources and users when modeling the IES. Some researchers propose a method to put some flexible and price-based loads into their model and take the unity as a microgrid (MG) or P2H-coupled IDR dispatch (Liu et al., 2017; Chen et al., 2019; Yuan et al., 2019; Yang et al., 2020a; Liangce., 2021; Zhu et al., 2021; Zhou et al., 2021). However, the peak-valley regulation and RE consumption ability of their model is still insufficient. In contrast, hydrogen energy (HE) is getting more attention due to the fact that the mature technology of power-to-hydrogen (P2H) will help to consume more solar or wind power. Besides, the combination of P2H with hydrogen storage (HS) can effectively make up for the disadvantages of energy storage (ES) in terms of duration, energy storage capacity, and energy density. Thus, the P2H technology can meet the multiple needs of IDR. However, the utilization of P2H technology is inadequate in current IES models. Thus, it is necessary to take research on P2H modeling for it to be put into the IES.
There are currently three mainstream types of P2H technology: alkaline electrolysis cell (AEC), proton exchange membrane electrolysis cell (PEMEC), and solid oxide electrolysis cell (SOEC). Their characters in terms of investment cost, flexible features, and operating efficiency are different. Thus, their capabilities of promoting the consumption of new energy and optimizing the electrothermal coupling of traditional cogeneration are different as well. There are researchers using different types of P2H to respectively cooperate with REs, gas turbine, and fuel cells (Guo et al., 2020; Li et al., 2021; Zhang et al., 2021a). However, their models only use single P2H technology. The multiple renewable-to-hydrogen method is proposed in Zhang et al. (2021b) to enhance the hydrogen production efficiency. However, the costs in their model are rough. The needs for IDR are multiple, and this makes it require multiple forms of combination of different P2H and a more detailed cost model. Thus, the effects of the IES with different P2H needs to be analyzed.
As to the optimization for the IES to provide IDR, normally, the prices of users will affect the operator profits of the IES. Thus, some researchers propose the optimal dispatch and control method for the IES to provide price-based demand response (PDR) (Kim, 2018; Liu et al., 2019; Sumaiti et al., 2020; Yang et al., 2020b). Among their studies, one way to deal with users is to add user profits as constraints (Kim, 2018; Sumaiti et al., 2020). Other ways to consider users are to set both the IES and users as participants to provide IDR (Yang et al., 2020b) or convert the energy consumption of users into energy consumption satisfaction and set it as an optimization goal (Liu et al., 2019). However, they ignore the interaction process between the operator and users. Thus, a study handled the interaction problem from game theory to reach equilibrium from energy aspects (Liu et al., 2020). However, it still ignores the interest coupling between users and the operator.
To solve the problems mentioned above, this paper proposes an optimal dispatch and control strategy of the IES considering multiple P2H to provide IDR. Firstly, an IES model including P2H and HS with consideration of electric/gas/thermal multi-energy coupling is built in the upper level. Then, a model containing users that can be transferred and reduce the electric and heating load is built in the lower level. A bi-level optimized dispatching and controlling model is proposed by introducing operators. Finally, the Karush–Kuhn–Tucker (KKT) condition is used to transform the bi-level model into a single-level optimization problem with equilibrium constraints. The whole model is demonstrated with a case study to verify its effectiveness, economics, and improvement in RE consumption.
The main contributions of this paper are as follows:
1) An “electricity–hydrogen–electricity” conversion model is built with joint consideration of the start/shutdown and operation constraints.
2) Different P2H technologies are compared to analyze their effects on the economics and capability to consume REs of the IES.
3) An “operator–user” interaction framework and optimized dispatch and control strategy are proposed for the IES to provide IDR.
System Model
Integrated Energy System Model in the Upper Level
The manager of the P2H-coupled IDR dispatch model is the operator. Inside the zone, the operator meets the needs of users by controlling their directly administered equipment and responds to system needs by setting energy prices, thereby earning a certain amount of revenue. The energy transmission inside the integrated energy system (IES) is shown in Figure 1. It consists of RE power generation, combined heating and power (CHP) units, regenerative electric boiler, electric energy storage (ES), P2H equipment, hydrogen storage (HS) equipment, and fuel cells. Electricity, gas, and thermal energy are supplied to lower-level users through the internal production and conversion of operators.

FIGURE 1. Energy transmission inside the IES.
The objective function of the operator is to maximize the difference of revenues and costs, which are as follows:
where the revenues are as follows:
where Eq. 2 is the operator’s revenue, which represents the sum of its energy sales and demand response compensation;
The costs are shown as follows:
where the cost of the operator is the addition of electrical and heat purchasing cost of the operator with the operating cost of the CHP unit. Eq. 7 represents the power purchase cost.
The relevant IES internal power balance and equipment operation constraints are as follows:
where Eqs 10–13 represent the power balance constraints of the four nodes in Figure 1. Eqs 14 and 15 are the climbing constraint and the heat-based power constraint, respectively, of the CHP unit, while the upper and lower limits of the unit output are also restricted at the same time. Eq. 16 indicates that the energy price set by the operator should not be higher than the price of the main grid energy grid. Eqs 17–20 describe the specific relationship between the P2H switch state
Users Model in the Lower Level
Users in the lower level will report their own net load to the operator in the upper level. Besides, the flexible load can be appropriately reduced or shifted during demand response. The users adjust their load according to the time-of-use (ToU) tariffs and heat prices within the IES.
The electrical load (EL) of users can be shown as follows:
where, with regard the user as a whole entity, Eq. 30 indicates that the net EL of the system at time t is the sum of the net EL of all users. The own load of users includes fixed load
The objective function of users is to minimize the energy purchasing costs and load decreasing costs, which are as follows:
where Eqs 36 and 37 describe the energy purchase cost
The electricity used by the operator for peak-shaving demand response is the sum of the reduced load
Methodology
Karush–Kuhn–Tucker Condition
For the solution of the bi-level optimization model, the Karush–Kuhn–Tucker (KKT) condition of the lower model is generally used to convert it into the additional constraints of the upper model, and then into a single-level model (Huang et al., 2018; Rui et al., 2018; Yi et al., 2020; Guo et al., 2021).
According to formulas (30)–(40) and the HL formula, write the user model Lagrange function
Linearized Method
Complementary relaxation constraints are nonlinear expressions, and they are converted into linear constraints by introducing binary variables and the big M method (Shigenobu et al., 2017; Yuehao et al., 2018), taking Eq. 41 as an example, and its linear expression is as given in Eqs 43 and 44:
where
Case Study
Basic Data
In this case, the prices of residential EL, HL, power and heat grid, electrical demand response (EDR), and heat demand response (HDR) compensation price are shown in Figure 2. IES internal equipment parameters are shown in Table 1 (Yi et al., 2020; Yang et al., 2020c), among which the power and heat efficiency of fuel cells are all taken as 0.5. The main technical and economic indicators of the three P2H technologies are shown in Table 2. Consider three mainstream P2H technologies: AEC, PEMEC, and SOEC, and their various key technical and economic indicators are shown in Table 2 (Jiarong1, 2021; Kazempoor and Braun, 2014a), respectively.
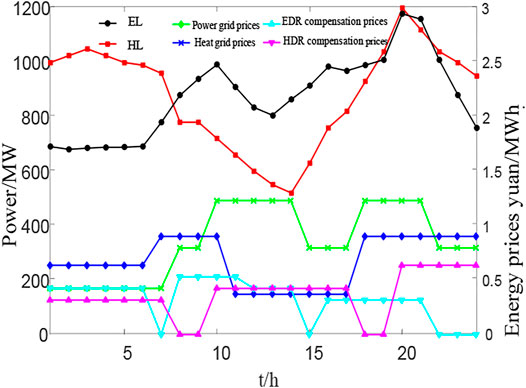
FIGURE 2. Electric/heat load, network price, and compensation price curve.
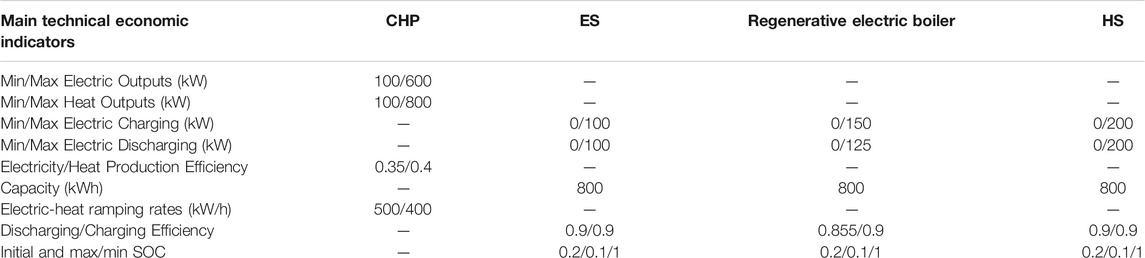
TABLE 1. Unit parameters in the IES.
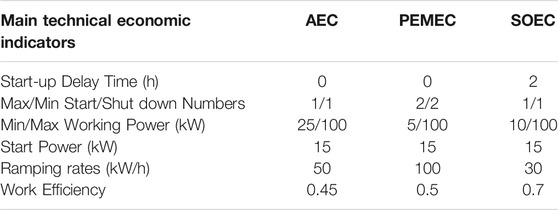
TABLE 2. Techno-economic indices of different P2H technologies.
Optimization Results With/Without P2H
Due to the introduction of P2H and HS, the energy production and consumption capacity of the park has been improved, and the “multi-energy complementary” operation mode of the park has been increased. This section will compare the demand response effects of the IES with or without P2H. Figure 3 shows the time shift of electrical load changes and load reduction before and after demand response with or without P2H. The process takes AEC technology as an example and assumes that the park scenery is completely absorbed.
FIGURE 3. Changes in the electrical load before and after demand response with or without P2H.
As shown in Figure 3, the interactive mechanism proposed in this paper can achieve the peak-shaving and valley-filling effect with or without P2H, and the peak-to-valley difference is reduced by 11.3 and 6.7%, respectively, compared with the situation before DR. The total peak shaving without P2H is 2,342 kW, while the total valley filling is 1,320 kW. It means that the total peak shaving is increased to 2,850 kW with P2H, while the total valley filling is increased to 1,485 kW. Compared with that of with or without P2H, the increasing rates are 21.7 and 12.5%, respectively. The reason for the situation mentioned above situation is that the operator will guide users to change their energy consumption habits and adjust the load flexibly during the corresponding time period due to the compensation price. Besides, the P2H and HS equipment can act as producers or consumers according to system requirements.
The interactive model in this paper can effectively smooth the electric heating load curve of users, which provides a guarantee for improving the economic and energy efficiency of system operation. In addition, the introduction of P2H and hydrogen storage enhances the flexibility of park loads and increases the system’s energy complementary mode.
Figure 4 shows the time shift of the thermal load changes before and after the DR and the load reduction with or without P2H equipment. According to the scheduling instructions, 01:00–07:00 and 20:00–24:00 are the HL reduction period while 10:00–17:00 is the HL filling stage. According to the HL reduction and transferring situation in the figure, with or without P2H, the requirements of peak shaving and valley filling can be met. The peak-to-valley difference is reduced by 39.7 and 29.4%, respectively, compared with the situation before DR. Additionally, the load fluctuation has been greatly improved. Furthermore, the peak-shaving and valley-filling responses are increased by 26.7 and 5.3%, respectively, compared with that of the with or without P2H.
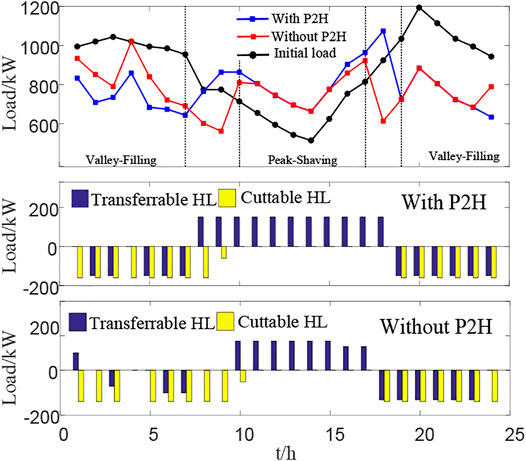
FIGURE 4. Changes in the heat load before and after demand response with or without P2H.
According to the income and costs in the scenario with or without P2H in Table 3, the introduction of P2H has increased the purchase energy of the system to a certain extent, but the hydrogen produced shares part of the cost of the CHP unit and at the same time increases the flexibility of the electric heating load. Increased system demand response revenue, which increased the final total benefit by about 20%.

TABLE 3. System cost and income before and after demand response with or without P2H.
In addition, comparing Figures 3, 4 and, we can see that the three periods of 01:00–06:00, 10:00–11:00, and 16:00–17:00 are the coupling periods for electric energy valley filling/peak shaving and thermal energy valley filling/peak shaving. Taking the 01:00–06:00 period as an example, in order to meet the system’s electricity demand for valley filling, in the absence of P2H, the thermal energy will be reduced due to the limitation of electrothermal coupling and the impact of the compensation price. Thus, the peak-shaving response effect is poor. Although there are electricity and heat storage devices in the system, this process still reflects the limitations of the traditional IES electrothermal coupling. The introduction of P2H and hydrogen energy storage can alleviate this situation, so that the park achieves the desired effect during the peak-shaving/valley-fill coupling period, which shows that the introduction of P2H optimizes the electrical and thermal coupling of the system and improves the ability of system peak shaving and valley filling.
Comparative Analysis of P2H Technology Response Effect
After verifying the effectiveness of P2H in comprehensive demand response, this paper compared three P2H technologies: AEC, PEMEC, and SOEC. According to the technical and economic indicators in Table 2, the three P2H technologies are substituted into the model of this paper for optimization simulation. This process also assumes that the wind and solar output can be completely absorbed. The result of hydrogen production is shown in Figure 5. The operator costs and profits are shown in Table 4. Comparing the results of the table, although SOEC has a start-up delay, it has the largest profits, which is 5,990.1 yuan due to its high efficiency and large peak value. Besides, PEMEC has the fastest climbing rate and has no delay. This means it can reach the peak faster and has no start delay. However, the lower efficiency leads to lower operator profits than those of SOEC. Therefore, without considering the investment cost, SOEC is the best choice as the system electricity hydrogen production equipment.
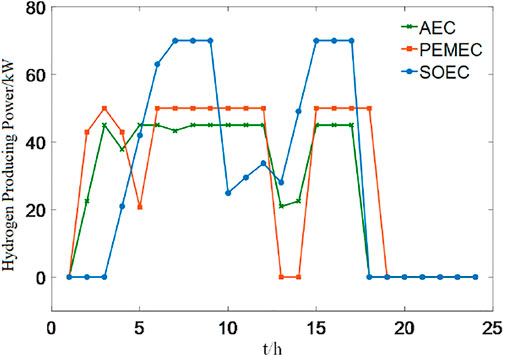
FIGURE 5. Hydrogen production of different P2H technologies.
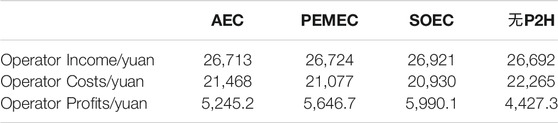
TABLE 4. System cost and income of different P2H technologies.
Under the scenario of surplus wind and solar power, the comparison and analysis results of four situations of AEC, PEMEC, SOEC, and electricity-free hydrogen production are shown in Table 5, which shows the profits and the consumption rates of wind/solar. In the absence of P2H, the ability to consume REs is insufficient due to its limited energy conversion equipment and ES equipment. Thus, the internal “multi-energy complementary” mode of the system is relatively simple, and the consumption rate of wind and solar is only 62.98 and 42.24%, respectively. The optimization results under the introduction of three P2H technologies have greatly improved the consumption rate of wind and solar and operator profits. In general, the comprehensive energy system under the SOEC hydrogen production technology has the best wind and solar consumption, which is 74.04 and 95.49%, respectively, and the highest profit is 13,912 yuan.

TABLE 5. System cost-income and wind-solar consumption of different P2H technologies in Surplus DERs scene.
Conclusion
This paper constructs an IES and user interaction framework containing P2H and HS based on the background of IES optimal dispatch. An IDR optimal dispatch model is established for power source–load–storage interaction. Then, the impact of different P2H technical routes is analyzed. The conclusions are as follows:
1) The introduction of P2H and HS into the IES to participate in comprehensive demand response can improve system flexibility and effectively reduce load peak-to-valley difference. In addition, P2H and HS can further optimize the electric and thermal coupling limitations of traditional units and improve the peak-shaving and valley-filling capabilities of the system at the same time.
2) P2H and HS equipment play a strong role in the optimization of the IES. Combining the load characteristics of the two to participate in IDR will help increase the consumption of wind power and improve the economic profits and energy efficiency utilization of the system.
3) Under the background of the IES participating in IDR, the three main hydrogen production technologies are compared. The results show that the system using SOEC as the main hydrogen production technology has higher wind energy consumption and profits without considering the investment cost.
This paper considers that the interaction framework between the IES and park users is closer to reality. It has been verified that it can improve wind and solar absorption and bring considerable profits. However, the modeling of some equipment in this paper is not specific enough, such as the output characteristics and efficiency characteristics of P2H. The next step is to conduct further research on the refined modeling of energy equipment in the model.
Data Availability Statement
The original contributions presented in the study are included in the article/Supplementary Material, further inquiries can be directed to the corresponding author.
Author Contributions
XH: Conceptualization, software, and writing. MZ: Writing and original draft preparation. JH: Methodology and writing. KW: Writing and investigation. YY: Review and editing. KJ: Data curation and validation. XY: Visualization, validation, and supervision. NL: Validation and supervision.
Conflict of Interest
XH, MZ, and JH were employed by the company Grid Planning and Research Center Guangdong Power Grid Co., Ltd.
The remaining authors declare that the research was conducted in the absence of any commercial or financial relationships that could be construed as a potential conflict of interest.
Publisher’s Note
All claims expressed in this article are solely those of the authors and do not necessarily represent those of their affiliated organizations, or those of the publisher, the editors and the reviewers. Any product that may be evaluated in this article, or claim that may be made by its manufacturer, is not guaranteed or endorsed by the publisher.
References
Chen, Z., Zhang, Y., Tang, W., Lin, X., and Li, Q. (2019). Generic Modelling and Optimal Day-Ahead Dispatch of Micro-energy System Considering the Price-based Integrated Demand Response. Energy 176, 171–183. doi:10.1016/j.energy.2019.04.004
Feng, J., and Zhang, F. (2018). Outlook and Application Analysis of Energy Storage in Power System with High Renewable Energy Penetration. IOP Conf. Ser. Earth Environ. Sci. 121, 052064. doi:10.1088/1755-1315/121/5/052064
Guo, L., Ding, Y., Bao, M., and Zeng, D. (2021). A Bi-level Model for the Bidding Strategy of an Inter-regional Electricity Trading Aggregator Considering Reliability Requirements and Transmission Losses. IEEE Access 9, 13476–13487. doi:10.1109/access.2021.3051654
Guo, W., Liu, P., and Shu, X. (2020). Optimal Dispatching of Electric-thermal Interconnected Virtual Power Plant Considering Market Trading Mechanism. J. Clean. Prod. 279 (54), 123446.
Huang, L., Huang, W., Ge, L., and Liu, L. (2018). Bi-level Optimal Dispatch Model of Active Distribution Network with Demand Response. Electric Power Construction 39 (9), 112–119. doi:10.3969/j.issn.1000-7229.2018.09.014
Jiang, K., Wang, P., Wang, J., and Liu, N. (2021). Reserve Cost Allocation Mechanism in Renewable Portfolio Standard-Constrained Spot Market. IEEE Trans. Sustain. Energ., 1. doi:10.1109/tste.2021.3103853
Jiarong1, L. (2021). Technology Portfolio Selection and Optimal Planning of Power-To-Hydrogen (P2H) Modules in Active Distribution Network. Proc. CSEE 41 (12), 4021–4033. doi:10.13334/j.0258-8013.pcsee.201307
Kazempoor, P., and Braun, R. J. (2014b). Model Validation and Performance Analysis of Regenerative Solid Oxide Cells for Energy Storage Applications: Reversible Operation. Int. J. Hydrogen Energ. 39 (11), 5955–5971. doi:10.1016/j.ijhydene.2014.01.186
Kazempoor, P., and Braun, R. J. (2014a). Model Validation and Performance Analysis of Regenerative Solid Oxide Cells: Electrolytic Operation. Int. J. Hydrogen Energ. 39 (6), 2669–2684. doi:10.1016/j.ijhydene.2013.12.010
Kim, Y.-J. (2018). Optimal Price Based Demand Response of HVAC Systems in Multizone Office Buildings Considering Thermal Preferences of Individual Occupants Buildings. IEEE Trans. Ind. Inf. 14 (11), 5060–5073. doi:10.1109/tii.2018.2790429
Li, Y., Wang, B., Yang, Z., Li, J., and Li, G. (2021). Optimal Scheduling of Integrated Demand Response-Enabled Smart Park Integrated Energy Systems in Uncertain Environment. IEEE Trans. Ind. Applicat., 1. doi:10.1109/tia.2021.3106573
Liangce, H. (2020). Environmental Economic Dispatch of Integrated Regional Energy System Considering Integrated Demand Response - ScienceDirect. Int. J. Electr. Power Energ. Syst. 116, 105525–105525. doi:10.1016/j.ijepes.2019.105525
Liu, N., Tan, L., Zhou, L., and Chen, Q. (2020). Multi-party Energy Management of Energy Hub: A Hybrid Approach with Stackelberg Game and Blockchain. J. Mod. Power Syst. Clean Energ. 8 (5), 919–928. doi:10.35833/mpce.2019.000545
Liu, N., Wang, J., and Wang, L. (2017). Distributed Energy Management for Interconnected Operation of Combined Heat and Power-Based Microgrids with Demand Response. J. Mod. Power Syst. Clean. Energ. 5 (3), 478–488. doi:10.1007/s40565-017-0267-2
Liu, S. (2021). Operational Optimization of a Building-Levelintegrated Energy System Consideringadditional Potential Benefits of Energystorage. Prot. Control. Mod. Power Syst. 6 (1), 4. doi:10.1186/s41601-021-00184-0
Liu, Y., Xiao, L., Yao, G., and Bu, S. (2019). Pricing-Based Demand Response for a Smart Home with Various Types of Household Appliances Considering Customer Satisfaction. IEEE Access 7, 86463–86472. doi:10.1109/access.2019.2924110
Rui, L. I., Wang, W., Chen, Z., and Xuezhi, W. U. (2018). Optimal Planning of Energy Storage System in Active Distribution System Based on Fuzzy Multi-Objective Bi-level Optimization. J. Mod. Power Syst. Clean Energ. 6 (02), 156–169.
Shigenobu, R., Adewuyi, O. B., Bode Adewuyi, O., Yona, A., and Senjyu, T. (2017). Demand Response Strategy Management with Active and Reactive Power Incentive in the Smart Grid: A Two-Level Optimization Approach. AIMS Energy 5 (3), 482–505. doi:10.3934/energy.2017.3.482
Sumaiti, A., Konda, S. R., Panwar, L., Gupta, V., Kumar, R., and Panigrahi, B. K. (2020). Aggregated Demand Response Scheduling in Competitive Market Considering Load Behavior through Fuzzy Intelligence. IEEE Trans. Industry Appl. 56 (4), 4236–4247. doi:10.1109/tia.2020.2988853
Wang, J., Zhong, H., Ma, Z., Xia, Q., and Kang, C. (2017). Review and prospect of Integrated Demand Response in the Multi-Energy System. Appl. Energ. 202, 772–782. doi:10.1016/j.apenergy.2017.05.150
Yang, C., Jiarui, Z., Zheng, W., Tao, W., and Yuting, Z. (2020c). Day-ahead Scheduling Strategy of Wind-PV-CSP Hybrid Power Generation System by Considering PDR. Proc. CSEE 40 (10), 3103–3114.
Yang, H., Li, M., Jiang, Z., and Zhang, P. (2020a). Multi-Time Scale Optimal Scheduling of Regional Integrated Energy Systems Considering Integrated Demand Response. IEEE Access 8, 5080–5090. doi:10.1109/access.2019.2963463
Yang, M., Wang, J., and An, J. (2020b). Day-Ahead Optimization Scheduling for Islanded Microgrid Considering Units Frequency Regulation Characteristics and Demand Response. IEEE Access 8, 7093–7102. doi:10.1109/access.2019.2963335
Yi, Z., Xu, Y., Zhou, J., Wu, W., and Sun, H. (2020). Bi-Level Programming for Optimal Operation of an Active Distribution Network with Multiple Virtual Power Plants. IEEE Trans. Sustain. Energ. 11 (4), 2855–2869. doi:10.1109/tste.2020.2980317
Yuan, D., Lu, Z., Zhang, J., and Li, X. (2019). A Hybrid Prediction-Based Microgrid Energy Management Strategy Considering Demand-Side Response and Data Interruption. Int. J. Electr. Power Energ. Syst. 113, 139–153. doi:10.1016/j.ijepes.2019.05.045
Yuehao, Z., Ke, P., Bingyin, X., Huimin, L., Yuquan, L., and Xinhui, Z. (2018). Bilevel Optimal Dispatch Strategy for a Multi-Energy System of Industrial Parks by Considering Integrated Demand Response. Energies 11 (8), 1–21. doi:10.3390/en11081942
Zhang, K., Zhou, B., Or, S. W., Li, C., Chung, C. Y., and Voropai, N. I. (2021b). Optimal Coordinated Control of Multi-Renewable-To-Hydrogen Production System for Hydrogen Fueling Stations. IEEE Trans. Ind. Applicat., 1. doi:10.1109/tia.2021.3093841
Zhang, Z., Wang, C., Lv, H., Liu, F., Sheng, H., and Yang, M. (2021a). Day-Ahead Optimal Dispatch for Integrated Energy System Considering Power-To-Gas and Dynamic Pipeline Networks. IEEE Trans. Ind. Applicat 57 (4), 3317–3328. doi:10.1109/tia.2021.3076020
Zhou, B., Zou, J., Yung Chung, C., Wang, H., Liu, N., Voropai, N., et al. (2021). Multi-microgrid Energy Management Systems: Architecture, Communication, and Scheduling Strategies. J. Mod. Power Syst. Clean Energ. 9 (3), 463–476. doi:10.35833/mpce.2019.000237
Keywords: power-to-hydrogen, demand response, integrated energy system, interactive framework, bi-level optimization
Citation: Huang X, Wang K, Zhao M, Huan J, Yu Y, Jiang K, Yan X and Liu N (2022) Optimal Dispatch and Control Strategy of Integrated Energy System Considering Multiple P2H to Provide Integrated Demand Response. Front. Energy Res. 9:824255. doi: 10.3389/fenrg.2021.824255
Received: 29 November 2021; Accepted: 08 December 2021;
Published: 31 January 2022.
Edited by:
Bin Zhou, Hunan University, ChinaReviewed by:
Yichen Shen, University of Bath, United KingdomDongdong Zhang, Guangxi University, China
Pengfei Zhao, Chinese Academy of Sciences (CAS), China
Copyright © 2022 Huang, Wang, Zhao, Huan, Yu, Jiang, Yan and Liu. This is an open-access article distributed under the terms of the Creative Commons Attribution License (CC BY). The use, distribution or reproduction in other forums is permitted, provided the original author(s) and the copyright owner(s) are credited and that the original publication in this journal is cited, in accordance with accepted academic practice. No use, distribution or reproduction is permitted which does not comply with these terms.
*Correspondence: Xiaohe Yan, eC55YW5AbmNlcHUuZWR1LmNu