- 1Nanchang Hangkong University, Nanchang, China
- 2National Network Jiangxi Electric Power Co. Ltd., Nanchang, China
- 3China Power Construction Group Jiangxi Electric Power Construction Co. Ltd., Nanchang, China
The traditional method of detecting fault current based on threshold judgment method is limited by the current size and is easily disturbed by noise, and it is difficult to adapt to the arc ground fault detection of the distribution network. Aiming at this problem, this paper proposes a single-phase arc-optic ground fault identification method based on waveform subsequence splitting fault segmentation, combined with three-phase voltage-zero sequence voltage waveform feature extraction clustering. First of all, the waveform fault segment is segmented and located, secondly, the characteristic indexes of the time domain and frequency domain of the combined three-phase voltage-zero sequence voltage waveform are established, and the multidimensional feature distribution is reduced by the principal component analysis method, and finally, the characteristic distribution after the dimensionality reduction is identified by the K-means clustering algorithm based on the waveform subsequence. Experimental results show that the arc light grounding fault identification method proposed in this paper achieves 97.12% accurate identification of the test sample.
1 Introduction
According to the survey, more than 80% of the power outage losses are caused by distribution network failures, so the fault diagnosis of distribution networks has always been the research object of power supply units. Among them, arc light grounding fault is not easy to find and the harm is huge, and the mechanism is complex, which is a category of grounding faults that are difficult to detect. Therefore, it is of great significance to propose a reliable and efficient arc-ray grounding identification algorithm for the operation of the distribution network.
The traditional arc-optic grounding fault identification method of the distribution network is based on the steady-state or transient electrical parameters and the set threshold (Chen et al., 2021), and in the fault identification method based on the transient electrical parameters, the characteristic parameters of the typical fault type are first extracted, including wavelet transform (WT) (Qin et al., 2018; Lin et al., 2019; Wei et al., 2020a), empirical mode decomposition (EMD) (Guo et al., 2019; Cai and Wai, 2022), and S transformation (ST) (Peng et al., 2019); Then, the arc ground fault is classified and identified by the pattern recognition method, mainly including the neural network method (Siegel et al., 2018; Du et al., 2019a), the Support Vector Machine (SVM) (Xia et al., 2019; Dang et al., 2022), the fuzzy control method (Zeng et al., 2016), the clustering (Wang et al., 2015), etc., in addition, the high-precision current transformer can be used to improve the fault identification ability (Paul, 2015), but the detection cost is also significantly increased.
Reference (Mishra et al., 2016) classifies arc ground faults through fault data, extracts five fault features, and inputs them into a fuzzy inference system for identification. Although the identification effect is remarkable, the establishment of fuzzy control rules relies on historical experience, and the ability to learn independently is poor. Reference (Gadanayak and Mallick, 2019; Wang et al., 2021) combined Variational Mode Decomposition (VMD) and support vector machine to identify arc ground faults. Different eigenmode functions were obtained by decomposing the collected ground fault signals by VMD, and the faults were extracted. The typical characteristics of the signal are found, the displacement entropy with the greatest contribution is found, and the arc ground fault is identified by the support vector machine. However, support vector machines need a large number of samples for training, and mode aliasing effects are prone to occur during empirical mode decomposition, and the parameters of variational mode decomposition need to be selected manually. Reference (Guo M. F. et al., 2018) proposed a ground fault detection method based on wavelet transform and Convolutional Neural Network (CNN). The time-frequency components were obtained through wavelet transform, and then each component was normalized. Identify fault features. However, the selection of wavelet transform basis functions has limitations, and the neural network needs to be trained on a large number of samples. Reference (Wei et al., 2020b) proposed a generalized S-transform with variable factors to detect ground faults. This method has stronger adaptability and higher detection accuracy, but local over-fitting is prone to occur in the S-transform calculation process. Reference (Zhang et al., 2019) proposed a fault identification method based on waveform feature extraction and matrix analysis and clustering. This method can identify different grounding resistances, but the efficiency and accuracy of the algorithm need to be improved.
For this reason, this paper proposes a time series characteristic analysis method combining three-phase voltage and zero-sequence voltage waveforms to solve the problems that the threshold value setting cannot be automated and requires a large number of samples training in the traditional detection of electrical parameters and threshold values. At the same time, in view of the problems of traditional waveform analysis feature dimension redundancy and large amount of calculation, a method of arc grounding fault identification for distribution network based on segmentation-clustering is proposed.
The main contributions of this paper are:
(1) Considering that there are developing faults in the field data, the direct use of the wave recorder data will cause the eigenvalues of the arc ground fault to be confused with other types of fault data. Therefore, a waveform subsequence segmentation method based on the sliding t-test is proposed to achieve the same Segmentation of different types of fault data in recorded wave data.
(2) A fault identification model combining the time series feature extraction of three-phase voltage and zero-sequence voltage waveforms is established. Through the analysis of experimental data, the boundary conditions of arc ground fault and other faults are obtained, which effectively improves the traditional feature extraction based on current analysis. The problem.
The first part of this paper analyzes the waveform characteristics based on waveform subsequence segmentation, the second part proposes an arc-flash grounding fault identification algorithm based on segmentation-clustering, the third part carries out numerical example simulation and analysis, and finally gives the conclusion.
2 Waveform feature analysis based on fault waveform subsequence segmentation
2.1 Waveform subsequence segmentation
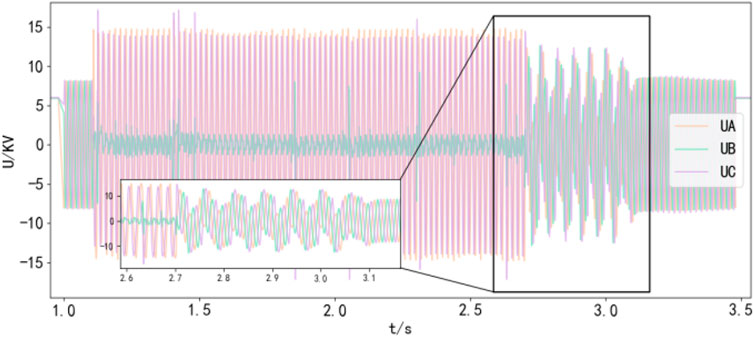
The data source of the on-site arc ground fault is mainly the recorded data of the fault recorder. When a fault occurs, the fault recorder can automatically and accurately record the changes of various electrical quantities in the process before and after the fault occurs. Due to the development of ground faults, it is possible to evolve from one type of fault to another. As shown in Figure 1, no fault occurred in the time period of 1.0 s–1.08 s; arc ignition occurred many times in the time period of 1.08 s–2.7 s; resonance fault occurred in the time period of 2.7 s–3.1 s; 3.1 s–3.5 return to normal within s time period.
If the data analysis of the fault segment of the wave recorder is used directly, the analysis of fault characteristics may be confused, so each fault needs to be segmented. To this end, this paper proposes a fault subsequence segmentation method based on sliding t-test. Compared with other sequence segmentation algorithms, this method is simple in algorithm and less computationally expensive. Due to the strong periodicity of the fault voltage waveform, the parameter selection problem of the sliding t-test becomes simple, and the selected parameters are applicable to all the recorder data.
Sliding t-test tests for mutation by calculating whether the difference between the mean of two groups of samples is significant, t follows a distribution with
In the formula (Du et al., 2019b):
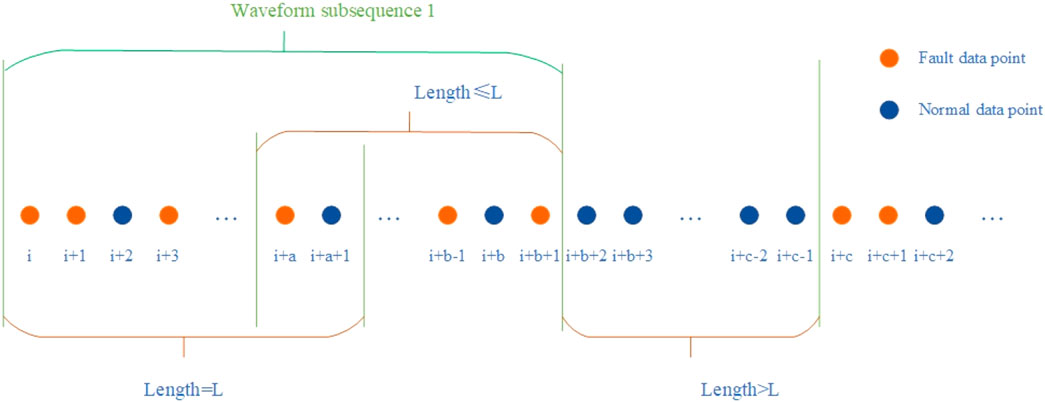
As shown in Figure 2, when the sliding t-test is performed on the fault recorder data in this paper, there is at least a segment of non-fault sample points before the fault sample point i and the length is at least L, the length of the sequence (i, i+a+1) is L, the length of the sequence (i+a, i+b+1) is less than or equal to L, the length of the sequence (i+b+1, i+c-1) is greater than L and all are normal sample points, the sequence (i, i+b+1) is a waveform subsequence. In this paper, the following considerations are made for subsequence segmentation:
(1) Sequence (i, i+a+1), that is, a sequence of length L at the beginning of the fault is temporarily stored as the initial waveform subsequence.
(2) If there are fault points in the sequence (i+a, i+b+1), that is, taking the last fault point of the waveform subsequence as the starting point and there are fault points in the supplementary sequence of length L, all the fault points before the last fault point of the supplementary sequence are merged with the initial waveform subsequence, and the initial waveform subsequence is replaced. If there is no fault point within the supplementary sequence, the initial waveform subsequence is split into the final waveform subsequence and labeled.
(3) Repeat step (2) until all waveform subsequences are segmented.
2.2 Waveform feature analysis
2.2.1 Time domain waveform characteristics
Time Domain Analysis enables intuitive and accurate analysis of systems in the time domain. For the arc grounding system, time domain indicators such as mean value, variance, peak-to-peak value and kurtosis coefficient are selected for analysis. The mean shows the average level of the data, the variance measures the degree of dispersion of the data, the peak-to-peak value shows the difference between the highest value and the lowest value of the signal in a period, and the kurtosis coefficient reflects the distribution characteristics of the vibration signal. The calculation of the kurtosis coefficient when the fourth power is used, the influence of noise can be reduced and the signal-to-noise ratio can be improved.
Through the time domain feature extraction of arc ground fault, ferromagnetic resonance fault and normal conditions, the time domain eigenvalues of the three types of data shown in Table 1 are obtained. In the table, the zero-sequence voltage variance of arc ground fault is obviously larger than that of ferromagnetic resonance fault and normal condition. And the mean value of the normal situation is closer to zero, the zero-sequence voltage kurtosis value of the normal situation is the largest, and it is distinguished from the other two faults. The peak-to-peak value of the normal case is close to zero, and the peak-to-peak value of the three-phase voltage of the arc ground fault is larger than the other two cases except for the faulty phase.
The variances and peak-to-peak values of zero sequence voltages and three-phase voltages of the four characteristics can distinguish arc grounding faults, ferromagnetic resonance faults and normal conditions.
2.2.2 Frequency domain waveform characteristics
Frequency domain analysis is a method of evaluating system performance using graphical analysis in the frequency domain. It can not only reflect the steady-state performance of the system, but also can be used to study the stability and transient performance of the system. For the arc grounding system, frequency domain time scales such as odd harmonic content, spectral gravity center frequency, spectral frequency standard deviation, and spectral root mean square frequency are selected for analysis. The harmonic content is the amount obtained by subtracting the fundamental wave component from the alternating current. The voltage in the power grid is mainly 50 Hz. In some cases, a higher frequency signal will appear. When the frequency of the harmonic signal is the fundamental wave signal when the frequency is an odd multiple, the harmonic is called an odd harmonic. The center of gravity frequency can describe the frequency of the signal component with larger components in the frequency spectrum of the signal, and reflects the situation of the signal power spectrum. The frequency standard deviation describes the spread of the power spectrum energy distribution. The root mean square frequency is the arithmetic square root of the mean square frequency, which can be regarded as the radius of inertia.
The frequency domain eigenvalues of the three types of data shown in Table 2 are obtained by extracting the frequency domain features for arc ground fault, ferromagnetic resonance fault and normal conditions. The third harmonic content of the normal condition in the table is significantly higher than the other two fault conditions. Under normal conditions, the centroid frequency of zero-sequence voltage, the standard deviation of spectral frequency and the frequency of spectral root mean square are the largest. The frequency of the spectral center of gravity of the arc ground fault is slightly larger than that of the ferromagnetic resonance fault.
The spectral centroid frequency, spectral frequency standard deviation, and spectral root mean square frequency of the frequency domain waveform feature can clearly distinguish the three cases. The arc ground fault, ferromagnetic resonance fault and the normal zero-sequence voltage odd harmonic content can also distinguish the three cases.
In Algorithm 1, input the recorder data CFG file, and the sliding step. After initialization, the t index is calculated. When the t index exceeds the significant interval, it is saved in A, and then the fault points in A are merged and subsequences are divided. Finally, the time domain and frequency domain eigenvalues of each subsequence are extracted, and the subsequence and the eigenvalue matrix are output.
Algorithm 1. Subsequence segmentation and feature extraction.

3 Arc ground fault identification algorithm based on segmentation-clustering
3.1 Feature dimensionality reduction based on principal component analysis
The extraction of key feature indicators is an effective method for dimensionality reduction of high-dimensional feature vectors, that is, through data correlation analysis, the original data is converted into effective parameters that are independent of each other and contain the main information. The principal component analysis method uses the knowledge of linear algebra to reduce the dimensionality of the data, and converts multiple variables into a few irrelevant comprehensive variables to more comprehensively reflect the entire data set. The comprehensive variables are called principal components, and the principal components are not correlated with each other, that is, the information they represent does not overlap. This method can effectively reduce the parameter redundancy and improve the efficiency of fault diagnosis (Wang et al., 2015). The steps of principal component analysis are as follows:
1) Input m pieces of n-dimensional data, and form the original data into a matrix
2) Zero-means each row of matrix
3) Calculate the covariance matrix
In the formula:
4) Calculate the eigenvalues and eigenvectors of the covariance matrix, sort the eigenvalues from large to small, select the largest N, and then use the corresponding N eigenvectors as row vectors to form the eigenvector matrix P.
5) Transform the data into a new space constructed by N feature vectors, that is,
3.2 Cluster analysis model based on K-means
The K-means algorithm is a typical distance-based clustering algorithm, and the distance is used as an evaluation index for similarity, that is, the closer the distance between two samples, the greater the similarity.
First determine the value of k, which means the number of aggregated classes.
Second, randomly select k initial cluster centers. Randomly select k centroid vectors
In the formula:
Then assign sample points. Calculate the distance between the sample
In the formula:
Repeat the steps of allocating sample points and updating the cluster center until all the sample points are allocated, the category of all the sample points does not change or the number of iterations reaches the specified maximum value, the clustering is stopped. Output the clusters where clustering is done.
In Algorithm 2, the eigenmatrix is input first, then the mean value is removed, and the covariance matrix, eigenvalues, and eigenvectors are calculated. Then reduce the dimension of the original feature matrix. Then initialize the centroid, and when there are still cluster assignment results that change, calculate the distance between the centroid and the sample point, assign the sample point, and update the centroid. Finally, output the dimension reduction matrix, each cluster data and the cluster center.
Algorithm 2. Feature dimensionality reduction and clustering.

3.3 A fault identification algorithm based on segmentation and clustering of waveform subsequences
Combined with the above analysis, this paper proposes an arc-ground fault identification algorithm for distribution network based on waveform subsequence segmentation-clustering. The fault identification process is as follows:
1) Step 1: Valid segment data extraction.
After the data is input, the data needs to be preprocessed to extract the data at the moment of failure, that is, the valid segment data.
2) Step 2: Segment and extract the waveform subsequence sequence.
Using the method proposed in Section 1.1, the waveform subsequences are segmented.
3) Step 3: Feature value and feature vector extraction.
The sub-waveform sequence is analyzed in time domain and frequency domain, and the characteristic index proposed in Section 1.2 is calculated and combined into a characteristic vector.
4) Step 4: Feature dimensionality reduction.
For the eigenvalues and eigenvectors extracted in the third step, the dimension is high, and most of the information is redundant, so the principal component analysis method proposed in Section 2.1 is used to reduce the dimension of the data, and the original ten-dimensional data is reduced to three-dimensional.
5) Step 5: K-means clustering.
The clustering algorithm proposed in Section 2.2 is used to perform cluster analysis on the dimensionally reduced 3D data. In this paper, the value of k is selected as 3, that is, the data is clustered into three categories.
6) Step 6: Cluster data output.
7) Step 7: Identify the fault category.
3.4 Arc ground fault safe boundary model
The arc ground fault safety boundary refers to the arc ground fault data: If the fault data falls within the safety boundary, the fault data can be accurately identified as the fault category; if the fault data falls on the safety boundary or outside the safety boundary, there are the fault data may be identified as other types of faults. And the arc ground fault safety boundary can be effectively distinguished from other types of faults.
The center of the arc ground fault safety boundary is the cluster center of the arc ground fault type data after clustering, and the equatorial radius and polar radius of the safety boundary are shown in Eq. 6.
In the formula, a, b, and c are the radius of one equator and the radius of two poles, respectively,
In Algorithm 3, the safety boundary model is established by formula Eq. 6 and the arc ground fault clustering center
Algorithm 3.

4 Case study
4.1 Experimental conditions
The experimental data comes from the arc grounding physics experiment platform, which includes power supply subsystem, circuit subsystem, fault simulation subsystem and measurement subsystem. Figure 3A shows the power supply subsystem and the circuit subsystem.
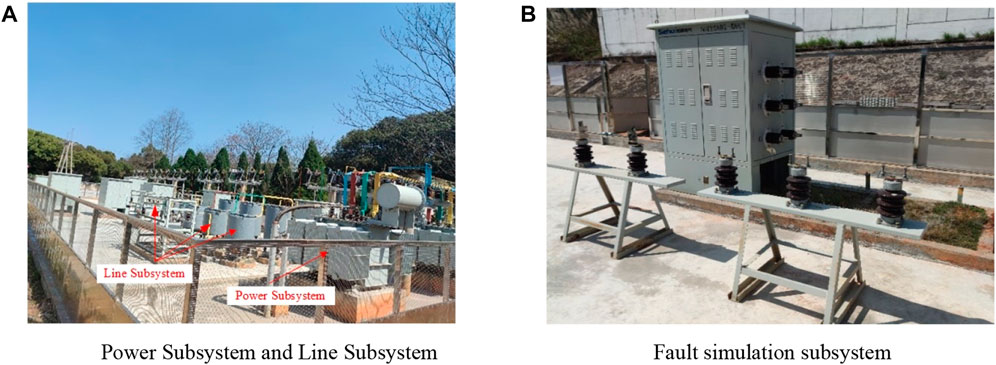
FIGURE 3. Physical experiment platform. (A) Power Subsystem and Line Subsystem. (B) Fault simulation subsystem.
In the training samples selected in the experiment: 540 data of arc ground fault (including high resistance ground fault) and 18 data of ferromagnetic resonance fault; in the test sample: 75 data of arc ground fault (including high resistance ground fault), ferromagnetic resonance two fault data. As shown in Figures 4A–C are several typical arc ground faults, ferromagnetic resonance faults and general ground faults of the test samples, respectively.
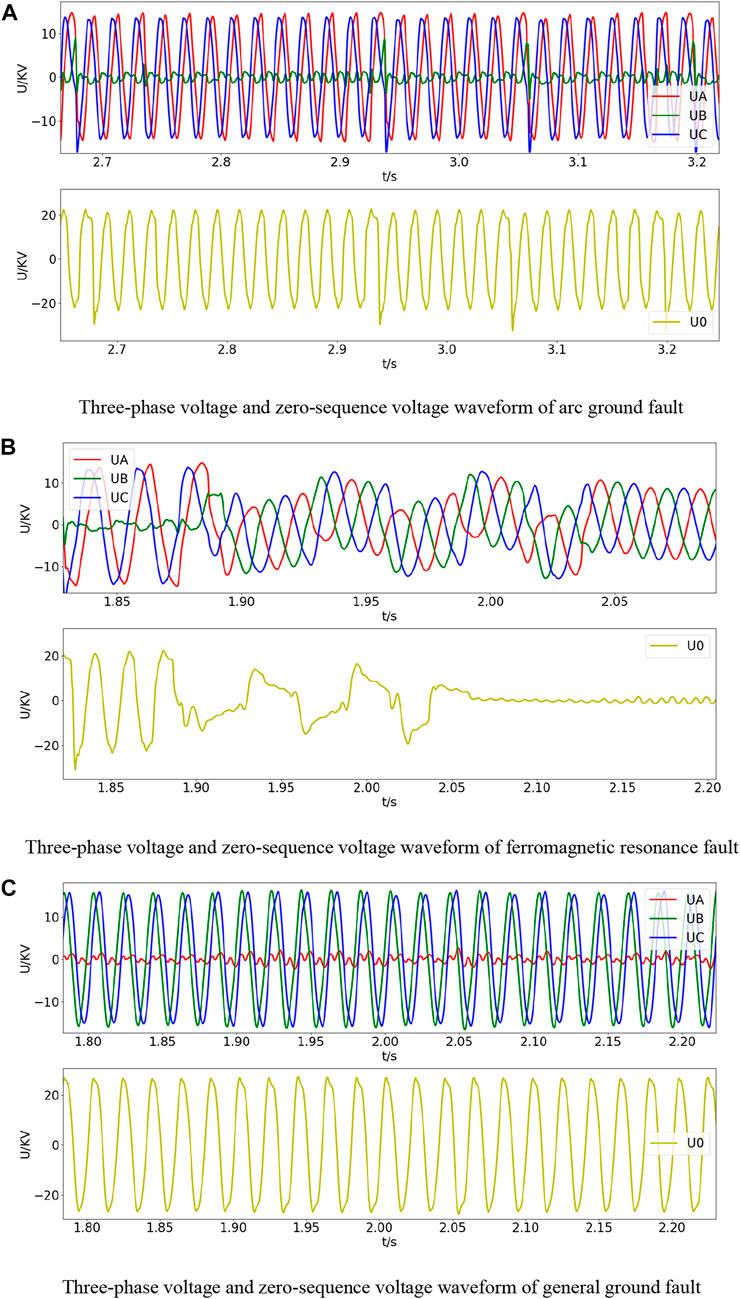
FIGURE 4. Typical failure diagram of the test sample. (A) Three-phase voltage and zero-sequence voltage waveform of arc ground fault. (B) Three-phase voltage and zero-sequence voltage waveform of ferromagnetic resonance fault. (C) Three-phase voltage and zero-sequence voltage waveform of general ground fault.
4.2 Analysis of waveform feature parameter distribution results
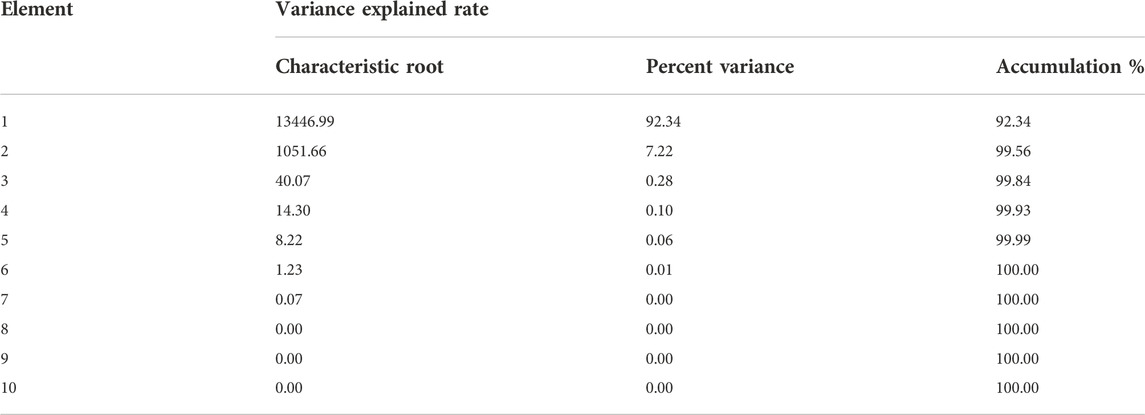
Combined with the waveform feature analysis proposed in Section 1.2, the time domain features and frequency domain features are accumulated to obtain ten eigenvalues, and a large number of features have redundancy, so feature dimension reduction is performed. The variance explanation rate of each feature index obtained by the principal component analysis method is shown in Table 3.
According to the cumulative variance contribution rate shown in Table 1, the cumulative explanation rate of the first three principal components is 99.84%, so the first three principal components can be considered to represent the original variables.
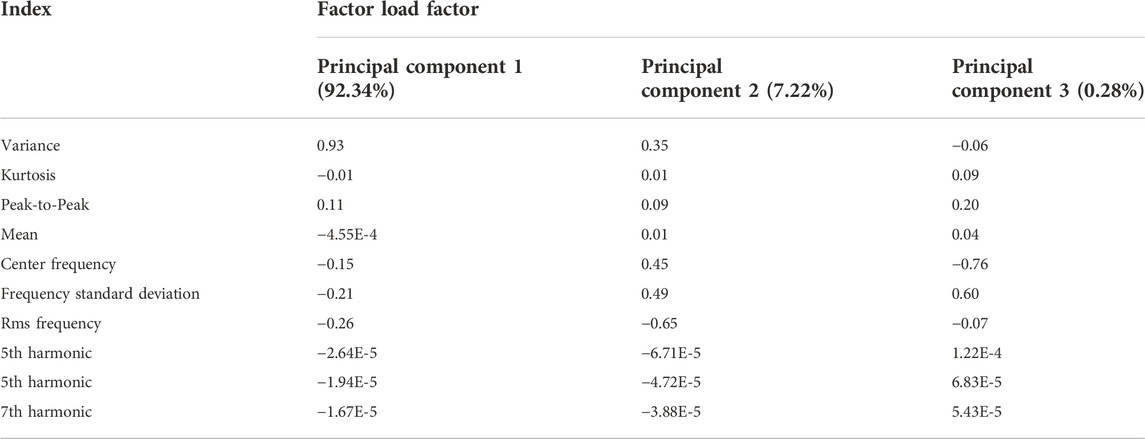
Table 4 is the eigenvector table. The indicators in the table are the standardized variance, kurtosis, peak-to-peak value, mean value, barycentric frequency, frequency standard deviation, root mean square frequency, third harmonic, fifth harmonic, and seventh harmonic. It can be seen from the table that the principal component 1 has a large positive correlation with the variance; the principal component 2 has a large negative correlation with the root mean square frequency, and has a large positive correlation with the frequency standard deviation and the center of gravity frequency; There is a negative correlation with the frequency standard deviation and a large positive correlation with the frequency standard deviation.
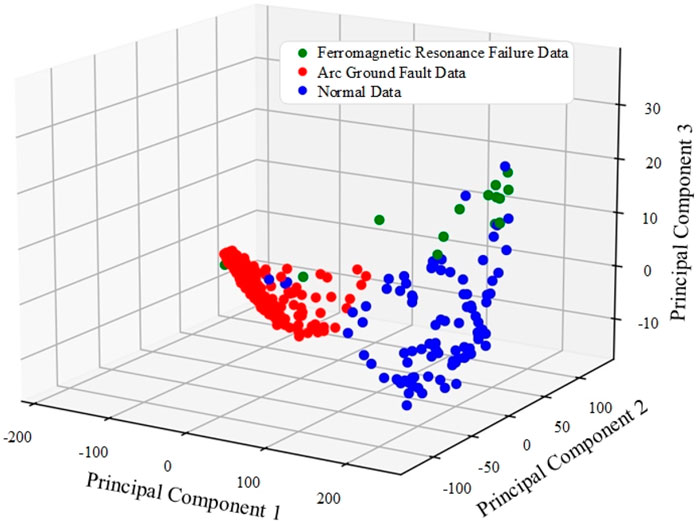
The waveform characteristic parameter distribution of the training samples is shown in Figure 5. In the figure, the arc ground fault data is concentrated in the vicinity of (−50, 15, 0), while the ferromagnetic resonance fault data and normal data are scattered in (125, 50, 0), respectively. 15) and (200,-75,-10). Therefore, the data after dimensionality reduction can better describe the arc ground fault, and can effectively distinguish the arc ground fault from the other two faults.
4.3 Model identification verification
1) After the model is trained with training samples, the distance from each sample to each cluster center is shown in Table 5, and the last column is the fault type discrimination. Type 1 is arc ground fault, type 2 is ferromagnetic resonance fault, and type 3 is normal condition. Calculate the distance between the training data and each cluster center, and divide the data into the closest classes.
2) After the test sample data is identified by the model, the distance and attribution type of each test sample from each cluster center are shown in Table 6. It can be concluded from the table that the sample points are always closer to one of the cluster centers, and farther away from the other two types of sample centers. Type 1 is arc ground fault, type 2 is normal, and type 3 is ferromagnetic resonance fault.
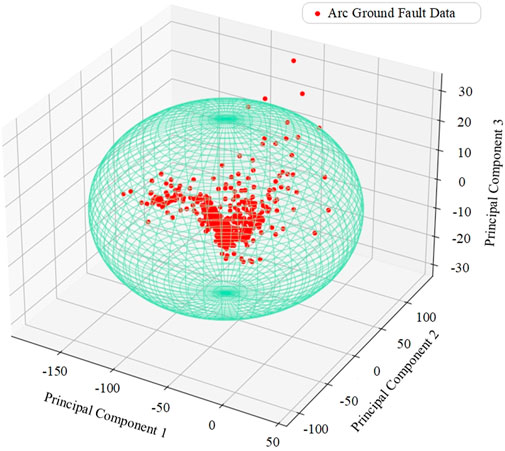
3) Combined with the safety boundary proposed by Eq. 6, the equatorial radius and polar radius of the safety boundary are calculated. After calculation, the equatorial radius of the safety boundary is 111.0 and 119.5, and the polar radius is 29.7. The cyan spherical area in Figure 6 is the safety boundary of arc ground fault, and the red sample points are the data classified as arc ground fault after clustering. It can be seen from the figure that most of the arc ground fault data falls within the safety boundary, that is, the safety boundary can more accurately distinguish arc ground faults from other faults.
4) For the arc grounding system of the distribution network, the identification of high resistance grounding faults is a difficult point (Kavaskar and Mohanty, 2019). The arc high-resistance fault has obvious intermittent, the phase voltage is basically unchanged, the zero-off time is long, and it lasts for several cycles intermittently. At the same time, the zero-sequence voltage has nonlinear distortion (Zhang et al., 2021). The identification of single-phase ground fault is mainly realized by detecting the zero-sequence voltage. When the zero-sequence voltage suddenly increases, it is judged that a ground fault occurs.
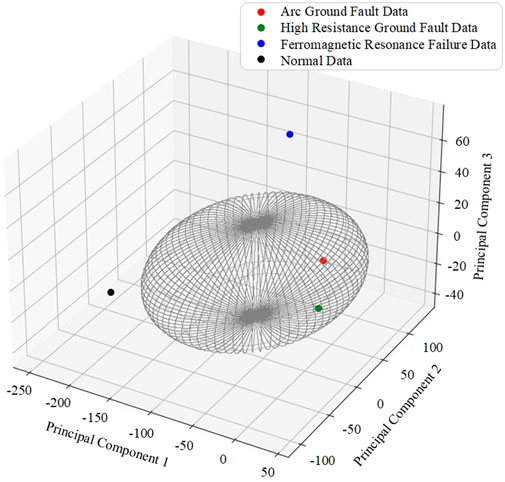
For arc high-resistance grounding faults, the method proposed in this paper is used to segment the fault waveform sub-sequence, extract features, and reduce the dimension to obtain the principal component components of four types of samples after dimension reduction as shown in Table 7. Among them, the high-resistance grounding samples And the low resistance ground samples are within the safety boundary, while the normal case and ferromagnetic resonance fault samples are outside the safety boundary. Combining with Figure 7, it is obvious that the method proposed in this paper can also accurately identify the arc high-resistance ground fault.
4.4 Algorithm comparison
4.4.1 Segmentation accuracy comparison
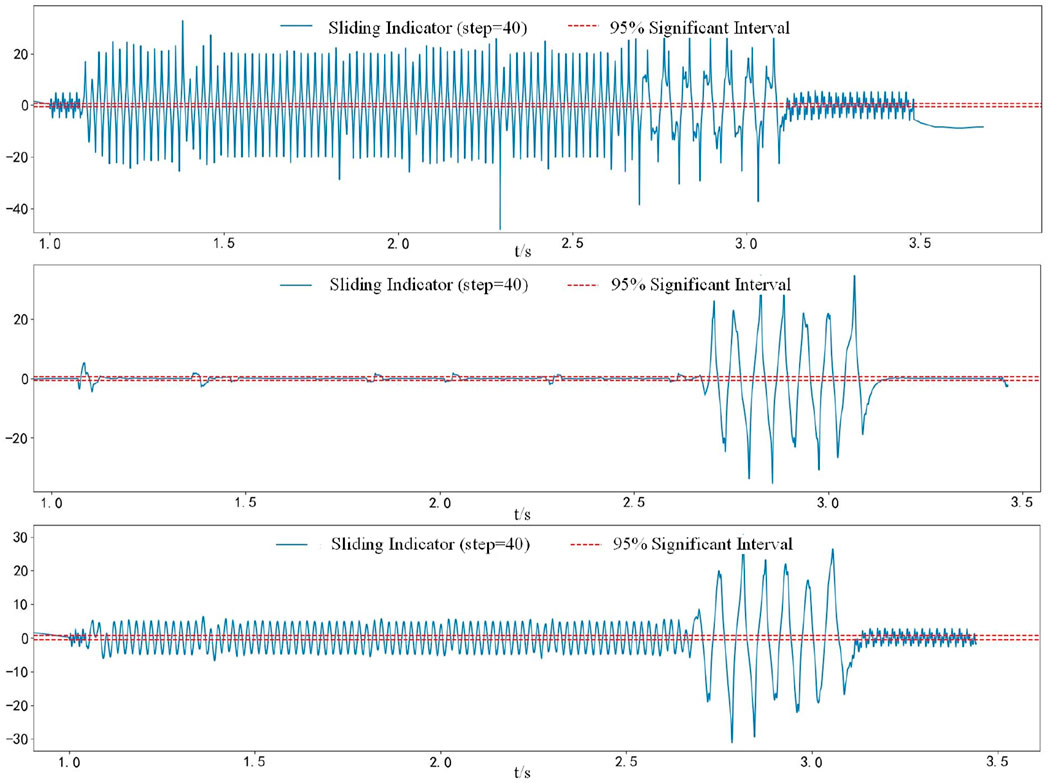
Through the above analysis, the algorithm proposed in this paper is compared with the wavelet transform algorithm and the variational mode decomposition algorithm. The waveform subsequence segmentation algorithm proposed in this paper only needs to determine the sliding step size L and the 95% significant interval range when selecting parameters. Since the fault recorder data has strong periodicity, and the period is 80, L = 80 is selected. For the selection of L, the detection effects corresponding to different L values are shown in Figure 8. The figure shows the detection effect of the sliding t-test when L = 40, 80, and 120, respectively. When L = 40 and L = 120, the entire recorded wave data is judged as fault, when L = 80, the fault data can be detected accurately.
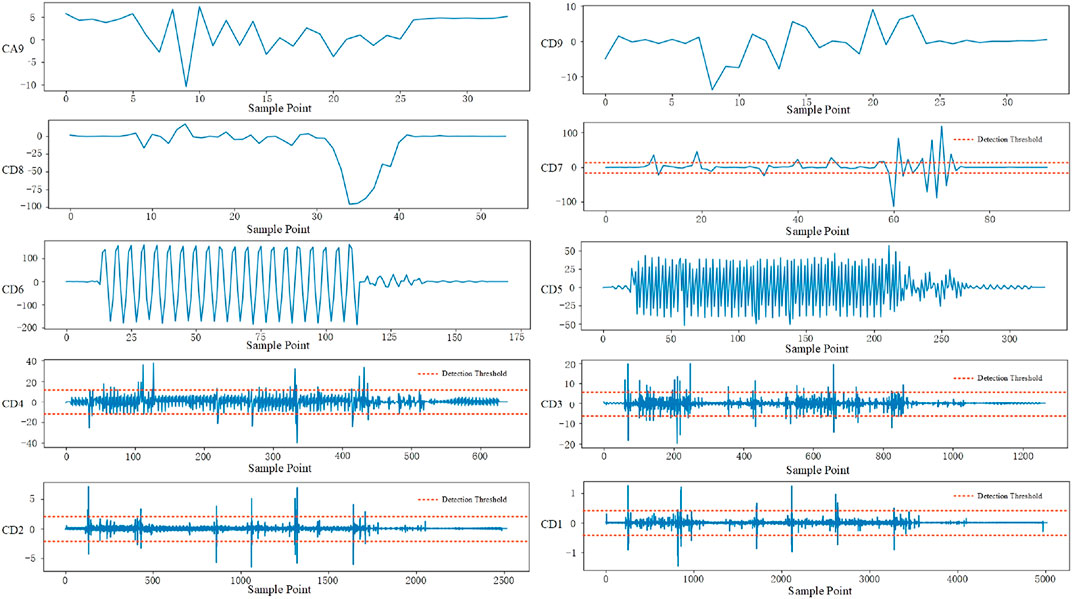
Wavelet transform can decompose the signal into a series of signal sub-sequences, which has the characteristics of multi-resolution analysis. In practical applications, discrete wavelet transform with less computational complexity and higher accuracy is often used. The Symlet wavelet function is an approximately symmetrical wavelet function after the improvement of the db function. The support range of the symN wavelet is 2N-1, the vanishing moment is N, and it also has good regularity. Compared with the dbN wavelet, the wavelet is consistent with the dbN wavelet in terms of continuity, support length, filter length, etc., but the symN wavelet has better symmetry, that is, it can reduce the time to analyze and reconstruct the signal to a certain extent. Phase distortion. For the fault recorder data, this paper selects the wavelet function sym8 as the fundamental wave function, and the number of decomposition layers is 9. The decomposition results are shown in Figure 9. The figure is the approximate coefficient CA9 and the detail coefficient CD9-CD1 after wavelet transformation. The threshold detection is performed on the five detail coefficients CD1 and CD2 with obvious fault characteristics. As the threshold increases, the arc ground fault detection is more obvious, but only the start time of the fault can be found. When the waveform subsequence is divided, the end time of the fault needs to be set as the start time of the next fault. In CD7, the fault detection is more accurate, but the arc ground fault and ferromagnetic resonance fault between the sampling points (60, 80) cannot be accurately divided, and it needs to be handled manually. If the threshold is increased, some arc ground faults cannot be accurate detection.
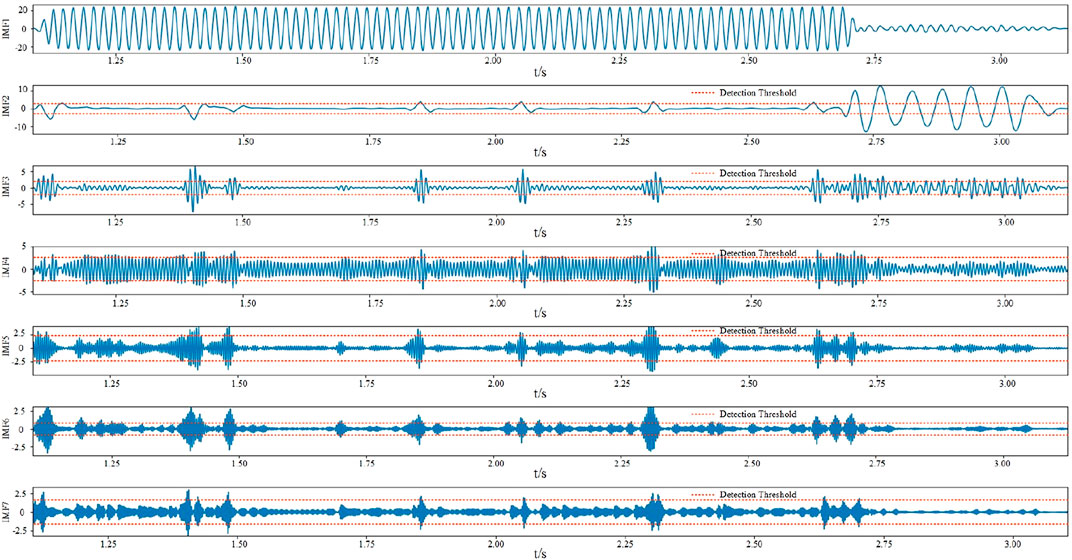
The variational modal decomposition method is an adaptive, completely non-recursive modal variation and signal processing method, which is suitable for non-stationary sequences, and decomposes to obtain relatively stable subsequences containing multiple different frequency scales. The VMD algorithm decomposes the original non-stationary signal
Table 8 compares the detection and segmentation of faults by the method proposed in this paper, wavelet transform and variational modal decomposition for different experimental samples. Variational modal decomposition can only detect ferromagnetic resonance faults, and wavelet transform cannot accurately detect general ground faults. The main reason is that the end point of arc ground fault cannot be accurately detected during wavelet transform detection. Arc ground faults start as an end point, resulting in general ground faults being divided into arc ground faults.
4.4.2 Comparison of recognition accuracy
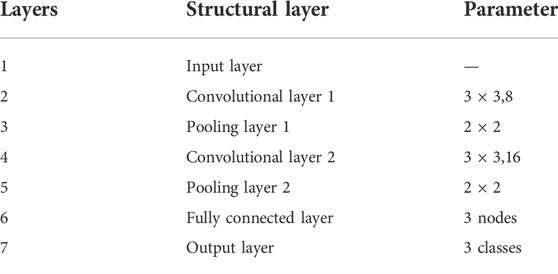
After the fault data is segmented and eigenvalue extracted, the fault type needs to be identified. Comparing the algorithm proposed in this paper with WT-CNN and VMD-SVM, the CNN model structure consists of input layer, convolution layer, pooling layer, activation function layer, fully connected layer and output layer group layer. For the processed data, the output layer is the final result, and the convolution layer, pooling layer and activation function layer together form a hidden layer of CNN. The structure and parameters of the CNN models introduced in this paper for comparison are shown in Table 9.
SVM is a shared supervised learning method suitable for small sample, nonlinear and high-dimensional data. For a given collinear classifiable training dataset, a kernel function is used to map the data from the original feature space to a high-dimensional feature space, so that the linear inner product is nonlinear, and then the classification interval is maximized in the high-dimensional feature space. Optimal hyperplane. Penalty factor C and RBF kernel function parameters are two important parameters in SVM. Penalty factor
For the problem that the arc ground fault sub-sequence cannot be accurately segmented in the methods WT-CNN and VMD-SVM, the fault merging method proposed in this paper is used to determine the fault end point. For ferromagnetic resonance faults, the waveform sub-sequence is manually segmented segmentation. It can be seen from Table 10 that the identification accuracy rates of several algorithms listed in the table are all greater than 90%. The recognition accuracy of the algorithm model proposed in this paper is 97.12%, and the recognition accuracy ratio is 3.31% and 2.38% higher than that of WT-CNN and VMD-SVM, respectively.
5 Conclusion
Aiming at the problems of inaccurate fault detection and redundant feature extraction in traditional detection based on electrical parameters and thresholds, this paper proposes a segmentation-clustering-based arc-ground fault identification method for distribution networks. First, a sliding t-test was used to segment the waveform subsequences, considering the presence of developing faults in the recorder data. Secondly, extract eigenvalues in time domain and frequency domain for the segmented waveform subsequences, and reduce the dimension of the eigenmatrix by using principal component analysis method. Then, cluster analysis is carried out on the characteristic parameter distribution after dimension reduction, and the identification accuracy of the algorithm is verified by using the safety boundary model. Finally, compared with the traditional arc ground fault identification method, the following conclusions are drawn:
(1) Compared with the traditional arc ground fault identification method, the segmentation-clustering algorithm proposed in this paper can more accurately segment the fault. The influence of different types of fault data on waveform characteristic values is reduced.
(2) The combined three-phase voltage and zero-sequence voltage waveform eigenvalue extraction and principal component analysis dimensionality reduction established in this paper reduce the problem of insufficient feature extraction based on traditional electrical parameter analysis, and reduce the redundancy of feature data.
(3) Compared with WT-CNN and VMD-SVM, the identification accuracy of the identification method proposed in this paper is improved by 3.31% and 2.38%, respectively.
Data availability statement
The raw data supporting the conclusion of this article will be made available by the authors, without undue reservation.
Author contributions
GL, MC, and WW provide data and technical support, QL and LC provide research methods and experimental guidance, and YW conduct experimental research.
Funding
This work was supported by China Power Construction Group Jiangxi Electric Power Construction Co., Ltd., Jiangxi Provincial Department of Science and Technology Project “Development of Wind Farm Dynamic Operation and Maintenance System Based on AR Smart Glasses”, and national Natural Science Foundation project “Research on Multi-classification and Efficiency Loss Prediction of Photovoltaic Module Defects for Unbalanced Distribution.” The funder was not involved in the study design, collection, analysis, interpretation of data, the writing of this article, or the decision to submit it for publication.
Conflict of interest
Authors GL and MC were employed by National Network Jiangxi Electric Power Co. Ltd. Author WW was employed by 3China Power Construction Group Jiangxi Electric Power Construction Co. Ltd.
The remaining authors declare that the research was conducted in the absence of any commercial or financial relationships that could be construed as a potential conflict of interest.
Publisher’s note
All claims expressed in this article are solely those of the authors and do not necessarily represent those of their affiliated organizations, or those of the publisher, the editors and the reviewers. Any product that may be evaluated in this article, or claim that may be made by its manufacturer, is not guaranteed or endorsed by the publisher.
References
Cai, X., and Wai, R. J. (2022). Intelligent DC arc-fault detection of solar PV power generation system via optimized VMD-based signal processing and PSO–SVM classifier. IEEE J. Photovolt. 12 (4), 1058–1077. doi:10.1109/JPHOTOV.2022.3166919
Chen, J., Li, H., Deng, C., and Wang, G. (2021). Detection of single-phase to ground faults in low-resistance grounded MV systems. IEEE Trans. Power Deliv. 36 (3), 1499–1508. doi:10.1109/TPWRD.2020.3010165
Dang, H. L., Kwak, S., and Choi, S. (2022). Parallel DC arc failure detecting methods based on artificial intelligent techniques. IEEE Access 10, 26058–26067. doi:10.1109/ACCESS.2022.3157298
Du, R., Shang, F., and Ma, N. (2019). Automatic mutation feature identification from well logging curves based on sliding t test algorithm. Clust. Comput. 22, 14193–14200. doi:10.1007/s10586-018-2267-z
Du, Y., Liu, Y., Shao, Q., Luo, L., Dai, J., Sheng, G., et al. (2019). Single line-to-ground faulted line detection of distribution systems with resonant grounding based on feature fusion framework. IEEE Trans. Power Deliv. 34 (4), 1766–1775. doi:10.1109/tpwrd.2019.2922480
Gadanayak, D., and Mallick, R. (2019). Interharmonics based high impedance fault detection in distribution systems using maximum overlap wavelet packet transform and a modified empirical mode decomposition. Int. J. Electr. Power & Energy Syst. 112, 282–293. doi:10.1016/j.ijepes.2019.04.050
Guo, M. F., Yang, N. C., and Chen, W. F. (2019). Deep-Learning-based fault classification using hilbert-huang transform and convolutional neural network in power distribution systems. IEEE Sens. J. 19, 6905–6913. doi:10.1109/jsen.2019.2913006
Guo, M. F., Zeng, X. D., Chen, D. Y., and Yang, N. C. (2018). Deep -Learning-Based earth fault detection using continuous wavelet transform and convolutional neural network in resonant grounding distribution systems. IEEE Sens. J. 18, 1291–1300. doi:10.1109/jsen.2017.2776238
Kavaskar, S., and Mohanty, N. K. (2019). Detection of high impedance fault in distribution networks. Ain Shams Eng. J. 101, 5–13. doi:10.1016/j.asej.2018.04.006
Lin, C., Gao, W., and Guo, M. F. (2019). Discrete wavelet transform-based triggering method for single-phase earth fault in power distribution systems. IEEE Trans. Power Deliv. 34 (5), 2058–2068, Oct. doi:10.1109/TPWRD.2019.2913728
Mishra, M, Routray, P., and Rout, P. K. (2016). A universal high impedance fault detection technique for distribution system using S-transform and pattern recognition. Technol. Econ. Smart Grids Sustain. Energy 1, 9. doi:10.1007/s40866-016-0011-4
Paul, D. (2015). High -resistance grounded power system. IEEE Trans. Ind. Appl. 51, 5261–5269. doi:10.1109/tia.2015.2422825
Peng, N., Ye, K., Liang, R., Hou, T., Wang, G., Chen, X., et al. (2019). Single-Phase-to-Earth faulty feeder detection in power distribution network based on amplitude ratio of zero-mode transients. IEEE Access 7, 117678–117691. doi:10.1109/ACCESS.2019.2936420
Qin, X., Wang, P., Liu, Y., Guo, L., Sheng, G., and Jiang, X. (2018). Research on distribution network fault recognition method based on time-frequency characteristics of fault waveforms. IEEE Access 6, 7291–7300. doi:10.1109/ACCESS.2017.2728015
Siegel, J. E., Pratt, S., Sun, Y., and Sarma, S. E. (2018). Real-time deep neural networks for internet-enabled arc-fault detection. Eng. Appl. Artif. Intell. 74, 35–42. doi:10.1016/j.engappai.2018.05.009
Wang, L., Qiu, H., and Yang, P. (2021). Arc Fault detection algorithm based on variational mode decomposition and improved multi-scale fuzzy entropy. Energies 14, 4137. doi:10.3390/en14144137
Wang, Y., Zhou, J., Li, Z., Dong, Z., and Xu, Y. (2015). Discriminant-analysis-based single-phase earth fault protection using improved PCA in distribution systems. IEEE Trans. Power Deliv. 30 (4), 1974–1982. doi:10.1109/TPWRD.2015.2408814
Wei, M., Shi, F., Zhang, H., Jin, Z., Bao, H., Zhou, J., et al. (2020). High impedance arc fault detection based on the harmonic randomness and waveform distortion in the distribution system. IEEE Trans. Power Deliv. 35 (2), 837–850. doi:10.1109/TPWRD.2019.2929329
Wei, Z., Mao, Y., Yin, Z., Sun, G., and Zang, H. (2020). fault detection based on the generalized S-transform with a variable factor for resonant grounding distribution networks. IEEE Access 8, 91351–91367. doi:10.1109/ACCESS.2020.2994139
Xia, K., He, S., Tan, Y., Jiang, Q., Xu, J., and Yu, W. (2019). Wavelet packet and support vector machine analysis of series DC ARC fault detection in photovoltaic system. IEEJ Trans. Elec. Electron. Eng. 14, 192–200. doi:10.1002/tee.22797
Zeng, X., Yu, K., Wang, Y., and Xu, Y. (2016). A novel single phase grounding fault protection scheme without threshold setting for neutral ineffectively earthed power systems. CSEE J. Power Energy Syst. 2 (3), 73–81. doi:10.17775/CSEEJPES.2016.00038
Zhang, H., Wang, J., Liu, Z., Han, J., Liu, J., and Zhu, H. “Comparative analysis of ferroresonance and arc high impedance grounding fault in high voltage transmission line,” in Proceedings of the 2021 International Conference on Power System Technology (POWERCON), Haikou, China, December 2021, 2331–2335. doi:10.1109/POWERCON53785.2021.9697581
Zhang, L., Wang, Y., Yan, H., and Shi, F. “Single-phase-to-ground fault diagnosis based on waveform feature extraction and matrix analysis,” in Proceedings of the 2019 9th International Conference on Power and Energy Systems (ICPES), Perth, Australia, December 2019, 1–6. doi:10.1109/ICPES47639.2019.9105483
Keywords: arc grounding, waveform subsequences, K-means clustering, fault identification, sequence segmentation
Citation: Wu Y, Li Q, Long G, Chen L, Cai M and Wu W (2023) Research on arc grounding identification method of distribution network based on waveform subsequence segmentation-clustering. Front. Energy Res. 10:1036984. doi: 10.3389/fenrg.2022.1036984
Received: 05 September 2022; Accepted: 22 November 2022;
Published: 10 January 2023.
Edited by:
Da Xie, Shanghai Jiao Tong University, ChinaCopyright © 2023 Wu, Li, Long, Chen, Cai and Wu. This is an open-access article distributed under the terms of the Creative Commons Attribution License (CC BY). The use, distribution or reproduction in other forums is permitted, provided the original author(s) and the copyright owner(s) are credited and that the original publication in this journal is cited, in accordance with accepted academic practice. No use, distribution or reproduction is permitted which does not comply with these terms.
*Correspondence: Qiong Li, cG93ZXJkc3AzMzlAMTYzLmNvbQ==
 Yihui Wu
 Qiong Li
 Guohua Long2