 Meng Gaojun
 Ding Yanwen1
- 1Nanjing Institute of Technology, Nanjing, China
- 2Faculty of Engineering and Architecture, Kore University of Enna, Enna, Italy
- 3State Grid Henan Electric Power Economic and Technological Research Institute, Zhengzhou, China
Under the background of large-scale and rapid development of renewable energy, in order to improve the economic benefit of the system and ensure the reliability of the system, this paper introduces hydrogen production and energy storage into the independent wind/photovoltaic/hydrogen/storage capacity optimization configuration method. In order to minimize the total planning cost and self-sufficiency rate of system power supply, a capacity optimization allocation model was established. On the basis of this model, the Multi-objective Salp Swarm Algorithm (MOSSA) was improved in Algorithm structure, Tent chaotic mapping was introduced to initialize the population, and the positions of leaders and followers were updated based on the adaptive spiral search strategy. The validity of the algorithm is verified by test function. Finally, the specific example is solved by MATLAB programming, and the improved multi-objective Salp Swarm Algorithm (IMOSSA) is used to obtain the capacity configuration scheme, which provides reference for the optimization design of independent photovoltaic hydrogen storage system.
1 Introduction
The goal of “striving to achieve carbon peak by 2030 and carbon neutralization by 2060” defines the direction of green and low-carbon development of power system under the goal of “double carbon” (Qiu et al., 2021; Wu et al., 2021). Wind energy and light energy are the representatives of renewable clean energy at present, which have the advantages of renewable, not limited by region, and are complementary in time and space (Chen and Sun, 2021; Dar et al., 2022). However, in practical applications, they are generally attached with energy storage devices to balance power fluctuations due to the randomness of meteorological conditions leading to the instability of the output power of wind-solar complementary power generation (Zhao et al., 2021; Zhang et al., 2022). Therefore, it is an urgent challenge for the independent wind power storage system to reasonably configuration. The fan capacity, photovoltaic panel capacity and energy storage capacity so as to improve the economy and reliability of the system.
In the past few years, the topic of independent wind power storage system capacity optimization configuration has been widely discussed and a large number of research results have been obtained. In Reference (Yao et al., 2020), Monte Carlo simulation was used to deal with the uncertainty of wind, light and load, and the universal gravitation search algorithm is used for global optimization to get the optimal allocation scheme of wind, light and storage. In Reference (Liu et al., 2019), an optimal configuration model considering the whole life cycle cost of the system was proposed. The mixed decimal genetic algorithm with integer variables was adopted to solve the model, and the optimal capacity allocation of distributed power generation and energy storage devices is obtained. In Reference (Lin et al., 2021), the battery and supercapacitor are introduced into the wind-solar complementary power generation system as energy storage devices, and the configured energy storage capacity is obtained by using the improved quantum particle swarm optimization algorithm to minimize the monthly average life cycle cost. In Reference (Xu et al., 2006), taking the installation cost of the system as the target and the power supply reliability as the constraint, the constraint is dealt with by adaptive penalty function method through genetic algorithm optimization including elite strategy. At the same time, the type and capacity of wind turbine, the capacity and inclination angle of photovoltaic panel and the capacity of storage battery are optimized. Currently, the independent landscape storage system capacity optimization configuration mostly focuses on fans, photovoltaic panels and batteries, and few literatures apply hydrogen storage energy to the combined power supply system. Hydrogen energy has the advantages of green environmental protection, high power density and low maintenance cost. The combined energy storage form of battery and hydrogen energy storage can effectively make up for the shortcomings of the battery energy storage device, such as limited capacity, low power density and large maintenance, and greatly improve the performance of the energy storage device.
Therefore, the capacity optimization configuration of wind/photovoltaic/hydrogen/storage joint power supply system is studied, and a capacity optimization configuration method based on improved Salp sea sheath group algorithm is proposed. First of all, the hydrogen energy storage system is introduced into the independent wind and solar energy storage system, and the capacity optimization configuration model is constructed with the goal of minimizing the total annual planning cost and the self-supporting loss rate of the system power supply. Secondly, the structure of MOSSA algorithm is improved, including the introduction of Tent chaotic map for population initialization, the use of adaptive spiral search strategy for group location update, and the use of test functions to verify the effectiveness of the algorithm. Finally, according to the annual measured landscape data and load data of a certain place, the model is solved by MATLAB software under the action of power generation control strategy, and the capacity allocation scheme of each unit of the system is obtained, which provides a reference for the optimal design of independent wind storage system.
2 New energy grid-connected model
Independent wind-photovoltaic-hydrogen-battery system consists of power generation unit, energy storage unit, electricity load and other necessary components of power system. The power generation unit includes a fan and a photovoltaic battery board, and the energy storage unit includes a storage battery and a hydrogen energy storage device. The hydrogen energy storage device is composed of a hydrogen storage tank, a fuel cell and an electrolytic cell, and its structure is shown in Figure 1.
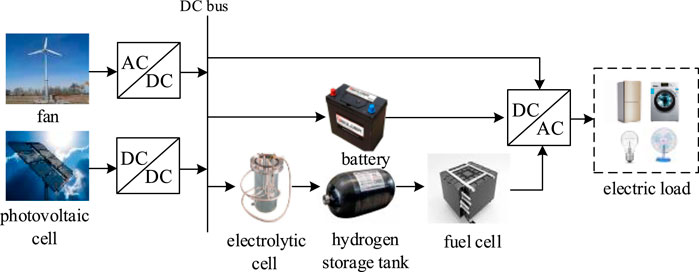
FIGURE 1. Independent wind-photovoltaic-hydrogen-battery system structure.
2.1 Fan output model
The output power Pwt of wind turbine mainly depends on the variation of wind speed vt, and its functional relationship can be approximately expressed by Eq. 1.
Wherein, PWT(t) is the output power of the wind turbine at time t; v(t) represents the wind speed at the time t; vin, vrated and vout represent the cut-in wind speed, rated wind speed and cut-out wind speed of the wind turbine respectively; Prated represents the rated power of the wind turbine.
2.2 Photovoltaic panel output model
The output power of photovoltaic array is mainly related to light intensity and temperature, and the expression of output power is as shown in Eq. 2:
Wherein, PSTC, GSTC, and TSTC represent the maximum test power, light intensity and temperature under standard test conditions (STC), G(t), and T(t) represent the actual solar light intensity and actual temperature at time t, respectively, and ε represents the power temperature coefficient.
2.3 Battery output model
During the charging and discharging process of the battery, the change of the charge state is as shown in Eq. 3:
Wherein, SOCc(t) and SOCf(t) represent the SOC value of charging and discharging of the battery at time t respectively; Δ represents the self-discharge rate of the battery; SOC(t-1) represents the charge state of the battery at the previous moment; Pc and Pf represent the charging and discharging power of the battery; ηc and ηf represent the charging and discharging efficiency of the battery, and 10% and 90%; E represents the rated capacity of the battery respectively. From the above formula, it can be deduced that the output model of the battery is:
2.4 Hydrogen energy storage device model
The models of electrolytic cell, hydrogen storage tank and hydrogen fuel cell can be expressed as follows:
Wherein, Pele represents the input power of the electrolytic cell; nH2 represents the hydrogen production capacity of the system; HHHV represents the calorific value of hydrogen; ηele represents the hydrogen production efficiency of the electrolytic cell, 70%; QH2 represents the hydrogen storage capacity of the hydrogen storage tank; ηtank represents the hydrogen storage efficiency of the hydrogen storage tank, 95%; Pfc represents the fuel cell output power; ηfc represents the conversion efficiency of the fuel cell, 65%.
3 Establishment of optimal configuration model
3.1 Objective functions
In this work, an optimization model is constructed with the goal of minimizing the annual total planning cost and the lowest self-supporting loss rate of the system power supply, to characterize the economy and reliability of the whole system, and to obtain the optimal capacity allocation scheme of fans, photovoltaic panels and energy storage devices, and thus, improving the economic benefits of the system and ensure the reliable operation of the system at the same time.
3.1.1 Total annual planning cost
The total annual planning cost f1 of the system is mainly related to the equivalent annual fee of equipment installation (Cinstall), annual maintenance fee of equipment (Chold), annual cost of equipment replacement (Creplace), loss cost of load and power shortage (Cpunish), and penalty cost of abandoning wind and light (Closs). The calculation formula is as follows:
The annual cost of equipment installation, annual maintenance, replacement of equipment, loss of load and power, and penalty cost of abandoning wind and light can be expressed as:
Wherein, Ci and Ni represent the number and unit price of each device, j represents the depreciation rate, Ri represents the service life of each device, ki represents the maintenance cost coefficient of each device, Pi(t) represents the power of each device at time t, kp represents the unit loss cost of power outage, taking 0.3 yuan/kWh; kp represents the unit abandonment wind and light penalty cost, taking 0.2 yuan/kWh; Pdrump(t) represents the system load power shortage power; and Ploss(t) represents the power of abandoning wind and light in the system.
3.1.2 Self-sufficient loss rate of the power supply
The self-sufficient loss rate of the power supply represents the probability that the generating power of the system can not meet the local load demand in a certain period of time (Wu et al., 2014). In this work, the system power supply self-sufficiency loss rate is used as an index to characterize the system reliability. The smaller the system power supply self-sufficiency loss rate is, the higher the system reliability is. The expression is as shown in Eq. 10:
Wherein, PL(t) represents the load power at time t; PWT(t), PPV(t), Pb(t) and Pfc(t) represent the output power of fan, photovoltaic battery, battery and fuel cell at time t, respectively.
3.2 Constraint conditions
The constraint conditions of independent landscape storage combined power supply system are as follows:
Wherein, Nimax,i∈ (Qiu et al., 2021; Zhao et al., 2021) represents the maximum number of devices; QH2min and QH2max represent the lower limit and upper limit of hydrogen storage capacity of the hydrogen storage tank respectively; SOCmin and SOCmax represent the lower limit and upper limit of the battery charge state respectively; Pcmax and Pfmax represent the maximum charge and discharge power of the battery respectively.
4 System operation control strategy
The operation control strategy of pv/wind hydrogen storage system is shown in Figure 2. In this work, fans and photovoltaic panels are given priority to meet the load needs of users. According to the wind power generation and the user load, it can be divided into three situations: 1) if the wind power output can just meet the user load demand, there is no need for the energy storage system to intervene; 2) if the pv/wind output is greater than the user’s load demand, priority will be given to charging the battery, and when the battery’s charge state reaches the maximum value, the battery will stop charging, and if there is still any remaining power, the excess wind power will be obtained from the electrolytic cell and stored in the hydrogen storage tank until the capacity of the hydrogen storage tank reaches the upper limit; and 3) if the output of pv/wind is less than the load demand of the user, priority is given to replenishing the electricity through the output of the battery and the charge state of the battery is not lower than the minimum, if the output of the battery is not enough to meet the load demand, the hydrogen stored in the hydrogen storage tank is discharged through the fuel cell, and if the sum of the output power still can not meet the load demand, it will be removed according to the importance of the load.
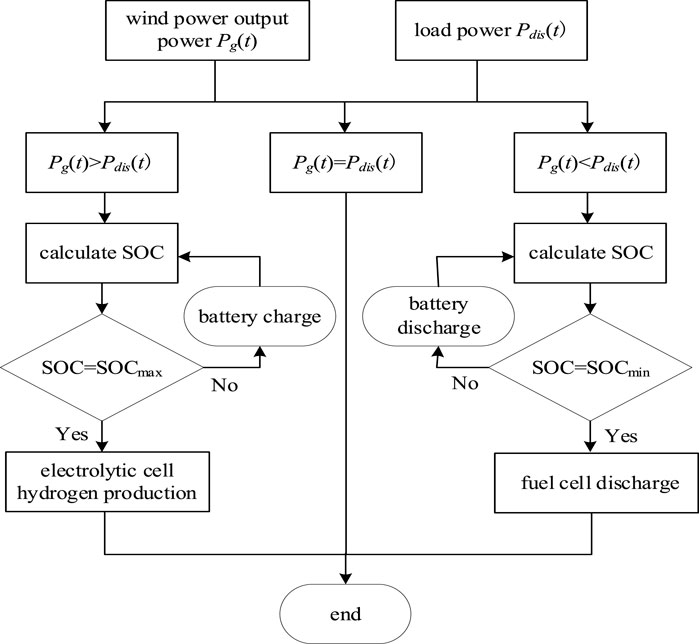
FIGURE 2. Flow chart of system running policies.
5 Model solving methods
5.1 Salp swarm algorithms
Salp Swarm Algorithms (SSA) is a new heuristic optimization algorithm proposed by Professor Mirjalili et al. by simulating the individual and group behavior of ascidian in the ocean (Seyedali et al., 2017). In the deep sea, Salp sea squirts usually form a group called Salp sea sheath chain in order to quickly coordinate change and foraging. The Salp sea sheath chain can be divided into two groups: the leader at the front of the Salp sea sheath chain is responsible for finding the location of food; the rest of the Salp sea squirts are followers, connected from head to tail, following the leader, as shown in Figure 3. As the leader leads his followers closer to the food source, the algorithm gradually tends to the optimal solution.
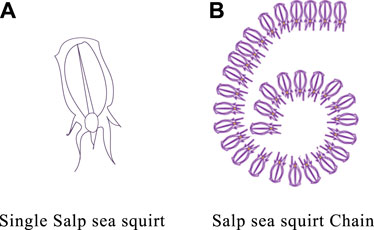
FIGURE 3. Structure diagram of Salp sea squirt group. (A) Single Salp sea squirt; (B) Salp sea squirt Chain.
The location update formula for leaders is as follows:
Wherein, Xj1 represents the position of the first ascidian (leader) in dimension j, Fj represents the position of food source in dimension j, uj, lj represents the upper and lower bounds of dimension j, c2 and c3 represent random numbers in the range of [0,1], and c1 represents convergence factor, whose values are shown as follows:
Wherein, l represents the current number of iterations and L represents the maximum number of iterations.
The location update formula for followers is:
Wherein, Xji represents the position of the ith follower in the jth dimension of the space, and Xji−1 represents the position of the i-1-th follower in the jth dimension of the space, where i ≥ 2.
5.2 Improved multi-objective salp sheath group algorithm
SSA algorithm can only be used to solve optimization problems with a single objective, while multi-objective optimization problems usually require a set of optimal solutions (non-dominant solution sets), whose objective vector set is the Pareto Frontier. Therefore, it is necessary to adjust the traditional SSA algorithm to solve the multi-objective problem. The MOSSA algorithm introduces the external file Archive to store the non-dominant solution of the current population. After each iteration, the algorithm will generate new individuals. Compare these individuals with the individuals in Archive one by one and update the individuals in Archive. The updating method is as follows: if the new individual dominates one or more individuals in the external file, the new individual will be added to the external file and the old individual dominated by it will be deleted. If the new individual is dominated by at least one individual in the external file, the new individual does not join the external file; if the new individual and any individual in the external file do not dominate each other, the new individual joins the external file. According to the density of other solutions in the neighborhood of the non-dominant solution, the grade is determined. The more other solutions in the neighborhood, the higher the level of the non-dominant solution. Due to the limited capacity of the external file, the densest solution, that is, the solution with the highest level, is deleted when the external file is full. Roulette is used to determine the food source individuals that the next-generation of leaders will pursue. (Fan et al., 2020). Among them, if the two non-dominant solutions xi and xj in the external file are adjacent to each other, the following conditions must be met:
Wherein, fa represents the value of the ath objective function, A represents the set of objective functions, Ha represents the neighborhood distance threshold of the ath objective function, famax and famin represent the maximum and minimum values of the ath objective function in the current external file, and nmax represents the limit value of the number of non-dominant solutions stored in the external file.
5.2.1 Tent chaotic map
In the process of initializing the population, the MOSSA algorithm usually uses the randomly generated data as the initial information of the population, which increases the premature risk of the algorithm and affects the optimization results of the algorithm. The initial value of the population with more uniform distribution can be obtained by using the ergodicity and randomness of chaotic motion, which is helpful for the algorithm to break away from the local optimal solution.
In this paper, Tent map, which has better chaotic characteristics than Logistic map, is introduced for population initialization. (Zeng et al., 2017; Teng et al., 2018). Figure 4 shows the bifurcation diagram of the basic Tent mapping, but the Tent mapping is easy to fall into fixed points and small periodic cycles, so an improved Tent mapping formula is introduced as shown in Eq. 17.
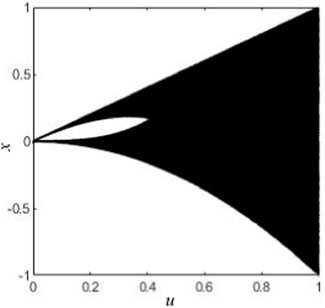
FIGURE 4. Basic Tent mapping bifurcation diagram.
The steps to initialize the Tent mapping are as follows:
1) Select the initial value x0 randomly and prevent it from falling into the small periodic point {0.2, 0.4, 0.6, and 0.8}.
2) The reference Eq. 16. generates a set of x sequences, and i = i + 1 after the iteration is completed. If the maximum number of iterations is reached, jump directly to the last step.
3) If xi = {0,0.25,0.50,0.75} or xi = xi-m, and where m = {0,1,2,3,4}, then make xi = xi+0.1*rand (0,1) replace the original value and move on to the second step.
4) Stop running and keep the x sequence.
5.2.2 Spiral position update strategy
In the late iteration of the basic MOSSA algorithm, it is easy to have a slow local optimal convergence rate. In order to improve the local search ability of the algorithm, inspired by the tuna foraging algorithm in reference, (Lei et al., 2021), a spiral position update strategy is used to improve the location update of leaders and followers in the salp sea squirt group, and expand the search scope. This makes it easy to find more potential better solutions. (Zhao et al., 2020; Li and Wang, 2021).
5.2.2.1 Leader location update
The location update strategy takes 0.5 as the demarcation point, and the location update mode of the leader at the front end of the salp sea sheath chain is determined by a random probability rand in the random range of 0–1. When rand <0.5, the original algorithm position update mode is selected, and when rand ≥0.5, the spiral position update mode is selected.
The helix position is updated by:
Wherein, b represents a random number, which is evenly distributed between 0 and1; t represents the current number of iterations of the algorithm; tmax represents the maximum number of iterations of the algorithm.
5.2.2.2 Follower location update
The follower location is updated by:
Where, rand represents the random number between [0,1].
5.3 Solving steps of improved algorithm
Using the IMOSSA algorithm to find the Pareto front, the specific steps to obtain the capacity optimization configuration results of the independent wind/light/hydrogen/storage system are as follows:
(1) initialize the population. Firstly, the annual wind speed, solar light intensity, temperature, load time series data and the purchase unit price, unit installed capacity and maintenance cost coefficient of each device are introduced, and the algorithm parameters such as problem dimension dim, population size N, external archive scale ArchiveMaxSize, maximum number of iterations tmax, upper and lower limit uj and lj are set. Secondly, taking the number of each device as the decision variable, the chaotic sequence is generated by introducing Tent map within the constraint range, and the population is initialized according to the upper and lower limits of the search space.
(2) According to the Eqs 8–12, the fitness values f1 and f2 of each individual are calculated according to the operation control strategy, and the external file Archive is updated according to the relationship between the new solution and the original non-dominant solution.
(3) Judge whether the number of non-dominant solutions in the external file Archive exceeds the limit, if so, the density of other solutions in the neighborhood of each non-dominant solution is judged according to Eq. 16, and the solution with the highest density is deleted first. Otherwise, roulette is directly used to select a non-dominant solution from the external file as the food source individual to be pursued by the next-generation of leaders.
(4) Update the position of the leader according to the Eqs 13, 18.
(5) Update the position of the followers according to the Eq. 19.
(6) Determine whether the algorithm reaches the maximum number of iterations, if so, output the pareto solution set, that is, the capacity optimization configuration scheme of the independent wind/light/hydrogen/storage system, otherwise turn to Step (2).
5.4 Algorithm performance test
In order to verify the performance of the improved algorithm IMOSSA, the standard test function ZDT1-ZDT4 (Li et al., 2021) is selected to analyze the algorithm qualitatively. Set the population size 100, the external archive capacity 200, and the maximum number of iterations 100. Figure 5 shows the comparison between the Pareto front and the real Pareto front of the IMOSSA algorithm on four test functions.
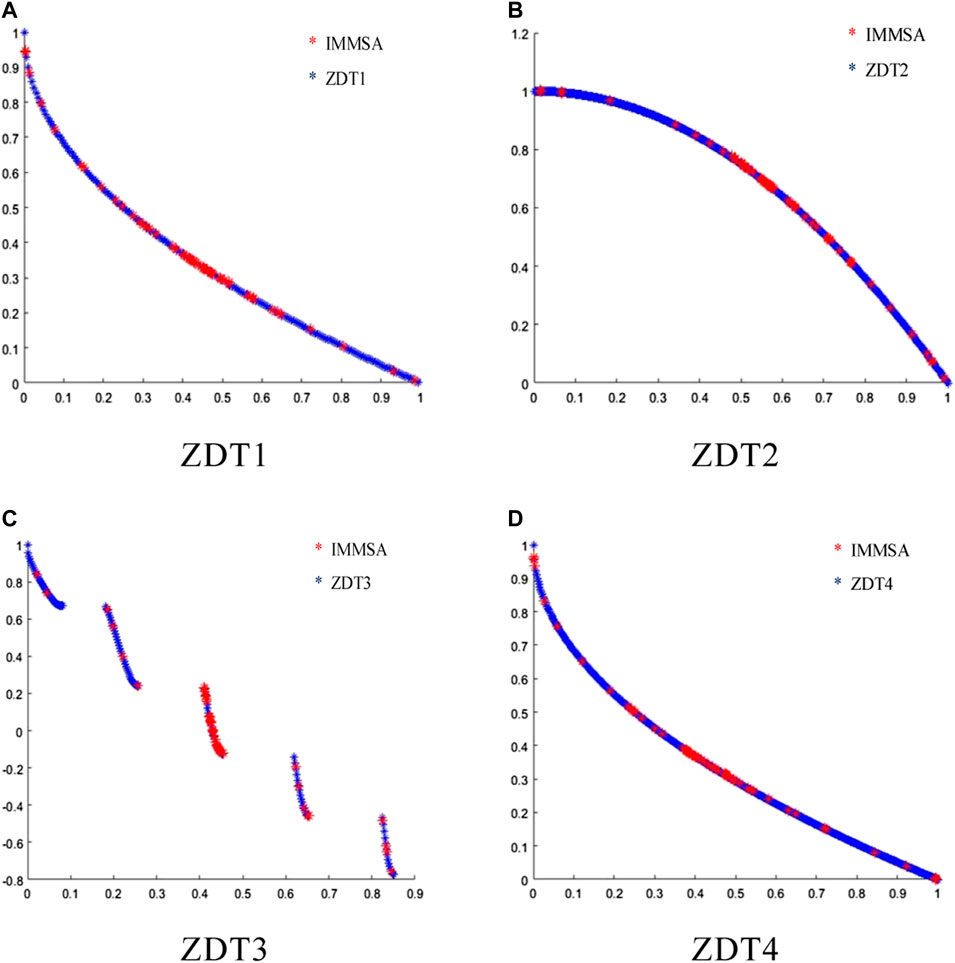
FIGURE 5. Basic Tent mapping bifurcation diagram. (A) ZDT1; (B) ZDT2; (C) ZDT3; (D) ZDT4.
According to Figure 5, the pareto front obtained by the improved algorithm can be distributed around the real pareto front of the test function, and has good convergence and distribution. However, the superiority of the algorithm can not be shown directly by qualitative analysis, so the cec2009 series test function in reference (Fan et al., 2020) is selected to test, and the inverse generation distance (IGD) (Geng et al., 2019) is introduced to comprehensively evaluate the convergence and diversity of the algorithm. The smaller the IGD is, the better the result is. The test results are compared with those of MOSSA algorithm, NSGAII algorithm and MOPSO algorithm. The calculation formula of IGD is as follows:
Wherein, P and P* represent the Pareto Frontier solution set and the real Pareto optimal Frontier obtained by the algorithm, respectively; |P∗| represents the number of individuals in P∗; d represents the minimum Euclidean distance between individual p and P∗ in P, respectively.
IMOSSA, MOSSA, NSGAII, and MOPSO are run 30 times on the UF1-UF7 test function respectively. The IGD of the solution set obtained by the four algorithms in each operation is recorded and the average value and standard deviation are calculated. The results are shown in Table 1. According to Table 1, compared with MOSSA, NSGAII and MOPSO, the mean and standard deviation of IGD in most of the test functions of IMOSSA algorithm are lower than those of the other three algorithms, that is, the convergence and diversity of IMOSSA algorithm are better than those of the other three algorithms, indicating that IMOSSA algorithm effectively improves the original algorithm and has more advantages in dealing with multi-objective problems.
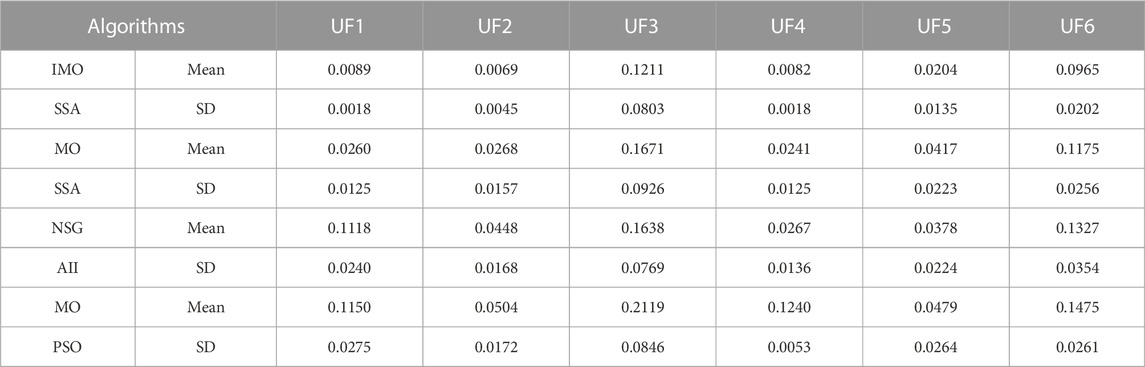
TABLE 1. Test results of four algorithms on test function.
6 Example analysis
6.1 Basic parameters
Based on the capacity optimization configuration model established above, the time series data of wind speed, solar light intensity, ambient temperature and load measured in a place in the whole year are introduced (as shown in Figure 6).
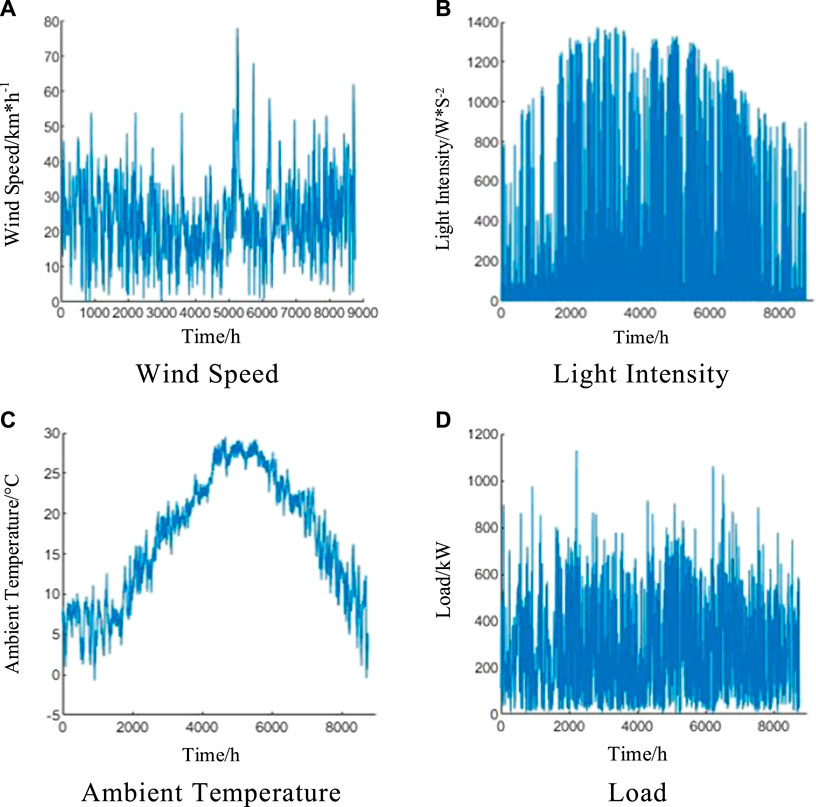
FIGURE 6. Weather and load data of a locality for 1 year. (A) Wind Speed; (B) Light Intensity; (C) Ambient Temperature; (D) Load.
Based on the system operation control strategy, the IMOSSA algorithm is used to solve the optimization problem. Table 2 shows the relevant technical parameters of fan, photovoltaic panel, storage battery, electrolytic cell, hydrogen storage tank and fuel cell.
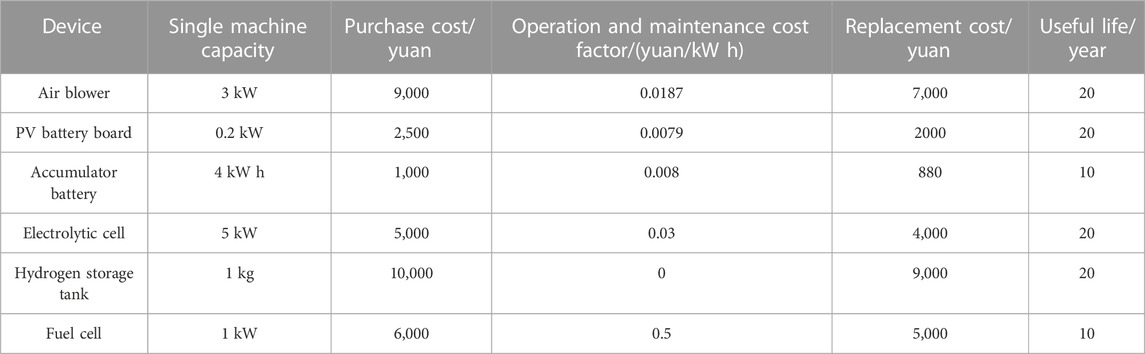
TABLE 2. Related technical parameters of each device in the system.
6.2 Analysis of capacity optimization results
The initial parameters of IMOSSA algorithm are set as follows: the population size is 30, the number of iterations is 200, and the external file size is 50. Figure 7 shows the pareto optimal solution set obtained by MATLAB software using IMOSSA, MOSSA, and NSGAII algorithms, respectively.
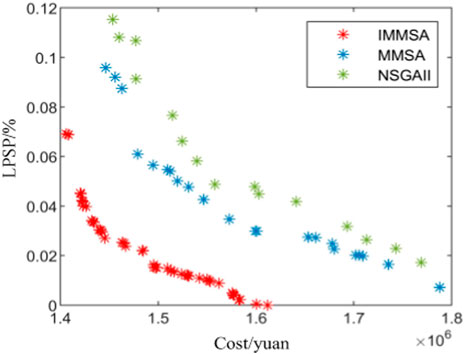
FIGURE 7. Pareto optimal solution set of three algorithms.
According to Figure 7, when the initial parameter values are the same, the Pareto Frontier obtained by IMOSSA algorithm is better than that of the other two algorithms, and the distribution of Pareto optimal solution is more dispersed and uniform, which verifies the effectiveness and necessity of algorithm improvement. Based on the topsis decision method, the system optimization Pareto solution set is decided, and the final result is the optimal solution. The capacity allocation scheme and the objective function values obtained by the three algorithms are shown in Tables 3, 4.

TABLE 3. Capacity configuration schemes of three algorithms.

TABLE 4. Objective function values of the three algorithms.
Generally, the annual total planning cost of the two sub-objective functions and the system power supply self-sufficiency loss rate contradict each other. When the system power supply self-sufficiency loss rate tends to zero, the required annual total planning cost reaches the peak. This is because the higher the planning cost of the system means that it can be equipped with more distributed power and energy storage devices, provide more spare capacity to meet the power supply needs of the load side, and effectively avoid the abandonment of wind and light or insufficient power of the system. As can be seen from the data in Table 4, the MOSSA algorithm configuration scheme is more economical than the NSGAII algorithm configuration scheme, and the total annual planning cost is reduced by 5.46%, but it is not dominant in terms of reliability, and the self-sufficient loss rate of the system power supply is reduced by 6.62%. Compared with the first two configuration schemes, the configuration scheme of IMOSSA algorithm is both economical and reliable, the total annual planning cost is reduced by 5.28% compared with MOSSA algorithm, and the self-sufficient loss rate of system power supply is reduced by 54.39% compared with NSGAII algorithm.
Figure 8 shows the comparison of wind turbine, photovoltaic panel power generation and load-side power demand. Obviously, the power supply of wind turbine and photovoltaic panels will be surplus after meeting the power demand of the load end in most cases, but sometimes the wind power generation can not meet the demand of the load end, and the battery and hydrogen storage can store electric energy when the wind power resources are surplus, and supplement the power when the wind power generation is insufficient. Figure 9 shows the state diagram of the charge constant of a single energy storage battery for 1 year. It is obvious that the charge constant of the battery is more than 0.5 in spring and autumn, but lower in summer and winter, especially in summer. This is also in line with the reality, the summer electricity consumption is too much, the situation of power shortage is more obvious.
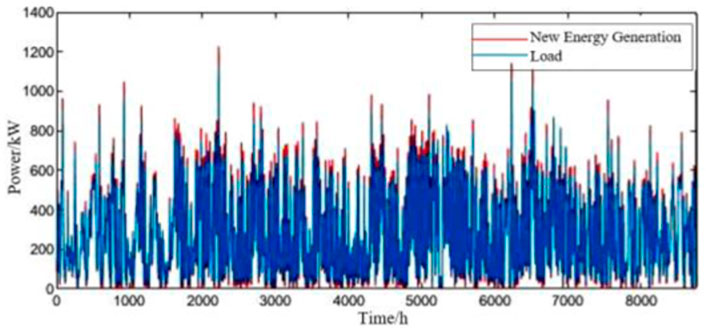
FIGURE 8. Comparison of wind power generation and load demand.
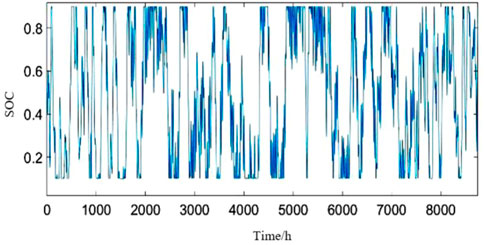
FIGURE 9. Charge state diagram of energy storage battery.
The change of the capacity ratio of the hydrogen storage tank is shown in Figure 10, which indicates the proportion of the existing hydrogen in the total hydrogen storage tank, which shows that the hydrogen content in the hydrogen storage tank is constantly changing, which further proves the effect of the hydrogen energy storage device on the power balance of the system. The power of electrolytic cell and fuel cell is shown in Figure 11, it can be seen that from October to November, the wind speed is larger, photovoltaic panels and batteries have been supplemented to basically meet the power demand of the load end, and most of the hydrogen storage tanks are in the full stage. From June to August, although the light intensity and ambient temperature are basically at the highest value of the year, the power demand of the load side also increases synchronously. When the wind output is less than the user load demand, the battery gives priority to the output. When the minimum SOC is reached, the hydrogen storage tank releases hydrogen to power through the fuel cell to reduce the load shortage. From January to March, the wind speed, light intensity and ambient temperature are low, the demand for electricity at the load end is high, and the battery can not meet the load demand, so it also needs the power supply of hydrogen storage device.
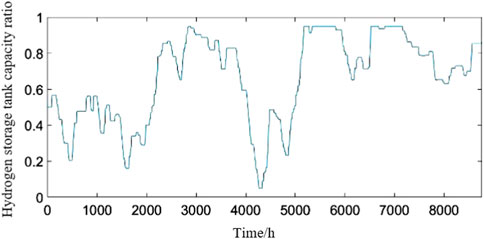
FIGURE 10. Hydrogen storage tank capacity ratio.
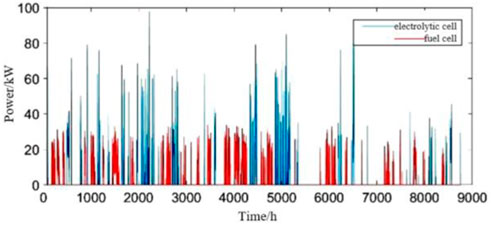
FIGURE 11. Electrolytic cell and fuel cell power.
Figure 12 shows the power balance chart of the system for one 3 days. As can be seen from the chart, wind power generation is first used to meet the power load demand, and the rest depends on battery and fuel cell supply. When the supply of wind power exceeds demand, the battery and electrolytic cell work to reduce the abandonment of wind and light. According to the power shortage power of the load at different times of the system (Figure 13), it can be seen that the proportion of the power shortage penalty cost of the system to the total cost is less than 1%, and the number of times that the system cannot meet the demand of the load side in the whole year is very few, and the system can supply power to the load. Furthermore, it shows that the capacity configuration of the system is reasonable.
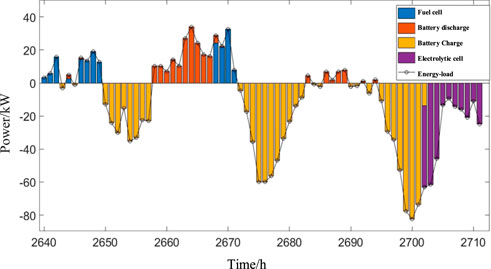
FIGURE 12. Power balance diagram of the system for a certain three days.
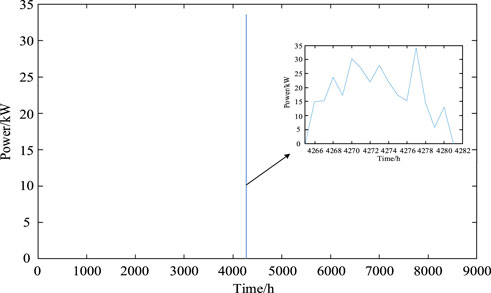
FIGURE 13. The system is short of power at different times.
7 Conclusion
For independent wind-photovoltaic-hydrogen-battery system, the capacity optimization configuration model is constructed after considering the total annual planning cost of the system and the self-supporting loss rate of system power supply, and the improved multi-objective SSA is used to solve the model. Through the performance test of the algorithm and the simulation analysis of an example, the results show that:
(1) The IMOSSA algorithm introduces Tent mapping and adaptive spiral search strategy, which makes the algorithm easy to break away from the local optimal solution and improves the convergence speed of the algorithm. In the algorithm performance test, it is better than MOSSA algorithm, NSGAII algorithm and MOPSO algorithm, and can better solve the multi-objective optimization problem.
2) The multi-objective optimal configuration of each device of wind/photovoltaic hydrogen storage system is carried out based on the scenery and load data of the selected area. In the case of low self-sufficient loss rate of power supply of the system, the annual planning cost of the system is reduced, the economy of the system is balanced with the reliability of power supply, and a reference is provided for the early design and planning of the independent wind hydrogen storage system.
Data availability statement
The original contributions presented in the study are included in the article/Supplementary Material, further inquiries can be directed to the corresponding author.
Author contributions
Conceptualization, MG and YL; methodology, MG; software, YL; validation, DY, GP, and TW; formal analysis, GP; investigation, MG; resources, DY; data curation, TW; writing—original draft preparation, YL; writing—review and editing, MG; visualization, DY. All authors have read and agreed to the published version of the manuscript.
Funding
Project supported by the National Natural Science Foundation of China (51877101); Key research and development program of Jiangsu Province (BE2021094).
Conflict of interest
The authors declare that the research was conducted in the absence of any commercial or financial relationships that could be construed as a potential conflict of interest.
Publisher’s note
All claims expressed in this article are solely those of the authors and do not necessarily represent those of their affiliated organizations, or those of the publisher, the editors and the reviewers. Any product that may be evaluated in this article, or claim that may be made by its manufacturer, is not guaranteed or endorsed by the publisher.
References
Chen, Z. X., and Sun, Y. S. (2021). Research on optimal allocation of energy storage with wind-wind complementarity [J]. Trans. China Electrotech. Soc. 36, 145–153.
Dar, A. A., Hameed, J., Huo, C. H., Chen, F., Albasher, G., Wang, C., et al. (2022). Recent optimization and panelizing measures for green energy projects; insights into CO2 emission influencing to circular economy [J]. Fuel 314, 123094–1123094. doi:10.1016/j.fuel.2021.123094
Fan, Y., Shao, J., Sun, G. A., and Shao, X. (2020). A modified salp swarm algorithm based on the perturbation weight for global optimization problems. Complexity 2020, 1–17. doi:10.1155/2020/6371085
Geng, H. T., Han, W. M., and Zhou, S. S. (2019). A new MOEA/D algorithm based on new neighborhood update strategy [J]. Comput. Sci. 46 (5), 191–197.
Lei, X., Tong, H., and Huan, Z. (2021). A novel swarm-based metaheuristic algorithm for global optimization[J]. Comput. Intell. Neurosci. 10.
Li, M. M., and Wang, Q. P. (2021). Fractional order strategy and spiral bat algorithm with levy flight [J]. Comput. Eng. Appl. 57 (18), 75–81.
Li, S., Li, F. X., and Wang, M. H. (2021). Optimal power configuration of isolated wind/optical/dc microgrid based on improved multi-objective spider monkey algorithm[J]. Power Capacitors React. power Compens. 42 (5), 196–203.
Lin, M. Y., Lei, Y., and Li, Y. (2021). Energy storage capacity optimization based on improved quantum particle swarm optimization algorithm [J]. Chin. J. Power Sources 45 (2), 203–207.
Liu, J., Lv, Z. Y., and Wang, Q. (2019). Optimization configuration analysis of independent microgrid based on Mixed integer Genetic Algorithm [J]. Electr. Appliances Energy Effic. Manag. Technol. 5, 65–70.
Qiu, W. Q., Wang, M. C., and Lin, Z. Z. (2021). Comprehensive evaluation of shared energy storage for new energy consumption scenario under "dual carbon" target [J]. Electr. Power Autom. Equip. 41 (10), 244–255.
Seyedali, M., Gandomi, A. H., Mirjalili, S. Z., Saremi, S., Faris, H., and Mirjalili, S. M. (2017). Salp swarm algorithm: A bio-inspired optimizer for engineering design problems. Adv. Eng. Softw. 114, 163–191. doi:10.1016/j.advengsoft.2017.07.002
Teng, Z. J., Lu, J. L., and Guo, L. W. (2018). An improved grey wolf hybrid optimization algorithm based on tent mapping [J]. J. Harbin Inst. Technol. 50 (11), 40–49.
Wu, X. G., Liu, Z. Q., and Tian Li, T. (2014). Optimal allocation of optical storage capacity in independent photovoltaic system [J]. Power Grid Technol. 5, 1271–1276.
Wu, Y., Ma, Z. C., and Zhou, Q. (2021). Challenges and suggestions for constructing new power system in northwest China under the background of "dual carbon. J. Energy China 43 (8), 84–88.
Xu, Daming, Kang, Longyun, and Cao, Binggang (2006). Optimization design of wind-wind complementary independent power supply system[J]. Acta Energiae Solaris Sin. 27 (9), 919–922.
Yao, Q. C., Yuan, X. L., and Huang, B. L. (2020). Optimal configuration of independent microgrid based on Monte Carlo source- charge uncertainty processing [J]. Energy storage Sci. Technol. 9 (1), 186–194.
Zeng, M., Han, X., and Li, Y. F. (2017). Multi-objective cooperative optimization of integrated energy system based on tent mapping chaos optimization NSGA-Ⅱ algorithm [J]. Electr. Power Autom. Equip. 37 (6), 220–228.
Zhang, K., Zhou, Bin, Or, S. W., Chung, C. Y., and Voropai, N. (2022). Optimal coordinated control of multi-renewable-to-hydrogen production system for hydrogen fueling stations. IEEE Trans. Ind. Appl. 58 (2), 2728–2739. doi:10.1109/tia.2021.3093841
Zhao, P. F., Lu, X., Cao, Z. D., Gu, C., Ai, Q., Liu, H., et al. (2021). Volt-VAR-pressure optimization of integrated energy systems with hydrogen injection. IEEE Trans. Power Syst. 36 (3), 2403–2415. doi:10.1109/tpwrs.2020.3028530
Keywords: renewable energy, hydrogen storage, capacity configuration, IMOSSA algorithm, multi-objective
Citation: Gaojun M, Yanwen D, Pau G, Linlin Y and Wenyi T (2023) Multi-objective capacity optimization configuration of independent wind-photovoltaic- hydrogen-battery system based on improved MOSSA algorithm. Front. Energy Res. 10:1077462. doi: 10.3389/fenrg.2022.1077462
Received: 23 October 2022; Accepted: 29 November 2022;
Published: 09 January 2023.
Edited by:
Bin Zhou, Hunan University, ChinaCopyright © 2023 Gaojun, Yanwen, Pau, Linlin and Wenyi. This is an open-access article distributed under the terms of the Creative Commons Attribution License (CC BY). The use, distribution or reproduction in other forums is permitted, provided the original author(s) and the copyright owner(s) are credited and that the original publication in this journal is cited, in accordance with accepted academic practice. No use, distribution or reproduction is permitted which does not comply with these terms.
*Correspondence: Meng Gaojun, Z2p1bl9tQDEyNi5jb20=