 Cong Ma
 Min Zhao1†
 Rongjian Pan
 Jiantao Qin
- 1The First Sub-Institute, Nuclear Power Institute of China, Chengdu, China
- 2School of Material Science and Engineering, Northwestern Polytechnical University, Xi’an, China
U3Si2 is a potential accident-tolerant fuel (ATF) due to its high thermal conductivity and uranium density relative to UO2. The grain size and distribution play an essential role in the service performance of U3Si2. However, the grain evolution is quite complicated and remains unclear, which limits further application of U3Si2 in the ATF assembly. In the present work, a phase-field model is employed to investigate the nucleation and growth of grains in U3Si2. Our results show that the number of grains rises rapidly at the nucleation stage until they occupy the whole system. After that, the grain radius and area continue to grow, and the grain number decays. The grain area increases in time according to the linear law, while the mean grain radius increases with time in a power law form with the scaling growth exponent z = 0.42, which is quite close to the theoretically predicted value. Finally, we performed statistical analysis and found that the grain size evolution of U3Si2 obeys Rayleigh distribution. Our simulation not only elucidates the nucleation and evolution of grains in U3Si2 during the thermal treatment process unambiguously but also provides a fundamental study on the investigation of grain growth, subdivision, and even amorphization in the irradiated condition, which is very important for U3Si2 used as ATF in the light water reactor.
1 Introduction
Many novel nuclear fuels have been put forward to take the place of UO2 since the Fukushima Daiichi accident. U3Si2 is extensively investigated among these fuels and is considered a promising next-generation ATF (Westinghouse Electric Company, 2015; Bischoff et al., 2016). Compared with the traditional UO2 fuel, U3Si2 shows a series of unique advantages, such as higher thermal conductivity (λ equals ∼ 7-8 W/(m·K) in UO2 (Harding and Martin, 1989) and 15W/(m·K) in U3Si2 (White et al., 2015) at 573K, respectively), higher uranium density (11.31 g/cm3 U in U3Si2 and 9.65 g/cm3 U in UO2) (White et al., 2015), and reinforced thermal conductivity at elevated temperature (White et al., 2015). All of these features can benefit superior safety in both regular operation and the loss-of-coolant Accident (LOCA) (Terrani et al., 2014; Miao et al., 2017; Miao et al., 2018; Zhou and Zhou, 2018) and improve the power efficiency of the reactor.
The superior thermal conductivity and high uranium density promise U3Si2 an excellent accident-tolerant ability. In addition to this, the thermal properties and the mechanical performance are also determined by the fuels’ microstructures. Manipulating grain and boundary areas through grain size control is essential for good performance. Generally, the fuels fail when they form a high burnup structure characterized by fine subgrain formation along grain boundaries. The grain boundaries are defect sinks that attract the gaseous fission products and vacancies, which cause bubbles nucleation and, consequently, severe stress concentration and swelling after. The gaseous atoms or small clusters dissolve the interior, cause limited lattice distortion, and are minor for swelling. The grain boundaries accommodate parts of fission gases that balance the interior and exterior of grains to maintain the performance stability. Grain coarsening or splitting into smaller subdivisions at the periphery at high temperatures and pressures will lead to out-of-balance, causing fuel failure.
U3Si2 consists of various grains with different crystallographic orientations. Many physical and chemical properties, such as corrosion resistance, thermal and electrical conductivity, mechanical properties (Davidge and Evans, 1969; Oguma, 1982; Kapoor et al., 2007), and fission gas release (Forsberg and Massih, 2001), depend on the mean grain size and distribution. However, due to the anisotropic crystallographic structure, grain evolution in U3Si2 is quite complicated. Up to now, even though there exist extensive investigations on U3Si2, the majority of these research studies focus on grain morphology. In contrast, grain growth, especially quantitative analysis of size distribution, is seldom investigated, which impedes the further understanding of grain subdivision and swelling behavior in U3Si2 under irradiation and restricts its extensive application in the field of ATF. Therefore, it is of great scientific and technological importance to investigate grain growth kinetics and perform a statistical analysis of grain evolution.
In recent years, with the rapid development of computer science and technology, numerical simulations have been gradually used to elucidate the mechanisms of grain growth spanning from the atomic to macroscopic scale (Atkinson HV, 1988). Computational studies are extremely useful since they permit isolation and analysis of the dominating factors of grain growth, contributing to microstructural evolution. Up to now, there have emerged various computational approaches to study microstructural evolution, such as the molecular dynamics (Azeem et al., 2019), Monte Carlo Potts model (Blikstein and Tschiptschin, 1999), surface evolver (Wakai et al., 2000), front tracking (Frost and Thopson, 1996), vertex dynamics (Weygand et al., 1998), cellular automata (Liu et al., 1997), and phase-field (Wen et al., 2006; Ansari et al., 2021) method. Among these methods, the phase-field approach has been extensively applied for grain growth modeling (Chen and Yang, 1994; Srezende et al., 1996; Fan and Chen, 1997; Kobayashi et al., 2000; Lobkovsky and Warren, 2001; III Krill and Chen, 2002) because it can deal with a large system involving thousands of grains, track individual grain boundaries, and apply specific constitutive relations to their motion. Currently, there are two main phase-field models for grain growth simulation. The earliest and most widely used model was developed by Chen and Yang, in which the grains of different crystallographic orientations are represented by a set of nonconserved order parameter fields (Chen and Yang, 1994). This model can be used in 2D (Fan and Chen, 1997) and 3D (III Krill and Chen, 2002) phase-field modeling simulations of grain growth. Srezende et al. proposed another class of multiphase-field model (Srezende et al., 1996) with a constraint on the order parameters, such that the sum of all order parameters at a given point yields unity, and the order parameters can represent the volume fraction of grains of different orientations. According to experimental data and molecular dynamics (M.D.) simulation results (Beeler et al., 2019), Cheniour et al. (2020) set up a phase-field model and investigated how grain size changes with time under ideal circumstances by giving a quantitative relationship. Nevertheless, how the microstructure evolves and whether an underlying mechanism dominates this process remain unknown.
In this work, we systematically investigated grain nucleation and growth in U3Si2 during thermal treatment through phase-field simulation. Microstructure evolution and grain size distribution within different thermal treatment stages are well examined. Our results show that the average grain size varies with time in a power law form, and grain size evolution in U3Si2 obeys Rayleigh distribution. Our work is organized as follows. Section 2 presents the phase-field formalism for grain growth and microstructure evolution modeling. Section 3.1 shows our simulated microstructure evolution of U3Si2 with thermal treatment time, while Section 3.2 and Section 3.3 exhibit the statistical method and result for corresponding grain size and distribution, respectively. Finally, in Section 4, we provide the main conclusions.
2 Phase-field model of grain nucleation and growth
Phase field is a mesoscale method that adopts the Ginzburg–Landau free energy constructed with one or multiple order parameters to depict the symmetry breaking of the system. The equation of motion for the phase-field methodology generally adopts the Cahn–Hilliard equation for conserved fields and the Allen–Cahn equation for nonconserved fields. It accommodates the macro contribution from ingredients and the environment, as well as the micro information on the surface and local stress heterogeneity. The phase-field method for grain growth of various metallics and ceramics has provided valuable knowledge (Chen and Yang, 1994; Chen, 2002; Rest and Hofman, 2004; Millett et al., 2008; Ahmed et al., 2014; Tonks et al., 2014; Liang et al., 2016; Mei et al., 2016; Li et al., 2017; Cheniour et al., 2020), inspiring the understanding of U3Si2.
This work concerns the grain nucleation and growth of U3Si2, and nonconserved order parameters and the Allen–Cahn-type dynamic equation are adopted. The grain boundary energy and mobility of grains with different orientations are well formulated. The free energy is a function of the distribution of the order parameters. The grains were characterized by a set of order parameters
where F0 is the free-energy barrier coefficient,▽ is the Nabla operator, κ is the gradient energy coefficient, and γij is the interface energy coefficient.
Using the free-energy functional, we can compute the specific grain boundary energy of the system of two grains ηi and ηj (with a flat interface x = 0 in a one-dimensional case) (Aagesen et al., 2020), which is given by the integral
where x is the coordinate perpendicular to the grain boundary. A topographical view of the free-energy density (the term in square brackets in Eq. 1) is shown in Moelans et al. (2008a).
According to the principles of variational calculus, the functions
Or, equivalently, the integrated equation
where boundary conditions are taken into account, the rearrangement of this equation gives
A combination of these two equations in Eq. 4 gives
The model energetic parameter
As usual, for the special case
The interface profile can be obtained by considering a symmetrical case, where
When applying
The Allen–Cahn dynamical equation has the following form:
where
To compute appropriate values of both
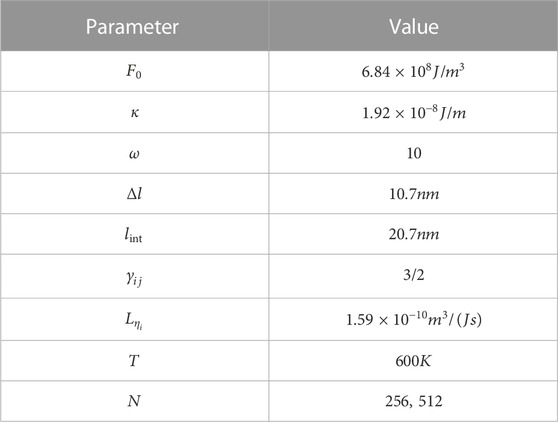
TABLE 1. Parameters used for phase-field simulations.
3 Simulation results and mathematical statistical analysis
3.1 Microstructure evolution
The simulations were performed at a typical operating temperature of 600 K with the characteristic length
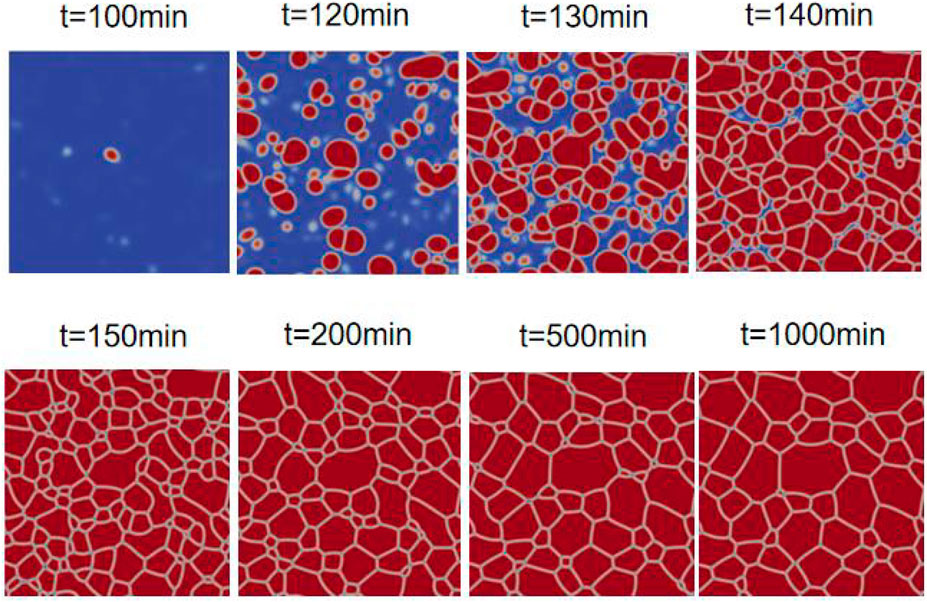
FIGURE 1. Typical scenario of the system evolution with N = 256, L = 2.739 µm, and T = 600 K, at various timesteps t.
3.2 Statistical analysis of the average grain size
It can be found that the grain boundary (G.B.) energy and mobility are the two main parameters required to be determined for grain growth in U3Si2, based on the analysis and research of Cheniour et al. (2020). During normal grain growth, the applied pressure on a grain boundary is given by
where
where the constant
The average grain size is defined as
where grain topology is included into the geometric constant
Here,
Temperature dependence of the grain boundary energy for U3Si2 by MD simulations (Beeler et al., 2019) was found:
The rate constant and grain mobility dependencies on temperature were measured by experimental data (Cheniour et al., 2020):
By comparing Eqs 16, 17, 20, 21, we can obtain:
Data analysis allows one to obtain the grain area, mean grain size, and amount of grains computed directly from the simulation procedure. The corresponding results are shown in Figure 2 for systems of the linear size L = 2.739 µm and L = 5.478 µm. From Figure 2A, it is seen that the grain area increases in time, according to the linear time law. Our simulated grain size is ∼180 nm, which is two orders of magnitude smaller than the experimental values (between 16 and 18 μm from an initial irradiation experiment). It is to be noted that many factors, such as irradiation and heat treatment time, can influence the grain size; our simulation still can act as a reference for grain morphology investigation after heat treatment in the experiment. From Figure 2B one finds that the mean grain radius increases in time in a power law form with a scaling growth exponent of 0.42, which is quite close to the theoretically predicted value, 1/2 (Cheniour et al., 2020). It is important that this grain size variation is observed at a late stage when grain grows following the Ostwald ripening scenario in which large grains grow by consuming the small ones. In Figure 2C, we plot the time dependencies of the grain amount. It follows that the grain number increases rapidly at grain nucleation stages until grains occupy the whole system volume. One can clearly observe the scaling dynamics of the grain radius and area at the later stage when the number of grains decays. Usage of the fitting procedure allows one to find that this kind of decrease can be described well by the exponential decaying function; the exponential decaying function in red in Figure 2C coincides with the simulation results. One must point out that obtained results concerning the scaling behavior of described values are independent of the system size. The size of the system affects only the grain size and their amount due to the influence of periodic boundary conditions and a lack of grains with different morphology, as observed in systems with large sizes.
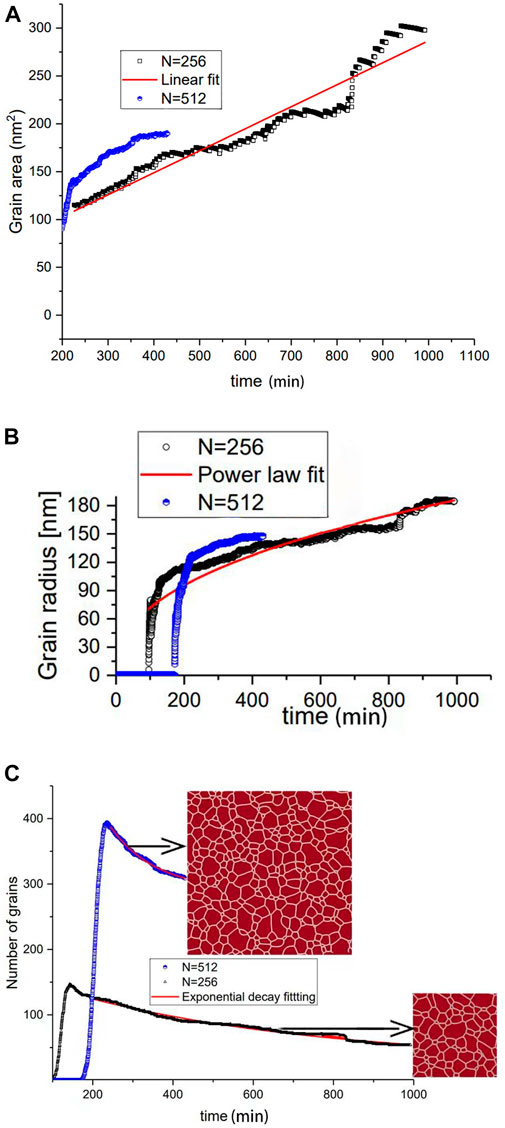
FIGURE 2. (A) Grain area dynamics,(B) grain radius dynamics, and (C) number of grains at N = 256 and L = 2.739 µm, and N = 512 and L = 5.478 µm.
3.3 Statistical analysis of grain distribution
In general, Eq. 13 is written for the mean radius of grains. In further consideration, we put resistive pressure equals to zero and assume that some grains can decrease in size due to a change in the number of edges. During the system’s evolution, the grains with edges of fewer than six disappear. This process is reoccurrence through a relaxation process with time
The total net change of the concentration of grains is
An equilibrium grain population is defined in a stationary case resulting in the following equation:
A solution of Eq. 22 for the distribution function can be found in quadratures:
where
Based on the substituting growth speed Eq. 16 into Eq. 25 and assuming Pr→0, one gets the Rayleigh distribution function:
This distribution can be used in a fitting procedure to describe numerically obtained results and experimental observations.
In addition, in a nonstationary case, we exploit the Fourier method:
where y is the grain radius scaled in a(t);
where the corresponding time dependence defined by
Through substituting time derivatives and spatial derivatives as
Next, we set both sides of Eq. 29 to the same constant
Furthermore, we can get the following two equations of the form:
where
Figure 3 shows our simulated grain size distribution along with grain area evolution at different times. It follows that all data are lying in statistically the same trend. Our result manifests a universal grain size distribution function as was predicted by theoretical studies (Vaz and Fortes, 1988). More importantly, the fitting procedure allows one to choose a more accurate distribution function for describing objects like voids, bubbles, and grains. In our case, the lognormal type and Rayleigh distribution function are used for data fitting. After comparing the

FIGURE 3. Grain size distribution function at N = 512 and L = 5.478 µm.
4 Conclusion
In our work, a phase-field simulation was provided at a temperature of 600 K at grids with characteristic length
Data availability statement
The original contributions presented in the study are included in the article/supplementary material; further inquiries can be directed to the corresponding authors.
Author contributions
CM: model development, data analysis, and writing the original draft. MZ: data analysis, checking, and writing the original draft. TX: conceptualization and methodology. LW: conceptualization, supervision, and funding acquisition. RP: methodology and data analysis. JQ: software, methodology, and data analysis. JZ: methodology, software, and supervision.
Funding
This work is supported by the Sichuan Science and Technology Program (Grant no. 2022JDGD0040).
Conflict of interest
The authors declare that the research was conducted in the absence of any commercial or financial relationships that could be construed as a potential conflict of interest.
Publisher’s note
All claims expressed in this article are solely those of the authors and do not necessarily represent those of their affiliated organizations, or those of the publisher, the editors, and the reviewers. Any product that may be evaluated in this article, or claim that may be made by its manufacturer, is not guaranteed or endorsed by the publisher.
References
Aagesen, L. K., Andersson, D., Beller, B. W., Cooper, M. W., Gamble, K. A., Miao, Y., et al. (2020). Phase-field simulations of intergranular fission gas bubble behavior in U3Si2 nuclear fuel. J. Nucl. Mater. 541, 152415. doi:10.1016/j.jnucmat.2020.152415
Ahmed, K., Pakarinen, J., Allen, T., and El-Azab, A. (2014). Phase field simulation of grain growth in porous uranium dioxide. J. Nucl. Mater. 446, 90–99. doi:10.1016/j.jnucmat.2013.11.036
Ansari, T. Q., Huang, H., and Shi, S. Q. (2021). Phase field modeling for the morphological and microstructural evolution of metallic materials under environmental attack. npj Comput. Mat. 7 (1), 143–221. doi:10.1038/s41524-021-00612-7
Atkinson Hv, H. V. (1988). Overview no 65: Theories of normal grain growth in pure singlephase systems. Acta Metall. 36, 469.
Azeem, M. M., Wang, Q., Zhang, Y., Liu, S., and Zubair, M. (2019). Effect of grain boundary on diffusion of P in alpha-Fe: A molecular dynamics study. Front. Phys. 7, 97. doi:10.3389/fphy.2019.00097
Beeler, B., Baskes, M., Andersson, D., Cooper, M. W., and Zhang, Y. (2019). Molecular dynamics investigation of grain boundaries and surfaces in U3Si2. J. Nucl. Mater. 514, 290–298. doi:10.1016/j.jnucmat.2018.12.008
Bischoff, J., Blanpain, P., Brachet, J. C., Lorrette, C., Ambard, A., Strumpell, J., et al. (2016). Development of fuels with enhanced accident tolerance, accident tolerant fuel concepts for light water reactors. United States of America: IAEA Tecdoc. 1797:22-29.
Blikstein, P., and Tschiptschin, A. P. (1999). Monte Carlo simulation of grain growth. Mat. Res. 2, 133–137. doi:10.1590/s1516-14391999000300004
Chen, L. Q. (2002). Phase-field models for microstructure evolution. Annu. Rev. Mat. Res. 32, 113–140. doi:10.1146/annurev.matsci.32.112001.132041
Chen, L. Q., and Yang, W. (1994). Computer simulation of the domain dynamics of a quenched system with a large number of nonconserved order parameters: The grain-growth kinetics. Phys. Rev. B 50, 15752–15756. doi:10.1103/physrevb.50.15752
Cheniour, A., Tonks, M., Gong, B., Yao, T., He, L., Harp, J. M., et al. (2020). Development of a grain growth model for U3Si2 using experimental data, phase field simulation and molecular dynamics. J. Nucl. Mater. 532, 152069. doi:10.1016/j.jnucmat.2020.152069
Davidge, R. W., and Evans, A. G. (1969). The strength and fracture of stoichiometricpolycrystalline UO2. J. Nucl. Mater. 33, 249–260. doi:10.1016/0022-3115(69)90019-1
Fan, D., and Chen, L. Q. (1997). Computer simulation of grain growth using a continuum field model. Acta Mat. 45, 611–622. doi:10.1016/s1359-6454(96)00200-5
Forsberg, K., and Massih, A. R. (2001). “Theory of fission gas release during grain growth,” in the 16th International Conference on Structural Mechanics in Reactor Technology, Washington DC, August 2001.
Frost, H. J., and Thopson, C. V. (1996). Computer simulation of grain growth. Curr. Opin. Solid State Mat. Sci. 1, 361–368. doi:10.1016/s1359-0286(96)80026-x
Harding, J. H., and Martin, D. G. (1989). A recommendation for the thermal conductivity of UO2. J. Nucl. Mater. 166 (3), 223–226. doi:10.1016/0022-3115(89)90218-3
III Krill, C. E., and Chen, L. Q. (2002). Computer simulation of 3D grain growth using a phase-field model. Acta Mat. 50, 3059–3075. doi:10.1016/s1359-6454(02)00084-8
Kapoor, K., Ahmad, A., Laksminarayana, A., and Hemanth Rao, G. V. (2007). Fracture properties of sintered UO2 ceramic pellets with duplex microstructure. J. Nucl. Mater. 366, 87–98. doi:10.1016/j.jnucmat.2006.12.044
Kobayashi, R., Warren, J. A., and Carter, W. C. (2000). A continuum model of grain boundaries. Phys. D. Nonlinear Phenom. 140, 141–150. doi:10.1016/s0167-2789(00)00023-3
Li, Y., Hu, S., Sun, X., and Stan, M. (2017). A review: Applications of the phase field method in predicting microstructure and property evolution of irradiated nuclear materials. npj Comput. Mat. 3, 16. doi:10.1038/s41524-017-0018-y
Li, Y., Zhou, J., Li, R., and Zhang, Q. (2021). Molecular dynamics simulation of zener pinning by differently shaped and oriented particles. Front. Mat. 8, 152. doi:10.3389/fmats.2021.682422
Liang, L., Mei, Z. G., Kim, Y. S., Ye, B., Hofman, G., Anitescu, M., et al. (2016). Mesoscale model for fission-induced recrystallization in U-7Mo alloy. Comput. Mat. Sci. 124, 228–237. doi:10.1016/j.commatsci.2016.07.033
Liu, Y., Baudin, T., and Penelle, R. (1997). Simulation of normal grain growth by cellular automata. Scr. Mat. 34, 1679–1683. doi:10.1016/1359-6462(96)00055-3
Lobkovsky, A. E., and Warren, J. A. (2001). Sharp interface limit of a phase-field model of crystal grains. Phys. Rev. E 63, 051605. doi:10.1103/physreve.63.051605
Mei, Z. G., Liang, L., Kim, Y. S., Wiencek, T., O'Hare, E., Yacout, A. M., et al. (2016). Grain growth in U-7Mo alloy: A combined first-principles and phase field study. J. Nucl. Mater. 473, 300–308. doi:10.1016/j.jnucmat.2016.01.027
Miao, Y. B., Gamble, K. A., Andersson, D., Mei, Z. G., and Yacout, A. M. (2018). Rate theory scenarios study on fission gas behavior of U3Si2 under LOCA conditions in LWRs. Nucl. Eng. Des. 326, 371–382. doi:10.1016/j.nucengdes.2017.11.034
Miao, Y. B., Gamble, K. A., Andersson, D., Ye, B., Mei, Z. G., Hofman, G., et al. (2017). Gaseous swelling of U3Si2 during steady-state LWR operation: A rate theory investigation. Nucl. Eng. Des. 322, 336–344. doi:10.1016/j.nucengdes.2017.07.008
Millett, P. C., Wolf, D., Desai, T., Rokkam, S., and El-Azab, A. (2008). Phase-field simulation of thermal conductivity in porous polycrystalline microstructures. J. Appl. Phys. 104, 033512. doi:10.1063/1.2964116
Moelans, N., Blanpain, B., and Wollants, P. (2008). An introduction to phase field modeling of microstructure evolution. Calphad 32, 268–294. doi:10.1016/j.calphad.2007.11.003
Moelans, N., Blanpain, B., and Wollants, P. (2008). Quantitative analysis of grain boundary properties in a generalized phase field model for grain growth in anisotropic systems. Phys. Rev. B 78, 024113. doi:10.1103/physrevb.78.024113
Oguma, M. (1982). Microstructure effects on fracture strength of UO2 fuel pellets. J. Nucl. Sci. Technol. 19, 1005–1014. doi:10.1080/18811248.1982.9734249
Rest, J., and Hofman, G. L. (2004). A model for fission-gas-bubble behavior in amorphous uranium silicide compounds. J. Nucl. Mater. 325, 107–117. doi:10.1016/j.jnucmat.2003.11.008
Srezende, J. L. L., Pezzolla, F., Nestler, B., SeeBelberg, M., Prieler, R., Schmitz, G., et al. (1996). A phasefield concept for multiphase systems. Phys. D. Nonlinear Phenom. 94, 135–147. doi:10.1016/0167-2789(95)00298-7
Terrani, K. A., Wang, D., Ott, L. J., and Montgomery, R. O. (2014). The effect of fuel thermal conductivity on the behavior of LWR cores during loss-of-coolant accidents. J. Nucl. Mater. 448 (1-3), 512–519. doi:10.1016/j.jnucmat.2013.09.051
Tonks, M. R., Zhang, Y., Bai, X., and Millett, P. C. (2014). Demonstrating the temperature gradient impact on grain growth in UO2 using the phase field method. Mat. Res. Lett. 2, 23–28. doi:10.1080/21663831.2013.849300
Vaz, M. F., and Fortes, M. A. (1988). Grain size distribution: The lognormal and the gamma distribution functions. Scr. Metall. 22 (1), 35–40. doi:10.1016/s0036-9748(88)80302-8
Wakai, F., Enomoto, N., and Ogawa, H. (2000). Three dimensional microstructural evolution in ideal grain growth general statistics. Acta Mat. 48, 1297–1311. doi:10.1016/s1359-6454(99)00405-x
Wen, Y. H., Wang, B., Simmons, J. P., and Wang, Y. (2006). A phase-field model for heat treatment applications in Ni-based alloys. Acta mater. 54 (8), 2087–2099. doi:10.1016/j.actamat.2006.01.001
Westinghouse Electric Company (2015). Development of LWR fuels with enhanced accident tolerance. United States: Final Technical Report.
Weygand, D., Brechet, Y., and Lepinoux, A. (1998). A vertex dynamics simulation of grain growth in two dimensions. Philos. Mag. B 78, 329–352. doi:10.1080/014186398258014
White, J. T., Nelson, A. T., Dunwoody, J. T., Byler, D., Safarik, D., and McClellan, K. (2015). Thermophysical properties of U3Si2 to 1773 K. J. Nucl. Mater. 464, 275–280. doi:10.1016/j.jnucmat.2015.04.031
Keywords: U3Si2 fuel, phase-field simulation, grain nucleation and growth, exponential decaying, Rayleigh distribution
Citation: Ma C, Zhao M, Xin T, Wu L, Pan R, Qin J and Zhang J (2023) Phase-field simulation of grain nucleation, growth, and Rayleigh distribution of U3Si2 nuclear fuel. Front. Energy Res. 10:1080819. doi: 10.3389/fenrg.2022.1080819
Received: 26 October 2022; Accepted: 28 November 2022;
Published: 26 January 2023.
Edited by:
Shichang Liu, North China Electric Power University, ChinaReviewed by:
Mustafa Azeem, Xi’an Jiaotong University, ChinaDi Yun, Xi’an Jiaotong University, China
Copyright © 2023 Ma, Zhao, Xin, Wu, Pan, Qin and Zhang. This is an open-access article distributed under the terms of the Creative Commons Attribution License (CC BY). The use, distribution or reproduction in other forums is permitted, provided the original author(s) and the copyright owner(s) are credited and that the original publication in this journal is cited, in accordance with accepted academic practice. No use, distribution or reproduction is permitted which does not comply with these terms.
*Correspondence: Lu Wu, d3VsdTEwMDJAcXEuY29t; Jing Zhang, SmluZ3poYW5nQG53cHUuZWR1LmNu
†These authors have contributed equally to this work