 Yanhong Guo
 Yong Ren
 Tuo Hou
 Jing Wang
 Chengbo Wang
- 1Department of Mechanical, Materials and Manufacturing Engineering, University of Nottingham Ningbo China, Ningbo, China
- 2Research Group for Fluids and Thermal Engineering, University of Nottingham Ningbo China, Ningbo, China
- 3Nottingham Ningbo China Beacons of Excellence Research and Innovation Institute, Ningbo, China
- 4Key Laboratory of Carbonaceous Wastes Processing and Process Intensification Research of Zhejiang Province, University of Nottingham Ningbo China, Ningbo, China
- 5Department of Electrical and Electronic Engineering, University of Nottingham Ningbo China, Ningbo, China
LMPA droplets or particles have contributed to many fields such as the application of sensors and valves, and droplet-based microfluidics has been applied to the preparation of LMPA droplets. Understanding how flow rate, interfacial tension, and temperature affect the formation and solidification of droplets is helpful to design a microfluidic platform. In this study, a coupled VOF and enthalpy-porosity method will be used to numerically simulate how these factors affect the LMPA droplet formation and solidification process. We find that increasing the velocity of the continuous phase or decreasing the interfacial tension will reduce the LMPA droplet size and simultaneously increase the frequency of droplet formation. In addition, increasing the interfacial tension will decrease the required solidification time of LMPA droplets, and the solidification time of droplets will first increase and then decrease with the growth of continuous-phase velocity. On the other hand, increasing the continuous-phase temperature or cooling wall temperature will reduce the solidification time of LMPA droplets, but has no obvious influence on the size and frequency of droplet generation.
1 Introduction
In recent years, low-melting-point alloy (LMPA) particles have been widely used in many fields because of their unique advantages. For example, micro LMPA particles are useful for conductive inks (Boley et al., 2015; Cano-Raya et al., 2019), sensors (Won et al., 2015; Tang et al., 2016), and composite materials (Mohammed et al., 2014; Bartlett et al., 2016). Applications such as mixers (Shamberger et al., 2017), pumps (Tang et al., 2014), and valves (Sander and Weigand, 2009) usually only need a small amount of LMPA particles, but the particle diameter needs to be accurately controlled. One method of controlling the particle size is to directly produce monomer or liquid droplets approximately equal to the desired particle size, and then to polymerize or solidify the droplets. Typical methods of forming micro- and nano-scale droplets include on-chip (Tang et al., 2016) or off-chip sonication treatment (Zhang et al., 2014) or molding (Mohammed et al., 2014). However, it is difficult to continuously produce micron-sized droplets in molding, and sonication cannot accurately control the droplet size. T-junction or flow-focusing microfluidic systems are able to continuously generate micro-scale droplets with a uniform diameter (Stone et al., 1986; Fu et al., 2012; Jamalabadi et al., 2017; Li et al., 2019a; Outokesh et al., 2022). Thus, in recent years, several experimental and numerical methods have been used to study and evaluate the droplet formation process and its influencing process based on these devices (Li et al., 2019a; Cui et al., 2019; Lei et al., 2020; Outokesh et al., 2022). Computational fluid dynamics (CFD) simulation provides a method for an in-depth understanding of this complicated process. Typically, the level-set method (LS) (Yap and Chai, 2012; Liu et al., 2015; Shin et al., 2018; Helland et al., 2019; Valle et al., 2020), volume of fluid (VOF) method (Soh et al., 2016; Chaves et al., 2020; Sattari et al., 2020; Garoosi and Hooman, 2022), and lattice Boltzmann method (Kim and Pitsch, 2015; Reijers et al., 2016; Wu et al., 2021; Li et al., 2022) are used to model the multiphase flow. Among them, the VOF technique is the most commonly employed technique to simulate the free surface in academic and commercial CFD software packages (Hirt and Nichols, 1981). One of the advantages of the VOF method is volume conservation because for a specific phase in each unit, it is the volume fraction which is calculated and tracked in this model instead of the interface. Based on the VOF technique, Hoang et al. (2013) carefully investigated the splitting processes of droplets in microchannels and the results showed that the rapid pinching of droplets was driven by the surface tension, which was consistent with previous experiments (Stone et al., 1986). Nekouei and Vanapalli (2017) extended the study of droplet formation with a high viscosity ratio using the VOF method and found that the squeezing time for droplet generation increased with the increase in the high viscosity ratio. Li et al. (2019b) used the VOF method to numerically address the droplet-generation process in ordinary and improved T-junction structures, and they successfully decreased the droplet size while improving monodispersity. However, all of these simulations and experiments studies in the aforementioned articles mainly focused on the generation process of water droplets or oil droplets.
Compared with these conventional fluids, liquid LMPA has obviously higher interfacial tension and density, so it is necessary to study how different factors influence the formation of LMPA droplets. Some scholars have experimentally demonstrated the feasibility of generating LMPA droplets using the microfluidic device (Hutter et al., 2012; Tian et al., 2017; Tian et al., 2021). For example, Hutter et al. (2012) reported the generation of spherical and non-spherical eutectic gallium indium (EGaIn) liquid metal droplets in a microfluidic device around room temperature. The results show that the volume of droplets was determined by the channel size and the applied flow rates, and non-spherical LMPA droplets could be produced in oxidized silicone oil. Tian et al. (2017) proposed a liquid metal–based microfluidic device to produce liquid droplets and actively sort the liquid metal droplets using dielectrophoresis. The results showed that the microsystem could produce uniform spherical metal droplets and dominate the flow orientation of the droplets. However, these literature works only focused on the formation of liquid droplets, without paying attention to the solidification behavior of droplets in microfluidic devices. In order to account for the phase change, some numerical models based on the phase-field (PF) method (Tourret and Karma, 2015; Takaki et al., 2016; Dong et al., 2020), cellular automaton (CA) approach (Yuan and Lee, 2012; Hu et al., 2020), or enthalpy-porosity method (Brent et al., 1988; Le Bars and Worster, 2006; Chakraborty and Dutta, 2011; Seredyński and Banaszek, 2021) have been explored and applied to simulate the solidification of LMPA fluid. For example, Hu et al. (2020) employed a 2D CA-finite different method model to study the microstructure transformation of columnar dendrites during the directional solidification of LMPA. The results showed that several dendrite competitive growth patterns were reproduced between two divergent and convergent dendrite series; in addition, with the rising of cooling rate and temperature gradient, the tertiary dendrites located in the dispersed grain boundary preferred to develop into new primary dendrite arms. Takaki et al. (2016) and Tourret and Karma (2015) presented 2D PF models for simulating the growth competition of columnar dendrites and examined the effects of the solute interaction, grain bicrystallography, and temperature gradient on the microstructural variation of bicrystal dendrites during the directional solidification period. Chakraborty and Dutta (2011) studied the solidification process of LMPA using the enthalpy-porosity method, and the results showed that the solid movement has a significant effect on the growth and macro-segregation of the solid front.
The enthalpy-porosity method converges rapidly and can produce precise results for the morphology and position of the phase change front at different times with a lower computational cost (Brent et al., 1988). Therefore, in this study, a coupled VOF and enthalpy-porosity method will be used to predict the formation and solidification properties of LMPA droplets in a flow-focusing device. The effects of flow velocity, interfacial tension, continuous-phase temperature, and wall temperature on the LMPA droplet formation and solidification process will be examined in detail.
2 Governing Equations and Boundary Conditions
For the numerical analysis of the droplet generation and solidification process, the following assumptions were made: (1) the two-phase fluid was Newtonian and incompressible; (2) the flow in the microchannel was unsteady and laminar, ignoring viscous dissipation; (3) the thermal properties of the liquid and solid phases were assumed to be constants; (4) the 3D convection was not taken into account, as a 2D model was used in this study.
The numerical method in this study is based on the VOF and enthalpy-porosity method of the commercial code FLUENT. The governing equations for the mass conservation and momentum conservation are given as follows:
where
The interface tracking between the phases was achieved by solving the following volume fraction continuity equation:
The density and dynamic viscosity in equation Eq. 2 can be calculated as follows:
where
The continuum surface force (CSF) method was applied to achieve the interfacial surface force term in Eq. 2, where:
where
where
Defining the contact angle at the channel wall θ to consider wall adhesion and calculate the surface normal at the reference cell close to the channel wall was performed using the following formula:
where
Energy equation can be written as Eq. 9:
where
where

TABLE 1. Material properties and initial parameters of oil-LMPA system.
The source term
where
The boundary conditions are as follows:
Inlet:
Outlet:
Wall:
where
It is complex and time-consuming to conduct a 3D simulation for the process of droplet generation. Although the 2D model is vulnerable to some errors, its computational cost is lower than that of the 3D model; the 2D plot of the dispersed phase versus continuous versus contours in the literature (Serra et al., 2007) indicated that the depth curvature can be negligible and it is sufficient for the 2D assumption to eliminate the general features of the system. The 2D numerical method used in this study is validated in Section 4 by comparing it with the experimental results of the LMPA droplet formation in a 3D microchannel junction proposed by Hutter et al. (2012).
The equations are solved using Ansys Fluent 2021R1 software. A two-dimensional model is established. The PRESTO! scheme is employed to compute the pressure equation. The pressure–velocity coupling term is discretized using the PISO scheme and the second-order upwind scheme is adopted for the momentum equation and the interpolation of the interface geometry is solved using the Geo Reconstruct method.
3 Simulation Setups
A schematic view for a cross-flow–focusing device case model used for simulation in the present study is shown in Figure 1A. Material properties and the initial values used in the simulation are given in Table 1. Liquid LMPA which has been heated to 290 K was used as the dispersed phase and silicone oil was used as the continuous phase. The LMPA liquid phase entered from inlet 1, and the silicone oil phase entered from inlets 2 and 3. In this study, the rectangular mesh was used as shown in Figure 1B.
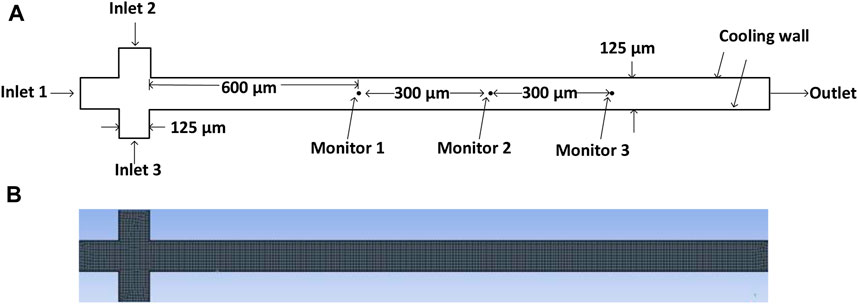
FIGURE 1. (A) Schematic view for the microfluidic case model used for simulation; (B) geometry of cross flow-focusing device with mesh.
The dependence on the cell size and time steps was examined by using four mesh sizes (4,802, 12,046, 23,498, and 42,418) and three time steps (0.0001, 0.00001, and 0.000001 s), and the droplet-generation frequency was almost the same with 23498 and 42418 mesh elements or with 0.00001 and 0.000001 s time steps as shown in Tables 2, 3. Therefore, a step size of 0.00001 s and the model with 23,498 cells were used for the balance of precision and computational cost.

TABLE 2. Droplet-generation frequency at different mesh elements.

TABLE 3. Droplet-generation frequency at different time steps.
4 Model Validation
As there is no suitable reported experimental result for simultaneously realizing the formation and solidification process of the LMPA droplet in the microfluidic device, in order to verify our simulation method, we only simulated the formation process of droplets and compared it with the relevant experimental results.
The coupled VOF and enthalpy-porosity method were used to numerically simulate the formation of LMPA liquid droplets in a flow-focusing microchannel and verified by the experimental results of the microfluidic device (Hutter et al., 2012). Figure 2A shows the design of the microfluidic device with 80-µm nozzle geometry, the depth of the channel was 75 μm, and Figure 2B shows the geometric structure for simulation. The droplets were made of EGaIn (75.5% Ga and 24.5% In by weight) liquid metal solution and the continuous phase was silicone oil. As the working fluids and geometry of this experimental study were very similar to our designed microchannel, these experimental results were selected for verification in the present study. In the simulation, the initial temperature and the inlet temperature of both phases were kept at 300 K, and the wall was insulated. Therefore, the droplets had no heat transfer in the microfluidic channel. A value of 0.09 N/m for the interfacial tension between the LMPA phase and silicone oil phase tested by Hutter et al. (2012) was used in this simulation, and other material properties used are given in Table 1. In order to achieve the numerical results, the simulations were carried out by considering several flow ratios (the ratio of the volumetric flow rate of continuous phase
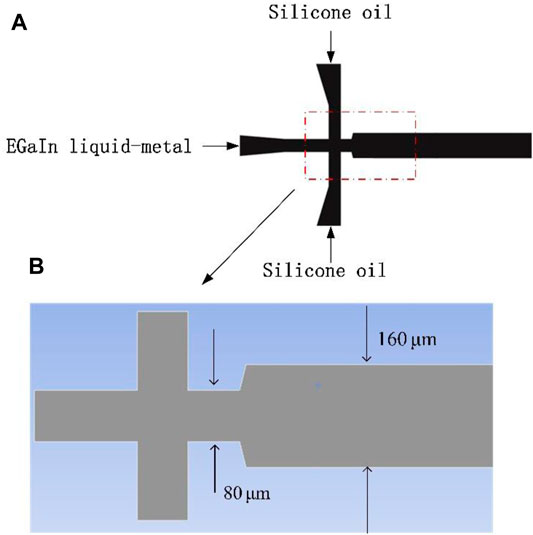
FIGURE 2. Schematic diagram of microfluidic device for verification; (A) schematic diagram used by Hutter et al. (2012) for experimental investigation; (B) geometric structure of simulated channel using Fluent software.
The optimum contact angle should be ascertained before the simulation. Therefore, in this study, different contact angle values of
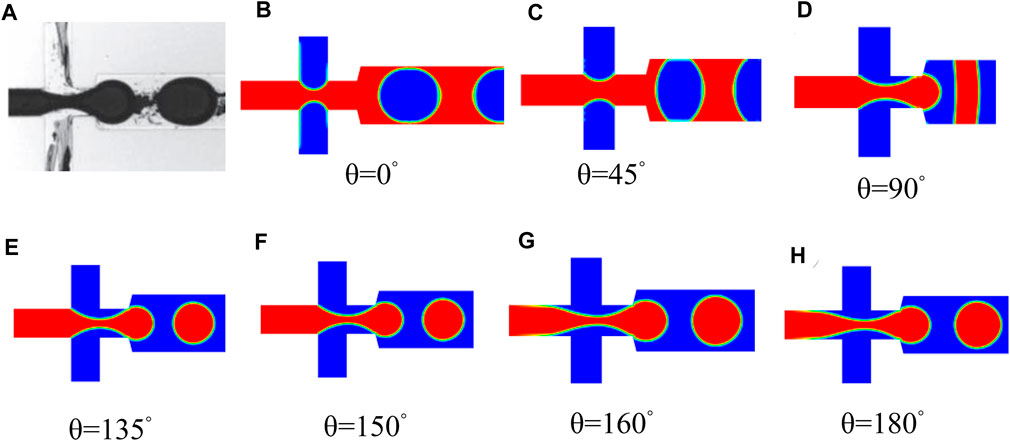
FIGURE 3. Determining the best contact angle of the simulated droplet formation process; (A) Hutter et al. (2012)’s experimental results. Reprinted with permission from “Formation of Spherical and Non-spherical Eutectic Gallium-Indium Liquid-Metal Microdroplets in Microfluidic Channels at Room Temperature.” Copyright (2012) Wiley. (B–H) simulating different contact angles of 0°, 45°, 90°, 135°, 150°, 160°, and 180° for
After ascertaining the optimal contact angle value, the simulations were carried out. In Figure 4A, the droplet-generation frequency obtained by the numerical simulation was in good agreement with the experimental results. Figure 4B showed that the droplet lengths obtained by simulations were slightly smaller than those achieved by the experiment. It is possible that some variations of experimental physical properties (such as small fluctuations of temperature, flow rate, or incomplete straight channel wall) might cause the deviation between observed droplets and simulated sizes. The roughness of the downstream channel might also influence the length of larger droplets.
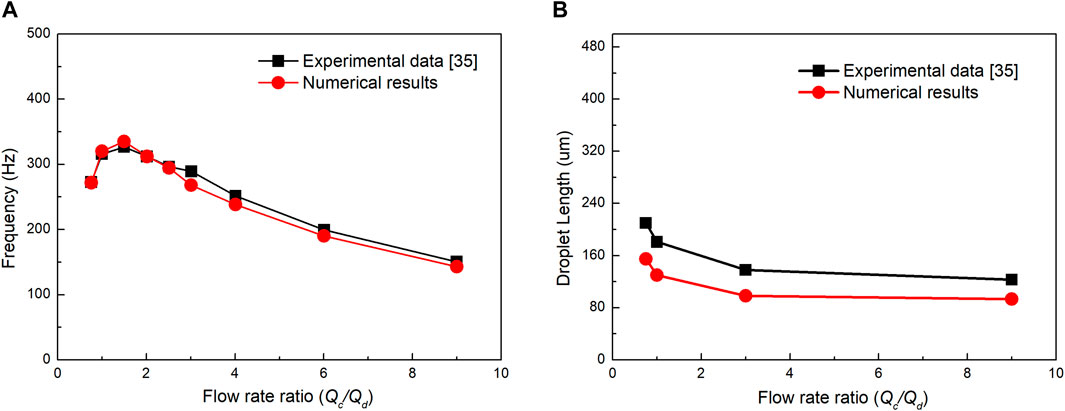
FIGURE 4. (A) Comparison of droplet-generation frequency between numerical results and experimental data; (B) comparison of droplet length between numerical results and experimental data.
In this part, the effect of the mesh size was examined using the number of mesh elements of 4,802, 12,046, 22,823, and 40,441, and the droplet-generation frequency was almost the same with 22,823 and 40,441 mesh elements as shown in Table 4. Therefore, an optimal grid resolution containing 22,823 elements was used for the balance of precision and computational cost. The effect of time steps was also checked, and it is shown that the droplet-generation frequencies were 0.00001 and 0.000001. Thus, simulations were carried out using a time step of 0.00001 s.

TABLE 4. Droplet-generation frequency at different mesh elements.
5 Results and Discussion
To study the effect of the continuous-phase velocity, interfacial tension, continuous-phase temperature, and cooling wall temperature on the droplet formation and solidification process, we use various combinations of parameters for simulation, and the different cases are summarized in Table 5.
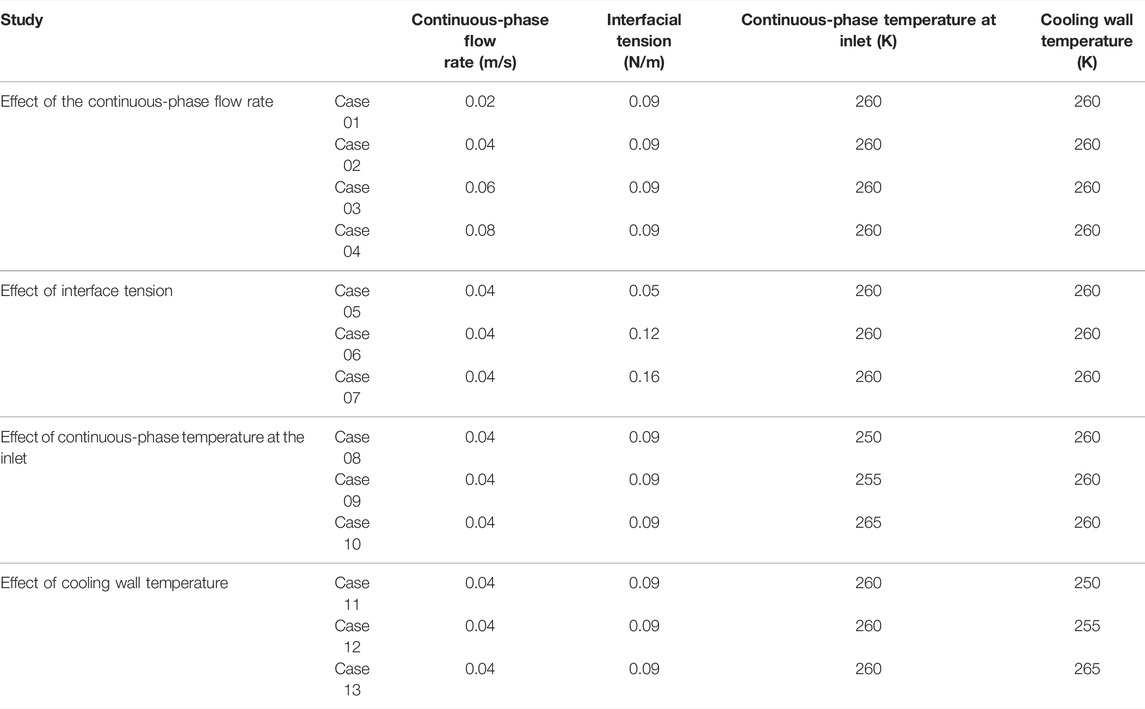
TABLE 5. Details of different cases.
5.1 Characteristics of LMPA Droplet Formation and Solidification
Figures 5A,B, respectively, show the simulation results of the LMPA droplet formation and solidification process in the flow-focusing microfluidic device for case 2, where the dispersed-phase temperature at the inlet is set as 290 K in all considered cases. The mixed phase in the phase-transition state is described by a liquid fraction. As shown in Figure 5B, the continuous phase is always in a liquid state; for the dispersed phase, liquid fraction
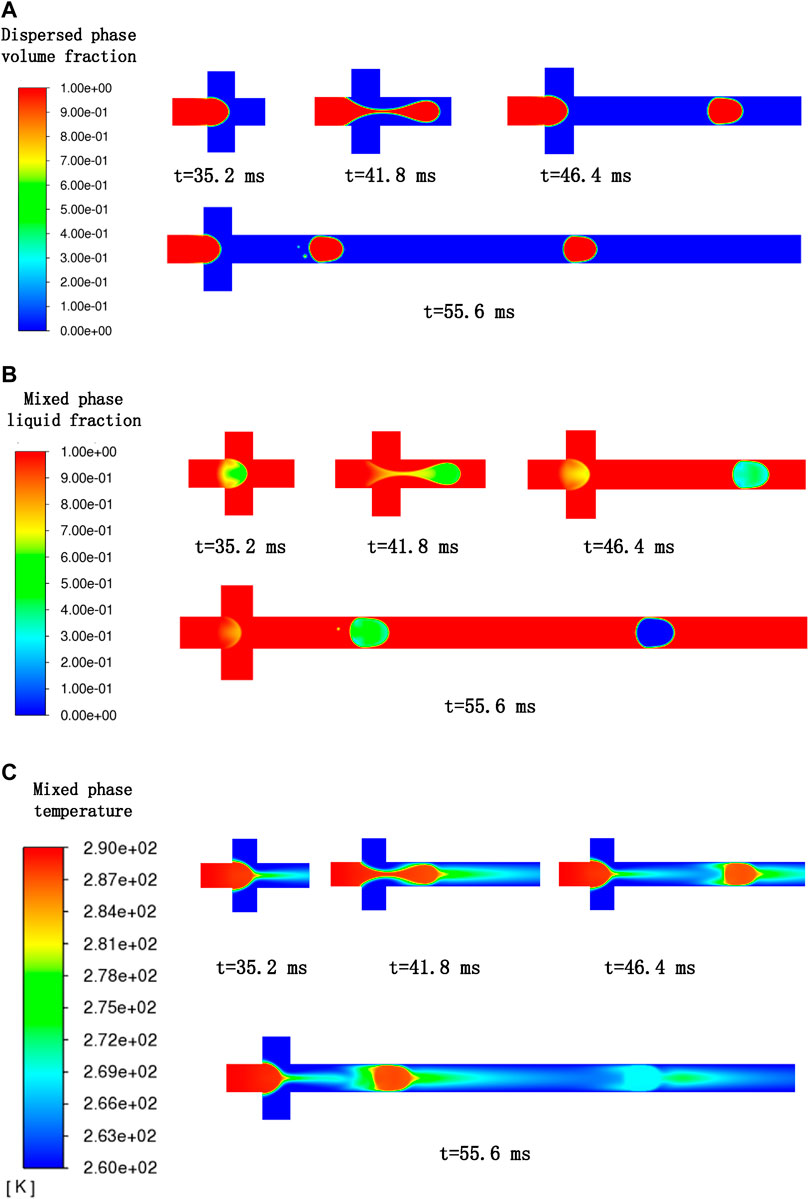
FIGURE 5. (A) Dispersed-phase volume fraction changes with time; (B) mixed-phase liquid fraction changes with time; (C) profile of mixed-phase temperature at different time.
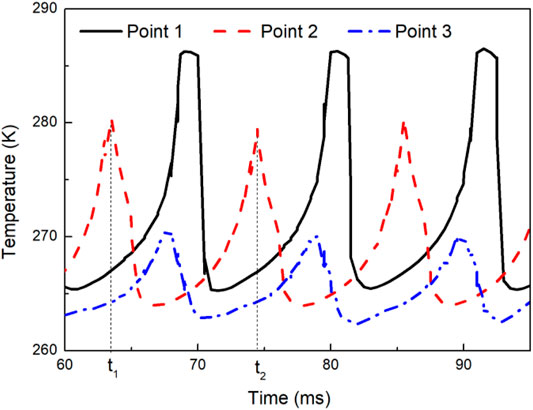
FIGURE 6. Temperature variations at monitoring points 1∼3, for case 3.
5.2 Effects of Continuous-Phase Velocity
In this section, we changed the velocity of the continuous phase from 0.02 m/s to 0.08 m/s and kept all the other parameters unchanged as Table 5 (cases 1, 2, 3, and 4). The visual comparison for the generation and solidification process of LMPA droplets at different continuous-phase velocities is given in Figure 7A. It is can be seen that the continuous-phase velocity greatly affects the droplet-generation process, and the droplet length gradually decreases with increasing continuous-phase velocity, which is due to the shear force of the continuous phase as a pressure acting on the dispersed phase to detach the droplet. Table 6 shows that the frequency of droplet generation increases as the continuous-phase velocity increases. This is because the shear force leads to faster splitting into the continuous phase, thus increasing the droplet formation frequency. These results are consistent with the previous experimental data (Kovalchuk et al., 2018). In addition, Figure 7A also shows that at a lower flow rate, the droplets are completely solidified closer to the inlet, which means that increasing the continuous-phase velocity can increase the distance between the first solidified droplet and the inlet of the microchannel under given conditions. Figure 7B indicates that the temperature distribution of the continuous phase in the channel is almost unaffected by the continuous-phase velocity. However, it is clearly given in Figure 8 that the time required for a single droplet from initial formation to complete solidification first increases and then decreases with the increase in the continuous-phase velocity, which is possibly due to the comprehensive effect of lower temperature when the larger droplets are generated and the rapid heat transfer rate between the smaller droplets and the surrounding environment. Within the given continuous-phase velocity range, LMPA droplets with relatively large size are produced when the velocity is less than or equal to 0.04 m/s (cases 1 and 2), and the temperature of the larger droplets (case 1) is lower than that of the smaller droplets (case 2) just produced. In this case, the influence of the lower temperature on the solidification time exceeds that of the rapid heat transfer between the smaller droplets and the surrounding environment, and thus the time required for a single droplet solidification increases with the increase in continuous-phase temperature. On the contrary, when the continuous-phase velocity is greater than or equal to 0.04 m/s (cases 2, 3, and 4), although the larger droplets just formed have relatively lower temperature, the rapid heat transfer between the smaller droplets and the surrounding environment has more influence on the solidification time than the lower temperature, and thus the time required for a single droplet solidification decreases with the increases in continuous-phase temperature.
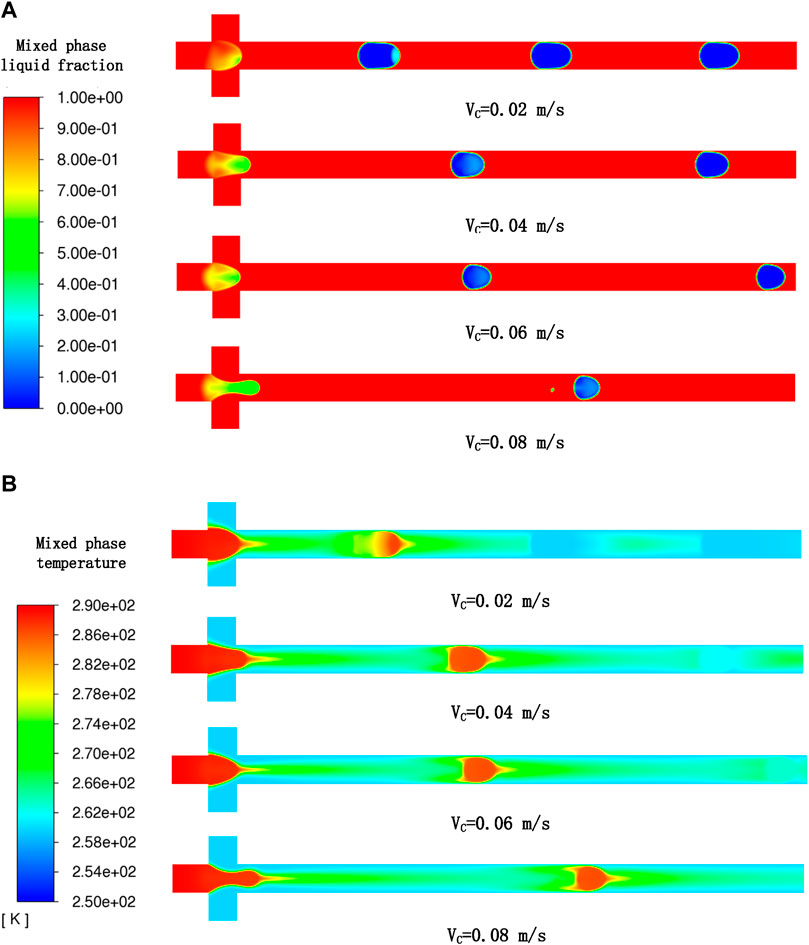
FIGURE 7. (A) Variation of mixed-phase liquid fraction at different continuous-phase velocities; (B) profile of mixed-phase temperature at different continuous-phase velocities.

TABLE 6. Frequency of droplet generation at different continuous-phase velocities.
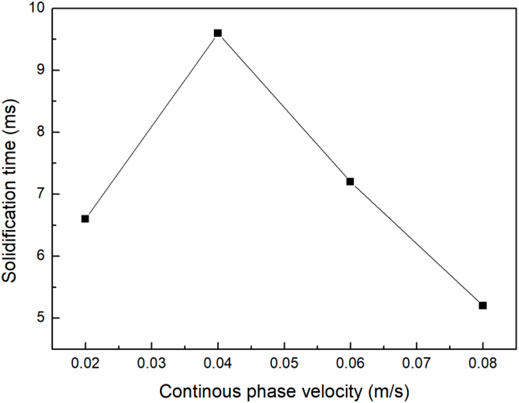
FIGURE 8. Required solidification time per droplet at different continuous-phase velocities.
5.3 Effects of Interfacial Tension
A previous study shows that the interfacial tension has a significant effect on droplet stability and break up time (Zhu and Wang, 2016). In this section, we changed the interfacial tension from 0.05 to 0.16 N/m and all the other factors were kept unchanged as shown in Table 5 (cases 2, 5, 6, and 7). The visual comparison for the LMPA droplet generation and solidification at different interfacial tensions is shown in Figure 9A, which distinctly indicates that the droplet size increases with the increasing interfacial tension. For the frequency, Table 7 shows that it constantly decreases as the interfacial tension grows. This is because the viscous and shear force are suppressed at a higher surface tension value, which leads to the inward contraction of the liquid droplets due to the pressure affected by the interfacial tension. The higher interfacial tension between the two liquids contributes to lower frequency and higher droplet size. On the other hand, when the interfacial tension between liquids is lower, the droplet with higher frequency and size is obtained. Figure 9B shows that the effect of interfacial tension on the temperature distribution of the continuous phase in the microchannel is not obvious. However, as shown in Figure 10, the required time for droplet solidification constantly decreases with the increasing interfacial tension. This is mainly because, within a given interface tension range, the influence of the temperature at the initial formation of droplets on the solidification time exceeds the rapid heat transfer between smaller droplets and the surrounding environment. Therefore, the interface tension and the time required for droplet solidification are linearly related under given conditions.
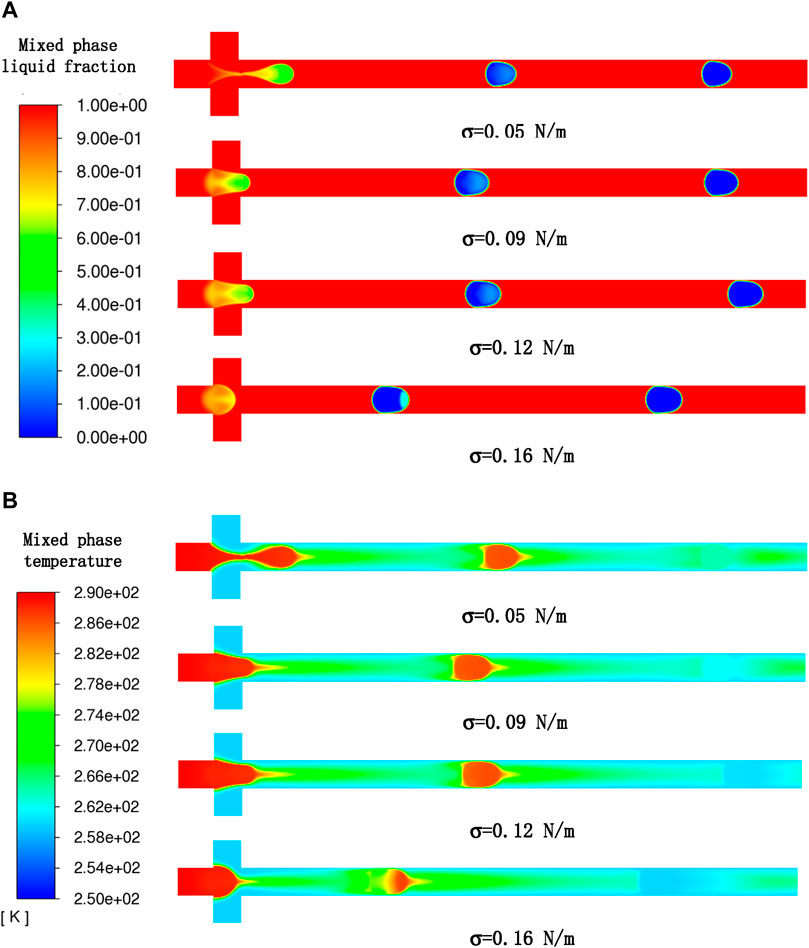
FIGURE 9. (A) Profile of mixed-phase liquid fraction at different interfacial tensions; (B) profile of mixed-phase temperature at different interfacial tensions.

TABLE 7. Frequency of droplet generation at different interface tensions.
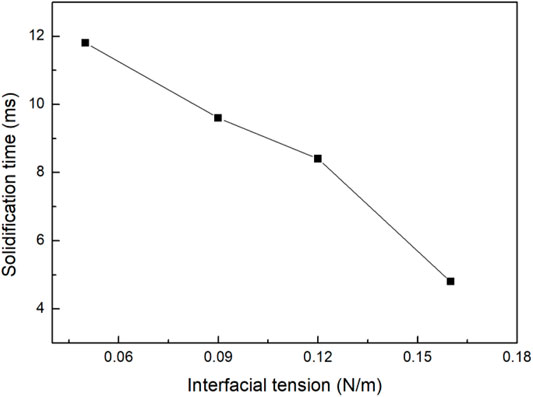
FIGURE 10. Required solidification time per droplet at different interfacial tensions.
5.4 Effects of Continuous-Phase Temperature
In this section, we changed the continuous-phase temperature from 250 to 265 K, and all the other parameters were kept unchanged as shown in Table 5 (cases 2, 8, 9, and 10). The comparison of droplet formation and solidification progress at different continuous-phase temperatures is shown in Figure 11A, which clearly indicates that the LMPA droplet size almost keeps unchanged as the continuous-phase temperature increases. In addition, Table 8 shows that the droplet-generation frequency also almost stays unchanged with the increase in continuous-phase temperature. This is possibly because the influence of the continuous-phase temperature on the shear force or the velocity is not obvious under a given temperature difference and thus barely affects the frequency and droplet size. However, the effect of continuous-phase temperature on the droplet solidification process is relatively obvious, and it is observed from Figure 11A that the droplet that is almost completely solidified in the microchannel at different continuous-phase temperatures is located in different positions in the microchannel. This is because increasing continuous-phase temperature will reduce the temperature gradient along the main microchannel as it is shown in Figure 11B, and thus, it can be observed that the droplets will solidify closer to the inlet at a lower continuous-phase temperature. Figure 12 shows that the time required for a single droplet solidification increases with the increase in continuous-phase temperature, which is mainly because increasing continuous temperature will reduce the heat transfer between droplets and the environment, and further slow the solidification process.
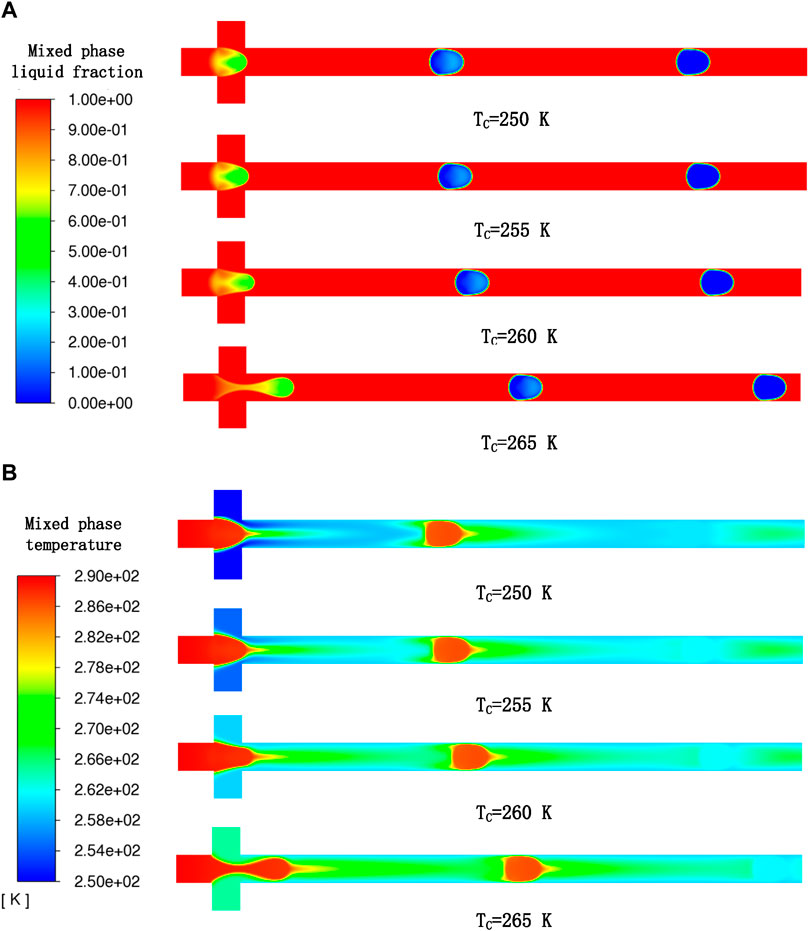
FIGURE 11. (A) Profile of mixed-phase liquid fraction at different continuous-phase temperatures; (B) profile of mixed-phase temperature at different continuous-phase temperatures.

TABLE 8. Frequency of droplet generation at different continuous-phase temperatures.

FIGURE 12. Required solidification time per droplet at different continuous-phase temperatures.
5.5 Effects of Cooling Wall Temperature
In this section, the cooling wall temperature was changed from 250 to 265 K, and all the other parameters were kept unchanged as Table 5 (cases 2, 11, 12, 13). The comparison of LMPA droplet formation and solidification progress at different cooling wall temperatures is shown in Figure 13A, which also clearly indicates that the droplet size almost stays unchanged as the cooling wall temperature increases. Table 9 shows that the droplet-generation frequency almost stays unchanged with the increase in cooling wall temperature. This is possibly because the influence of the cooling wall temperature on the shear force or the phase velocity is not obvious under a given temperature difference and thus barely affects the frequency and droplet size. However, similar to the effect of continuous-phase temperature on the droplet solidification process, it is observed from Figure 13A that the droplet that is almost completely solidified in the microchannel at different cooling wall temperatures is located in different positions in the microchannel. This is because increasing cooling wall temperature will reduce the temperature gradient along the main microchannel as shown in Figure 13B, and thus, it can be observed that the droplets will solidify closer to the inlet at a lower continuous-phase temperature. Figure 14 shows that the time required for a single droplet solidification increases with the increase in cooling wall temperature, which is mainly because increasing cooling wall temperature will reduce the heat transfer between droplets and the environment, and further slow down the droplet solidification process.
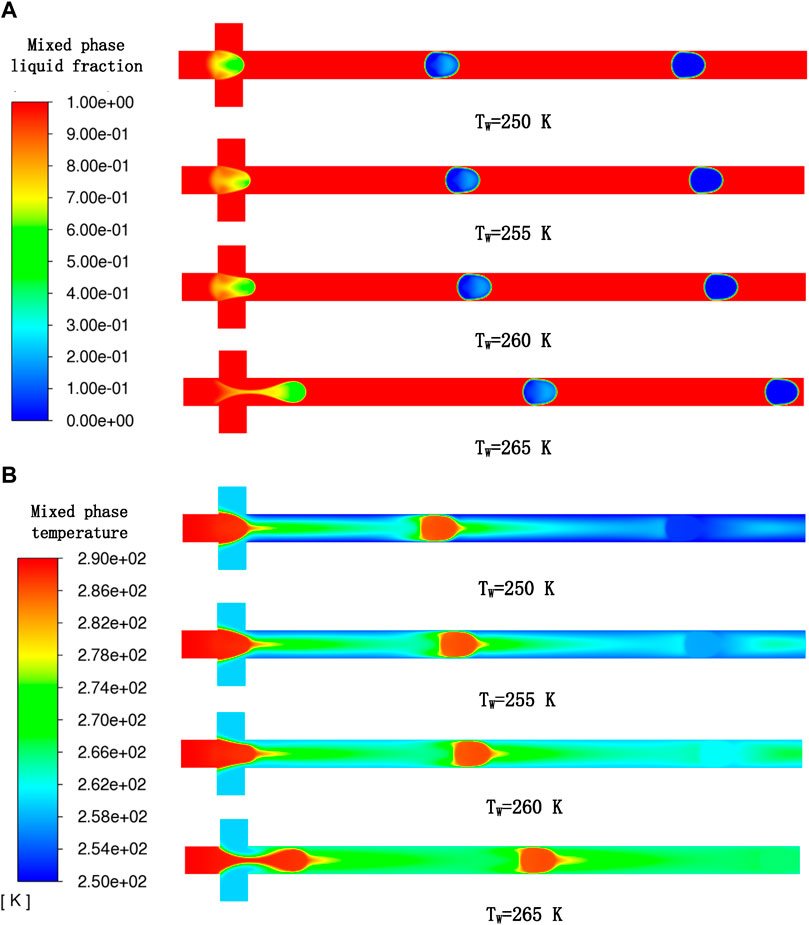
FIGURE 13. (A) Profile of mixed-phase liquid fraction at different cooling wall temperatures; (B) profile of mixed-phase temperature at different cooling wall temperatures.

TABLE 9. Frequency of droplet generation at different cooling wall temperatures.
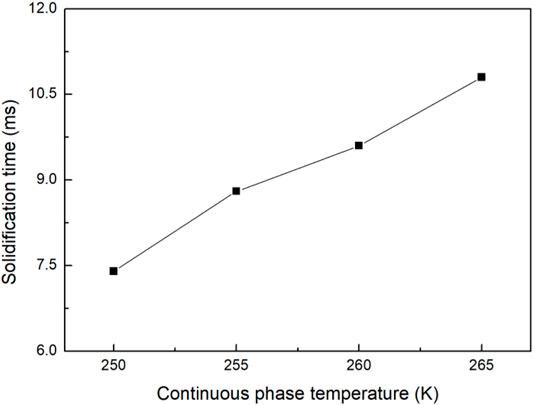
FIGURE 14. Required solidification time per droplet at different cooling wall temperatures.
6 Conclusion
In this study, a simplified two-dimensional cross flow-focusing geometry model is given. Then, a combination of the VOF method and enthalpy-porosity method based on the FLUENT code was applied to examine the effects of some key factors on the LMPA droplet formation and solidification process in a microfluidic device. The main results are as follows:
• Increasing the continuous-phase velocity reduces the LMPA droplet size and simultaneously increases the droplet-generation frequency. The variation of continuous-phase velocity has little effect on the temperature distribution in the microchannel. The required time from droplet generation to complete solidification first increases and then decreases with increasing continuous-phase velocity.
• Increasing the interfacial tension can increase the LMPA droplet size and simultaneously reduce the droplet-generation frequency. The interface tension and the time required for droplet solidification are linearly related. The higher the interfacial tension, the shorter the required time from droplet generation to complete solidification.
• The continuous-phase temperature has no obvious influence on the size and frequency of the generated droplets. However, it has a significant influence on the temperature distribution and the process of LMPA droplet solidification in the microchannel. With the increase in continuous-phase temperature, the required time for droplet solidification gradually decreases.
• Similar to the influence of continuous-phase temperature on the droplet-generation and solidification process, the wall temperature has no obvious effect on the size and frequency of generated LMPA droplets. However, it has a great effect on the temperature distribution and the process of droplet solidification in the microchannel. With the increase in wall temperature, the required time for droplet solidification gradually decreases.
Data Availability Statement
The raw data supporting the conclusion of this article will be made available by the authors, without undue reservation.
Author Contributions
YR proposed the research topic and supervised the research project. YG and TH conducted the numerical modeling and simulation. YG completed the data analysis and drafted the manuscript. JW and CW reviewed the simulation results. All authors reviewed the manuscript.
Funding
This work was financially supported by the National Key R&D Program of China under grant No. 2019YFC0118700, Zhejiang Provincial Natural Science Foundation of China under Grant Nos. LY19E060001 and LQ19F050003, Ningbo Science and Technology Bureau under Service Industry Science & Technology Programme with project code 2019F1030.
Conflict of Interest
The authors declare that the research was conducted in the absence of any commercial or financial relationships that could be construed as a potential conflict of interest.
Publisher’s Note
All claims expressed in this article are solely those of the authors and do not necessarily represent those of their affiliated organizations, or those of the publisher, the editors, and the reviewers. Any product that may be evaluated in this article, or claim that may be made by its manufacturer, is not guaranteed or endorsed by the publisher.
Acknowledgments
The Zhejiang Provincial Department of Science and Technology is acknowledged for this research under its Provincial Key Laboratory Programme (2020E10018). The authors acknowledge the financial support from the Nottingham Ningbo China Beacons of Excellence Research and Innovation Institute.
References
Bartlett, M. D., Fassler, A., Kazem, N., Markvicka, E. J., Mandal, P., and Majidi, C. (2016). Liquid Metals: Stretchable, High‐ K Dielectric Elastomers through Liquid‐Metal Inclusions. Adv. Mat. 28 (19), 3791. doi:10.1002/adma.201670133
Boley, J. W., White, E. L., and Kramer, R. K. (2015). Mechanically Sintered Gallium-Indium Nanoparticles. Adv. Mat. 27, 2355–2360. doi:10.1002/adma.201404790
Brent, A. D., Voller, V. R., and Reid, K. J. (1988). Enthalpy-Porosity Technique for Modeling Convection-Diffusion Phase Change: Application to the Melting of A Pure Metal. Numer. Heat. Transf. 13 (3), 297–318. doi:10.1080/10407788808913615
Cano-Raya, C., Denchev, Z. Z., Cruz, S. F., and Viana, J. C. (2019). Chemistry of Solid Metal-Based Inks and Pastes for Printed Electronics - A Review. Appl. Mater. Today 15, 416–430. doi:10.1016/j.apmt.2019.02.012
Chakraborty, P. R., and Dutta, P. (2011). A Generalized Enthalpy Update Scheme for Solidification of a Binary Alloy with Solid Phase Movement. Metall Materi Trans B 42 (6), 1075–1079. doi:10.1007/s11663-011-9585-3
Chaves, I. L., Duarte, L. C., Coltro, W. K. T., and Santos, D. A. (2020). Droplet Length and Generation Rate Investigation inside Microfluidic Devices by Means of CFD Simulations and Experiments. Chem. Eng. Res. Des. 161, 260–270. doi:10.1016/j.cherd.2020.07.015
Cui, Y., Wang, N., and Liu, H. (2019). Numerical Study of Droplet Dynamics in a Steady Electric Field Using a Hybrid Lattice Boltzmann and Finite Volume Method. Phys. Fluids 31, 022105.
Dong, X., Lu, Y., Zhao, H., and Han, Y. (2020). Phase-field Modeling of Complex Dendritic Structures in Constrained Growth of Hexagonal Close-Packed Crystals. Eur. Phys. J. E 43 (5), 28. doi:10.1140/epje/i2020-11950-3
Fu, T., Wu, Y., Ma, Y., and Li, H. Z. (2012). Droplet Formation and Breakup Dynamics in Microfluidic Flow-Focusing Devices: From Dripping to Jetting. Chem. Eng. Sci. 84, 207–217. doi:10.1016/j.ces.2012.08.039
Garoosi, F., and Hooman, K. (2022). Numerical Simulation of Multiphase Flows Using an Enhanced Volume-Of-Fluid (VOF) Method. Int. J. Mech. Sci. 215, 106956. doi:10.1016/j.ijmecsci.2021.106956
Helland, J. O., Pedersen, J., Friis, H. A., and Jettestuen, E. (2019). A Multiphase Level Set Approach to Motion of Disconnected Fluid Ganglia during Capillary-Dominated Three-phase Flow in Porous Media: Numerical Validation and Applications. Chem. Eng. Sci. 203, 138–162. doi:10.1016/j.ces.2019.03.060
Hirt, C. W., and Nichols, B. D. (1981). Volume of Fluid (VOF) Method for the Dynamics of Free Boundaries. J. Comput. Phys. 39 (1), 201–225. doi:10.1016/0021-9991(81)90145-5
Hoang, D. A., Portela, L. M., Kleijn, C. R., Kreutzer, M. T., and van Steijn, V. (2013). Dynamics of Droplet Breakup in a T-Junction. J. Fluid Mech. 717, R4. doi:10.1017/jfm.2013.18
Hu, M., Sun, C., Fang, H., and Zhu, M. (2020). Competitive Dendrite Growth during Directional Solidification of a Transparent Alloy: Modeling and Experiment. Eur. Phys. J. E 43 (3), 16. doi:10.1140/epje/i2020-11941-4
Hutter, T., Bauer, W.-A. C., Elliott, S. R., and Huck, W. T. S. (2012). Formation of Spherical and Non-spherical Eutectic Gallium-Indium Liquid-Metal Microdroplets in Microfluidic Channels at Room Temperature. Adv. Funct. Mat. 22, 2624–2631. doi:10.1002/adfm.201200324
Jamalabadi, M. Y. A., Daqiqshirazi, M., Kosar, A., and Shadloo, M. S. (2017). Effect of Injection Angle, Density Ratio, and Viscosity on Droplet Formation in a Microfluidic T-Junction. Theor. Appl. Mech. Lett. 7, 243–251. doi:10.1016/j.taml.2017.06.002
Kim, S. H., and Pitsch, H. (2015). On the Lattice Boltzmann Method for Multiphase Flows with Large Density Ratios. J. Comput. Phys. 303, 19–27. doi:10.1016/j.jcp.2015.09.029
Kovalchuk, N. M., Roumpea, E., Nowak, E., Chinaud, M., Angeli, P., and Simmons, M. J. H. (2018). Effect of Surfactant on Emulsification in Microchannels. Chem. Eng. Sci. 176, 139–152. doi:10.1016/j.ces.2017.10.026
Le Bars, M., and Worster, M. G. (2006). Solidification of a Binary Alloy: Finite-Element, Single-Domain Simulation and New Benchmark Solutions. J. Comput. Phys. 216 (1), 247–263. doi:10.1016/j.jcp.2005.12.002
Lei, L., Zhang, H., Bergstrom, D. J., Anthony, T., Song, K.-Y., and Zhang, W. (2020). Experimental and Simulation Study of Flow Patterns in the Combined Flow Focusing and T-Junction Device. J. Micromech. Microeng. 30, 055001. doi:10.1088/1361-6439/ab7787
Li, X., Dong, Z.-Q., Li, Y., Wang, L.-P., Niu, X.-D., Yamaguchi, H., et al. (2022). A Fractional-step Lattice Boltzmann Method for Multiphase Flows with Complex Interfacial Behavior and Large Density Contrast. Int. J. Multiph. Flow 149, 103982. doi:10.1016/j.ijmultiphaseflow.2022.103982
Li, X., He, L., Hailin, g., Sun, F., and Liu, M. (2019). Numerical Study of Droplet Formation in the T-Junction Microchannel with Wall Velocity Slip. Energy Procedia 158. doi:10.1016/j.egypro.2019.01.601
Li, X., He, L., He, Y., Gu, H., and Liu, M. (2019). Numerical Study of Droplet Formation in the Ordinary and Modified T-Junctions. Phys. Fluids 31, 082101. doi:10.1063/1.5107425
Liu, D., Khambampati, A. K., Kim, S., and Kim, K. Y. (2015). Multi-phase Flow Monitoring with Electrical Impedance Tomography Using Level Set Based Method. Nucl. Eng. Des. 289, 108–116. doi:10.1016/j.nucengdes.2015.04.023
Mohammed, M., Xenakis, A., and Dickey, M. (2014). Production of Liquid Metal Spheres by Molding. Metals 4, 465–476. doi:10.3390/met4040465
Nekouei, M., and Vanapalli, S. (2017). Volume-of-fluid Simulations in Microfluidic T-Junction Devices: Influence of Viscosity Ratio on Droplet Size. Phys. Fluids 29. doi:10.1063/1.4978801
Outokesh, M., Amiri, H. A., and Miansari, M. (2022). Numerical Insights into Magnetic Particle Enrichment and Separation in an Integrated Droplet Microfluidic System. Chem. Eng. Process. - Process Intensif. 170, 108696. doi:10.1016/j.cep.2021.108696
Reijers, S. A., Gelderblom, H., and Toschi, F. (2016). Axisymmetric Multiphase Lattice Boltzmann Method for Generic Equations of State. J. Comput. Sci. 17, 309–314. doi:10.1016/j.jocs.2016.05.012
Sander, W., and Weigand, B. (2009). Shaker-based Heat and Mass Transfer in Liquid Metal Cooled Engine Valves. Int. J. Heat. Mass Transf. 52 (11), 2552–2564. doi:10.1016/j.ijheatmasstransfer.2008.09.045
Sattari, A., Hanafizadeh, P., and Hoorfar, M. (2020). Multiphase Flow in Microfluidics: From Droplets and Bubbles to the Encapsulated Structures. Adv. Colloid Interface Sci. 282, 102208. doi:10.1016/j.cis.2020.102208
Seredyński, M., and Banaszek, J. (2021). Coupled Enthalpy-Porosity and Front Tracking Approach to Modeling Chemical Inhomogeneity in Solidifying Metal Alloys. Int. J. Heat. Mass Transf. 173, 121221.
Serra, C., Berton, N., Bouquey, M., Prat, L., and Hadziioannou, G. (2007). A Predictive Approach of the Influence of the Operating Parameters on the Size of Polymer Particles Synthesized in a Simplified Microfluidic System. Langmuir 23, 7745–7750. doi:10.1021/la063289s
Shamberger, P. J., Mizuno, Y., and Talapatra, A. A. (2017). Mixing and Electronic Entropy Contributions to Thermal Energy Storage in Low Melting Point Alloys. J. Appl. Phys. 122 (2), 025105. doi:10.1063/1.4990984
Shin, S., Chergui, J., Juric, D., Kahouadji, L., Matar, O. K., and Craster, R. V. (2018). A Hybrid Interface Tracking - Level Set Technique for Multiphase Flow with Soluble Surfactant. J. Comput. Phys. 359, 409–435. doi:10.1016/j.jcp.2018.01.010
Soh, G. Y., Yeoh, G. H., and Timchenko, V. (2016). Improved Volume-Of-Fluid (VOF) Model for Predictions of Velocity Fields and Droplet Lengths in Microchannels. Flow Meas. Instrum. 51, 105–115. doi:10.1016/j.flowmeasinst.2016.09.004
Stone, H. A., Bentley, B. J., and Leal, L. G. (1986). An Experimental Study of Transient Effects in the Breakup of Viscous Drops. J. Fluid Mech. 173, 131–158. doi:10.1017/s0022112086001118
Takaki, T., Sakane, S., Ohno, M., Shibuta, Y., Shimokawabe, T., and Aoki, T. (2016). Large-scale Phase-Field Studies of Three-Dimensional Dendrite Competitive Growth at the Converging Grain Boundary during Directional Solidification of a Bicrystal Binary Alloy. ISIJ Int. 56 (8), 1427–1435. doi:10.2355/isijinternational.isijint-2016-156
Tang, S.-Y., Khoshmanesh, K., Sivan, V., Petersen, P., O’Mullane, A. P., Abbott, D., et al. (2014). Liquid Metal Enabled Pump. Proc. Natl. Acad. Sci. U.S.A. 111 (9), 3304–3309. doi:10.1073/pnas.1319878111
Tang, S. Y., Ayan, B., Nama, N., Bian, Y., Lata, J. P., Guo, X., et al. (2016). On-Chip Production of Size-Controllable Liquid Metal Microdroplets Using Acoustic Waves. Small 12, 3861–3869. doi:10.1002/smll.201600737
Tian, L., Gao, M., and Gui, L. (2017). A Microfluidic Chip for Liquid Metal Droplet Generation and Sorting. Micromachines 8 (2). doi:10.3390/mi8020039
Tian, L., Ye, Z., and Gui, L. (2021). A Study of Dielectrophoresis-Based Liquid Metal Droplet Control Microfluidic Device. Micromachines 12 (3). doi:10.3390/mi12030340
Tourret, D., and Karma, A. (2015). Growth Competition of Columnar Dendritic Grains: A Phase-Field Study. Acta Mater. 82, 64–83. doi:10.1016/j.actamat.2014.08.049
Valle, N., Trias, F. X., and Castro, J. (2020). An Energy-Preserving Level Set Method for Multiphase Flows. J. Comput. Phys. 400, 108991. doi:10.1016/j.jcp.2019.108991
Won, D.-J., Baek, S., Kim, H., and Kim, J. (2015). Arrayed-type Touch Sensor Using Micro Liquid Metal Droplets with Large Dynamic Range and High Sensitivity. Sensors Actuators A Phys. 235, 151–157. doi:10.1016/j.sna.2015.09.044
Wu, Y., Gui, N., Yang, X., Tu, J., and Jiang, S. (2021). A Decoupled and Stabilized Lattice Boltzmann Method for Multiphase Flow with Large Density Ratio at High Reynolds and Weber Numbers. J. Comput. Phys. 426, 109933. doi:10.1016/j.jcp.2020.109933
Yap, Y. F., and Chai, J. (2012). Level-set Method for Multiphase Flows. Comput. Therm. Sci. 4 (6), 1–17. doi:10.1615/computthermalscien.2012006412
Yuan, L., and Lee, P. D. (2012). A New Mechanism for Freckle Initiation Based on Microstructural Level Simulation. Acta Mater. 60 (12), 4917–4926. doi:10.1016/j.actamat.2012.04.043
Zhang, W., Ou, J. Z., Tang, S.-Y., Sivan, V., Yao, D. D., Latham, K., et al. (2014). Liquid Metal/Metal Oxide Frameworks. Adv. Funct. Mat. 24 (24), 3799–3807. doi:10.1002/adfm.201304064
Zhu, P., and Wang, L. (2016). Passive and Active Droplet Generation with Microfluidics: a Review. Lab. Chip 17, 34–75. doi:10.1039/c6lc01018k
Nomenclature
A mush zone constant (kg/m s−1)
F surface tension force acting on the interface (N/m3)
H total enthalpy (J/kg)
L specific melting enthalpy (J/kg) solidus
P pressure (N/m2)
Q volumetric flow rate ratio (
QC volumetric flow rate of the continuous phase (
QD volumetric flow rate of the dispersed phase (
S source term (N/m3) liquidus
T temperature (K)
V velocity (m/s)
n unit normal vector at the interface
k thermal conductivity (W/m K−1)
t time step (s)
Greek symbols
Subscripts
C continuous phase
D dispersed phase
L solidus
S liquidus
W wall
atm atmosphere pressure
Keywords: microfluidic, flow focusing, microdroplet, low-melting-point alloy, solidification
Citation: Guo Y, Ren Y, Hou T, Wang J and Wang C (2022) Numerical Study on the Formation and Solidification of LMPA Microdroplet in a Microfluidic Device. Front. Energy Res. 10:843118. doi: 10.3389/fenrg.2022.843118
Received: 24 December 2021; Accepted: 16 May 2022;
Published: 27 June 2022.
Edited by:
Qin-Yi Li, Kyushu University, JapanReviewed by:
Zhizhao Che, Tianjin University, ChinaKai Chen, South China University of Technology, China
Copyright © 2022 Guo, Ren, Hou, Wang and Wang. This is an open-access article distributed under the terms of the Creative Commons Attribution License (CC BY). The use, distribution or reproduction in other forums is permitted, provided the original author(s) and the copyright owner(s) are credited and that the original publication in this journal is cited, in accordance with accepted academic practice. No use, distribution or reproduction is permitted which does not comply with these terms.
*Correspondence: Yong Ren, eW9uZy5yZW5Abm90dGluZ2hhbS5lZHUuY24=