 Deming Li
 Ruixue Yang1
 Feng Yao
 Chaoqun Shen
 Chengbin Zhang
- 1Key Laboratory of Energy Thermal Conversion and Control of Ministry of Education, School of Energy and Environment, Southeast University, Nanjing, China
- 2Jiangsu Key Laboratory of Micro and Nano Heat Fluid Flow Technology and Energy Application, School of Environmental Science and Engineering, Suzhou University of Science and Technology, Suzhou, China
The shape and relative roughness of a rough surface have an important influence on microscale flow and heat transfer. In this study, a rectangular silicon microchannel (0.8 mm width and 11.9 μm height) with a large width-depth ratio is fabricated by the MEMS micromachining process. The silicon surface of the microchannel and the two-dimensional rough contours of the glass surface are measured, and the fractal dimensions taken as the only quantitative parameter of the surface morphology are calculated. The three-dimensional morphology of the silicon surface is measured by a confocal laser microscope and atomic force microscope. On this basis, a microscale gas flow performance test system is designed and built, and the flow characteristics of nitrogen and helium in rough silicon microchannel are experimentally studied. The experimental results show that the rough profiles of the silicon surface and the glass surface have possessed self-affine characteristics. Both nitrogen and helium show a certain degree of boundary slip when they flow in a microchannel. The degree of slip of helium flow is larger than that of nitrogen flow, which verifies the rarefied effect of microscale gas flow.
Introduction
Microscale gas flow processes are widely present in microscale systems, such as chip lab, biomedical testing, micro-reactors, and microthermal control system (Struk et al., 2018; Williams, 2021). The understanding and mastery of microscale gas flow characteristics will contribute to the design optimization and operation of the microsystem. The solid wall interacts with gas more obviously in a smaller space, and hence the gas rarefied effect appears in microchannels. Therefore, the surface roughness of the microchannel and the flow slip characteristics of microscale gases have become an important research topic in micro-nano hydromechanics, which has attracted extensive attention from scholars (Lu et al., 2020; Ahangar et al., 2020).
In recent years, although researchers have carried out much work in the field of microscale gas flow and heat transfer (Li et al., 2019), the conclusions about the influence of microscale on heat and mass transfer are still quite inconsistent and there are great differences among experimental data. In order to study the effect of roughness on flow and heat transfer in the microchannel, various rough surface structures have been proposed. Croce and Agaro (2004) simulated the surface roughness through a series of randomly generated peaks (rectangles and triangles) on an ideally smooth surface. The effect of roughness on heat transfer and pressure loss in the microchannel was analyzed by a finite element CFD program. Kleinstreuer and Koo (2004) simulated rough boundaries with a porous media model, and the laminar flow of fluids in the microchannel at low Reynolds numbers was studied. Bahrami et al. (2006) established and analyzed a theoretical model of fully developed laminar flow in a microchannel by assuming that the roughness curve obeys a Gaussian distribution. Hu et al. (2003) carried out a three-dimensional numerical simulation of laminar flow in the microchannel with rectangular roughness. The influence of the height, size, and spacing of rough rectangles and channel height on velocity distribution and pressure drop were mainly studied. Taylor et al. (2006) summarized and discussed the existing research on the influence of surface roughness and structural texture on fluid flow. The main methods used to study the influence mechanism of roughness were examined. These studies all show that surface roughness has an important influence on flow and heat transfer characteristics at the microscale (Chen and Deng, 2017; Wang et al., 2018).
However, for a long time, in the study of fluid flow and heat transfer in the microchannel, rough surface structures are usually characterized only by average roughness or root-mean-square roughness indexes. In order to accurately describe roughness features, Taylor et al. (2006) and Kandlikar and Grande (2003) redefined average roughness and analyzed laminar flow in serrated rough microchannel. However, surface roughness and bump distribution is a special non-stationary random process, and the measured roughness varies with the accuracy of the measurement instrument and sampling scale. Previous studies show that the natural rough surface profile has multi-scale, self-affine characteristics (Majumdar and Bhushan, 1990). When the local contour is enlarged, its geometric characteristics are very similar to the whole contour. In spite of the random roughness and other rough surface description model proposed in previous studies (Hu et al., 2003; Wang and Kang, 2009), these models are built on the basis of statistical average. Hence, the spectrum characteristics of rough surface structure distribution cannot be obtained, and the rough surface morphology of multi-scale, self-affine geometric features are difficult to reflect. However, the distribution spectrum of the rough surface plays an important role in the heat transfer of microscale fluid flow. To provide theoretical support for the geometric description of irregular surface morphology, Chen and Cheng (2003) made a preliminary exploration of the effect of roughness on micro-channel fluid flow characteristics based on fractal geometry and verified the fractal characteristics of the anisotropic etched rough surface. According to the experimental data, a package of empirical fitting formulas containing fractal dimensions is presented. Unfortunately, the quantitative description of rough morphology is still unsatisfactory. Based on the lattice Boltzmann method, Liu and Ni (2009) studied the effect of fractal roughness in two-dimensional micro-Poiseuille flow at mesoscale with a high Knudsen number, which is a dimensionless number defined as the ratio of the molecular mean free path length, λ, to a representative physical length scale, l. Based on the above definition, the values for the Knudsen numbers can be calculated by the thermal property of the gas of N2 and He. The study also found that surface roughness directly affects the velocity and pressure distribution of micro-flow. Rehman et al. (2021) studied the laminar-to-turbulent transition of gas flow in microchannels using the experiment and simulation and demonstrated that the geometrical characteristics (aspect ratio and inlet manifold shape) significantly affect the Reynolds number when transitioning from laminar to turbulent gas microflows. Milicev and Stevanovic (2020) presented an analytical solution for steady compressible isothermal gas flow in micro-/nano-channels and confirmed that the Knudsen minimum appears in the converging, diverging, and micro-/nano-channels. Ebrahimi and Roohi (2021) numerically studied the pressure-driven nitrogen flow in divergent microchannels by the direct simulation Monte Carlo method. It is observed that the direction of heat flow is largely opposite to that of the mass flow due to the rarefaction effects. However, the above studies did not consider the influence of different fractal dimensions and quantitative reconstruction of the surface structure.
To study the gas flow behavior in a rough microchannel, one of the important prerequisites is to quantitatively describe the topography of rough surfaces. Therefore, a silicon microchannel gas flow chip with a large width-depth ratio is fabricated by the MEMS micromachining technology in this study, and the rough surface morphology of the microchannel is measured. In addition, a microscale gas flow performance test system is designed and built, and experimental research on the flow characteristics of nitrogen and helium in rough silicon microchannel is carried out.
Quantitative Description of Silicon Microchannel and Surface Topography
The fabrication of the silicon microchannel gas flow chip used in this study is carried out in the MEMS laboratory of the collaborator, Sapindong Micro and Nano Technology Research Center, Xiamen University. The wide silicon microchannel is fabricated by the deep reactive ion etching (DRIE) process to etch the channel on <100> silicon wafers. After the channel etching, the silicon wafer and Pyrex glass are bonded together using an electrostatic bonding (also known as anodic bonding) process to create a microchannel gas flow chip.
Figure 1A shows the final silicon microchannel in the study using the MEMS process. The microchannel is bonded by a silicon wafer and Pyrex glass. The microchannel dimensions are 70 mm long and 8 mm wide, the gas inlet and outlet dimensions are 2 mm × 1.2 mm, the microchannel length is 60 mm, and the profile of the microchannel is rectangular with a thickness of 0.8 mm and a depth of 11.9 μm. In addition, the two-dimensional roughness profiles of the silicon and glass surfaces of the microchannel were measured by a Dektak3 Series surface profiler before the chip was bonded and encapsulated, as shown in Figure 1B. From Figure 1B, it can be seen that the silicon surface is rougher than the Pyrex glass surface. Based on the measured roughness distribution along the channel, as shown in Figure 1B, the root-mean-square roughness height of the silicon surface is 0.081 μm, while that of the glass surface is 0.031 μm.
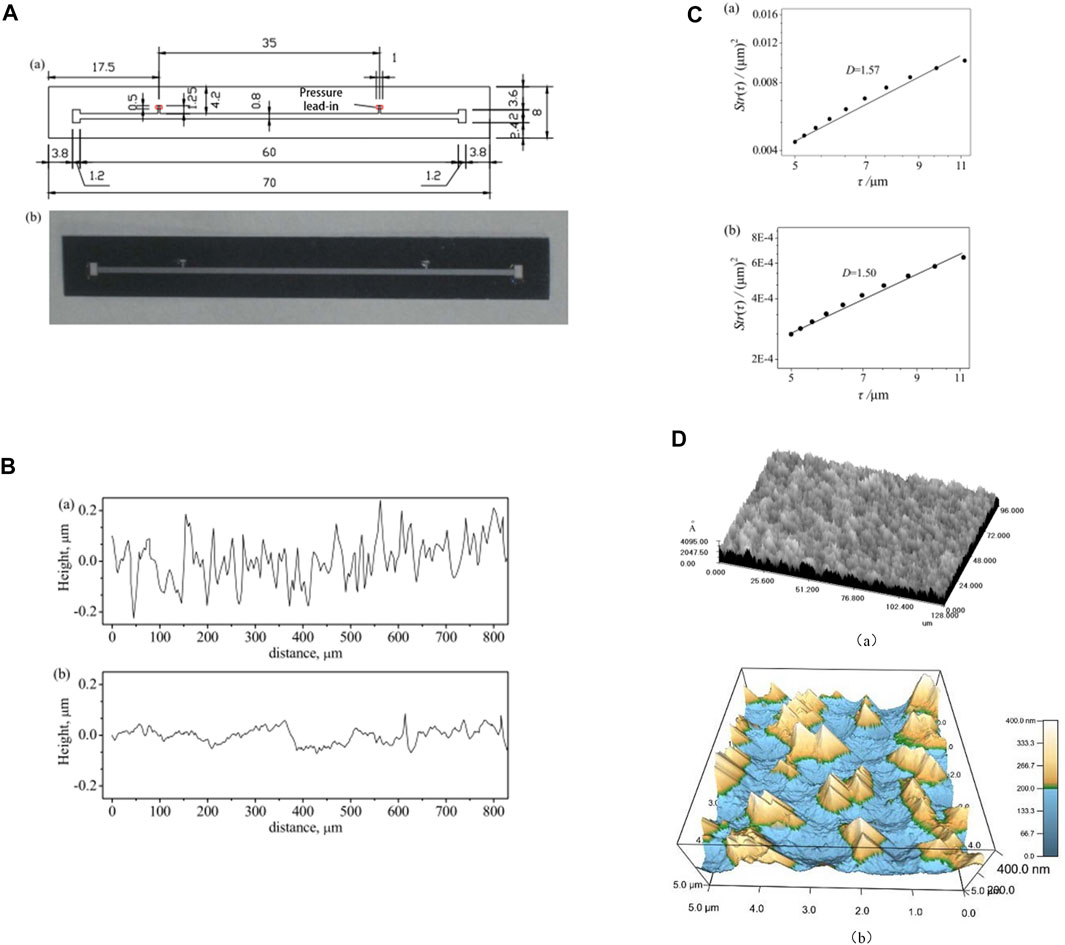
FIGURE 1. Silicon microchannel (A): (a) structural dimensions (mm) and (b) real object. (B) Surface roughness distribution: (a) silicon surface and (b) glass surface. (C) Structure function Str(τ): (a) silicon surface, (b) glass surface. (D) Surface morphology: (a) confocal laser scanning microscope and (b) atomic force microscopy.
No matter what kind of material the surface is made of, even after the most careful precision machining, its microscopic geometry is always uneven when viewed under a microscope, consisting of a series of peaks and valleys with different amplitudes and spacing. Surface roughness is the most important method used to quantitatively evaluate the microscopic morphology of rough surfaces. The values of the evaluation surface roughness parameters vary due to the different functional requirements of the surface. Figure 1C shows the calculation of the self-affine fractal dimension of the rough profile (as shown in Figure 1B) based on the structural function method. For the roughness profile of a surface, R(y), its structure function, Str(τ),
where < > represents the temporal average and τ represents the scale. On a log-log plot, the structure function Str(τ) is shown as a function of the scale τ, and the relationship between Str(τ) and τ is seen to determine whether the relationship Str(τ) ∼ τ4−2D is satisfied. Once satisfied, the rough surface is a self-affine fractal object and the self-affine dimension D = (4-k)/2, in which k is the slope. In this study, the self-affine fractal dimension is determined by the structure function. Note that the calculation of the fractal dimension (Figure 1C) is based on the roughness distribution (see Figure 1B) as measured by the Dektak3 Series surface profiler. The structure (height vs. distance) is measured along the channel to determine the fractal dimension because the gas flow is mainly affected by the roughness distribution along the channel. As seen from the logarithmic plot, the logarithmic values of the structure function and the scale well meet the linear relationship, indicating that the power law is satisfied between the structure function and the scale of the surface roughness, which verifies that the rough profiles of both the silicon and glass surfaces of the channel have fractal characteristics. The fractal dimensions of the two-dimensional rough profiles of the silicon and glass surfaces are calculated to be 1.57 and 1.50, respectively.
In addition, a confocal laser scanning microscope is used to measure the silicon surface samples, and the 3D rough surface morphology is obtained, as shown in Figure 1D(a). In order to reveal further local details of the silicon rough surface morphology, an atomic force microscope (type: MFP-3D-SA) is used to measure the silicon rough surface sample at a smaller scale and the 3D rough surface morphology is shown in Figure 1D(b).
Experimental System of Gas Flow in Rough Microchannel
Introduction of Experimental System
The experimental schematic diagram of the gas flow performance test in the rough microchannel is shown in Figure 2A. In the experiment, driven by high-pressure gas, the gas flows through the reducing valve, buffer tank, needle valve, 0.5 μm filter, silicon microchannel, and flow test section and finally exhausts into the air. The gas flow rate into the silicon microchannel is controlled by adjusting the needle valve, thereby obtaining different experimental conditions of gas flow and pressure drop. The pressure drop of the gas flow in the microchannel is measured by a digital differential pressure sensor. The gas flow into the microchannel is measured by the flow test section.
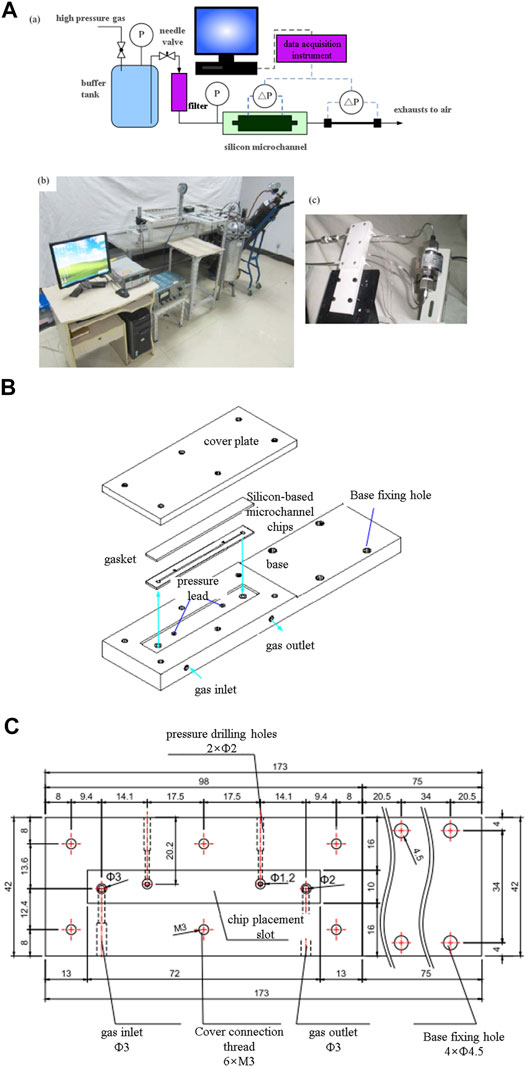
FIGURE 2. Experimental system of gas flow in rough microchannel. (A): (a) schematic diagram, (b) physical photograph, and (c) experimental section. (B) Schematic diagram of the test section. (C) Microchannel base geometry size.
As shown in Figure 2A, the experimental system of gas flow performance test in rough microchannel includes a gas driving device, experimental section, and flow testing section. Each component of the gas flow experiment in the microchannel will be described in detail below.
The gas driving device is composed of a high-pressure gas tank, reducing valve, buffer tank, needle valve, pressure gauge, and pipeline. The driving pressure in the buffer tank is adjusted and controlled by changing the valve opening of the reducing valve, and the gas pressure in the buffer tank is displayed by the pressure gauge on the tank body. By adjusting the valve opening of the needle valve, the pressure entering the experimental test section is controlled to control the gas flow rate into the experimental test section (Chen et al., 2015).
The experimental section consists of silicon rough microchannel, base, gasket, cover plate, differential pressure sensor, and connecting pipeline, as shown in Figure 2B. The rough microchannel is shown in Figure 1A, and the surface roughness morphology is shown in Figure 1B and Figure 1D. The silicon rough microchannel pressure leads are sealed to the base through an O-ring and then connected to the differential pressure sensor (model: DYR-302, accuracy: 0.3%) through the sidewall leads of the base. The microchannel base geometry size is shown in Figure 2C. The microchannel base serves to fix and protect the silicon microchannel and also realize the connection between the microchannel and the external pipeline. The base is made of polytetrafluoroethylene material machined by a milling machine, and a rectangular groove 72 mm long, 10 mm wide, and 1 mm deep is opened on the base for placing the microchannel chip. A soft gasket is applied on the microchannel chip, then the cover plate is pressed on the soft gasket, and the screw is passed through the screw holes around the cover plate and the base to be fixed on the base.
In the previous measurement of fluid flow pressure drop in silicon microchannel, it is usually obtained by directly measuring the fluid flow pressure drop at the inlet and outlet of the microchannel and subtracting the local resistance pressure drop at the inlet and outlet (Liu et al., 2013; Liu et al., 2021). Because the local resistance pressure drop is estimated by empirical formula and the inlet and outlet effect of fluid flow in the channel, the error of flow resistance pressure drop obtained by this method is usually large. In order to overcome the measurement error caused by local resistance pressure drop estimation and import and export effect, in the design of the silicon microchannel in this study, two gas pressure leads are directly led from the sidewall of the microchannel, as shown in Figure 1A. In this case, the two gas pressure leads are directly connected to the pressure leads of the base through O-rings, and the pressure drop along the flow in the silicon microchannel can be measured directly using a differential pressure sensor.
The flow testing section is composed of a differential pressure sensor and a long stainless steel capillary connecting pipeline. Because the flow through the silicon microchannel gas flow rate is very small, it is difficult to measure it with existing gas flowmeters. Therefore, the measurement of gas flow rate is an important problem to be solved in this experiment. In order to obtain the gas flow rate through the microchannel, a flow test section is especially connected in series at the back end of the silicon microchannel in this study. According to the mass conservation, the gas mass flow rate through the flow test section is the gas mass flow rate through the rough microchannel. The flow test section is composed of a long-distance stainless steel capillary (length of 1 m, inner diameter of 0.342 mm) and a gas differential pressure meter. By measuring the pressure drop at both ends of the stainless steel capillary, the gas flow rate in the microchannel is calculated according to the relationship between the gas flow rate and the pressure drop.
The rarefied effect is an important factor affecting gas flow in microchannel. In order to analyze the rarefied effect on gas flow in microchannel, nitrogen, and helium, which are common gases with certain differences in molecular mean free path, are used as gas working medium for comparative study. The average free path of nitrogen and helium is 0.066 and 0.194 μm, respectively. The Knudsen number of nitrogen and helium flowing in the wide rectangular microchannel (depth 11.9 μm, width 0.8 mm) with a large width-depth ratio is 0.0055 and 0.0163, respectively. Note that the Knudsen number, Kn, is expressed as (Kandlikar et al., 2014)
where μ is the viscosity, ρ is the density, T is the temperature, and R is the specific gas constant. Based on the above definition, the values for the Knudsen numbers can be calculated by the thermal property of the gas of N2 and He.
Data Processing and Error Analysis
The frictional resistance coefficient fv of gas flow in a rough silicon microchannel can be obtained according to Darcy’s formula (Krause 2005):
where ΔPv,si are the on-way resistance of gas flow between two pressure leads in a silicon microchannel, dh is the hydraulic diameter of the wide rectangular microchannel, Lsi is the length between two pressure leads in a silicon microchannel, and ρv is the gas density. The average velocity of the gas flowing through the cross section of microchannel uv is
where mv is the gas mass flow rate, ρv is the gas density, and W and H are the width and height of the rectangular section of the microchannel, respectively. The Reynolds number of gas flow in the rectangular microchannel can be expressed as
where μv is the dynamic viscosity of the gas. In Eqs 1, 3, the Poiseuille number of gas flow in the microchannel is
As mentioned above, the flow rate of gas through the microchannel is very small and is difficult to measure by existing gas flowmeters. In this experiment, the gas volume flow rate Gv in the microchannel is obtained by measuring the pressure drop of a long stainless steel tube (L in length and D in diameter) in the gas flow test section. In the experiment, the length of the stainless steel tube L is 1 m, and the inner diameter d is 342 μm. Because the gas flow rate is very small and the Reynold number is far less than 1, the effect of roughness on the gas flow resistance in stainless steel tubes can be ignored. In this way, the gas mass flow mv in the stainless steel tube can be expressed as
ΔPv,st is the on-way resistance of gas flow in stainless steel microchannel. According to the mass conservation, the gas mass flow rate through the flow test section is the gas mass flow rate through the rough silicon microchannel.
The measurement errors of the main parameters involved in the gas flow experiment are shown in Table 1.
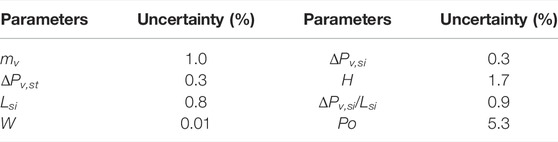
TABLE 1. Experimental errors.
Results and Analysis
Figure 3A shows the calculated mass flow rate of nitrogen (N2) and helium (He) based on the experimentally measured gas flow pressure drop ΔPv,st at both ends of the stainless steel capillary. It can be seen that, under the same pressure drop, the mass flow rate of helium is much smaller than that of nitrogen.
The flow resistance of gas in a microchannel can be characterized by the Poiseuille number. The Poiseuille number is obtained by measuring pressure drop and flow rate of gas flow in the microchannel. Figure 3B shows the flow resistance pressure drop of nitrogen and helium through the silicon microchannel under different flow conditions. By calculating the pressure drop data of gas flow in silicon microchannel under different flow conditions listed in Figure 3B, the Poiseuille number shown in Figure 3C is obtained. As can be seen from Figure 3, the Poiseuille number (Pov) of both nitrogen and helium flowing in the microchannel is smaller than the corresponding Poiseuille number under the condition of no slip (as shown by the dotted line in Figure 3C), which indicates that both nitrogen and helium exhibit a certain degree of boundary slip. In addition, helium is rarer than nitrogen, making the Poiseuille number of helium flow in the microchannel smaller than nitrogen. The experimental results again verify the rarefied effect of the microscale gas flow; that is, gas with a large Knudsen number flows in the micro-channel with a large boundary velocity slip, which leads to a small Poiseuille number.
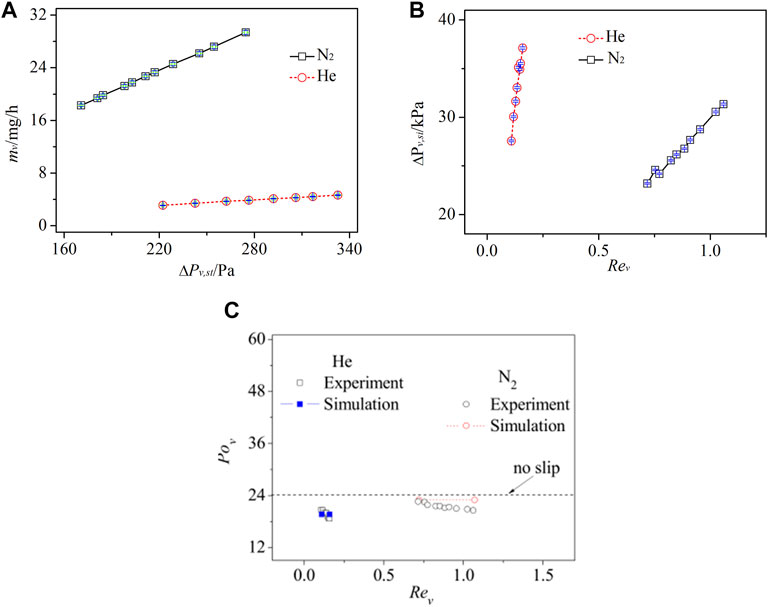
FIGURE 3. Experimental results. (A) Gas mass flow rate measured experimentally. (B) Pressure drop of gas flow in silicon microchannel. (C) Comparison of theoretically predicted value and experimental data of the Poiseuille number of gas flow in silicon microchannel.
The gas flow process in a wide rectangular microchannel with a large width-depth ratio (depth 11.9 μm, width 8 mm, and width-depth ratio 67.2) can be simplified to two-dimensional microscale gas flow for theoretical calculation. In order to further verify the validation of this assumption, the criterion numbers corresponding to the experimental conditions (Knudsen number, Kn, the ratio of the mean free path of gas molecules to the characteristic length of objects in the flow field), the relative roughness of the upper and lower surfaces of the microchannel, and Reynolds number) are adopted to carry out theoretical simulation calculations. The relative roughness of microchannel silicon and glass surfaces is 0.34% and 0.13%, respectively, and the fractal dimensions are 1.57 and 1.5, respectively.
Figure 3C compares the theoretically predicted value and the experimentally measured value of the Poiseuille number of gas flow in silicon microchannel. By the experimental observation, the Poiseuille numbers of helium flow and nitrogen flow are 20.73 (maximum) and 22.61 (maximum), respectively, and these two values are smaller than 24. It can be seen that the theoretically predicted value is basically consistent with the experimentally measured data, and the maximum errors are 5.9% (He) and 11% (N2), respectively, which verifies the validity of the rough microchannel gas flow experiment in this study. The measured Pov agrees with the numerical data by our proposed theoretical model (Zhang et al., 2012), as shown in Figure 3C.
Conclusion
In this study, based on the deep reactive ion etching (DRIE) process, the wide rectangular microchannel (0.8 mm wide, 11.9 μm high) is prepared by etching on <100 > silicon wafers. The two-dimensional rough profiles of the silicon surface and the glass surface of the microchannel were measured, and the fractal dimensions are calculated. The three-dimensional morphology of the silicon surface was measured by a confocal laser microscope and atomic force microscope. After a microscale gas flow performance test system is built based on the chip design of the silicon microchannel, experimental research is carried out on the flow characteristics of nitrogen and helium in a rough silicon microchannel.
Results show that the rough profiles of the silicon and glass surfaces possessed the self-fractal characteristics as indicated by the structure function Str(τ) for the measured roughness height proportional to τ4−2D (τ represents the scale). The affine fractal dimensions of the two-dimensional rough profiles of the silicon and glass surfaces are calculated to be 1.57 and 1.50, respectively, and the root-mean-square roughness height of the silicon surface is 0.081 μm while the glass surface is 0.031 μm. By the experimental observation, the Poiseuille number of helium flow and nitrogen flow are 20.73 (maximum) and 22.61 (maximum), respectively, and these two values are both smaller than 24. Both nitrogen and helium show a certain degree of boundary slip when they flow in the microchannel, and the slip degree of helium flow is larger than that of nitrogen flow, which verifies the rarefied effect of microscale gas flow. In addition, the measured Poiseuille number of gas flow agrees with the numerical data. Note that the slip coefficients depend not only on the simple fractal dimension but also on the roughness height.
Data Availability Statement
The original contributions presented in the study are included in the article/Supplementary Material. Further inquiries can be directed to the corresponding author.
Author Contributions
DL, RY, HC, FY, CS, CZ and SW contributed to the conception and design of the study. DL performed the experiments and wrote the first draft of the manuscript. All authors contributed to manuscript revision and read and approved the submitted version.
Funding
This research was funded by the National Natural Science Foundation of China (Grant no. 52022020) and Natural Science Foundation of Jiangsu Province (Grant no. BK20210239).
Conflict of Interest
The authors declare that the research was conducted in the absence of any commercial or financial relationships that could be construed as a potential conflict of interest.
Publisher’s Note
All claims expressed in this article are solely those of the authors and do not necessarily represent those of their affiliated organizations or those of the publisher, the editors, and the reviewers. Any product that may be evaluated in this article, or claim that may be made by its manufacturer, is not guaranteed or endorsed by the publisher.
References
Ahangar, E. K., Izanlu, M., Jabbari, M., Ahmadi, G., and Karimipour, A. (2020). Thermal Microscale Gas Flow Simulation Using wall Function and Bounce-Back Scheme: Modified Lattice Boltzmann Method. Int. Commun. Heat Mass Transfer 119, 104993. doi:10.1016/j.icheatmasstransfer.2020.104993
Bahrami, M., Yovanovich, M. M., and Culham, J. R. (2006). Pressure Drop of Fully Developed, Laminar Flow in Rough Microtubes. J. Fluids Eng. 128 (3), 632–637. doi:10.1115/1.2175171
Chen, Y., and Cheng, P. (2003). Fractal Characterization of wall Roughness on Pressure Drop in Microchannels. Int. Commun. Heat Mass Transfer 30 (1), 1–11. doi:10.1016/S0735-1933(03)00002-2
Chen, Y., and Deng, Z. (2017). Hydrodynamics of a Droplet Passing through a Microfluidic T-junction. J. Fluid Mech. 819, 401–434. doi:10.1017/jfm.2017.181
Chen, Y., Wu, L., and Zhang, L. (2015). Dynamic Behaviors of Double Emulsion Formation in a Flow-Focusing Device. Int. J. Heat Mass Transfer 82, 42–50. doi:10.1016/j.ijheatmasstransfer.2014.11.027
Croce, G., and D’Agaro, P. (2004). Numerical Analysis of Roughness Effect on Microtube Heat Transfer. Superlattices and Microstructures 35 (3-6), 601–616. doi:10.1016/j.spmi.2003.09.014
Ebrahimi, A., and Roohi, E. (2021). Pressure-Driven Nitrogen Flow in Divergent Microchannels with Isothermal Walls. Appl. Sci. 11 (8), 3602. doi:10.3390/app11083602
Hu, Y., Werner, C., and Li, D. (2003). Influence of Three-Dimensional Roughness on Pressure-Driven Flow through Microchannels. J. Fluids Eng. 125 (5), 871–879. doi:10.1115/1.1598993
Kandlikar, S. G., Garimella, S., Li, D., Colin, S., and King, M. R. (2014). Heat Transfer and Fluid Flow in Minichannels and Microchannels. Elsevier. doi:10.1134/S1075700709020142
Kandlikar, S. G., and Grande, W. J. (2003). Evolution of Microchannel Flow Passages--Thermohydraulic Performance and Fabrication Technology. Heat Transfer Eng. 24 (1), 3–17. doi:10.1080/01457630304040
Kleinstreuer, C., and Koo, J. (2004). Computational Analysis of wall Roughness Effects for Liquid Flow in Micro-conduits. J. Fluids Eng. 126 (1), 1–9. doi:10.1115/1.1637633
Li, S., Zhang, H., Cheng, J., Li, X., Cai, W., Li, Z., et al. (2019). A State-Of-The-Art Overview on the Developing Trend of Heat Transfer Enhancement by Single-phase Flow at Micro Scale. Int. J. Heat Mass Transfer 143, 118476. doi:10.1016/j.ijheatmasstransfer.2019.118476
Liu, C. F., and Ni, Y. S. (2009). The Fractal Roughness Effect of Micro Poiseuille Flows Using the Lattice Boltzmann Method. Int. J. Eng. Sci. 47 (5—6), 660–668. doi:10.1016/j.ijengsci.2009.01.002
Liu, X., Chen, Y., and Shi, M. (2013). Dynamic Performance Analysis on Start-Up of Closed-Loop Pulsating Heat Pipes (CLPHPs). Int. J. Therm. Sci. 65, 224–233. doi:10.1016/j.ijthermalsci.2012.10.012
Liu, X., Hao, G., Li, B., and Chen, Y. (2021). Experimental Study on the Electrohydrodynamic Deformation of Droplets in a Combined DC Electric Field and Shear Flow Field. Fundam. Res. 2022, 1–14. doi:10.1016/j.fmre.2021.10.011
Lu, H., Xu, M., Gong, L., Duan, X., and Chai, J. C. (2020). Effects of Surface Roughness in Microchannel with Passive Heat Transfer Enhancement Structures. Int. J. Heat Mass Transfer 148, 119070. doi:10.1016/j.ijheatmasstransfer.2019.119070
Majumdar, A., and Bhushan, B. (1990). Role of Fractal Geometry in Roughness Characterization and Contact Mechanics of Surfaces. J. Tribol-t ASME 112 (2), 205–216. doi:10.1115/1.2920243
Milićev, S. S., and Stevanović, N. D. (2020). Gas Flow in Microchannels and Nanochannels with Variable Cross Section for All Knudsen and All Mach Number Values. J. Fluids Eng. 143 (2), 1–13. doi:10.1115/1.4048288
Rehman, D., Barattini, D., Hong, C., and Morini, G. L. (2021). Effect of Aspect Ratio and Inlet Manifold Shape on the Laminar-To-Turbulent Transition of Gas Flow in Rectangular Microchannels. Exp. Fluids 62 (3), 1–19. doi:10.1007/s00348-021-03137-3
Struk, D., Shirke, A., Mahdavifar, A., Hesketh, P. J., and Stetter, J. R. (2018). Investigating Time-Resolved Response of Micro thermal Conductivity Sensor under Various Modes of Operation. Sensors Actuators B: Chem. 254, 771–777. doi:10.1016/j.snb.2017.07.142
Taylor, J. B., Carrano, A. L., and Kandlikar, S. G. (2006). Characterization of the Effect of Surface Roughness and Texture on Fluid Flow-Past, Present, and Future. Int. J. Therm. Sci. 45 (10), 962–968. doi:10.1016/j.ijthermalsci.2006.01.004
Wang, J., Gao, W., Zhang, H., Zou, M., Chen, Y., and Zhao, Y. (2018). Programmable Wettability on Photocontrolled Graphene Film. Sci. Adv. 4 (9), eaat7392. doi:10.1126/sciadv.aat7392
Wang, M., and Kang, Q. (2009). Electrokinetic Transport in Microchannels with Random Roughness. Anal. Chem. 81 (8), 2953–2961. doi:10.1021/ac802569n
Williams, H. (2021). New Exact Solutions for Microscale Gas Flows. J. Eng. Math. 128, 2–21. doi:10.1007/s10665-021-10135-1
Keywords: microchannel, gas, flow, rough, rarefied effect
Citation: Li D, Yang R, Cao H, Yao F, Shen C, Zhang C and Wu S (2022) Experimental Study on Gas Flow in a Rough Microchannel. Front. Energy Res. 10:863733. doi: 10.3389/fenrg.2022.863733
Received: 27 January 2022; Accepted: 21 March 2022;
Published: 18 May 2022.
Edited by:
Yutao Huo, China University of Mining and Technology, ChinaReviewed by:
Qiang Ma, Jiangsu University, ChinaNatalya Kizilova, Warsaw University of Technology, Poland
Dongyan Gao, Nanjing Institute of Technology (NJIT), China
Copyright © 2022 Li, Yang, Cao, Yao, Shen, Zhang and Wu. This is an open-access article distributed under the terms of the Creative Commons Attribution License (CC BY). The use, distribution or reproduction in other forums is permitted, provided the original author(s) and the copyright owner(s) are credited and that the original publication in this journal is cited, in accordance with accepted academic practice. No use, distribution or reproduction is permitted which does not comply with these terms.
*Correspondence: Suchen Wu, c3VjaGVud3VAc2V1LmVkdS5jbg==