 Lu Wu1
 Jiantao Qin
 Vasyl O. Kharchenko
 Dmitrii O. Kharchenko
- 1The First Sub-Institute, Nuclear Power Institute of China, Chengdu, China
- 2Institute of Applied Physics, National Academy of Sciences of Ukraine, Sumy, Ukraine
- 3Department of Applied Mathematics and Complex Systems Modeling, Sumy State University, Sumy, Ukraine
A phase field model to study dynamics of microstructure transformations and the evolution of defect structure during heat treatment of Fe-Cr-Al systems is developed. Statistical and kinetic properties of evolving microstructure and defect structure in alloys with different content of alloying elements and at different temperatures were studied. Point defects rearrangement during precipitation is discussed in details. Universality of statistical distributions over precipitate size is revealed for considered class of alloys.
1 Introduction
It is known that Fe-Cr-Al alloys are successfully used in many industrial applications where high temperature oxidation resistance is needed, for example, in fuel energy plants (Gulbransen and Andrew, 1959; Wukusick and Collins, 1964). Nuclear grade iron-based Fe-Cr-Al alloys have been developed as candidate materials for accident tolerant fuel cladding since the 1960s due to their corrosion resistance, radiation response, fuel-cladding chemical interaction, good mechanical properties for extended periods which do not significantly penalize the overall nuclear reactor operation [see discussion in Ref. (Yamamoto et al., 2015)].
By studying an influence of alloying elements on properties in these alloys it was found that the higher Cr content in these alloys would be beneficial for corrosion resistance in the high temperature water reactors and also high-temperature steam oxidation resistance (Stott et al., 1995). At the same time higher Cr content would result in potential embrittlement of these alloys at operating temperatures in the interval 288°C–320°C due to the formation of Cr-rich α′-phase (Mathon et al., 2003; Kobayashi and Takasugi, 2010; Ejenstam et al., 2015). The higher Al content is beneficial for high-temperature steam oxidation resistance, but it may raise the ductile-brittle transition temperature (Qu et al., 2013). It was shown that more than six at% of Al addition would be effective in reducing the stability of α′ precipitates, a further Al addition results in increasing the solution limit of Cr in the matrix (Kobayashi and Takasugi, 2010; Li et al., 2013; Ejenstam et al., 2015).
Extensive studies of ternary Fe-Cr-Al alloys were started from 1960s for use in nuclear applications for a wide range of compositions experimentally and theoretically. Essential progress was in studying material properties in such systems was achieved by using different methods of multiscale modeling scheme. Among theoretically obtained results one can issue ab initio calculations of energetic parameters for atoms relocations (Kresse and Hafner, 1993; Kresse and Hafner, 1994; Kresse and Furthmüller, 1996), kinetic Monte Carlo simulations of the long-term microstructural stability of Fe-Cr-Al alloys (Ejenstam et al., 2015), molecular dynamics studying the dependence of elastic, bulk and shear moduli on alloy composition (Dai et al., 2022), classical phase field modeling precipitation kinetics [see for example, Refs. (Chen et al., 2019; Lee et al., 2020)]. A correlative theoretical and experimental research strategy has been developed in Ref. (Chang et al., 2019) to investigate the Fe-Cr-Al system, which includes an integration of ab initio calculations, CALPHAD, and experiments. The CALPHAD approach has been successfully applied to obtain phase diagrams at thermodynamic equilibrium by exploiting the Gibbs energy functions (Dinsdale, 1991). It serves as a powerful tool for component selection, composition design and optimization of materials for specific applications.
Recently successful progress in understanding microstructure transformation in Fe-Cr-Al systems separation kinetics of the nano-size α′-phase in Fe-Cr-Al alloys was achieved. At the same time some open questions related to study microstructure evolution of long aging time and predicting the mechanical properties of these alloys remain actual. Indeed, an influence of alloy composition and aging temperature onto volume fraction and the mean precipitate size affecting the hardness and embrittlement in Fe-Cr-Al alloys is still under discussion.
In this paper we describe properties of nano-size α′-phase precipitation in such ternary systems by considering a phase decomposition with local rearrangement of point defects. We exploit CALPHAD approach and take into account interaction of atomic subsystem with subsystem of defects. The derived model includes elastic anisotropy and can be used to study alloys with different content of doping. Main efforts are concentrated onto studying an influence of alloying elements onto kinetics of phase decomposition at different temperatures and statistical properties of growing α′ precipitates. In our approach we study dynamics of precipitate size, their number density and volume fraction of precipitates at thermal treatment of solid solution for alloys with different compositions. Our study provides an insight into the physics of phase decomposition which can be generalized next in studying radiation induced precipitation and precipitates dissolution with defects clustering.
The work is organized in the following manner. In Section 2 we describe formalism used in phase field modeling. Section 3 is devoted to stability analysis and discussion of numerical modeling results. Here the main dynamical laws for precipitate size and their number density are shown and analysis of phase decomposition kinetics at different content of alloying elements and annealing temperatures is provided. We conclude in Section 4.
2 Phase field model
We describe ternary systems Fe-Cr-Al with molar concentration of Fe, Cr and Al (coinciding with atomic ones) denoted as xμ = Nμ/N with μ = {Fe, Cr, Al}, where Nμ is the number of atoms of the sort μ, N is the total number of atoms, the mass conservation law is satisfied ∑μxμ = 1. Concentrations of point defects cd with d = {i, v} denotes interstitial (i) and vacancies (v) is defined in the same manner. We consider introduced quantities as continuous fields evolving in space r and time t: xμ = xμ(r, t), cd = cd (r, t). We introduce point defects as additional substances allowing us to distinguish atomic and point defects subsystems. These equilibrium defects do not contribute to mass conservation due to their small concentrations.
2.1 Gibbs energy for ternary system with defects and elastic anisotropy
The total Gibbs functional for the class of considered systems has the form:
where the term Gch relates to the chemical Gibbs energy depending on the concentrations of the alloy components and point defects; G∇ is a gradient energy part and the last term Gel corresponds to an elastic contribution; Vm is the molar volume; integration is taken over the whole volume V.
The free energy density Gch can be decomposed into two terms, describing atomic and defect subsystems as follows: Gch = GFe−Cr−Al + Gd. The molar Gibbs energy of the atomic subsystem GFe−Cr−Al is defined as:
By combining all above expressions, the total Gibbs energy for the ternary alloy Fe − Cr − Al with point defects takes the form:
The gradient term G∇ has the form:
The α − α′-interface can be considered as a semi-coherent due to small difference in lattice parameters of two main elements Fe and Cr, as usual (Ribis and Lozano-Perez, 2012). To make our description more general we consider the elastic contribution Gel in the Gibbs energy has the standard form
As was shown previously (Cahn, 1962; Onuki, 2002; Khachaturyan, 2013) in BCC metals/alloys the minimum free energy is along the soft direction ⟨100⟩. The contribution to elastic energy coming from the lattice mismatch takes the form (Cahn, 1961):
By using standard relations between stiffness components and elastic moduli one can write a contribution coming from elastic continuum as follows (Onuki, 2002):
where the stretching (Φ) and shear (Ψ) contributions are defined by
Here elementary strain components are: e1 = exx + eyy + ezz,
The component describing coupling between deformation and concentration has the form (Onuki, 2002):
where ∇i∇jw = ninjδxCr (r, t), ni denotes component of the interface normal n.
In our calculations we will follow approach developed by Onuki [see Ref. (Onuki, 2002) and citations therein] and results of molecular dynamics (Dai et al., 2022) and assume that all elastic constants depend on concentration of alloying elements:
By combining all above expressions, the elastic contribution Gel to the total Gibbs energy for the ternary alloy Fe − Cr − Al becomes the form:
In our approach we use concentration dependent stiffness constants K = K0 + K1xCr, μ2 = μ20 + μ21xCr, μ3 = μ30 + μ31xCr,
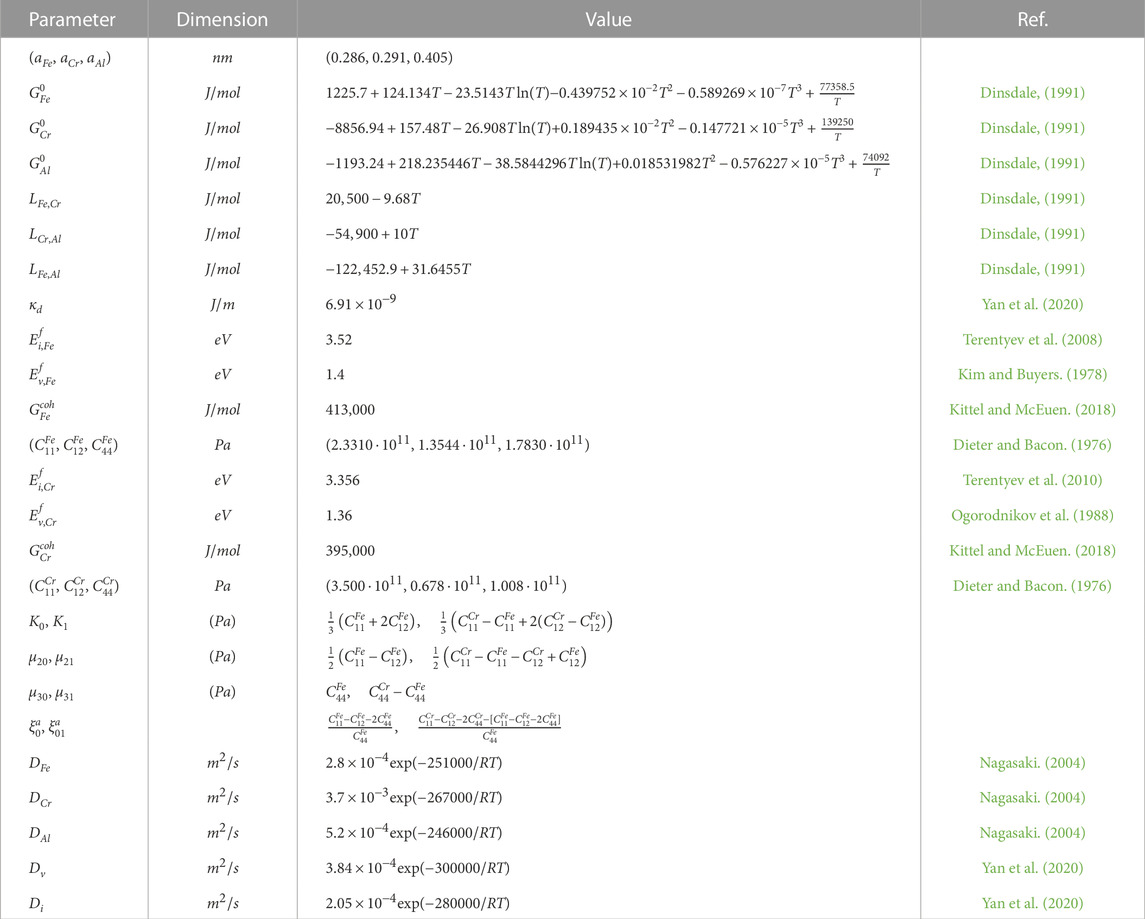
TABLE 1. Material parameters used in simulations.
2.2 Evolution equations
By taking into account the mass conservation law and defining the concentration of the Iron as the host element as: xFe = 1 − xCr − xAl dynamics of the complete system will be governed by the following equations of the Cahn-Hilliard type (Cahn, 1962; Hilliard, 1970):
Mobility coefficients MCr,Cr, MAl,Al and MCr,Al are as follows (Huang et al., 1995; Wu et al., 2001; Wu et al., 2004; Lee et al., 2020):
where MFe, MAl and MCr are the corresponding mobilities for pure elements, which are defined in the standard manner: Mμ = Dμ/RT, Dμ is the corresponding atomic diffusivity. The mobility for the ensembles of vacancies and interstitials we choose in the standard manner: Ld = Ddcd/RT, defined through the corresponding point defect diffusivity Dd. Here we use a simplified model for point defects mobilities.
In the Cahn-Hilliard-Cook equation Eq. 7 with a variable mobility Eq. 8, it is not convenient to accurately discretize the gradient operator and divergence operator by using the finite-difference method. However, the Fourier spectral method developed in Refs. (Chen and Shen, 1998; Zhu et al., 1999; Kim, 2007; Canuto et al., 2012; Biner, 2017) allows us to solve numerically Eq. 7 without much more difficulty than the case with a constant mobility. In the framework of the Fourier spectral method the system of coupled non-linear differential equations takes the form:
Here, xCr,Al (k, t), cv,i (k, t),
In further modeling, we use thermodynamic and elastic parameters characterizing ternary systems collected in Table 1.
3 Results and discussions
3.1 Stability diagram
In order to define ranges of concentrations of alloying additions Cr and Al and temperature, when phase decomposition is possible we exploit the linear stability analysis of a homogeneous state to inhomogeneous perturbations. According to obtained kinetic equations one can find phase diagram defining critical values of concentration of alloying elements at fixed temperatures shown in Figure 1. It follows that phase separation related to instability of the solid solution to inhomogeneous perturbations is possible at fixed range of Chromium and Aluminum concentrations. With the temperature growth the instability domain bounded by spinodal curves shrinks. Outside of the corresponding spinodal the system is stable to homogeneous perturbations. In this domains the solid solution is realized. It is clear from this diagram that in the case of high values of the annealing temperature (see, for example, the curve at T = 850 K), when precipitation is impossible in the binary Fe-Cr systems, the addition of Aluminum with a concentration
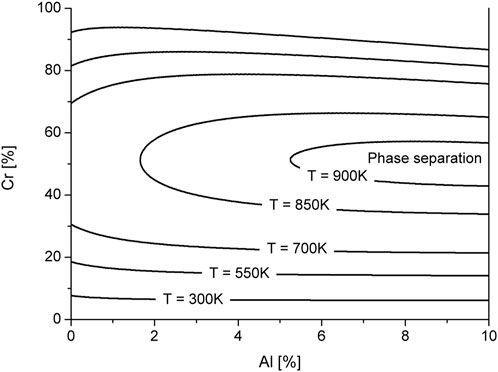
FIGURE 1. Phase diagram of the alloy Fe − Cr − Al at different values of the annealing temperature.
3.2 Numerical analysis
To study process of phase decomposition at annealing numerically we choose values of nominal concentration of two alloying elements and fix the annealing temperature according to stability diagram. We take solid solution as initial microstructure of the corresponding alloy with homogeneously distributed concentration fields of all components including point defects. As initial configurations we use:
According to provided stability analysis in order to study α′-phase precipitation next we consider alloy Fe − 30%Cr − 5%Al as a model system with annealing temperature T = 710 K. The main indicator of phase separation is the growth of the dispersion of the concentration field, determined in the standard way:
Typical scenario of phase decomposition is shown in Figure 2. Snapshots of the concentration field of Cr and Al are shown in Figure 2A at time instants related to markers indicated at protocols of effective order parameters in Figure 2B. Form Figure 2A it follows that after a certain incubation period (t < tc) domains enriched and depleted in the concentration of impurities emerge from the initial homogeneous distribution (solid solution). Thus, after 22 h of annealing, fine Chromium precipitates can be observed. At the same time, Aluminum is homogeneously distributed in the matrix (outside the precipitates). The number of precipitates and their size increase with time. During this nucleation stage, all formed precipitates are characterized by almost the same size. With further annealing one passes to the coarsening stage, where precipitates continue to grow and interact with each other: small precipitates dissolve, while large ones take material from the matrix and continue to grow following Ostwald ripening scenario. Detailed analysis of α′-phase precipitation can be seen from protocols of the order parameters shown in Figure 2B. One finds that after a certain incubation period dispersion of both xCr and xAl grow rapidly, meaning a passage to the nucleation stage. At the coarsening stage the growth rate of dispersions
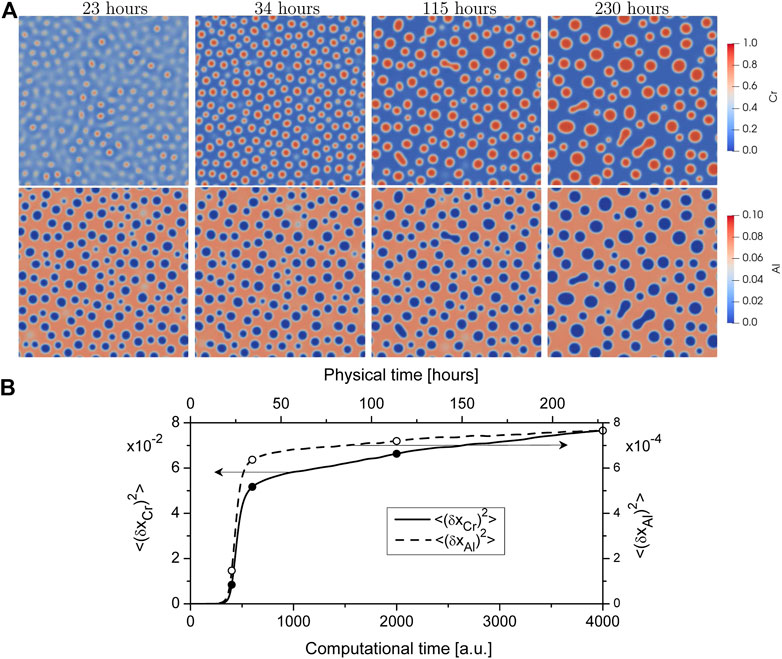
FIGURE 2. (color online) Snapshots of the microstructure evolution (A) and dynamics of the order parameters
Results of statistical analysis of precipitation are shown in Figure 3. Protocols for the Chromium concentration in the α′-phase and the volume fraction of precipitates are shown in Figure 3A. Both values grow rapidly after the incubation period tc at the nucleation stage whilst their slow growth is observed at coarsening stage. At the physical time of
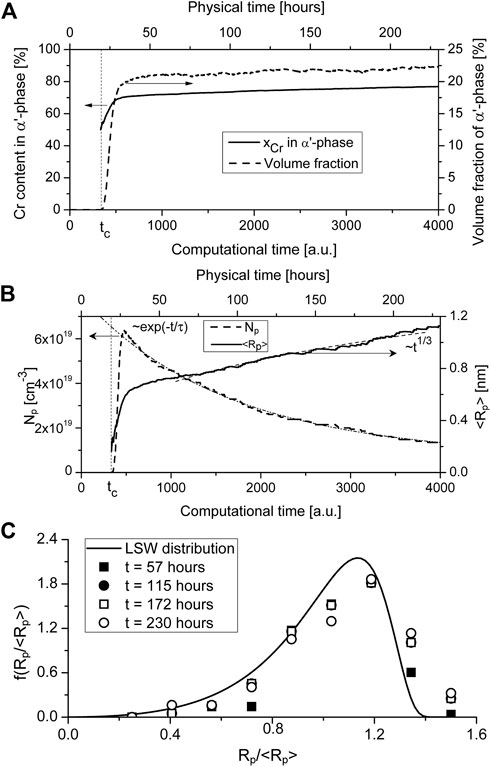
FIGURE 3. Evolution of (A) the Chromium concentration in the α′-phase and the volume fraction of the α′-phase precipitates and (B) the average size (radius) of the α′-phase precipitates and their number density; (C) distribution of α′-phase precipitates over size at different time instants during annealing of the solid solution Fe − 30%Cr − 5%Al at T = 710 K, solid line relates to LSW distribution.
Size distribution α′-phase precipitates f (Rp/⟨Rp⟩) is shown in Figure 3C at different time instants by markers. It can be seen that data obtained from the numerical experiment at different times relate to each other meaning an universality of the size distribution of precipitate sizes at the coarsening stage. The solid curve shows the classical universal LSW distribution (Lifshitz and Slyozov, 1961; Wagner, 1961). The obtained numerical data are in good agreement with the LSW distribution. Hence, LSW theory can be used to predicate particle size distribution in Fe-Cr-Al systems at thermal treatment.
Let us consider a behavior of defect subsystem during precipitation. From Figure 4A it follows that the dispersion of the vacancy concentration decreases with time, while the dispersion of the concentration of interstitials slowly increase after the decreasing. Spatial rearrangement of point defects is well seen from snapshots in Figure 4A (see insets). Here vacancies are quasi-homogeneously distributed in a bulk, while interstitials are mostly localized in small precipitates (Rp < ⟨Rp⟩) and near the phase interface in large precipitates (Rp > ⟨Rp⟩). Detailed information about defect distribution around precipitates can be found in profiles of alloying elements and defects shown in Figure 4B. Here one finds the following: the interstitial concentration is higher in precipitates compared to its value in the matrix phase; they are mostly localized at regions of precipitates with elevated curvature (see the snapshot of ci(r) in Figure 4A); vacancy concentration is locally increased around interfaces and has lower values in precipitates comparing to their values in matrix that relates to thermodynamics; α′-phase precipitates contain extremely small amount of Al atoms comparing to matrix phase.
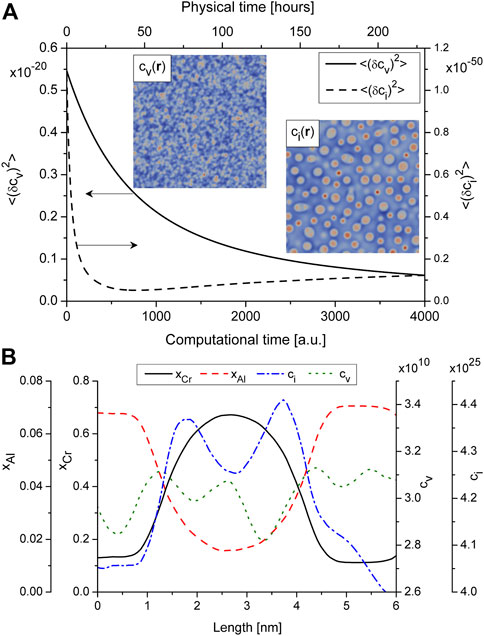
FIGURE 4. (A) (color online) Dynamics of the order parameters
By studying phase decomposition of alloys with different content of alloying elements and different temperatures one finds that an increase in one of the component can control time scale for precipitation kinetics. By studying α′-phase precipitation it was found that the incubation time tc for precipitation decreases with content of Cr and Al as is shown in Figures 5A, B. Here we denote critical value for concentration of alloying elements as
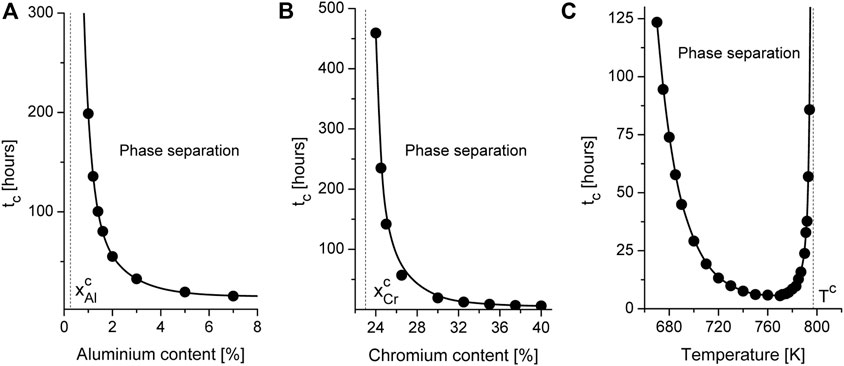
FIGURE 5. Dynamical diagram of phase decomposition at T = 710 K at fixed content of Cr
Effect of alloying elements and temperature influence onto dynamics of mean precipitate size, volume fraction of precipitates and precipitate size distribution is shown in Figure 6. In Figures 6A, B we plot the corresponding protocols in physical time scale according to the time related to phase decomposition starting from tc. From obtained results it follows that an increase Al content results in slight increase in precipitate size and volume fraction (cf. curves 1 and 2), whereas Cr addition increases the corresponding values of above quantities crucially (cf. curves 1 and 3). These results are related well to previous studies [see for example, Ref. (Lee et al., 2020)]. With the temperature decrease from 710 K down to 690 K (cf. curves 1 and 4) one gets low values of the mean precipitate size and low values for volume fraction of α’ precipitates that is constituent with results discussed in Ref. (Chen et al., 2019). Distributions over precipitate size in alloys with different content of Al and Cr and two different temperatures are shown in Figure 6C. One finds that obtained data are well predicted by classical LSW distribution. Therefore, it follows that additional introduction of Cr or Al does not change universality of precipitate size distribution at coarsening stage at different temperatures. By comparing dynamics of the precipitate size and precipitate size distributions in alloys with different content of doping one concludes that both dynamics of the system and statistical properties of growing precipitates remain universal. The difference in measured quantities (mean precipitate size, precipitate number density, precipitate volume fraction) is related mostly to scaling factors determined by nominal composition of the studied alloys.
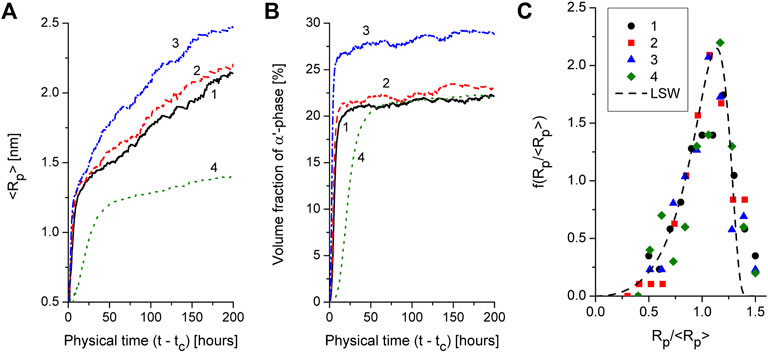
FIGURE 6. Protocols of the mean precipitate size (plot a) and volume fraction of α′-phase precipitates (plot b) at different content of Cr, Al and different temperatures: Line 1 — Fe-30%Cr-5%Al, T = 710 K, line 2 — Fe–30%Cr–7%Al, T = 710 K, line 3 — Fe–35%Cr–5%Al, T = 710 K, line 4 — Fe–30%Cr–5%Al, T = 690 K. Precipitate size distributions for different alloys and different temperatures (markers 1–4 relate to lines 1–4 in plots a and b) at coarsening stage (t − tc = 200 h), dash line relates to LSW distribution.
4 Discussions
We need to stress out that the used model for microstructure transformations in Fe-Cr-Al alloy is based on equilibrium CALPHAD free energy, however Aluminum and Chromium concentrations will be out of thermal equilibrium at cooling. Therefore, to describe more precisely free energy in metastable zone one should further incorporate corrections to the free energy related to non-equilibrium states. At the same time this generalization will not affect the final state related to equilibrium as was shown in previous studies (Chen et al., 2019; Lee et al., 2020).
In our study concentration-dependent model for stiffness constant was used for solid systems with cubic symmetry. Obtained results relate well to most of experimental observations. However, for more precise description of the system dynamics the measurement of the interface thickness obtained experimentally allows one to fix the corresponding values and thus the space scale.
For the considered class of concentrated alloys there is no formal theory for the mobilities exploited in the present study. Therefore here the model assumptions for concentration-dependent mobilities were used on the basis of previous works (Huang et al., 1995; Wu et al., 2001; Wu et al., 2004; Lee et al., 2020). This approach allows one to study transient dynamics of phase decomposition process in details, and can play a significant effect on the coarsening kinetics (Lacasta et al., 1992; Lacasta et al., 1993; Bray and Emmott, 1995; Zhu et al., 1999; Kharchenko and Dvornichenko, 2008; Kharchenko and Kharchenko, 2014; Kharchenko et al., 2022). A constant mobility model can be used in order to modeling the late time microstructure.
Nevertheless used in the present study assumptions and simplifications do not affect significantly the obtained results related well to most of experimental and theoretical predictions (Messoloras et al., 1984; Chen et al., 2019; Lee et al., 2020; Yang et al., 2020).
5 Conclusion
We have developed a phase field model to study dynamics of microstructure transformations and the evolution of defect structure during heat treatment of Fe-Cr-Al systems. Statistical and kinetic properties of evolving microstructure and defect structure in alloys with different content of alloying elements and different temperatures were studied.
In the framework of the stability analysis we obtain a phase diagram illustrating the range of concentrations of Chromium/Aluminum and annealing temperature when phase separation in Fe-Cr-Al systems accompanied by α′-phase precipitation can be realized. We exploited numerical simulations to discuss dynamics of precipitates formation, their growth, evolution of their number densities, precipitate mean size, and point defects rearrangement at precipitation. It is shown that mean precipitate size grows according to the power-law, whereas precipitate number density manifests exponential decay at coarsening stage. Precipitate size distribution function is of universal character.
It is shown that addition of Aluminum up to 8% initiates phase decomposition decreasing the incubation time for development of concentration waves. It slightly increases the mean precipitate size and volume fraction of precipitates. An increase in the nominal concentration of Chromium from 24% up to 40% increases content of Cr inside precipitates and essentially increases precipitate size with their volume fraction and accelerates phase decomposition processes. Dynamics of growing precipitates and the corresponding distribution functions over precipitate size manifest universality with scaling factors depending on the nominal compositions of alloys.
It was found that the annealing at elevated temperatures results in a decrease in the precipitates number density and in an increase their size. It was found that at high and low temperatures, precipitation processes are slowed down compared to the case of moderate temperatures.
By studying kinetics of equilibrium point defects it was shown that during annealing of solid solution vacancies are mostly homogeneously distributed in a bulk, while interstitial atoms are mostly localized in small α′ precipitates and inside large precipitates near the interfaces with large curvature.
We expect that obtained results can be used to predict materials properties change at different content of alloying elements and will be useful as basic data for microstructure optimization of Fe-Cr-Al fuel cladding. Results can be used to describe radiation induced effects by incorporating ballistic mixing and dynamics of non-equilibrium defects produced by irradiation.
Data availability statement
The original contributions presented in the study are included in the article/supplementary material, further inquiries can be directed to the corresponding author.
Author contributions
LW: Conceptualization, validation. JQ: Funding acquisition, project administration, investigation. VK: Methodology, software development, simulation, writing—original draft. DK: Investigation, statistical analysis, writing—review and editing. OL: Resources, visualization, validation.
Funding
This work was supported by “National Key R&D Program of China,” project number 2018YFE0207400.
Conflict of interest
The authors declare that the research was conducted in the absence of any commercial or financial relationships that could be construed as a potential conflict of interest.
Publisher’s note
All claims expressed in this article are solely those of the authors and do not necessarily represent those of their affiliated organizations, or those of the publisher, the editors and the reviewers. Any product that may be evaluated in this article, or claim that may be made by its manufacturer, is not guaranteed or endorsed by the publisher.
References
Biner, S. B. (2017). Programming phase-field modeling. Switzerland: Springer International Publishing.
Bley, F. (1992). Neutron small-angle scattering study of unmixing in fe-cr alloys. Acta metallurgica materialia 40, 1505–1517. doi:10.1016/0956-7151(92)90094-u
Bray, A., and Emmott, C. (1995). Lifshitz-slyozov scaling for late-stage coarsening with an order-parameter-dependent mobility. Phys. Rev. B 52, R685–R688. doi:10.1103/physrevb.52.r685
Brenner, S., Miller, M., and Soffa, W. (1982). Spinodal decomposition of iron-32 at.% chromium at 470 c. Scr. Metall. 16, 831–836. doi:10.1016/0036-9748(82)90239-3
Cahn, J. W. (1961). On spinodal decomposition. Acta metall. 9, 795–801. doi:10.1016/0001-6160(61)90182-1
Cahn, J. W. (1962). On spinodal decomposition in cubic crystals. Acta metall. 10, 179–183. doi:10.1016/0001-6160(62)90114-1
Canuto, C., Hussaini, M. Y., Quarteroni, A., and Thomas, A. (2012). Spectral methods in fluid dynamics. Berlin, Heidelberg: Springer Science & Business Media.
Chang, K., Meng, F., Ge, F., Zhao, G., Du, S., and Huang, F. (2019). Theory-guided bottom-up design of the fecral alloys as accident tolerant fuel cladding materials. J. Nucl. Mater. 516, 63–72. doi:10.1016/j.jnucmat.2019.01.002
Chen, L. Q., and Shen, J. (1998). Applications of semi-implicit Fourier-spectral method to phase field equations. Comput. Phys. Commun. 108, 147–158. doi:10.1016/s0010-4655(97)00115-x
Chen, S., Li, Y., Shi, S., and Jin, S. (2019). Quantitative phase-field simulation of composition partition and separation kinetics of nanoscale phase in fe-cr-al alloy. J. Nanomater. 2019, 1–11. doi:10.1155/2019/6862390
Dai, H., Yu, M., Dong, Y., Setyawan, W., Gao, N., and Wang, X. (2022). Effect of cr and al on elastic constants of fecral alloys investigated by molecular dynamics method. Metals 12, 558. doi:10.3390/met12040558
Dinsdale, A. T. (1991). Sgte data for pure elements. Calphad 15, 317–425. doi:10.1016/0364-5916(91)90030-n
Ejenstam, J., Thuvander, M., Olsson, P., Rave, F., and Szakalos, P. (2015). Microstructural stability of fe–cr–al alloys at 450–550 c. J. Nucl. Mater. 457, 291–297. doi:10.1016/j.jnucmat.2014.11.101
García-Ojalvo, J., and Sancho, J. (2012). Noise in spatially extended systems. New York, NY: Springer Science & Business Media.
Gulbransen, E. A., and Andrew, K. F. (1959). Oxidation studies on the iron-chromium-aluminum heater alloys. J. Electrochem. Soc. 106, 294. doi:10.1149/1.2427333
Hilliard, J. E. (1970). Spinodal Decomposition, in Phase Transformations. American Society of Metals, Metals Park, 497.
Huang, C., de La Cruz, M. O., and Swift, B. (1995). Phase separation of ternary mixtures: Symmetric polymer blends. Macromolecules 28, 7996–8005. doi:10.1021/ma00128a005
Hyde, J., Miller, M., Hetherington, M., Cerezo, A., Smith, G., and Elliott, C. (1995). Spinodal decomposition in fe-cr alloys: Experimental study at the atomic level and comparison with computer models-ii. development of domain size and composition amplitude. Acta metallurgica materialia 43, 3403–3413. doi:10.1016/0956-7151(95)00041-s
Khachaturyan, A. G. (2013). Theory of structural transformations in solids. New York, NY: Dover Publications, Inc.,.
Kharchenko, D., and Dvornichenko, A. (2008). Phase separation in binary systems with internal multiplicative noise. Phys. A Stat. Mech. its Appl. 387, 5342–5354. doi:10.1016/j.physa.2008.05.041
Kharchenko, V. O., and Kharchenko, D. O. (2014). Abnormal grain growth in nonequilibrium systems: Effects of point defect patterning. Phys. Rev. E 89, 042133. doi:10.1103/physreve.89.042133
Kharchenko, V., Xin, T., Wu, L., Kharchenko, D., Kupriienko, V., and Shuda, I. (2022). Phase stability and precipitation modeling in neutron irradiated zr–2% nb alloy. Model. Simul. Mater. Sci. Eng. 30, 075006. doi:10.1088/1361-651x/ac8fad
Kim, J. (2007). A numerical method for the Cahn–Hilliard equation with a variable mobility. Commun. Nonlinear Sci. Numer. Simul. 12, 1560–1571. doi:10.1016/j.cnsns.2006.02.010
Kim, S., and Buyers, W. (1978). Vacancy formation energy in iron by positron annihilation. J. Phys. F Metal Phys. 8, L103–L108. doi:10.1088/0305-4608/8/5/001
Kittel, C., and McEuen, P. (2018). Introduction to solid state physics Global ed., 9th ed. New Jersey: Wiley, 692.
Kobayashi, S., and Takasugi, T. (2010). Mapping of 475 c embrittlement in ferritic fe–cr–al alloys. Scr. Mater. 63, 1104–1107. doi:10.1016/j.scriptamat.2010.08.015
Kresse, G., and Furthmüller, J. (1996). Efficient iterative schemes for ab initio total-energy calculations using a plane-wave basis set. Phys. Rev. B 54, 11169–11186. doi:10.1103/physrevb.54.11169
Kresse, G., and Hafner, J. (1993). Ab initio molecular dynamics for liquid metals. Phys. Rev. B 47, 558–561. doi:10.1103/physrevb.47.558
Kresse, G., and Hafner, J. (1994). Norm-conserving and ultrasoft pseudopotentials for first-row and transition elements. J. Phys. Condens. Matter 6, 8245–8257. doi:10.1088/0953-8984/6/40/015
Lacasta, A., Hernández-Machado, A., Sancho, J. M., and Toral, R. (1992). Domain growth in binary mixtures at low temperatures. Phys. Rev. B 45, 5276–5281. doi:10.1103/physrevb.45.5276
Lacasta, A., Sancho, J. M., Herna, A., and Toral, R. (1993). Effects of domain morphology in phase-separation dynamics at low temperature. Phys. Rev. B 48, 6854–6857. doi:10.1103/physrevb.48.6854
Lee, J., Park, K., and Chang, K. (2020). Effect of al concentration on the microstructural evolution of fe-cr-al systems: A phase-field approach. Metals 11, 4. doi:10.3390/met11010004
Li, W., Lu, S., Hu, Q. M., Mao, H., Johansson, B., and Vitos, L. (2013). The effect of al on the 475 c embrittlement of fe–cr alloys. Comput. Mater. Sci. 74, 101–106. doi:10.1016/j.commatsci.2013.03.021
Liang, L., Mei, Z. G., Kim, Y. S., Anitescu, M., and Yacout, A. M. (2018). Three-dimensional phase-field simulations of intragranular gas bubble evolution in irradiated u-mo fuel. Comput. Mater. Sci. 145, 86–95. doi:10.1016/j.commatsci.2017.12.061
Lifshitz, I. M., and Slyozov, V. V. (1961). The kinetics of precipitation from supersaturated solid solutions. J. Phys. Chem. solids 19, 35–50. doi:10.1016/0022-3697(61)90054-3
Mathon, M., De Carlan, Y., Geoffroy, G., Averty, X., Alamo, A., and De Novion, C. (2003). A sans investigation of the irradiation-enhanced α–α′ phases separation in 7–12 cr martensitic steels. J. Nucl. Mater. 312, 236–248. doi:10.1016/s0022-3115(02)01630-6
Messoloras, S., Pike, B., Stewart, R., and Windsor, C. (1984). Precipitation in iron–chromium–aluminium alloys. Metal Sci. 18, 311–321. doi:10.1179/030634584790419999
Ogorodnikov, V., Rakitskii, A., and Rogovoi, Y. I. (1988). Calculation of the vacancy formation energy of metals. Sov. Powder Metall. Mater. Ceram.(Engl. Transl.) 27, 55–60. doi:10.1007/bf00799739
Qu, H., Lang, Y., Yao, C., Chen, H., and Yang, C. (2013). The effect of heat treatment on recrystallized microstructure, precipitation and ductility of hot-rolled fe–cr–al–rem ferritic stainless steel sheets. Mater. Sci. Eng. A 562, 9–16. doi:10.1016/j.msea.2012.11.008
Ribis, J., and Lozano-Perez, S. (2012). Orientation relationships and interface structure of α′-cr nanoclusters embedded in α-fe matrix after α − −α′ demixing in neutron irradiated oxide dispersion strengthened material. Mater. Lett. 74, 143–146. doi:10.1016/j.matlet.2012.01.115
Soriano-Vargas, O., Avila-Davila, E. O., Lopez-Hirata, V. M., Cayetano-Castro, N., and Gonzalez-Velazquez, J. L. (2010). Effect of spinodal decomposition on the mechanical behavior of fe–cr alloys. Mater. Sci. Eng. A 527, 2910–2914. doi:10.1016/j.msea.2010.01.020
Stott, F., Wood, G., and Stringer, J. (1995). The influence of alloying elements on the development and maintenance of protective scales. Oxid. metals 44, 113–145. doi:10.1007/bf01046725
Terentyev, D., Hafez Haghighat, S., and Schäublin, R. (2010). Strengthening due to cr-rich precipitates in fe–cr alloys: Effect of temperature and precipitate composition. J. Appl. Phys. 107, 061806. doi:10.1063/1.3340522
Terentyev, D., Olsson, P., Klaver, T., and Malerba, L. (2008). On the migration and trapping of single self-interstitial atoms in dilute and concentrated fe–cr alloys: Atomistic study and comparison with resistivity recovery experiments. Comput. Mater. Sci. 43, 1183–1192. doi:10.1016/j.commatsci.2008.03.013
Wagner, C. (1961). Theorie der Alterung von Niederschlägen durch Umlösen (Ostwald-Reifung). Z. Elektrochem 65, 581–591. doi:10.1002/bbpc.19610650704
Was, G. S. (2016). Fundamentals of radiation materials science: Metals and alloys. Berlin, Heidelberg, New York: Springer.
Wu, K., Morral, J., and Wang, Y. (2001). A phase field study of microstructural changes due to the kirkendall effect in two-phase diffusion couples. Acta mater. 49, 3401–3408. doi:10.1016/s1359-6454(01)00257-9
Wu, K., Morral, J., and Wang, Y. (2004). Movement of kirkendall markers, second phase particles and the type 0 boundary in two-phase diffusion couple simulations. Acta mater. 52, 1917–1925. doi:10.1016/j.actamat.2003.12.031
Wukusick, C. S., and Collins, J. F. (1964). An iron-chromium-aluminum alloy containing yttrium. Mat. Res. std. 4 (1964), 637.
Yamamoto, Y., Pint, B., Terrani, K., Field, K., Yang, Y., and Snead, L. (2015). Development and property evaluation of nuclear grade wrought fecral fuel cladding for light water reactors. J. Nucl. Mater. 467, 703–716. doi:10.1016/j.jnucmat.2015.10.019
Yan, Z., Shi, S., Li, Y., Chen, J., and Maqbool, S. (2020). Vacancy and interstitial atom evolution with the separation of the nanoscale phase in fe–cr alloys: Phase-field simulations. Phys. Chem. Chem. Phys. 22, 3611–3619. doi:10.1039/c9cp06247e
Yang, Z., Wang, Z., Xia, C., Ouyang, M., Peng, J., Zhang, H., et al. (2020). Aluminum suppression of α precipitate in model fe–cr–al alloys during long-term aging at 475 c. Mater. Sci. Eng. A 772, 138714. doi:10.1016/j.msea.2019.138714
Keywords: phase-field modeling, phase decomposition, microstructure, precipitates, defects
Citation: Wu L, Qin J, Kharchenko VO, Kharchenko DO and Lysenko OB (2023) Phase field modeling microstructural evolution of Fe-Cr-Al systems at thermal treatment. Front. Energy Res. 11:1088742. doi: 10.3389/fenrg.2023.1088742
Received: 03 November 2022; Accepted: 18 January 2023;
Published: 27 January 2023.
Edited by:
Shichang Liu, North China Electric Power University, ChinaReviewed by:
David Simeone, Commissariat à l'Energie Atomique et aux Energies Alternatives (CEA), FranceYuexia Wang, Fudan University, China
Copyright © 2023 Wu, Qin, Kharchenko, Kharchenko and Lysenko. This is an open-access article distributed under the terms of the Creative Commons Attribution License (CC BY). The use, distribution or reproduction in other forums is permitted, provided the original author(s) and the copyright owner(s) are credited and that the original publication in this journal is cited, in accordance with accepted academic practice. No use, distribution or reproduction is permitted which does not comply with these terms.
*Correspondence: Vasyl O. Kharchenko , dmFzaWxpeUBpcGZjZW50ci5zdW15LnVh